
Abstract
To derive a calculation formula for the fundamental development length of glass fiber-reinforced polymer (GFRP) bars in unsaturated polyester resin concrete (UPC), a series of forty pull-out tests were conducted on GFRP bar-UPC specimens. Analyses were performed on failure modes, bond strength, and bond-slip curves, and the differential equation governing the GFRP bar-UPC bond-slip curve was then proposed and solved. Based on existing criteria and the differential equation solution of the bond-slip curve, two formulas for calculating the basic development length of GFRP bars in UPC were derived. The results indicate that the extraction of reinforcement bar is the predominant failure mode in the GFRP bar-UPC pull-out tests. Bond strength and bond length show a negative correlation relationship. When the bond length increases from 3 to 7 times the bar diameter (with a bar diameter of 10 mm), the bond strength decreases from 35.71 MPa to 26.61 MPa, representing a reduction of 25.48%. The bonding strength is positively correlated with the thickness of concrete cover. When the concrete cover thickness is 2.5, 3, and 3.5 times the bar diameter, bond strength is 29.14 MPa, 29.71 MPa, and 30.25 MPa, respectively. The bond-slip curve of GFRP bars in UPC consists of three sections: rising stage, decreasing stage, and residual stage. The rising section of the curve fits well with the MBPE model curve.
Keywords
Introduction
In complex service environments, corrosion of steel reinforcement can severely compromise the durability of reinforced concrete structures. Compared to steel bars, fiber-reinforced polymer (FRP) bars show advantages such as corrosion resistance, light weight, and high tensile strength, making them effective substitutes for steel in marine, water conservancy, civil engineering, and other fields.1,2 Among FRP bars, glass fiber-reinforced polymer (GFRP) bars are the most widely used due to their cost-effectiveness. Unsaturated polyester resin concrete (UPC) is characterized by high compressive strength, short curing time, and good corrosion resistance compared to ordinary concrete, making it widely used in structural repairs, pavement repairs, machine tool construction, and body engineering.3,4 The durability issues of reinforced concrete structural members in complex environments can be effectively addressed by using GFRP bars and UPC as common stress components. However, the key to their cooperative performance lies in the interface bond properties between GFRP bars and UPC.
Currently, extensive experimental research on the bond properties of FRP bars with conventional concrete has been conducted by researchers. Through pull-out tests5,6 and beam tests on FRP-reinforced concrete, 7 various experimental failure phenomena have been investigated. The effects of factors such as surface texture, FRP bar diameter, concrete strength, cover thickness, and development length on the bond properties of FRP-reinforced concrete have been analyzed to obtain the bond-slip curves.8–10 Based on these findings, bond-slip curve models for FRP bars with conventional concrete have been established. Malvar 11 first proposed a bond-slip curve model for GFRP bars and concrete. However, this model requires numerous fitting parameters and complex expressions with results significantly deviate from test results, limiting its current use. Combining the bond-slip characteristics of FRP-reinforced concrete, Cosenza et al. 12 proposed the MBPE model, which is characterized by its simplicity and fewer fitting parameters. The MBPE model divides the bond-slip curve into rising, falling, and residual sections. The rising section of the model aligns well with test results, while the falling and residual sections do not fit as accurately. Cosenza et al. 13 also introduced the CMR model, focusing solely on the rising section, which showed good agreement with experimental data. However, the CMR model does not consider the falling and residual sections, which is a significant limitation. To overcome the discontinuities and poor fitting in previous models, Gao et al. 14 developed a continuous curve model that fits experimental data well, though it is relatively complex in expression.
Following the establishment of bond-slip curve models, researchers also proposed formulas for calculating the basic development length of FRP bars based on test data and theoretical derivation. 15 On the other hand, the excellent corrosion resistance of FRP bars has also prompted investigations into their use with special concretes, especially the bond properties between FRP bars with various special concretes, including UHPC,16–18 seawater sand concrete,19,20 coral aggregate concrete, and21,22 recycled concrete. 23 However, research on the bond properties of GFRP bars with UPC remains limited, with only experimental analysis of steel bars and resin concrete available. 24 Currently, GFRP bars are widely utilized to reinforce UPC components across various projects. Both GFRP bars and UPC materials are resin-based composites that share several similar properties, such as outstanding corrosion resistance. The application of GFRP bars-reinforced UPC structures in hydraulic engineering can substantially enhance the durability of the structure. Moreover, incorporating GFRP bars and UPC materials into structures like electrolytic cells can significantly improve their resistance to chemical corrosion. As the application of GFRP bars and UPC increases in projects, understanding their bond properties and determining the basic development length have become increasingly critical.
In this study, a series of 40 pull-out tests were conducted on GFRP bars and UPC to investigate the effects of different development lengths on pull-out behavior and to analyze the resulting bond-slip curves. As a result, two formulas for calculating the basic development length of GFRP bars in UPC are proposed.
Bond properties test of GFRP bars and UPC
Test materials
Mixing ratios of UPC specimens.

The GFRP bars used in this test were manufactured by Shandong Safety Industries Co., Ltd. These bars are primarily composed of vinyl resin and alkali-free fibers, with a diameter of 10 mm. The ultimate tensile strength, elastic modulus, and elongation at break of the GFRP bars, as determined in the test, were 1016.10 MPa, 53.85 GPa, and 2.02%, respectively. The surface of the GFRP bars features helically wound ribs, characterized by a rib spacing of 9 mm, a rib width of 1 mm, and a rib depth of 0.5 mm, as depicted in Figure 1. Photo and diagram of GFRP bars for test. (a) Photo of GFRP bars. (b) Diagram of GFRP bars.
Preparation of test specimens
In this experiment, centrally drawn specimens were utilized to evaluate the bond strength between GFRP bars and UPC across five distinct bond lengths (3D, 4D, 5D, 6D, and 7D, where D represents the diameter of the bar). Additionally, the impact of varying protective layer thicknesses (2.5D, 3D, and 3.5D) on bond strength was investigated. For each configuration, five specimens were fabricated, resulting in a total of 40 specimens.
A 150 mm × 150 mm × 150 mm detachable plastic mold was used to prepare the test specimens. The specific steps for preparing the specimens are as follows: 1. Apply a release agent inside the mold, cut the GFRP bar to fit through the mold opening, and select a suitable length of PVC pipe to place on one side of the GFRP bar. Use hot melt adhesive to seal the GFRP bar and PVC pipe to prevent UPC from entering the PVC pipe and affecting the test results. 2. Seal the mold holes with hot melt glue to prevent resin leakage during UPC production and curing. Pour the stirred UPC into the mold, vibrate it thoroughly on a vibrating table, and remove the mold after 24 h of natural curing. 3. To prevent the GFRP bars from becoming pinched during testing, the GFRP bars are anchored on the loading side with high-strength grouting material and steel pipe. After 3 days of maintenance, the preparation of test specimens is completed. The final specimen is shown in Figure 2. Schematic diagram of GFRP bar-UPC bonding test specimen.

Experimental test
The pull-out tests were conducted using a WAW-1000 D electro-hydraulic servo universal testing machine. The upper and lower chucks of the machine were used to secure the test apparatus, with the loading end of the specimen fixed on the side with the steel pipe. Two dial gauges were employed to measure the displacement of the bars at the free end and within the concrete, as illustrated in Figure 3. Among these, one dial indicator is mounted at the unloaded end of the GFRP bars to measure its deformation within the bonding section and beyond. Another dial indicator is positioned at the UPC to quantify the deformation caused by the UPC. The difference between the readings of the two dial indicators corresponds to the relative slip value between the GFRP bars and the UPC. According to CSA S807:19,
26
the loading rate was set at 1 mm/min, and the test was concluded when any of the following phenomena occurred: local pull cracks in the bars, UPC splitting, pull-off of the bars and UPC, or relative slip of up to 20 mm at the free end and UPC. Loading method.
Test results and analysis
In the pull-out test, 40 GFRP bars and UPC specimens were tested, and all specimens exhibited a failure mode in which the bar was pulled out of the UPC, as shown in Figure 4. The damaged specimens were split along the red dotted line in Figure 4(a). It can be observed that the ribs on the surface of the GFRP bar in the bond section were seriously worn, exposing the internal fibers, and the UPC was coated with a significant amount of GFRP bar residue, as shown in Figure 4(b). Failure mode of specimens. (a) Comparison of specimens before and after loading. (b) The interface between GFRP bar and UPC after loading.
Bond strength of GFRP bars and UPC
In this study, it was assumed that stress was evenly distributed in the bond section, and bond strength was calculated using equation (1). The results are illustrated in Figure 5. Bond strength of GFRP bars and UPC. (a)The bond strength with different bond lengths. (b) The bond strength with different concrete cover thicknesses.

Figure 5(a) indicates that the bond strength of GFRP bars and UPC decreases as bond length increases. When the bond length is 3 to 7 times the bar diameter, the bond strength decreases from 35.71 MPa to 26.61 MPa, with a decrease of 25.48%. Larger bond length causes more uneven distribution of bond stress, which is the primary reason for this decline. This suggests that bond length is a critical factor affecting bond strength. Figure 5(b) shows that when the thickness of the concrete cover is 2.5, 3, and 3.5 times the bar diameter, the bond strength is 29.14 MPa, 29.71 MPa, and 30.25 MPa, respectively, with increases of 1.96% and 1.82% observed for the latter two cases compared to the former. Increasing the thickness of the concrete cover can improve the bond strength of GFRP bars and UPC; this is because the oblique pressure generated by the extrusion of ribbed GFRP bars and UPC is balanced by the tensile stress of UPC around the GFRP bars. As the thickness of the concrete cover increases, the force transmission path of the radial component is extended, thereby improving bond strength. In this test, the thickness of the concrete cover has little influence on bond strength, mainly due to the good tensile strength of UPC. A cover thickness of 2.5 times the bar diameter is sufficient to prevent UPC splitting, which is consistent with the pull-out failure results for all bar specimens.
Bond slip curve of GFRP bars and UPC
The relationship between bond stress and relative slip for GFRP bars and UPC under different anchorage lengths is illustrated in Figure 6. Bond-slip curve of GFRP bar-UPC at different bond lengths.
As shown in Figure 6, the bond-slip curve of GFRP bars and UPC can be divided into three distinct sections: 1. Rising stage During the initial loading stage of the test, the relative slip between the GFRP bars and UPC is nearly zero, while the bond strength increases rapidly, causing the slope of the curve to approach infinity. When the applied load exceeds the chemical bond force, the bond strength increases more slowly, relative slip between the GFRP bars and UPC begins to occur, and the slope of the curve decreases. Bond stress in this stage is primarily composed of adhesive forces and oblique forces generated by the mutual extrusion of GFRP bars and UPC, which can be influenced by factors such as the friction coefficient between GFRP bars and UPC, UPC shrinkage, GFRP rib strength, and concrete shear strength. 2. Decreasing stage When the ribs of the GFRP bars break, the mechanical bite force decreases rapidly, resulting in a sharp decrease in bond strength, while the relative slip between the GFRP bars and UPC increases significantly. In this stage, the failure mode for all specimens in this test is shear failure of the GFRP ribs, which is mainly attributed to the shallow rib depth of the selected GFRP bars and the high shear strength of the UPC. 3. Residual stage In this stage, bond stress is primarily caused by the frictional resistance between the damaged surface of the GFRP bars and the UPC. As relative slip increases, bond stress in the residual stage begins to exhibit a sinusoidal decay curve and eventually stabilizes at a certain value.
Comparative analysis of bond slip test curve of GFRP bars and UPC and MBPE model curve
The MBPE model is advantageous due to its simple form and minimal requirement for fitting parameters. However, the reduction of the decreasing stage and residual stage to a straight line does not align with the test results. Despite this, the model is widely used in engineering practice because only the rising section is considered when calculating anchorage length. The bond-slip curve of GFRP bars and concrete described by the MBPE model is shown in Figure 7. MBPE model.
The bond-slip curve in MBPE model is expressed as follows:


The area under the rising section curve A1 is expressed as follows:

The area under the decreasing section curve A2 is expressed as follows:
The bond-slip curve of GFRP bars and UPC, obtained from specimens with an anchorage length of 50 mm in this test, was compared with the MBPE model curve. As shown in Figure 8, the rising section of the bond-slip curve for the GFRP bars and UPC closely aligns with the MBPE model curve. Comparison between GFRP bar-UPC bond-slip test curve and MBPE model curve.
Calculation method of basic development length of GFRP bars and UPC
Calculation method of basic development length of GFRP bars and UPC based on current standards
Currently, the bond properties of GFRP bars and concrete are mainly described and calculated according to standards including ACI 440.1-R-15 of the United States, 27 CSA S806-12 of Canada, 28 JSCE 1997 of Japan, and 29 GB/T 50608-2020 of China. 30 The guidelines in these standards are based on test data from GFRP bars and conventional concrete, and it is necessary to verify whether they are applicable to GFRP bars and UPC.
This study proposes a method for calculating the bond strength and basic development length of GFRP bars and UPC, based on an analysis of the methods outlined in these standards and the results of this test.
The bond strength of GFRP bars and concrete in ACI 440.1-R-15 is calculated as follows: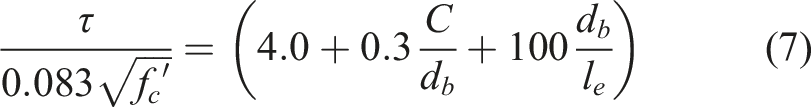
CSA S806-12 stipulates that the bond strength of GFRP bars and concrete is calculated according to the following formula:
In JSCE 1997, bond strength of the GFRP bars and concrete is calculated as follows:


Based on the static equilibrium of the anchoring section described in GB/T 50608-2020, as shown in Figure 9, the formula for calculating the anchorage length of GFRP bars is obtained as Equation (13), where the derivation process incorporates the proportional relationship between bond strength and concrete tensile strength. Stress analysis of anchoring section.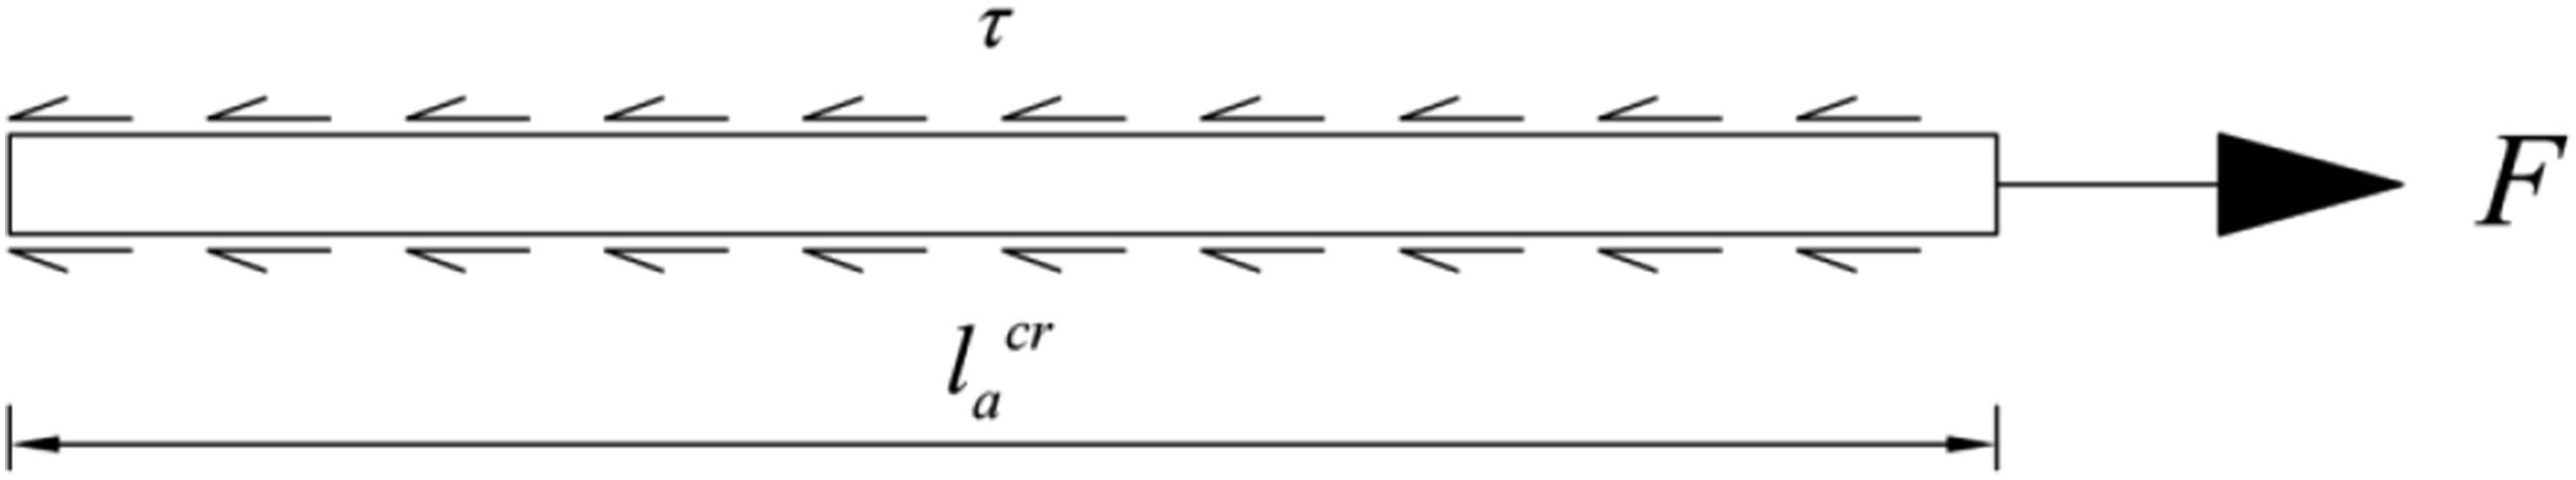
The static equilibrium equation for the anchoring section is as follows:

Comparison of test and calculated values of GFRP bar—UPC bond strength.

Please note that the numbers in parentheses represent the standard deviations of the test data.
The data in Table 2 indicate that the bond strength calculated according to current standards is lower than the bond strength of GFRP bars and UPC obtained from the tests. All the test results exhibit pull-out failure, and the thickness of the concrete cover has little influence on bond strength. Based on these findings, this paper assumes that the bond strength of GFRP bars and UPC is primarily related to the relative bond length Fitting of GFRP bar-UPC bond strength.

The calculation results from the fitting formula are also compared with the test data and presented in Table 2. Compared with the calculation results from the standard formula, those from the fitting formula are more consistent with the test data. As shown in equation (14), when the bond length is sufficiently long, the bond strength stabilizes at 4.33
Calculation method of basic development length of GFRP bars and UPC based on differential solution of bond-slip curve model
Differential equation of bond-slip of GFRP bars and UPC
The bond position of the pull-out specimens for GFRP bars and UPC is treated as a micro unit, with the stress distribution shown in Figure 11. Stress distribution of microelements and GFRP bars of GFRP bars-UPC pull-out specimens. (a) Stress distribution of microcells. (b) Stress distribution of GFRP bars in microcells.
Based on the mechanical model in Figure 11, the differential equation for bond-slip of GFRP bars and UPC is derived through the following steps: 1. List the equilibrium differential equation The equilibrium differential equation for the overall micro units is as follows: The equilibrium differential equation for the micro units of GFRP bars is as follows: 2. The bond-slip amount 3. Find the first-order derivative function of equation (18), list the Hooke’s law formulas for GFRP bars and UPC, respectively, and substitute them into the first derivative of equation (18). The process is as follows: 4. Find the first-order derivative function of equation (21), and the differential equation for bond-slip of GFRP bars and UPC can be obtained by combining equations (16), (17), and (21). 5. Order


Solution of differential equation for the bond-slip of GFRP bars and UPC
As mentioned in section 2.3, the test curve of the bond-slip of GFRP bars and UPC in the rising section aligns well with the MBPE model. Based on this, the expression for the rising section of the MBPE model is substituted into equation (23), and the differential equation is solved considering the boundary conditions. The relationship between the relative slip and bond length of GFRP bars and UPC can be described as equation (24).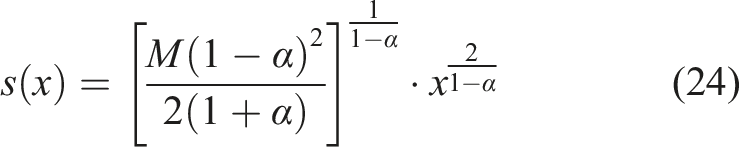
Then find the second-order derivative of equation (24) and substitute it into equation (23). Then the relationship between bond stress and bond length can be expressed as equation (25).
Equation (17) is then substituted into equation (25) for the integral solution. The resulting relationship between GFRP bar stress and bond length is as follows:

The limit value 
The relationship between 

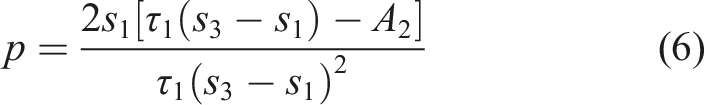
By substituting equation (29) into equation (30), equation (31) is obtained as shown below.
The basic development length of GFRP bars and UPC can be determined by adjusting the limit of bond length, taking into account the bar position and the thickness of the concrete cover, as follows:
Taking the test results of test specimen L5D-C7D in this paper as an example, the basic development length of GFRP bars and UPC is calculated. For GFRP bars in the test,
Conclusions
In this paper, the bond properties of GFRP bars and UPC were studied through pull-out tests, and the calculation formula for the basic development length of GFRP bars in UPC was derived using two methods. The main research conclusions are summarized as follows: 1. The failure modes of all GFRP bar and UPC specimens in the pull-out tests are characterized by bar pull-out failure. The bonding strength between GFRP bars and UPC is negatively correlated with bond length and positively correlated with concrete cover thickness. The effect of bond length on bond strength is significantly greater than that of concrete cover thickness. 2. The bond-slip curve of GFRP bars and UPC can be divided into three sections: rising stage, decreasing stage, and residual stage, with the rising section of the curve fits well with the MBPE model curve. 3. Current standards, including ACI 440.1-R-15, CSA S806-12, and JSCE 1997, tend to be conservative in evaluating the bond strength of GFRP bars in UPC, which is mainly due to the superior mechanical properties of UPC. A bond strength formula for GFRP bars in UPC was developed by combining the test data. The formula for calculating the basic development length of GFRP bars in UPC based on the standard method is proposed. 4. Based on a force analysis of micro units at the GFRP bar-UPC bond interface, a bond-slip differential equation for GFRP bars in UPC has been established. The differential equation is solved using the expression of the rising section in the MBPE model, and the limiting value of the bond length is corrected accordingly. Finally, a calculation formula for the basic development length, based on the solution of the bond-slip differential equation, is proposed.
Footnotes
Acknowledgments
The authors would like to express their sincere gratitude to the Youth Fund of the Shandong Natural Science Foundation (Project No. ZR2022QE212) and the Key Research and Development Program of Shandong Province (Project No. 2024TSGC0668) for their generous financial support.
Funding
The authors disclosed receipt of the following financial support for the research, authorship, and/or publication of this article: This research was supported by Youth Foundation of the Natural Science Foundation of Shandong Province (Grant No. ZR2022QE212), the Key Research and Development Program of Shandong Province (Project No. 2024TSGC0668), and the Doctoral Fund of Shandong Provincial Natural Science Foundation (Grant No. ZR201709260244).
Declaration of conflicting interests
The authors declared no potential conflicts of interest with respect to the research, authorship, and/or publication of this article.