
Abstract
Carbon fiber reinforced polymer (CFRP), known for their high strength, low density, and excellent corrosion resistance, are widely used in industries such as aerospace, automotive, and wind energy. In recent years, with the growing demand for lightweight solutions in the amusement ride industry, CFRP has gradually been used in non-primary load-bearing components. The lap bar, as a critical component used to secure passengers, has become a primary focus for lightweight design. This paper presents a preliminary study on failure analysis of a composite lap bar using acoustic emission (AE) and machine learning. The main purpose is to analyze the suitability of the prepared composite lap bar in a operational conditions using a classification model. The main challenge, however, is to be able to extract valid descriptors of the damage mechanism from the acquired AE signals. The damage modes of the basic units of the composite lap bar were first characterized individually and information of Hilbert marginal energy spectrum (HMES) about the AE signal associated with each damage mechanism was collected. These spectral features and parameters were then correlated and that is used as a dataset to train the model based on k-nearest neighbor (KNN) algorithm. The model achieved an accuracy of 92% through cross-validation. Then a destructive test was conducted on the composite lap bar, and the failure process was monitored using the AE technique. The acquired AE signals were identified by the classification model. This analysis provides information on the damage process of composite lap bar at different loading stages, with matrix cracking being the more common damage mechanisms. Additionally, the microanalysis of the fracture surface also verified the effectiveness of the classification model. Meanwhile, supervised machine learning shows its potential in handling multi-dimensional data.
Keywords
Introduction
Carbon fiber reinforced polymer (CFRP) has evolved rapidly over the past few decades and have made a profound influence on the industrial sector. CFRP has replaced some of the traditional materials used in industries such as aerospace, 1 wind power, 2 automotive manufacturing, 3 and amusement ride manufacturing. 4 For large-scale amusement rides, the safety lap bar is one of the most commonly used and highly reliable passenger restraint systems. Typical safety lap bars are typically constructed from stainless steel, mild steel, and other metallic alloys. This results in a significant increase in its weight and affects the stability of braking and traction control. In addition, the metal lap bar and the covering foam are designed to be a tight-fitting, non-removable structure, making internal corrosion difficult to detect. Therefore, there is an urgent need to introduce advanced materials to improve the performance of the safety bar and reduce its structural weight. CFRP is becoming more and more popular due to its excellent lightweight properties, high specific strength, and high specific stiffness relative to metallic materials. However, current research focuses on laminated specimens. Mechanical tests such as three-point bending tests, 5 tensile tests, 6 and Double Cantilever Beam (DCB) tests 7 have been conducted on composite laminated specimens. By contrast, composite structures are seldom tested to investigate the failure process. The development of composite structures and the investigation of damage evolution have not yet reached their full potential. There is increasing interest in developing composite structures that balance mechanical properties with manufacturing costs, as well as in elucidating failure modes to provide a theoretical foundation for strengthening these structures.
The acoustic emission (AE) technique as a passive non-destructive testing method has shown satisfactory results in real-time monitoring of laminated specimens and structures. 8 AE describes the phenomenon of transient elastic waves emitted locally by a material due to the rapid release of energy. Specifically, AE signals include sudden and continuous signal types, based on the characteristics of different types of signals, AE technique has already shown desirable results in pipeline leakage detection, 9 gear fault diagnosis, 10 AE source localization 11 and damage pattern recognition of composite. 12 In addition, the AE technique is a valuable tool for damage assessment of composite materials. Different types of damage such as matrix cracking, delamination, fiber breakage, and so on, may inevitably occur in composite structures during service with time and load. AE signals generated by various damage mechanisms display distinct characteristics, and to differentiate the features of various damage modes, researchers have extensively investigated the time-domain and frequency-domain parameters of AE signals associated with these damage patterns. In addition, cumulative AE parameters such as the cumulative number of hits and cumulative energy are also effective indicators of the damage process.
Clustering methods for joint multi-parameter analysis are currently widely used for composite damage pattern recognition. 13 AE signals associated with the same damage pattern often exhibit similar characteristics, while signals from different damage sources display significant differences in their features. Therefore, it is important to measure the similarity of individual AE events. At present, unsupervised machine learning algorithms based on different principle such as k-means, 14 k-means++, 15 Self-Organizing Map (SOM), 16 Fuzzy c-means (FCM) 17 are used to recognize features of different damage patterns. With the increasing research on machine learning, supervised learning methods are also gradually being used to recognize damage patterns. Supervised learning does not rely on the characteristics of the data itself rather it requires a dataset that includes parameters and labels. It is worth mentioning that the quality of the model depends heavily on how the training set is constructed as well as its accuracy. For now, Support Vector Machine (SVM) 18 and k-nearest neighbor (KNN) 12 methods have been successfully used for composite damage pattern recognition based on AE technique. However, the collected AE parameters are susceptible to attenuation and acoustic wave propagation paths, and different damage mechanisms interact with each other. These factors introduce some uncertainty in the results obtained by parametric analysis alone.
AE raw waveform analysis provides more interesting information relative to parametric analysis. In order to reduce the uncertainty of parametric analysis, it is an effective method to extract the frequency-domain descriptors of AE signals. Signal processing methods such as fast Fourier transform (FFT), 19 short-time Fourier (STFT), 20 Wavelet transform (WT), 21 Wavelet Packet Transform (WPT), 7 and Hilbert-Huang Transform (HHT) 22 have shown strong applicability in extracting frequency-domain descriptors of AE signals. Moreover, different methods have their own strengths and weaknesses. Specifically, the FFT allows the computation of peak frequency and centroid frequency information. However, the FFT has a serious shortcoming, that is, the results it gives represent the overall frequency distribution of the signal, and it is difficult to better represent the time-varying characteristics of the signal. The emergence of STFT overcomes the limitation of conventional Fourier transforms, which able to provide simultaneous time and frequency information. Specifically, the decomposition of the entire time-domain process into numerous equal-length segments, each of which is approximately smooth, and then the Fourier transform is carried out. However, the width of the window is difficult to determine, making it confusing to select the optimal time-frequency resolution.
The core principle of the Wavelet Transform (WT) involves using a finite-length wavelet basis with decaying properties to capture both frequency components and to pinpoint events in time. However, the decomposition process tends to overlook the high-frequency characteristic information. WPT considers both high-frequency and low-frequency characteristic information. It is worth noting that whether it is wavelet or wavelet packet decomposition, the choice of wavelet basis function directly affects the results. At present, the majority of researchers lack a systematic study of the wavelet basis function, and rely primarily on the empirical choice to analyze the signal characteristics further. 23 The HHT serves as a favorable tool for dealing with non-stationary signals by decomposing arbitrary signals into linear steady-state signals via Empirical Mode Decomposition (EMD). After decomposition, each Intrinsic Mode Function (IMF) represents the oscillatory variations in different frequency bands of the original signal, reflecting the local characteristics of the signal, while the final residual component reflects the number of slow changes in the signal. However, the EMD approach has certain drawbacks, including end effects, mode mixing, and the empirical nature of the decomposition. These drawbacks will directly affect the quality of the decomposition. Undoubtedly, the HHT is fundamentally distinct from the WT and WPT due to its highly self-adaptive nature, and there is no need to prepare wavelet basis functions in advance. The possibility that WT and WPT produce dissimilar results using different wavelet basis functions is effectively reduced by employing the HHT. In summary, the current study faces pressing issues regarding the preparation of composite structures with excellent performance and the effective and accurate identification of AE signals generated during the loading of these structures.
In this paper, waveform analysis and supervised machine learning algorithms have been combined to understand the damage process of the composite lap bar. Specifically, AE signals associated with different damage modes were collected by carrying out three-point bending tests on the basic specimen (a laminated specimen with the same configuration as the composite lap bar). The AE signals were identified by using the proposed quantitative damage pattern discrimination method based on Hilbert marginal energy spectrum (HMES). A KNN-based classifier was developed by correlating feature parameters and damage patterns using energy characterization as a medium. Subsequently, the destructive experiment was carried out on the prepared composite lap bar and monitored in real time using the AE technique. By combining AE signal analysis with microanalysis of the fracture surface, the damage behavior of composite lap joints under various loads was investigated, and the suitability of composite lap joints for low-speed indoor amusement facilities was further assessed. Figure 1 illustrates the flowchart for this study. Flow chart of overall process.
Experimental procedure and methods
Specimen preparation
In order to investigate the applicability of the prepared new composite lap bar, as well as its damage process, first attention was paid to the composite laminated specimens with the same configuration. The basic specimen, prepared from a carbon fiber laminate, was cut from a composite material constructed with 40 layers of carbon fiber plain fabric (12 k, 300 g/m2), arranged in a [± 45] sequence, and impregnated with a mixture of epoxy resin (SWANCOR 2511-1A) and curing agent (SWANCOR 2511-1B). Basic specimen with dimensions of 150 mm × 30 mm × 6 mm. The composite lap bar consists of two carbon fiber lever arms and a carbon fiber tube. Initially, the carbon fiber tube is equipped with metal pins at both ends to facilitate the installation and removal of the lever arm. The metal pins and carbon fiber tube are bonded with epoxy resin during the molding process, and they are subsequently secured with screws and nuts. The lever arm is molded from carbon fiber prepreg. Metal connectors are inserted at both ends of the lever arm, one end is connected to the carbon fiber rod and the other end to the test stand. The metal pin is inserted into the lever arm, and its surface is encased in carbon fiber. The layup method and thickness of the carbon fiber portion used for both the carbon fiber tube and the lever arm are consistent with the basic specimen. Notably, the weight of the composite lap bar is approximately two-thirds lighter than that of traditional metal materials.
Three-point bending test for basic specimens
Given the high cost of destructive testing for the lap bar, a three-point bending test under AE detection was initially conducted on the prepared basic specimens. The support span of the three-point bending test was 96 mm and two AE sensors, named VS900-RIC, were fixed with tape at a distance of 30 mm from the ends of the specimen. The silicone grease was uniformly applied to the surfaces where the sensors were in contact with the specimen, and the purpose of the silicone grease was to avoid the influence of reverberant signals. The specimen was then placed on the electronic universal testing machine (LD26) and the transducer was properly connected to the AE instrument (DS2-8A). Since the AE sensor has a built-in 34 dB amplifier, no additional amplifiers are required to capture weak electrical signals. Considering the thickness of the basic specimen and the generation of a large number of AE signals at the later stage of the test, the loading rate was set to 1 mm/min. The built-in parameters of the AE instrument include the values of peak definition time (PDT), hit definition time (HDT), and hit lock out time (HLT), were set to 30 μs, 150 μs, and 300 μs, respectively. The threshold and sampling rate were set to 5 mV and 1 MHz, respectively, according to the previous study. The full-time domain AE raw data generated during loading were recorded separately for Specimen 1 (S1) and Specimen 2 (S2) to analyze the progression of damage throughout the loading process. Figure 2 shows the specimen and the experimental apparatus. AE instrument arrangement and failed specimen.
Mechanical test program for composite lap bar
Applied load to the composite lap bar at each stage.


Experimental setup, component arrangement, and sensors placement (a) experimental setup and sensor arrangement, (b) lever arm, and (c) tube.
Hilbert-Huang transform
A signal processing method named HHT was employed to analyze nonlinear and transient signals. HHT consists of two parts, one is called the EMD algorithm, and the other is a spectral analysis tool called Hilbert spectral analysis. The main purpose of EMD is to decompose a signal into a set of IMFs, and then to carry out the Hilbert transform on IMFs, which further enables the calculation of instantaneous frequency. The original signal can be expressed by equation (1).
The Hilbert amplitude spectrum 
The HMES 
The HMES can represent the global energy contribution of each frequency value. 24
The energy of an arbitrary frequency band 
K-nearest neighbor
The KNN algorithm is advantageous due to its simplicity and intuitiveness, requiring no training phase, and its adaptability as a non-parametric model that supports real-time data updates. It is particularly well-suited for small datasets and low-dimensional data, excelling in projects that demand rapid implementation and in pattern recognition tasks. The details of the algorithm include the neighbor K and how the distance is calculated. The main purpose is to constitute a multi-dimensional space from the multiple features of the sample of known labels. The process is briefly described below:
Step 1: Construct the training set

Step 2: Calculate the distance, for a given sample to be predicted or classified, calculate the distance between that sample and the sample points in the constructed feature space.
Step 3: Delineate the neighbors, find the K classified samples that are closest to the distance of the samples to be predicted or classified according to the set value of K and call these samples as nearest neighbors.
Step 4: Classification is performed by counting the number of occurrences of each label in the nearest neighbor samples and assigning the label with the highest number of occurrences to the predicted or classified sample.
Results and discussion
Pre-processing of AE signals
Initially, the characteristic parameters of the AE signals generated from the three-point bending tests in S1 and S2 were calculated, primarily including amplitude (A), counts (C), duration (D), energy (E), and rise time (RT). Besides, frequency-domain parameters named peak frequency (PF) and centroid frequency (CF) were also calculated using FFT. Due to the fact that high dimensional data are not favorable for computation and that some parameters are highly correlated, A, PF, and CF were chosen as typical parameters for the subsequent analysis.25–27 The A defined as the maximum voltage peak in the AE waveform. The PF is defined as the frequency corresponding to the maximum energy spectrum point of the AE waveform after FFT. The CF is defined as the frequency corresponding to half of the sum of the amplitudes corresponding to all the frequencies of the AE waveform after FFT, which can effectively reduce the interference of certain high-amplitude noises.
Figure 4 describes the joint distribution of different parameters of the AE signals generated from S1. It is obvious from Figure 4 that the signals are mainly distributed in the low amplitude region around 45 dB. The signal is also slightly distributed in the middle and high amplitude regions and decreases as the amplitude increases. The PF of the signal is mainly distributed in the low-frequency band, around 120 kHz, and slightly in the high-frequency band, around 300 kHz, however, it is rarely distributed in the mid-frequency band. The CF of the signal is mainly concentrated in the mid-frequency part, around 230 kHz, with an overall roughly normal distribution. The AE signal generated from S2 exhibit the same pattern, as illustrated in Figure 5. This observation further indicates improved reproducibility of the specimens. Distribution of AE signals generated during three-point bending of S1. Distribution of AE signals generated during three-point bending of S2.

Identification of damage patterns using HHT
Typically, for the laminated specimens and loading methods employed in this study, the macroscopic damage patterns can be summarized as matrix cracking, delamination, and fiber breakage.28–30 Over several years, researchers have experimentally verified the frequency bands of AE signals related to different damage patterns. For example, an acoustic event due to a matrix cracking will have a characteristic frequency range not exceeding 150 kHz. Acoustic events associated with delamination will have a characteristic frequency range of approximately 150–300 kHz. Additionally, acoustic events due to fiber breakage will exceed 300 kHz or 350 kHz.31–34 It is noteworthy, however, that the majority of these results are derived from FFT analysis and peak amplitude values. In recent years, several researchers have utilized HHT and WPT to demonstrate similar findings. To gain a comprehensive understanding of the AE signals linked to each damage pattern and to extract valid descriptors, the AE signals collected from the basic specimen during the three-point bending test were analyzed using HHT, and the results were presented as HMES. Given that HMES is a function of frequency and energy, extracting quantized features directly poses challenges. As the wavelet packet energy of the waveform can serve as a descriptor for damage patterns, the energy distribution of the HMES can likewise function as an effective descriptor of damage.
Since the analysis requires manual division of the frequency bands, first the width of the frequency band and the step size of the band shift need to be specified. In the previous analysis on wavelet packet analysis of AE signals from the composites, researchers mostly choose 62.5 kHz as the width of the frequency band.23,35,36 The frequency band obtained from WPT is directly determined by the sampling frequency and the number of decomposition layers. In contrast, the HHT-based HMES analysis is not directly limited by these two parameters. However, it is worth noting that the appropriate bandwidth range is chosen for reliable analysis results. An excessively wide bandwidth causes signals from different damage modes to display similar energy characteristics. Conversely, insufficient bandwidth increases computational burden and results in multiple energy characteristics for signals of different damage modes, complicating the determination of these modes. Therefore, for the convenience of calculation, 50 kHz was chosen. Secondly, one-tenth of the frequency band range was set as the step length, that is, 5 kHz. In detail, first calculate the energy on frequency band 1, which represents 0–50 kHz. Subsequently, the upper and lower limits of the frequency band are subsequently shifted by 5 kHz, with frequency band 2 representing 5–55 kHz. Until frequency band 91 is calculated, the range is 450–500 kHz, the analysis is finished. The relationship between the band label N and the band range is shown in equation (7).
The advantage of this method is that it allows both qualitative analysis of the frequency-domain characteristics of AE signals and provides quantitative guidelines for identifying AE signals associated with different damage modes. Furthermore, it provides an accurate and effective training set for the next step of damage pattern classification modeling.
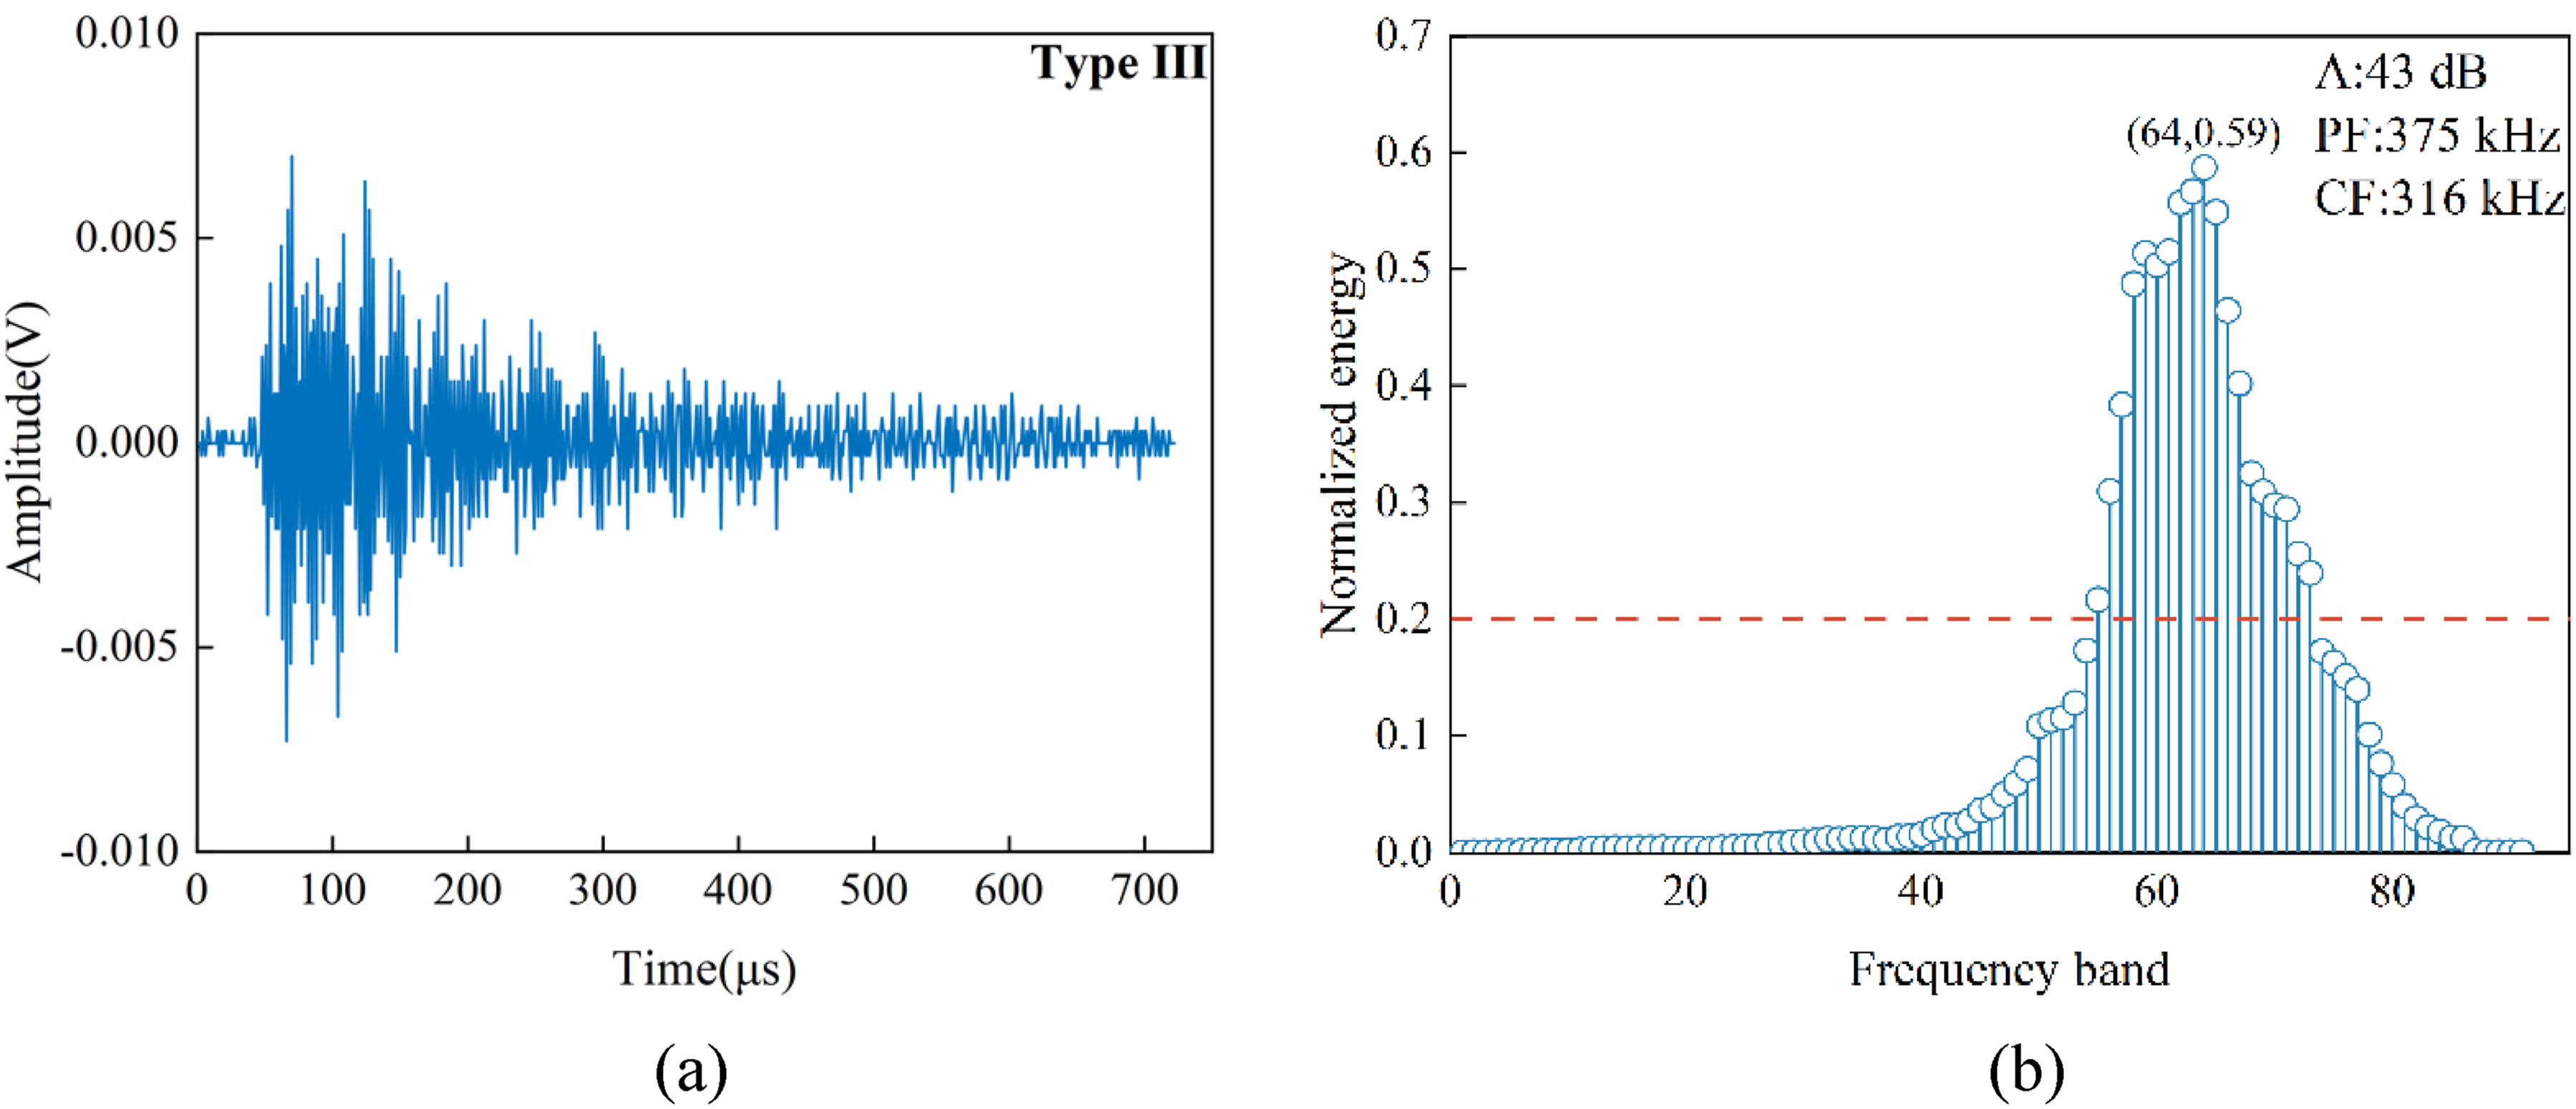
According to the distribution of the characteristic parameters, selected waveforms were analyzed using the proposed methodology. The HMES showed that eight types of signals were observed, the energy of these signals is mainly distributed in three frequency band ranges, which were frequency band 15–30, 45–60, and 61–76 respectively. In the three-point bending test, the three major macroscopic damage mechanisms of composite laminates, arranged in descending order of the dominant frequency of the associated AE signals, are fiber breakage, delamination, and matrix cracking.32,33,37 This establishes a basis for the subsequent classification of AE signals. As illustrated in Figures 6–8, distinguishing the characteristics of different signals solely from the time domain using original waveforms is challenging. However, damage patterns associated with different signals can be discerned by normalizing the energy and analyzing the energy trends in each frequency band. Obviously, signals Ⅰ, Ⅱ, and Ⅲ share a common characteristic, that is, the energy is concentrated in a single frequency band. It can be seen from Figure 6 that the energy of signal type Ⅰ is mainly concentrated in the low-frequency band (15–30) and the energy has a single trend over the band. It can also be seen from Figures 7 and 8 that the energy of signal type Ⅱ is concentrated in the middle frequency band (45–60), and the energy of signal type Ⅲ is concentrated in the high-frequency band (61–75). Similarly, their energy distribution patterns in the frequency domain are consistent with that of signal type Ⅰ. Thus, Figures 6–8 related to matrix cracking, delamination, and fiber breakage, respectively. Raw waveforms and normalized energy distributions of signal type Ⅰ (a) raw waveform and (b) normalized energy distribution. Raw waveforms and normalized energy distributions of signal type Ⅱ (a) raw waveform and (b) normalized energy distribution. Raw waveforms and normalized energy distributions of signal type Ⅲ (a) raw waveform and (b) normalized energy distribution.

However, some signals with other characteristics have also been observed. Two peaks are present in the normalized energy distribution map of some signals, but there is little difference between the peaks. The smaller peak is defined as a secondary energy signature. It should be emphasized that these types of models still rely on the main distribution of energy in characteristic frequency bands as the basis for classifying damage patterns. Figures 9 and 10 depicts the AE raw signal and energy distribution with two energy signatures. It can be clearly seen from Figure 9 that the energy is distributed not only in the low-frequency band but also in the mid-frequency band, and the difference in normalized energy, which distributed in frequency band 25 and 48 is about 0.1. Figure 10 depicts the energy distribution of signal type Ⅴ. It can be clearly seen that the energy is distributed not only in the low-frequency band but also in the high-frequency band, and the normalized energies differ by about 0.07. It can be conservatively stated that delamination and fiber breakage are often accompanied by matrix damage. Raw waveforms and normalized energy distributions of signal type Ⅳ (a) raw waveform and (b) normalized energy distribution. Raw waveforms and normalized energy distributions of signal type Ⅴ (a) raw waveform and (b) normalized energy distribution.

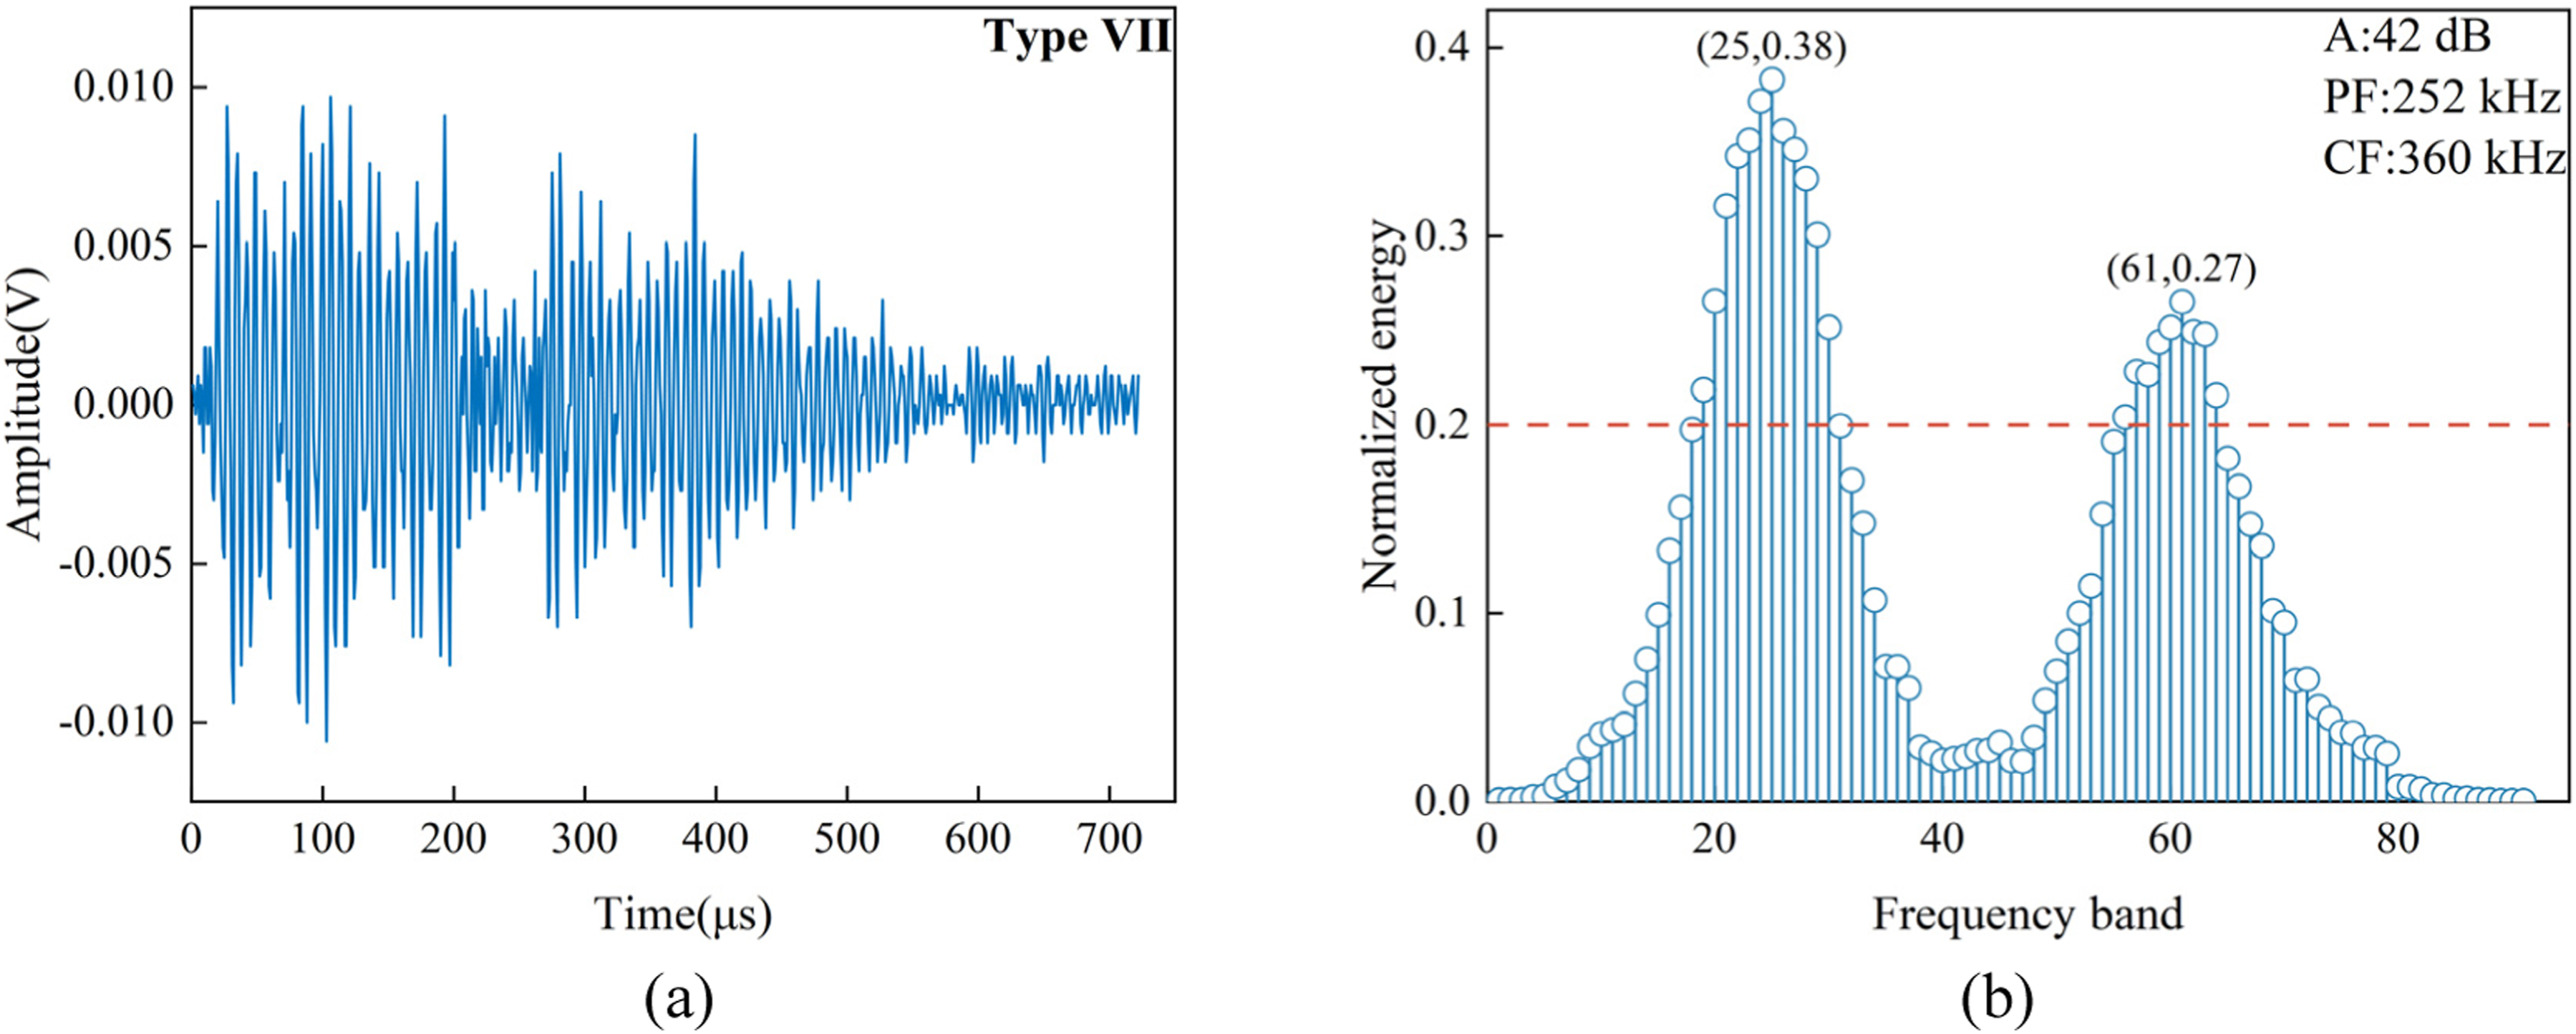
In addition to the aforementioned signals, there are also categories of signals that exhibit two peaks in the normalized energy distribution map. But what differs is that these signals have a broader energy distribution in the low-frequency range and relatively less energy distribution in the high-frequency range. As shown in Figure 11, the energy content of signal type Ⅵ in the low-frequency band is about 0.03 higher than that in the mid-frequency band, while Figure 12 indicates that the energy content of signal type Ⅶ in the low-frequency band is about 0.11 higher than that in the high-frequency band. Nevertheless, relying solely on the frequency band with the highest energy content as a basis for diagnosing the fault mode could neglect the implications of more severe damage, given that the signals also exhibit characteristics of severe damage. Therefore, to ensure the safety of the component, these signals are classified as more severe damage modes, specifically delamination or fiber breakage. Raw waveforms and normalized energy distributions of signal type Ⅵ (a) raw waveform and (b) normalized energy distribution. Raw waveforms and normalized energy distributions of signal type Ⅶ (a) raw waveform and (b) normalized energy distribution.
Besides, in the middle and late stages of the test, signal type Ⅷ was also been observed. During the middle and late stages of testing, numerous AE events occurred abruptly as damage accumulated within the specimen. As a result, superimposed signals associated with multiple damage patterns may be captured by the sensor at the same time. As shown in Figure 13, the signals are uniformly distributed in the three frequency bands with similar normalized energy. These signals exhibit superimposed features of matrix cracking, delamination and fiber breakage. Therefore, considering the safety of the component, these signals are associated with fiber breakage. Raw waveforms and normalized energy distributions of signal type Ⅷ (a) raw waveform and (b) normalized energy distribution.
In summary, in the presence of a single energy feature, signals with energy concentration in the frequency band of 15–30 are associated with matrix cracking, signals with energy concentration in frequency band of 45–60 are associated with delamination, and signals with energy concentration in the frequency band of 61–76 are associated with fiber breakage. If the energy signature is ambiguous, the signal should be categorized as a more severe damage pattern.
Construction of classification model
The KNN algorithm was employed to construct the classification model in this study. A critical aspect of constructing a classification model is the preparation of an appropriate training set. Due to the fact that the AE instrument used in this study is characterized by full-time domain signal acquisition, the original waveforms of the AE events are relatively difficult to intercept. Therefore, the HMES was used as a medium to correlate the parameters with the damage modes. The training set consists of parameters and labels. The A, PF, and CF were selected for the training parameters, and the labels were set to 1, 2, and 3 to represent the three damage modes of matrix cracking, delamination, and fiber breakage, respectively. The AE signals of different damage modes were intercepted from any loading stage of S1 and S2, respectively, to ensure that the signals were representative of the overall signal distribution. With the energy signature calculation method described above, the AE signals were correlated with known damage modes and the A, PF, and CF were recorded. From these, 300 waveforms with significant energy characteristics, 100 for each damage modes, were finally selected as the training set.
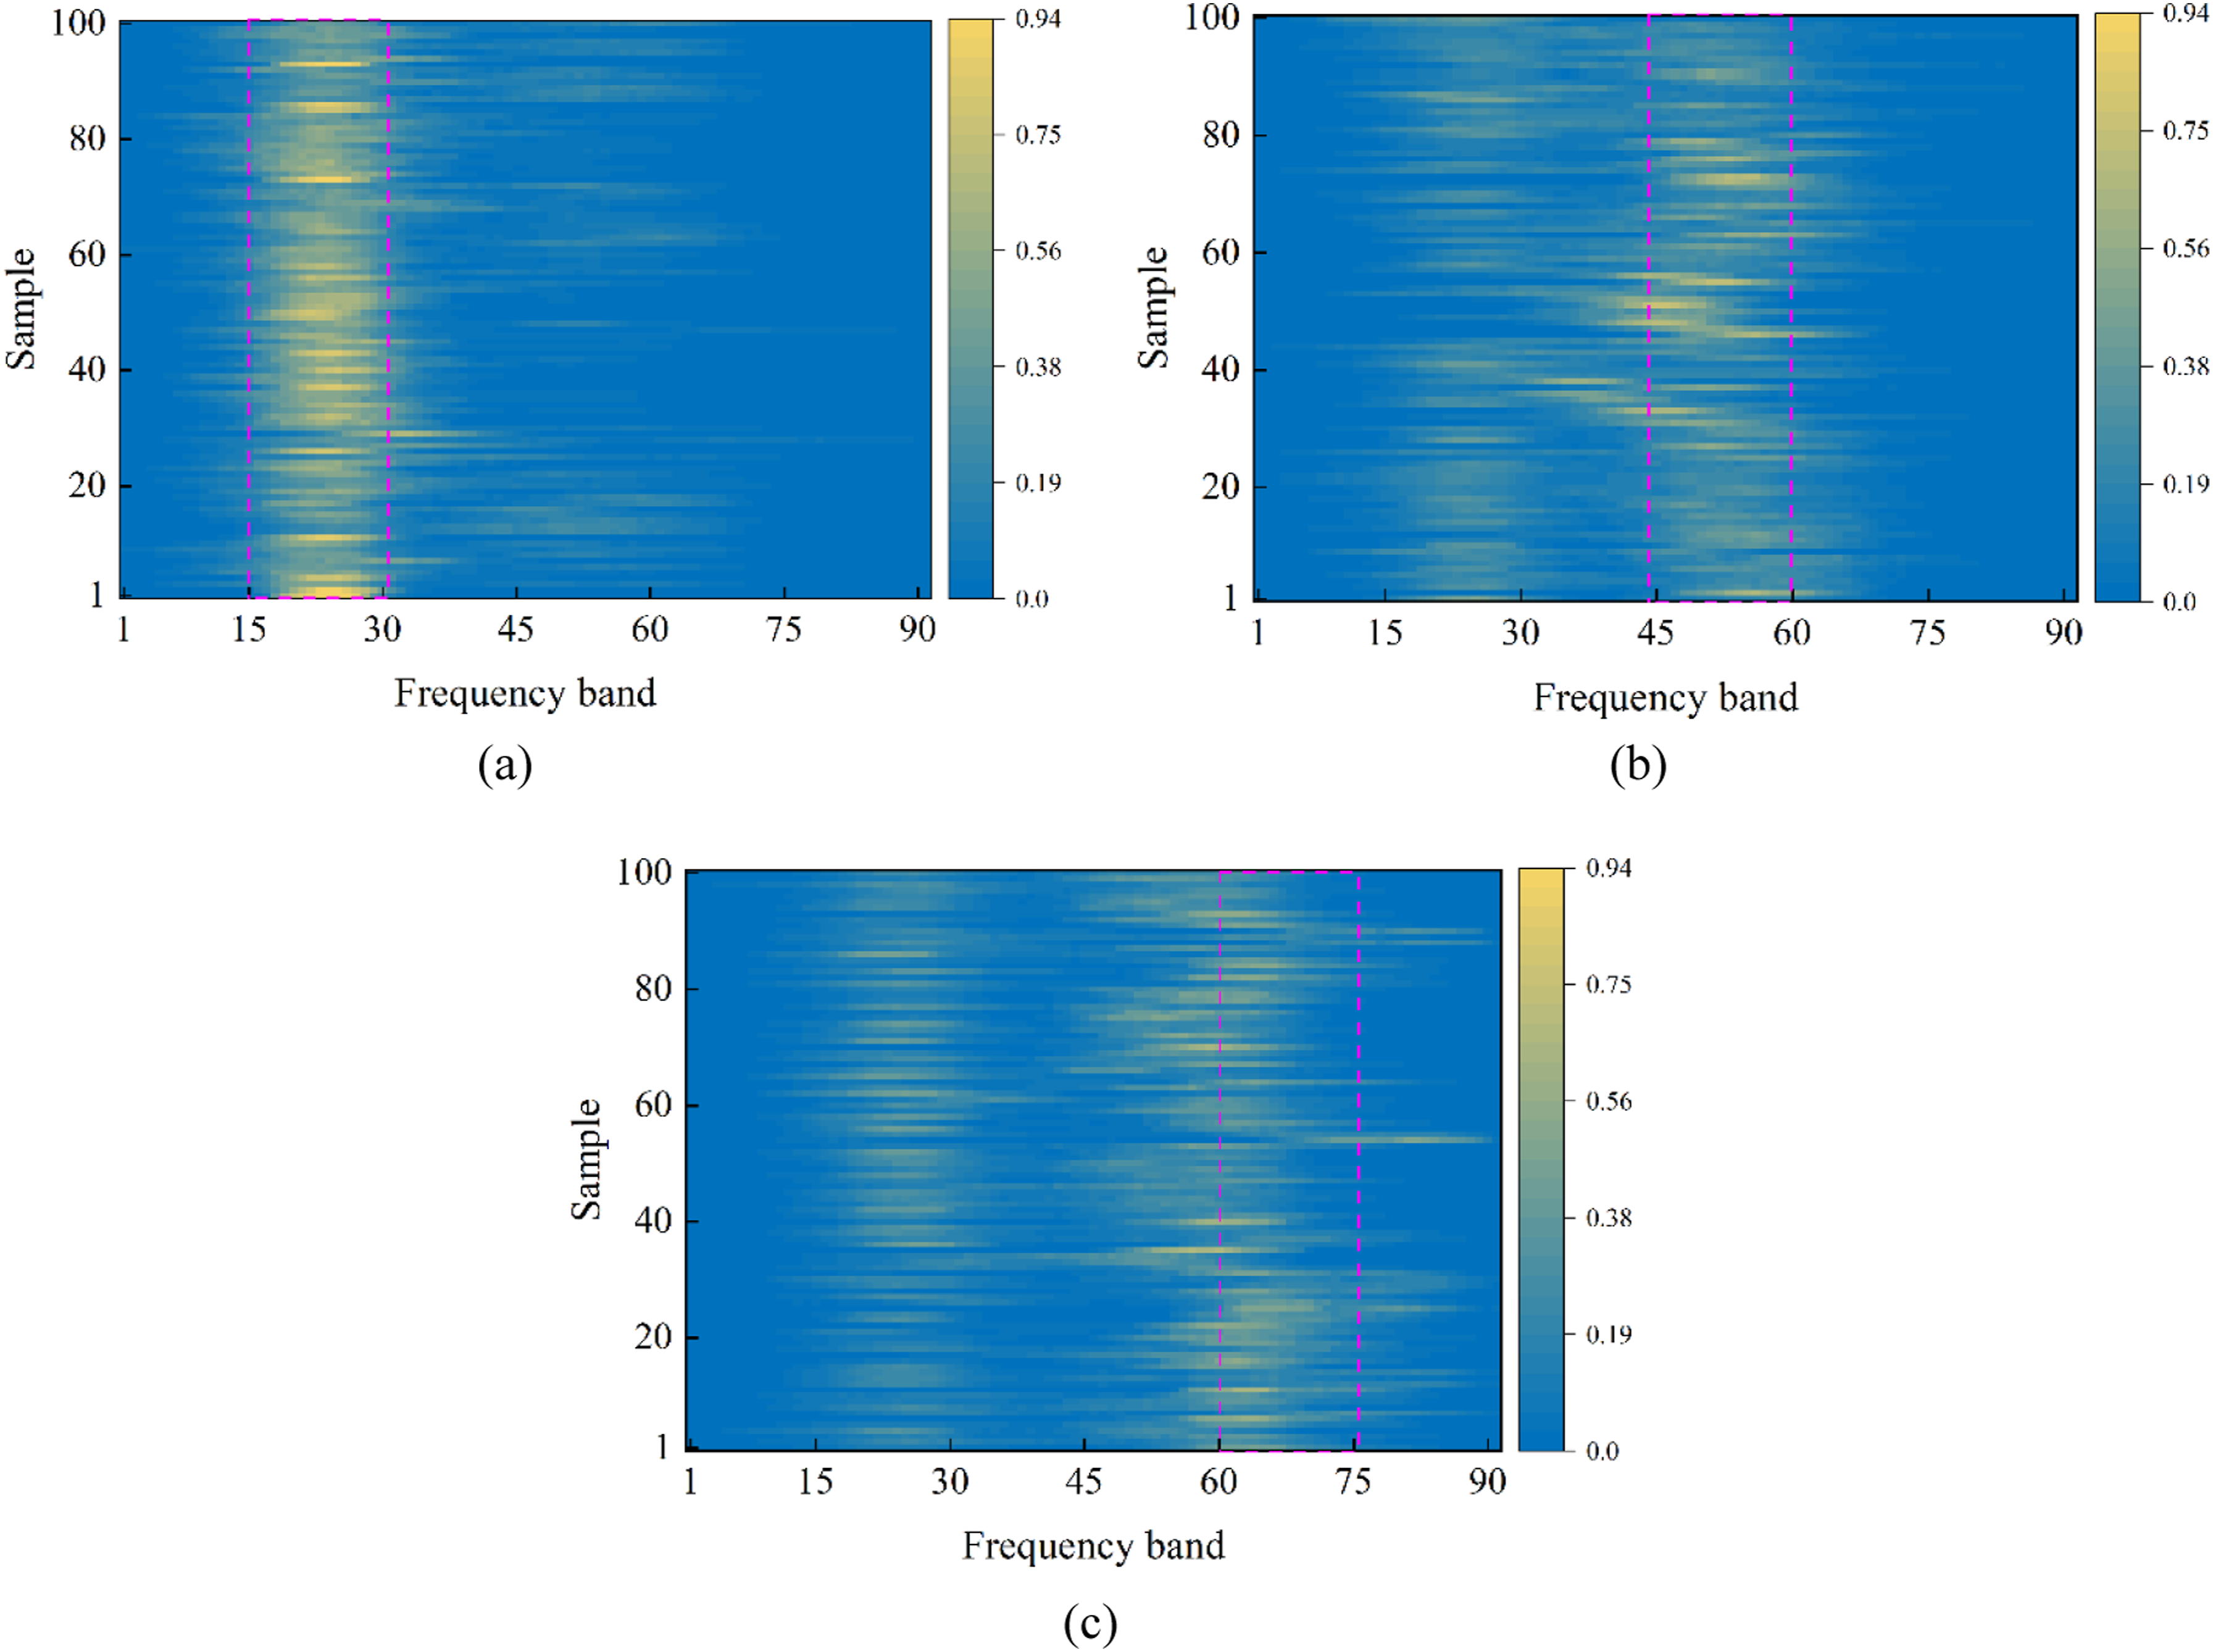
Figure 14 illustrates the distribution of characteristic parameters and CL1, CL2, and CL3 represent the AE signals associated with matrix cracking, delamination, and fiber breakage, respectively. It can be seen from Figure 14(a) that the amplitude distributions of AE signals related to different damage modes has the same area. In contrast, it is clear from Figure 14(b) and (c) that the frequency-domain characteristic parameters of the AE signals associated with the three damage modes are concentrated in distinct ranges. Figure 15(a) illustrates the energy distribution corresponding to signals associated with matrix cracking. Most signals exhibit a distinct energy signature that is predominantly concentrated in the low-frequency range and evenly distributed. Figure 15(b) depicts the energy characteristics of the signals associated with delamination. Obviously, it should be noted that a considerable amount of the signals exhibit energy distribution not only in the mid-frequency bands but also in the low-frequency bands. Figure 15(c) depicts the energy distribution of signals related to fiber breakage. The signal parameters are predominantly distributed in the high-frequency range, with energy characteristics similar to those of signals associated with delamination, which also exhibit a minor presence in the low-frequency band. In summary, the AE signals associated with the three damage modes have relatively uniform parameter distributions. The energy distribution indicates that the majority of the signal energy is distributed across multiple frequency bands, but there is a clear predominant frequency band, as shown in the red box in Figure 15. Distribution of characteristic parameters of the training set (a) distribution of the A from AE signals associated with each damage mode, (b) distribution of the PF from AE signals associated with each damage mode, and (c) distribution of the CF from AE signals associated with each damage mode. Visualization of energy characteristics of the training set (a) visualization of the energy distribution of CL1, (b) visualization of the energy distribution of CL2, and (c) visualization of the energy distribution of CL3.
The method of calculating the distance between vectors and the choice of the number of neighbors are also required to be specified before training the model. The former affects the similarity of vectors in different spaces and the latter represents the range of vector similarity comparison. The choice of these two parameters affects not only the computational accuracy but also the computation time. Figure 16 depicts the model accuracy of three commonly used distance metrics with the number of neighbors from 1 to 10. It can be seen that the accuracy of the classification model using Euclidean Distance and Manhattan Distance does not differ much, while Cosine Distance performs worse than the other two metrics. In addition, Figure 16 also indicates that the combination of Manhattan Distance and 9 neighbors provides the highest rate of correctness. Therefore, Manhattan Distance is chosen and the number of neighbors was selected to be 9. The confusion matrix was used as an effective indicator for evaluating the performance of the model. Figure 17 presents the confusion matrix derived from the 10-fold cross-validation. Accuracy, sensitivity, specificity, and F1 score were calculated based on the confusion matrix, and the results are summarized in Table 2. In summary, the classification accuracy reaches 92% in distinguishing signals associated with the three damage patterns, effectively meeting the requirements for damage pattern recognition. Effect of distance calculation method and number of neighbors on precision. Confusion matrix to distinguish matrix cracking, delamination, and fiber breakage. Ten-fold cross-validation.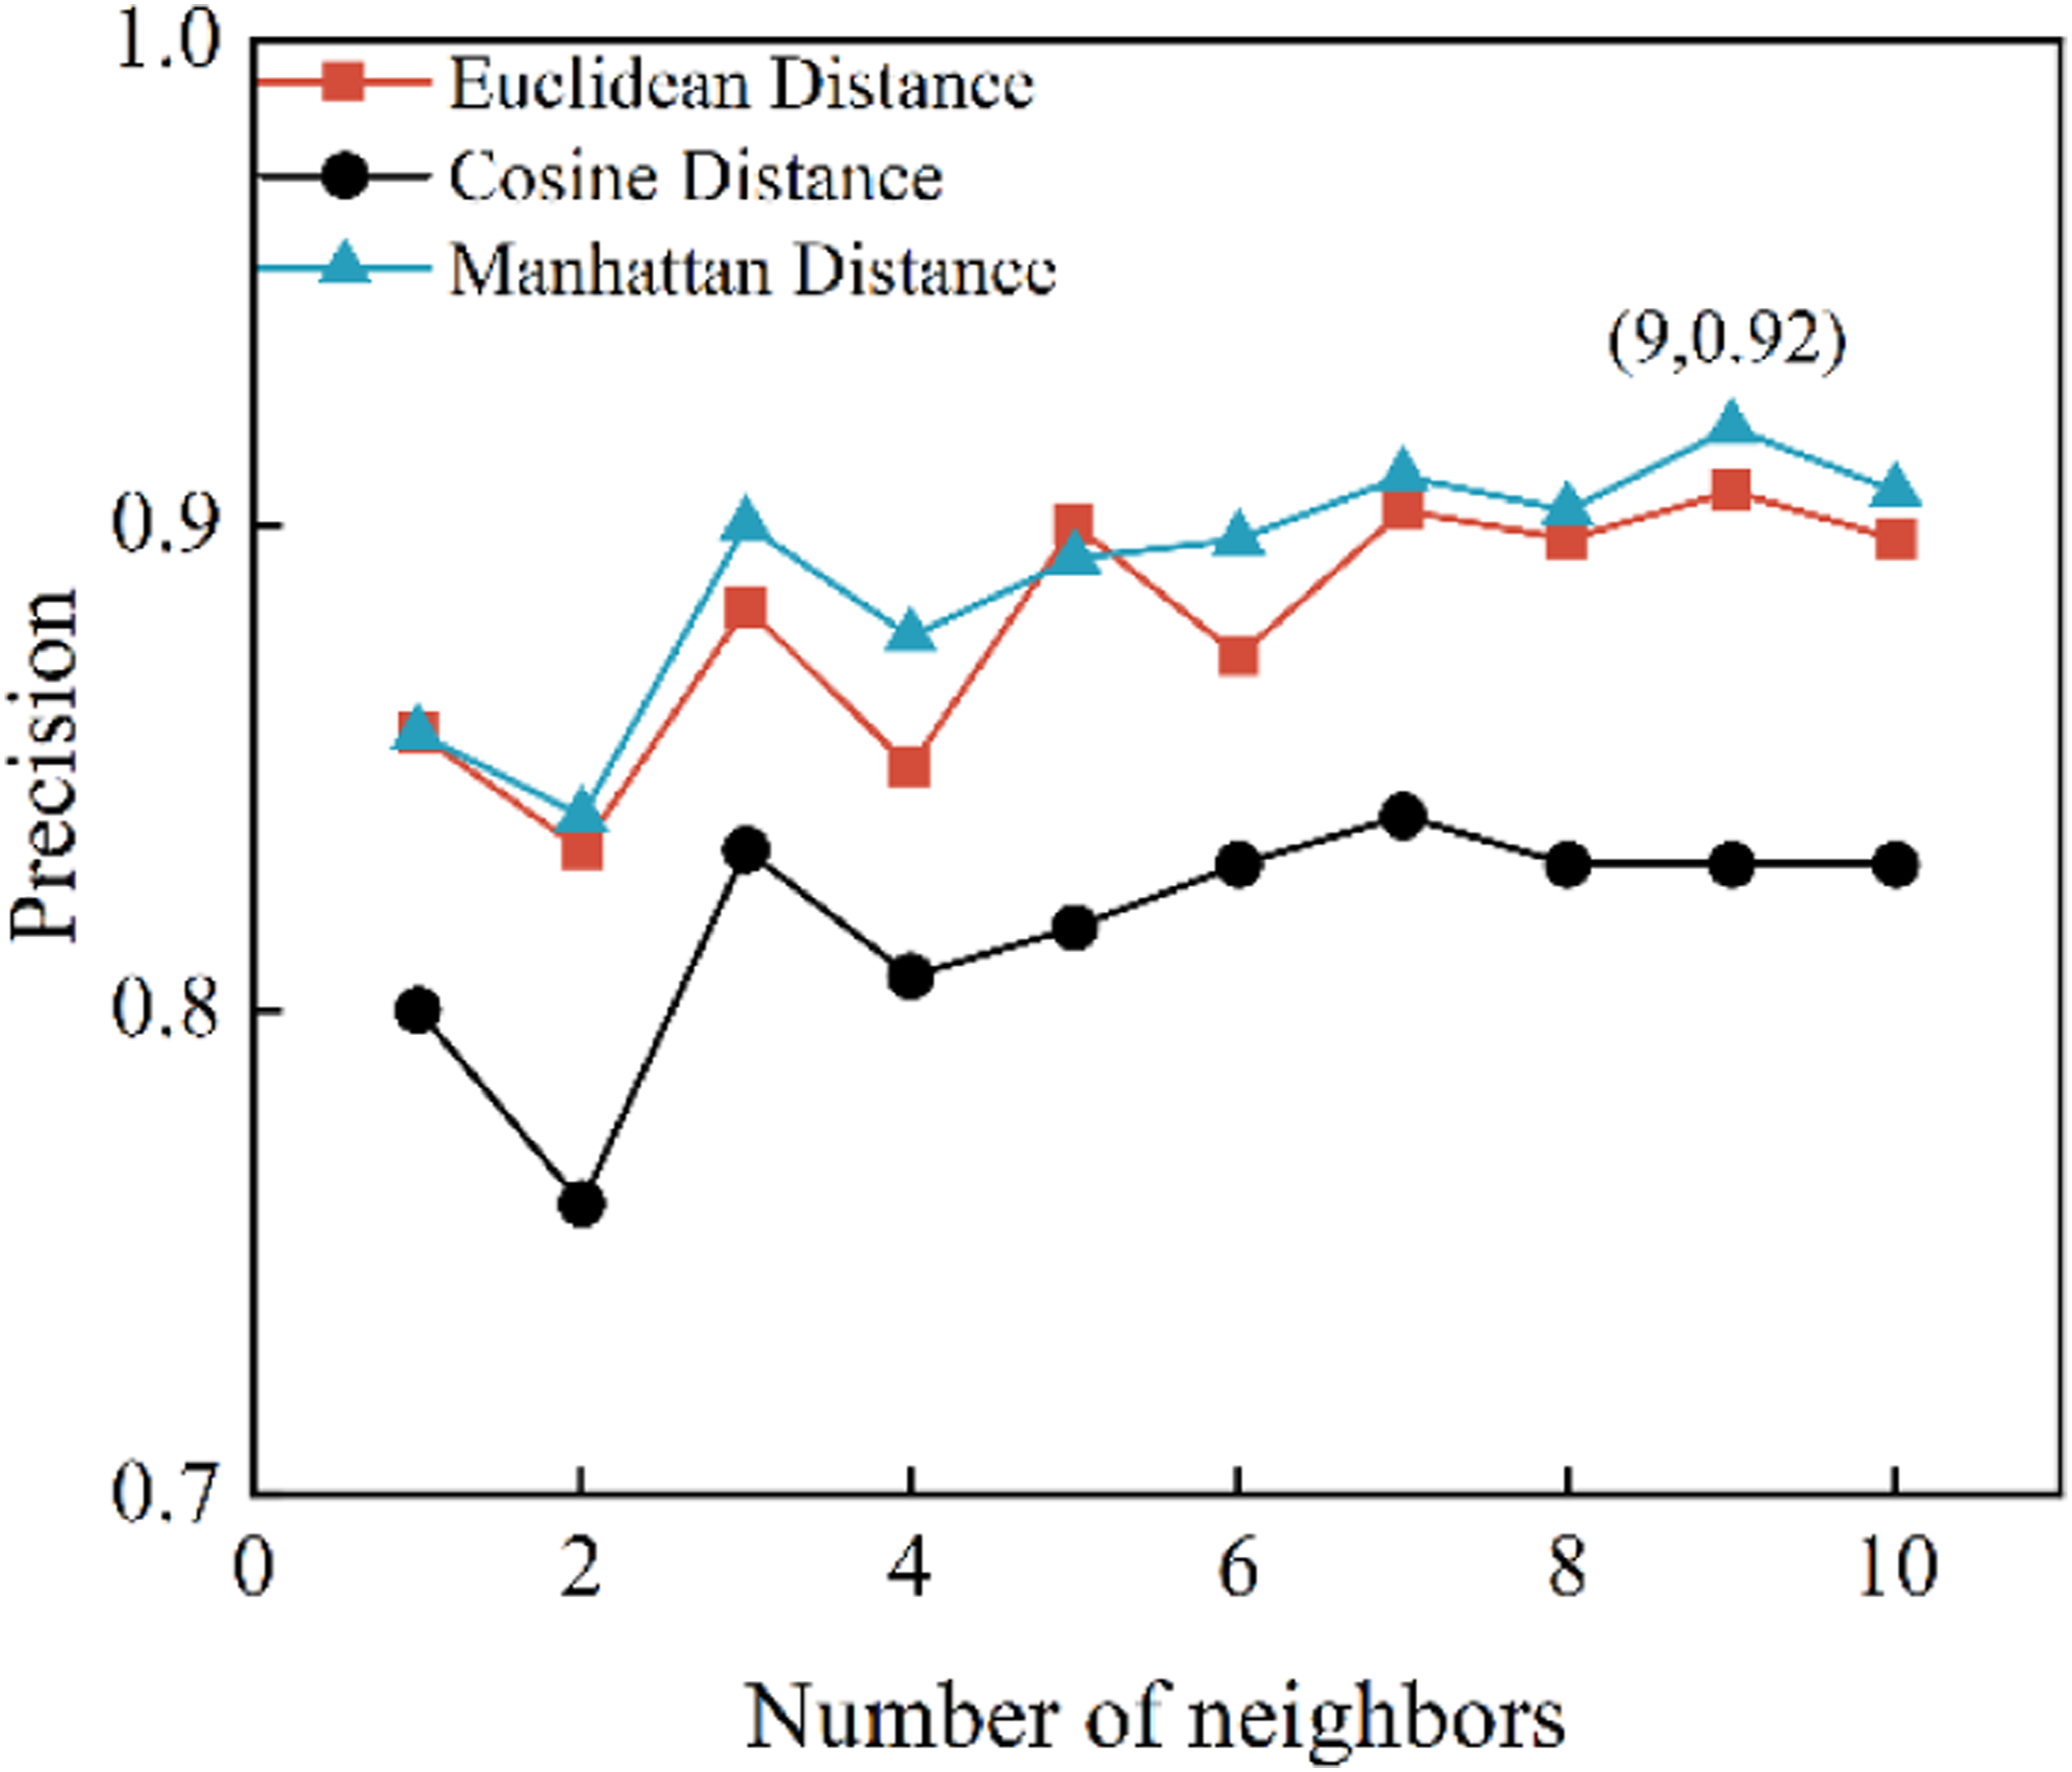


Application of classification model
The classification model was used to identify the AE signals obtained from the loading process of the composite lap bar. Due to the relatively low load applied to the lap bar in the first three stages of loading, and the absence of significant defects observed by the end of these three loading stages, the first three stages were analyzed together. Figure 18 shows the classification of AE signals collected during the destructive experiment of the composite lap bar. Clearly, the model output agrees well with the previously observed range of each damage mechanism. By identifying the damage source, it is possible to investigate and quantify the damage development during loading, and to provide a theoretical basis for the suitability of the composite structure. Figure 19(a) depicts the damage accumulation and cumulative energy per second for loading stages 1, 2 and 3. It is clear that in the first three stages of loading, due to the sudden application of tensile force, the AE signals related to matrix cracking were captured first. As damage accumulates, matrix cracking promotes delamination and fiber breakage. The trend of cumulative energy changes increases with the load and gradually levels off as it enters the steady state phase. Figure 19(b) depicts the state of the composite lap bar during loading stage 4. At this stage, the number of AE signals and the cumulative energy show a significant change compared to the first three stages. In addition, AE signals were generated during both the loading phase and the holding phase. This indicates that the metal insert and the composite filler squeezed each other, which may lead to irreversible damage within the structure. However, there was still no visible damage to the surface of the structure. At loading stage 5, the lever failed completely, caused by the bending of the lever arm on one side. It is clear from Figure 19(c) that AE signals were densely produced, including a large number of high-energy signals. Overall, delamination and fiber breakage are the main causes of structural failure, while matrix cracking promotes both. Visualization of classification results (a) classified AE signals collected during stages 1, 2 and 3 of the composite lap bar, (b) classified AE signals collected during stage 4 of the composite lap bar, and (c) classified AE signals collected during stage 5 of the composite lap bar. Quantification of classified AE signals hit count and energy of all five load stages. (The yellow area represents the loading phase, and the blue area represents the holding phase) (a) damage evolution of composite lap bar in stages 1, 2, and 3, (b) damage evolution of composite lap bar in stage 4, and (c) damage evolution of composite lap bar in stage 5.

Damage and failure characteristics of composite lap bar
To further observe the failure modes of the composite lap bar and verify the performance of the classification model, micro-scanning instruments were used to obtain information on the microstructure and morphology of the sample surface. The fracture morphology of the internal filling material of the bar arm, the surface fracture of the bar arm, and the damage morphology at the contact position between the lever arm and the metal embedded parts were observed using a KYKY-EM8000 field emission scanning electron microscope.
From Figure 20(a), it can be observed that the carbon fiber bundles at the fracture surface of the internal filling material are relatively flat, with some fibers still evenly coated by the resin matrix, indicating good adhesion between the fibers and the matrix. However, matrix cracking was observed, accompanied by a reduction in bonding strength between the matrix and fibers at certain locations, which resulted in the pull-out of entire fiber bundles and the formation of voids. The fracture morphology at the contact point between the lever arm and the metal embedded part is shown in Figure 20(b). During the loading process, the stress at the hole increases, and the deformation at the connection between the embedded part and the composite material also gradually increases. The carbon fiber material is subjected to compression by the metal material, and due to the difference in strength between the two, cracking occurs in the carbon fiber composite material at this location along the thickness direction, which gradually extends and further affects the interlaminar performance. As illustrated in Figure 20(c), the damage on the surface of the lever arm is more pronounced than that at the other two locations. The fiber arrangement at the fracture is evidently disordered, with numerous broken strands and interfacial damage, indicating that the interfacial performance of the carbon fiber composite material is relatively weak. Further increasing the magnification allows observation of fiber bundle fractures, with a significant number of fiber bundles peeling off from the matrix. The damage morphology of the fracture surfaces at different locations (a) the damage morphology of the internal filling material within the lever arm, (b) the damage morphology at the contact location between the lever arm and the metal embedded part, and (c) the damage morphology of the fracture surface on the lever arm.
Based on the aforementioned microstructural damage morphology analysis at different locations of the lever arm, it can be observed that the fracture interface exhibits damage modes such as matrix cracking, delamination, and fiber breakage, which confirms the effectiveness of the classification model in identifying AE signals.
Conclusion
In this study, damage pattern recognition and damage evolution analysis of the composite lap bar during the loading process were carried out by combining AE technique and machine learning. First, a method for extracting the marginal spectrum energy of any frequency band based on HHT is proposed. By using the proposed method to process the AE signals generated from the laminated specimens, the three damage modes of matrix cracking, delamination, and fiber breakage were distinguished based on their energy characteristics. The results show that the HHT-based energy characterization method used in this study not only qualitatively analyzes the damage patterns, but also serves as a classification criterion correlating parameters with damage patterns. The confusion matrix revealed that the proposed KNN classification model for recognizing signals associated with there three damage patterns achieved a high accuracy of approximately 92%. From the classification results of the AE signals collected in the destructive tests of the composite lap bar, it can be seen that the range of feature parameters for each damage mode is essentially the same as that of the training set. Furthermore, it was found that matrix cracking occurred throughout the entire loading process, while delamination and fiber fracture occurred densely only in stages 4 and 5. This also indicates that matrix cracking promotes the appearance of the other two types of damage modes. The scanning electron micrograph of the fracture surface reveals the aforementioned three damage modes, confirming the applicability of the proposed classification model in identifying the corresponding AE signals. In general, using the results of waveform analysis as input to supervised machine learning has shown satisfactory classification performance and potential in real engineering applications. Furthermore, the results indicate that the composite lap bar can be loaded to stage 5 while achieving a weight reduction of two-thirds compared to traditional metal materials.
Footnotes
Declaration of conflicting interests
The author(s) declared no potential conflicts of interest with respect to the research, authorship, and/or publication of this article.
Funding
The author(s) disclosed receipt of the following financial support for the research, authorship, and/or publication of this article: This work was supported by Innovation Team of Nondestructive Testing Technology and Instrument, Hebei University (IT2023C03) and China Special Equipment Inspection and Research Institute (J-24-Y10).