
Abstract
Prediction of composite materials failure is a valuable resource for ensuring structural integrity of aerospace structures. For the experimental part of the study, the sandwich specimens were fabricated using two aluminium cores, a Nomex core sandwiched between tool-facing and bag-facing sheets. A damaged slot was introduced and thereafter repaired with filler and repaired plies on the tool-facing sheet. The bonded-repaired sandwich composite facing sheet specimens were tested using a four-point bending setup under static loading conditions. A Multiscale Modelling (MSM) approach was developed to characterize the failure of a bonded-repaired sandwich composite tool-facing sheet. The MSM approach bridged three different length scales such as micro, meso and macro scales. The data processing and information transfer between the scales was facilitated by Visual Basic Applications scripts. Comparisons of micro, meso and micro-scale results were presented for both MSM and experimentation to validate the proposed MSM failure characterization approach. Numerical and fractographical results from MSM and experimentation matched very well for all three scales. In conclusion, the MSM failure characterization approach performed well against the experiment. It presents an opportunity to use an alternative composite materials failure characterization method for future research.
Keywords
Introduction
Carbon fibre-reinforced plastics (CFRP) are increasingly used as an alternative material to aluminium for aerospace structures due to their weight savings potential, corrosion-free properties as well as durability. 1 Moreover, these materials offer lower maintenance costs due to their robustness as compared to metals. 2 Based on weight-saving potential and low maintenance, the CFRP may dominate future aircraft structures. Within the Airbus family of aircraft, the A310 started with 5% composite structural weight and currently 53 % of the A350’s structural weight is in composites. 3 Initially, the target areas were the empennage, flaps, engine cowlings and landing gear doors and thereafter, the belly fairing and some parts of the rear fuselage joined the group of composite parts. Of late, the rest of the fuselage and wings are made from composites.
With the increasing application, comes the challenge for engineers to develop repair schemes that are efficient for non-conforming manufactured parts and damaged service parts. Repair rather than replacement of damaged parts is preferable when the replacement time is limited, and the cost of replacement is higher. For safety purposes, manufacturing companies and Maintenance Repair and Overhaul (MRO) companies need to fully understand the composite repair design process. If the damaged area is larger than the allowed size as defined in the structural repair manual then the repair has to go through extensive analysis and test substantiation as explained in the AMC-20. 4 This process is expensive and time-consuming. Further, the repaired structure should meet the requirements of ultimate strength, structural stiffness, aerodynamic flatness, weight balancing and durability. 5
There are two major types of repairs, namely, bonded and bolted repairs. Bolted repairs are used on thick monolithic composites that can withstand high bolt-bearing loads. Bonded repairs are mainly used where the sandwich-facing sheets are too thin to carry the bolt-bearing loads and also for preventing damage to the sandwich core by water ingress. Bonded repairs can be scarfed, overlapped, or stepped and a lot of composite parts repairs are done during manufacturing as a result most repairs are of a bonded nature. These repair schemes are validated by expensive experimental test procedures as required by airworthiness authorities (Federal Aviation Authority: FAR 23.305 and 23.307). 6 Often these experimental tests need to be repeated before satisfactory results are obtained. However, a complex mix of closed-form analysis (CFA), finite element analysis (FEA) and experimental tests are also used to minimize the risk of structural failure while meeting all technical, regulatory and customer requirements. CFA and FEA alone are inadequate to predict the composite failure under all possible loading scenarios. 7 Generally, the failure of composites starts at the micro-scale level of the reinforcing fibres 8 and the cumulative effect of micro-scale failure then progresses to the ply level (meso scale) before causing ultimate failure at the laminate level (macro-scale). This dictates the need for failure characterization at all three length scales, namely: micro, meso and macro scales, respectively. 9 FEA models are usually too simple to characterize failure at all three length scales and experimental testing on its own can also be prohibitively expensive. 10
Hence, a building-blocks approach was proposed to validate aircraft structural repairs. The approach is implemented in phases in such a way that the experimental testing and multiscale modelling (MSM) technique could be combined, which could substantially eliminate the necessity of expensive structural testing and hence reduce development costs and improve the accuracy of validation processes. This means that more MSM validation than experimental testing would be used in the coupon testing phase to determine material properties. Different materials could be applied to concept designs without costly coupon testing, which would eliminate the long lead time and expensive structural experimental validation processes. With sophisticated models and advanced computational techniques, the interrelated material characteristics of CFRP11–13 and the bonded repair structures could be adequately studied using the Multiscale Modelling (MSM) technique at the required length scales.14,15 Hence, the objective of this paper is to characterize the failure of bonded repaired sandwich composites tool face (TF) sheet using MSM and validate the results with experimental results.
Materials and methods
Experimental procedure
Figure 1(i) shows the experimental specimen dimensions of length 500 mm, width 50 mm and thickness 36.5–37.1 mm, respectively. Figure 1(ii) shows the composite sandwich panel lay-up sequence and the inner cores. A single specimen consists of a 35 mm thick Nomex honeycomb core sandwiched between bag face (BF) and tool face (TF) sheets. The Nomex honeycomb was made of a hexagonal core (Hexcell N636; 37 kg/m3) with a cell size of 4.8 mm. Our preliminary experiments show the premature failure of the specimens at the Nomex core due to loads and support points and hence, the aluminium (35 mm thick) hexagonal core (Hexcell CRIII-1/8-5052; 130 kg/m3) with a cell size 3.0 mm was added on both sides of the Nomex core for locating loading and support points. The bag face and tool face sheets were made from the pre-preg of Cytec 5276-1 toughened epoxy and standard modulus woven carbon fibre tows. The carbon fibre tows were of 3K70PW plain woven 42 Grade-A with a nominal fibre count of 3000 per tow. The woven carbon fibre consists of warp and weft tows at 90° to each other forming a mesh of 0/90°. The layup sequence of the bag face and the tool face sheets with their final thickness is given in Table 1. Sandwich panel specimen. (i) Sandwich panel. (ii) Schematic of the laying sequence. (iii) Repaired panel with strain gauge positions. (iv) Static loading positions. Stacking sequence of tool face and bag face sheets.

Before implementing the bonded repair, the repair slot was formed on the TF sheet. The size of the damaged slot was 60 mm wide to the depth of the TF sheet thickness without damaging the cores underneath. The damaged slot was created in such a way that the damage was spread 20 mm within the Nomex core and 40 mm within the aluminium core. The repair scheme consisted of three layers each of filler and repair plies pre-preg with a laying sequence of 0°/45°/0° similar to TF sheet layup. Before starting the repair, a layer of film adhesive (FM 300) was applied inside the damaged slot as well as on the TF sheet. Thereafter the repair scheme started by placing filler plies inside the damaged slot and then the repair plies were laid up on top of the filler plies covering the TF sheet. The repaired layups and the strain gauge positions are shown in Figure 1(iii).
Static test details.

Fractographical characterization
The fractographic analysis was used to capture the fracture and failure behaviour exhibited by the matrix and the fibres at the micro, meso and macro scale levels using a Scanning Electron Microscope (SEM) and a digital handheld microscope, respectively. Observations were made with a Rohs digital microscope with a magnification range of 50 to 500. The digital microscope was used to access specimen failure points, which cannot be reached by conventional microscopes.
TF sheet bending stress calculation
The TF sheet elastic modulus was obtained from strains measured using the strain gauge E1 and the stresses, which were calculated using an equivalent facing sheet stress equation defined in ASTM D7249/D7249M and given below S1 - Support span, mm S2 - Loading span, mm F - Total applied load, N t - Tool side laminate thickness, mm H - Sum of the core thickness and half of each TF and BF sheet thickness, mm w - Specimen width, mm σ - Facing sheet stress, MPa
Multiscale modelling analysis
The multiscale modelling (MSM) framework used in this research follows a hierarchical coupling procedure and individually analyzes three length scales (micro, meso and macro) to characterize the progressive failure of the tool face sheet repaired scheme. The analysis was carried out in a Toshiba laptop with an Intel (R) Core (TM) 7i-2640M central processing unit with a processing speed of 2.8 GHz and 32 gigabytes of RAM.
Figure 2 shows the schematic of the multiscale modelling framework of the three length scales. The models were created using the MSC. Patran pre-processor. The modelling process started at the micro-scale level by defining a micro representative volume element (RVE), which was then loaded with elastic strains to calculate micro RVE homogenized material properties. The calculated properties were subsequently forwarded to the meso scale RVE model to define the weft and warp tows properties. The meso model consisted of weft and warp tows impregnated with matrix. Once again, the elastic strains were applied to the meso RVE models to obtain the homogenized meso RVE material properties. The macro-scale repair model consisted of composite plies (carbon fibre and epoxy) and Nomex and aluminium cores. The properties from the meso RVE model were used as the material properties for the macro scale composite plies. Once the macro model was developed, the incremental loads were applied to characterize the progressive failure analysis of the repaired sandwich composite facing sheets. Multiscale modelling strategy framework.
Modelling procedure
The micro, meso and macro models and their components are shown in Figure 3. With the volume fraction of 55 % in a cured ply, the fibre diameter of 7.2 µm and the RVE dimensions were calculated for a hexagonal arrangement of four-quarter segments and one complete fibre. The matrix was inserted between the fibres and glued together to create the micro RVE model as shown in Figure 3(a)–(c). The geometric details and the material properties of the carbon fibre and the epoxy matrix are given in Tables 3 and 4, respectively. Both the fibre and matrix were modelled using CHEXA solid elements. The meso RVE model was modelled with single warp and weft tows at the centre with two half-width weft and warp tows on either side (Figure 3(d)–(e)). The weft and warp tows had the same thickness. They were placed perpendicular to each other. A sine wave was used to model the waviness associated with the woven carbon fibre model using equation (2) Micro, meso and macro modelling procedure. (a) Fibre: micro model. (b) Matrix: micro model. (c) Micro RVE model. (d) Warp tows: meso model. (e) Weft tows: meso model. (f) Isometric and end view without matrix. (g) Matrix elements. (h) Facing sheets with repair plies and cores: macro model. (i) Boundary conditions and nodal forces: macro model. Micro and macro RVE geometric details. Micro model and macro model cores material properties.


The combined model of the weft and warp tows is shown in Figure 3(f). As a result of the waviness, the gaps were created along their edges, which allowed the weft and warp tows to align perfectly to model the waviness associated with the woven carbon fibre. To complete the meso RVE mode, the matrix phase as shown in Figure 3(g) was added to give flat surfaces on the top and bottom sides of the model. CHEXA solid brick elements were used to model the warp and weft tows and the combination of CHEXA solid brick and CPENTA solid wedge elements were used to model the tows and matrix phases of the meso RVE model. The geometric details of the meso model are given in Table 2. The matrix material properties of the meso RVE model are the same as those of the matrix material properties used in the micro RVE model. The weft and waft tow material properties were determined from the homogenized material properties (orthotropic) of the micro RVE model. Material card ‘MAT9’ was used to insert these properties in the global meso RVE coordinate systems. The procedure for obtaining the material properties is given in the analysis procedure section below. The macro model consists of composite plies above and below the Nomex and aluminium cores (Figure 3 (h)–(i) to represent TF and BF sheets and their layup sequence is similar to the experimental specimen as given in Table 1. The staking sequence was assigned by aligning the material properties along the ply layup direction. Plies at 0° use the homogenized meso RVE material properties, but these properties were rotated by 45° for the inclined plies. The aluminium honeycomb and the Nomex test cores were modelled with solid CHEXA elements, and their material properties are given in Table 4.
The repaired scheme was modelled on the TF sheet with three filler and repair plies and was modelled with the stacking sequence of 0°/45°/0°, respectively. However, the repair plies were modelled with their edges overlapping on the Nomex core to follow the experimental test specimen. The filler plies were modelled beneath the overlapping plies and adjacent to the Nomex and aluminium cores within the damaged slot to replicate the experimental specimens. The overlap distance between the three repair layups was 20 mm (refer to Figure 3(h)-insert). The filler, repair and original facing sheet plies were modelled using CHEXA solid brick elements and their material properties were taken from the homogenized meso RVE model results. The CHEXA solid brick elements were used to fill the gaps between the TF sheets and filler plies and were also used at the ends of the repair plies in the form of CPENTA solid wedge elements to model the matrix areas. The macro model has loaded with the four rollers bending configuration, which is similar to the loads applied to the experimental test. Inner rollers were modelled as grid point force loads and the outer rollers as grid point boundary conditions (refer to Figure 3(i)).
Analysis procedure
The input text files for the three models were extracted from the individual RVEs without boundary conditions. The Excel spreadsheets were used to edit and update the original input text files before solving using the MSC. Nastran (SOL101) solver. The Visual Basic Analysis (VBA) subroutine was used to automate the iterative procedure of load increments, implementing progressive failure based on the material property degradation, and implementing failure criteria based on the composite constitution’s tensile strength. The role of subroutines is similar for all three, micro, meso and macro models.
Figure 4 shows the sequence of the analysis process. At first, the micro RVE was solved to obtain the homogenized elastic properties. To start with, the generated micro RVE Patran input text file was separated and stored in Excel sheets as 1. Micro_RVE_NODES: contains the micro RVE nodal numbers and their coordinates. 2. Micro_RVE_ELEM_PROPS: contains the element numbers, nodal connectivity and element properties. MSM Analysis flow chart.

The nodes were then grouped as master and slave nodes for applying the periodic boundary conditions. The pair nodes were grouped and stored using VBA scripts pair_edge() and pair_surf(), respectively. 3. MICRO_PAIRS: contains the master-slave pair nodes of faces, edges and vertices. The master-slave pair ensures that the displacement boundary conditions assigned to the master nodes are automatically assigned to the slave nodes. The matching displacements are a basic requirement of periodic boundary conditions. The group of master-slave pairs of the micro_RVE analysis is given in Figure 5. 4. Three axial and shear displacements as periodic boundary conditions were applied using multipoint constraints (MPCs) to the master-slave node groups and the MPC displacements were calculated. 5. The calculated MPC displacements and the equations were stored in worksheet EQUIV_DISP. 6. Then the final input files were generated by VBA subroutine bdf_file() using the calculated MPC displacements from subroutine mpc_pair() and the previously stored nodal connectivity and element properties from Micro_RVE_ELEM_PROPS. Master-slave groups of a Micro_RVE model.

Multipoint constrains
Equations for calculating multipoint constraints boundary conditions.

For example: Case 1. To calculate the displacement along xx directions (Δx): For this case, setting
The micro RVE deformations for the six input text files are shown in Figure 6. The blue meshed blocks are the original micro RVE and the red blocks represent the deformed micro RVEs. For cases 1 to 3, the results are shown in an isometric view and for cases 4 to 6 the results are shown in the plane of the shear deformations. Micro_RVE: homogenized material properties calculation. (i) Case 1: Extension in xx. (ii) Case 2: Extension in yy. (iii) Case 3: Extension in zz. (iv) Case 4: Shear in xy. (v) Shear in yz. (vi) Shear in xz.
Now the input files are ready with boundary conditions to be solved and a linear static solver in MSC. Nastran (SOL 101) was used by the VBA subroutine ‘run_nastran’ to solve the six input files, which provided the deformations and element stresses (σelms_stress) of the micro RVE model. The element stresses (array size: number of micro RVE elements by six stresses) in a matrix form for all the micro RVE elements are given as
The micro RVE element volume vector is given as
The RVE element stresses (σelms_stress) and the element volumes (Velems_volumes) were multiplied together to determine the homogeneous stiffness matrix (Smicro) of the RVE model by a sequence of matrix multiplication and scalar division as given in equation (3)
where
The first column of the stiffness matrix was determined from the load case 1 stress (i = 1) and microelement volume (V1). A similar procedure was followed to obtain the stiffness matrix of six load cases as explained before, which provided the stiffness for three normal and three shear directions as given below
Then the compliance matrix (Cmicro) was obtained by the inverse of the stiffness matrix (Sstiffness_micro) and relevant effective engineering moduli were obtained. The zeros are a result of the decoupled direct stresses and shear stresses in the micro RVE. This means that pure extension or contraction does not cause shear deformations and a pure shear does not induce tension or compression of the micro RVE. Although the constituents were isotropic material the average material properties of the micro RVE are orthotropic. Hence, there are zeros in the stiffness matrix. The VBA script con_tangent was used to calculate the stiffness and compliance matrices and stored in the Excel sheet Con_tang as shown in Figure 4. The homogenized micro RVE material properties were used as the weft and warp tows element properties in the meso RVE model.
A similar procedure was followed for the meso scale model analysis. The meso RVE input text file was separated and stored in separate Excel worksheets, and the sequences of Excel sheets and VBA scripts were followed to apply MPC boundary conditions to the meso RVE model. The linear static solver in MSC. Nastran (SOL 101) was used by the VBA subroutine ‘run_nastran’ to solve the six text input files and deformation and stresses were obtained. Figure 7 shows the deformation profiles of the six meso_RVE models. Meso RVE: homogenized material properties calculations. (i) Case 1: Extension in xx. (ii) Case 2: Extension in yy. (iii) Case 3: Extension in zz. (iv) Case 4: Shear in xy. (v) Case 5: Shear in yz. (vi) Case 6: Shear in xz.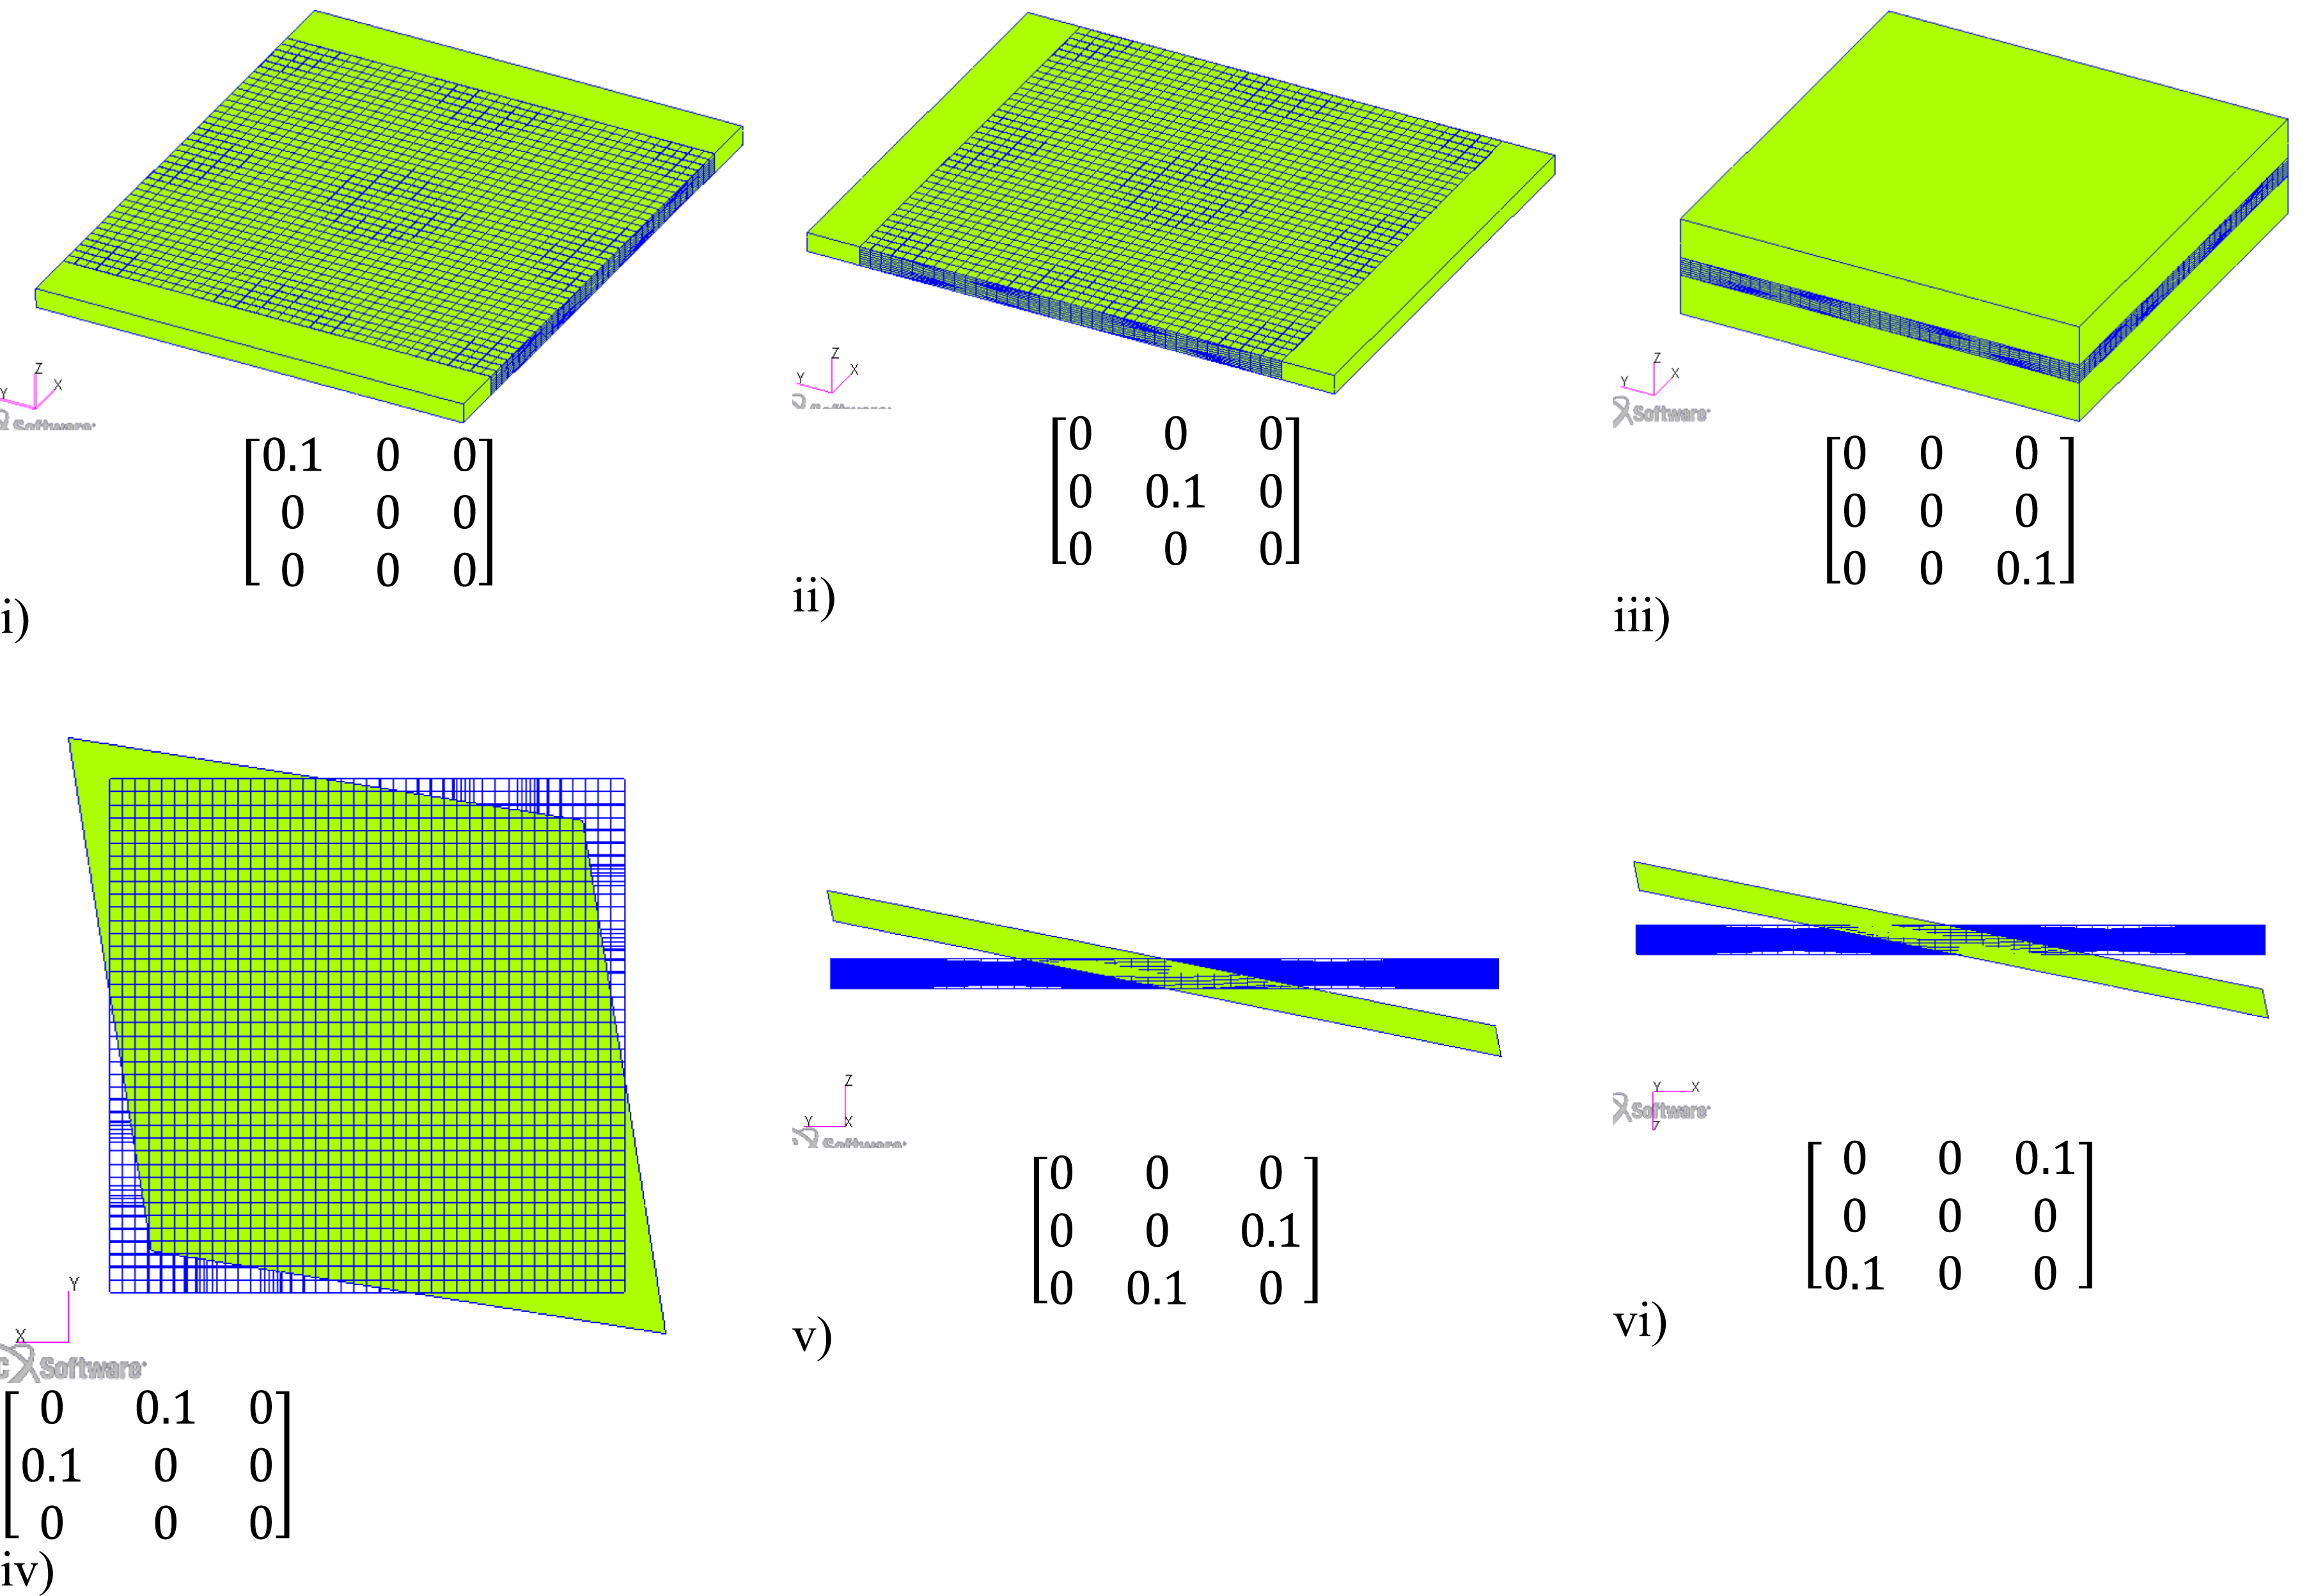
Using the elements’ stresses and the volumes, the homogenized meso stiffness matrix (Smeso) and the compliance matrix (Cmeso) were obtained; thereafter, the effective engineering moduli were calculated using the compliance matrix. The homogenized meso RVE material properties were used in the macro model ply layers.
The macro model input text file was separated according to ply, core and matrix and stored in Excel worksheets as given below (refer to Figure 4). • Repair NODES: Contained the macro model nodal coordinates. • Repair ELEM PROPS: Plies, core and matrix properties were stored. • Load_Control: To store the Load increments.
The VBA subroutine ‘bdf_file ()’ was used to transfer data from the Excel worksheets to generate the Updated Repair Model input file. The loads were started with 10% of the experimental failure load and incremented until the elements failed. The linear static solver in MSC. Nastran (SOL 101) was used to solve the input text files using the VBA subroutine ‘run_nastran’ to obtain the results. The loading increments were saved in the worksheet ‘Load _Control’ and the first loading condition was set to be low such that it did not cause any element failure. The loads were incremented with large steps within the elastic range of the ply material properties and the steps were reduced as the matrix and fibre elements started failing.
Progressive failure analysis
The progressive damage analysis was implemented using strain and material properties coupled between the modelling scales. This coupling procedure allowed load increments and material properties degradation processes to be implemented together within the multiscale modelling framework. For the sake of simplicity, the cross-functional flow diagram is drawn for the three length scales and shown in Figure 8. Arrows pointing from a large scale to a small scale imply strain coupling between modelling scales and arrows pointing from a small scale to a large scale imply material properties coupling between modelling scales. A ‘For’ looping VBA subroutine ‘Looping Macro ()’ was used to increment the macro load of the four-point bending repair MSM analysis. Progressive failure analysis flow diagram.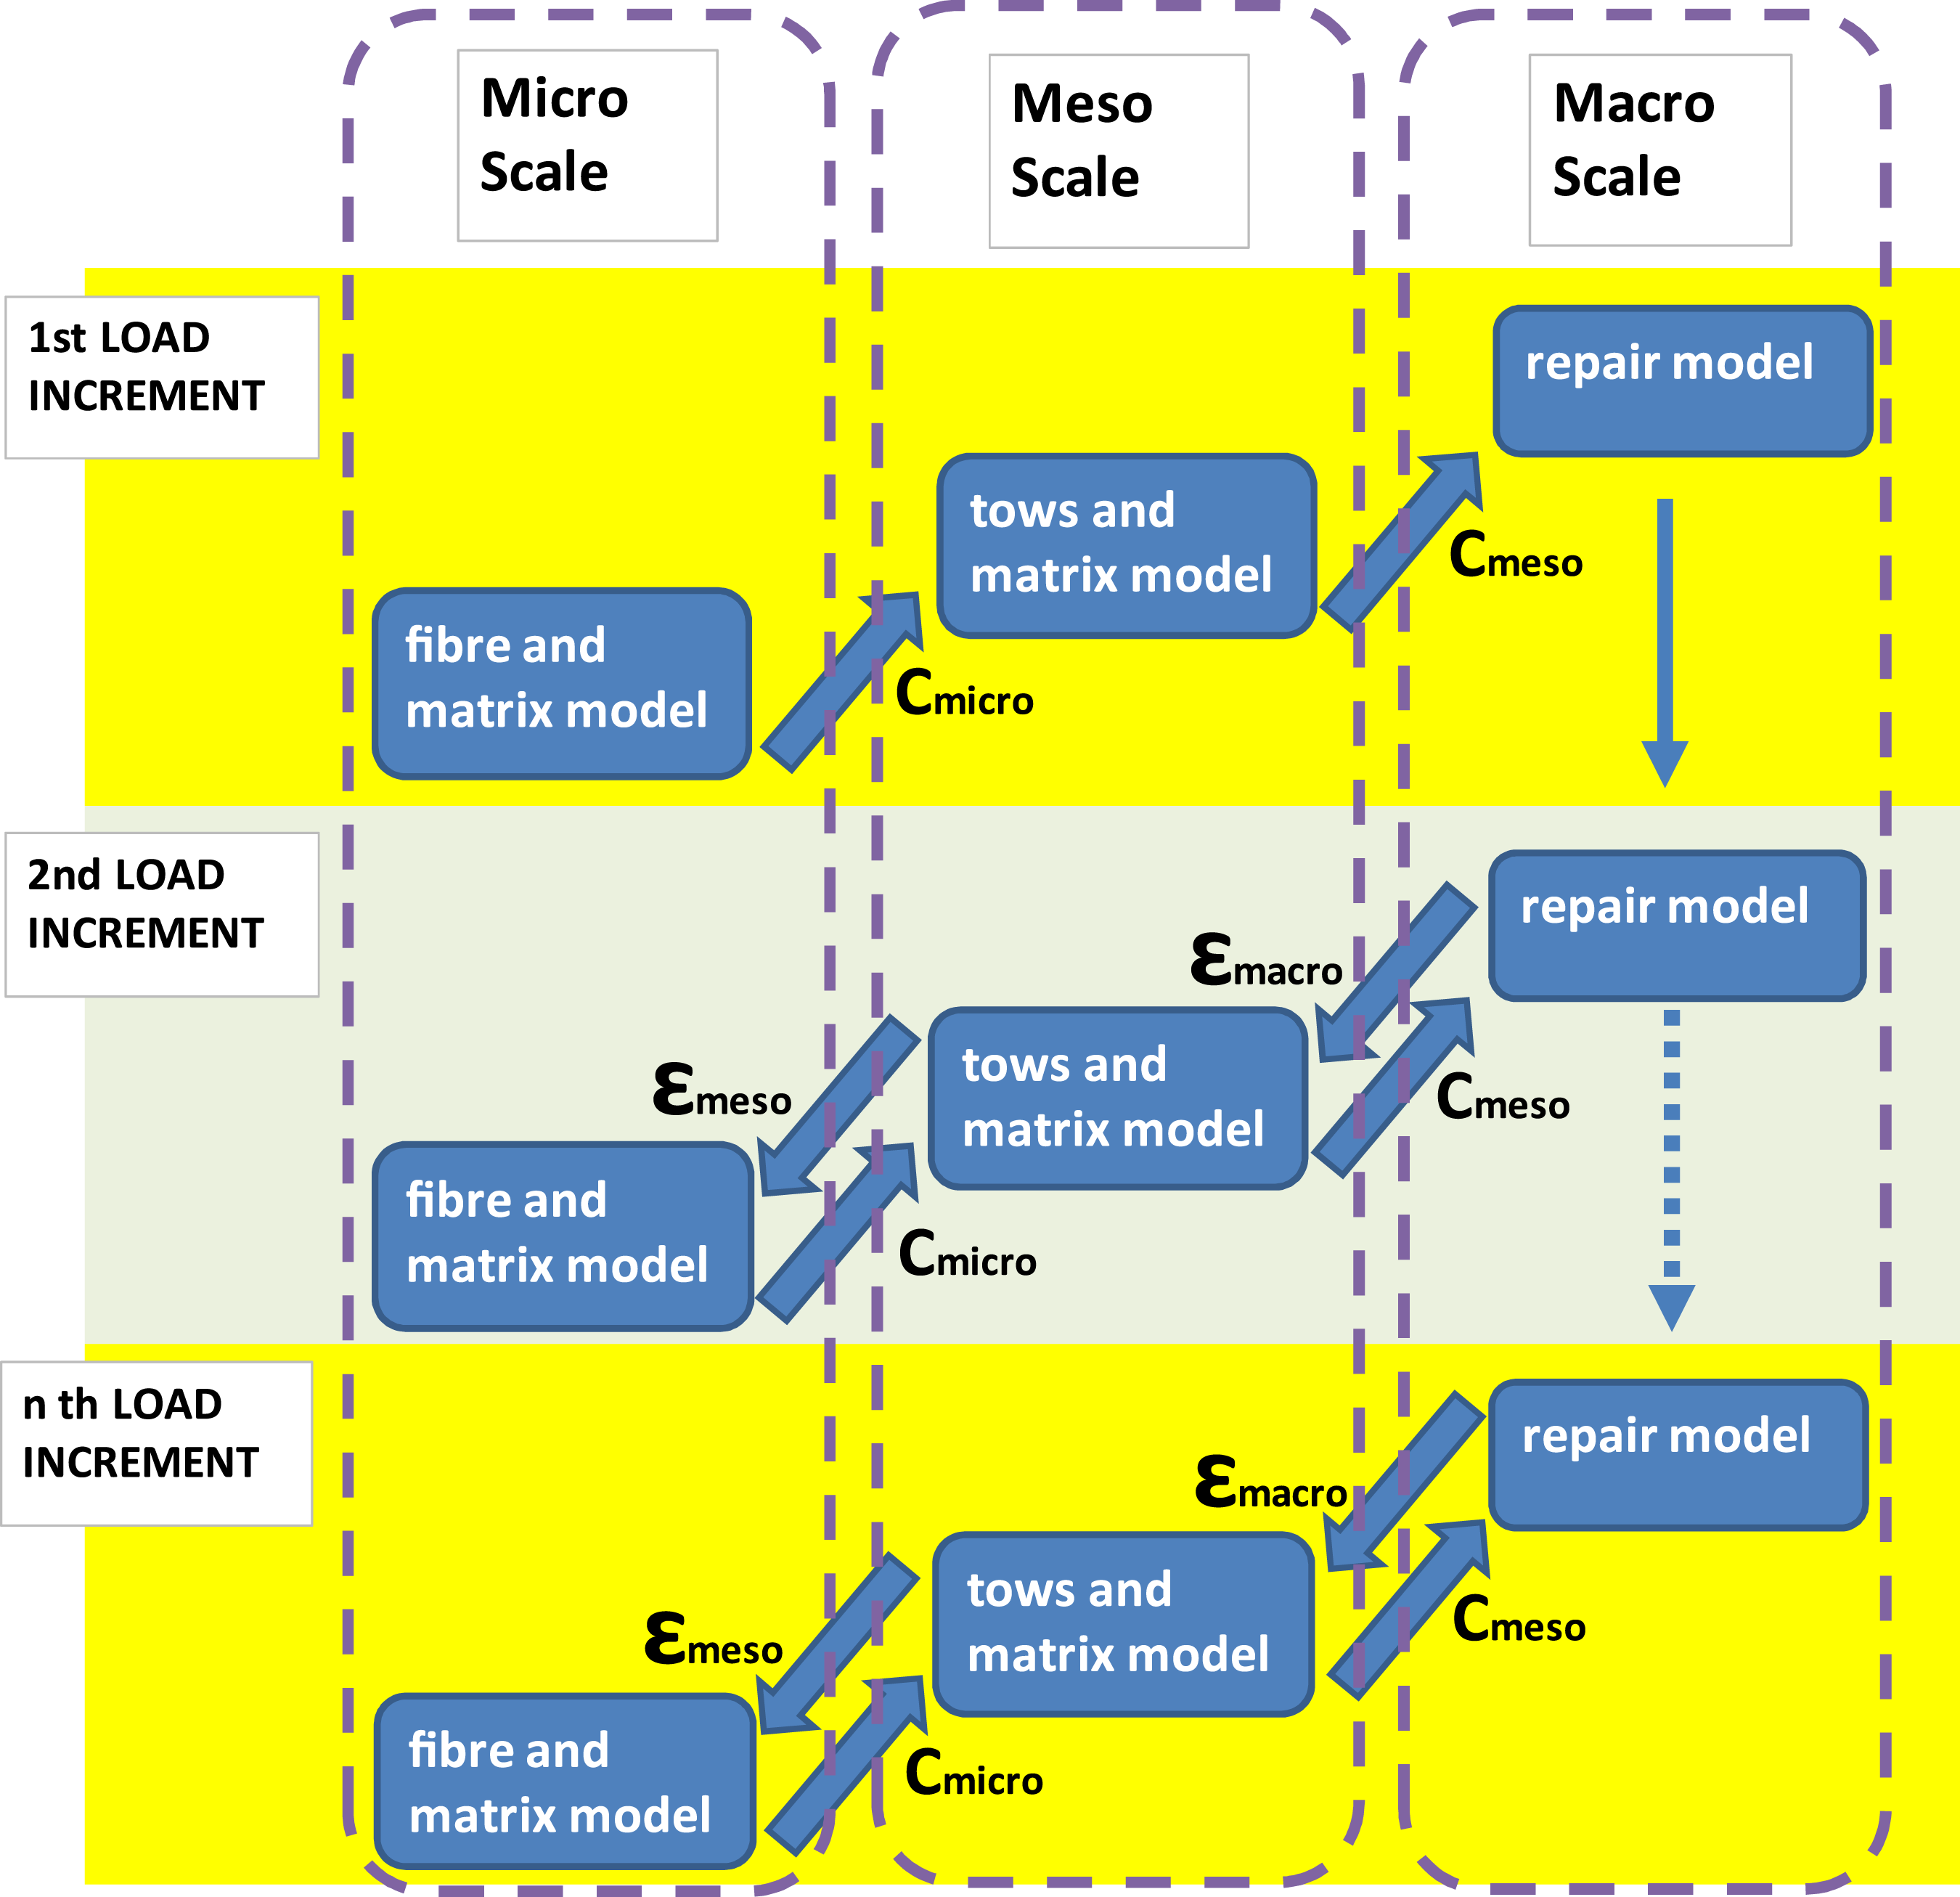
The looping started by determining the tow material properties (Cmicro) as explained in the micro model. Then the ply material properties (Cmeso) were obtained from the meso RVE analysis. With the tow and ply material properties determined, the load increments were applied to the repair model and the critical three-dimensional strain (
Thereafter, the critical three-dimensional strain tensor (
This calculation determined the failure indices (
Failure indices and stresses for the critical meso model elements were then stored in the worksheet ‘Meso_ELEM_PROPS’

If the failure indices exceed one, then the corresponding element material properties were reduced by a factor of 0.001. The processes of extracting critical meso RVE element stresses, calculating failure indices and material properties degradation were executed by VBA script check_mat_update () (refer to Figure 4). A similar process was followed for the micro RVE model to extract the matrix and fibre elements’ stresses and divide them by the matrix and fibre tensile strength. The extracted meso-critical strains (εmeso) were subsequently applied to the micro RVE to monitor progressive failure at the micro-scale. If the failure indices (equations (6) and (7)) of the micromodel elements exceeded one, their material properties were reduced by a factor of 0.001. Failure indices and Von Mises stresses for the micro RVE model elements were stored in the worksheet ‘Micro_RVE_ELEM_PROPS’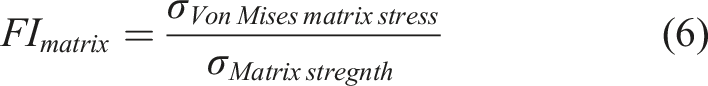

If the failure indices of the micro RVE or meso RVE models were less than one, then the material properties (Cmicro and Cmeso) for the micro model and meso model were recalculated before proceeding to the next macro load increment. This process was repeated for all load increments until the maximum experimental static failure load was reached.
Results and discussion
Failure analysis
The MSM analysis was validated for the three length scales (micro, meso and macro scale). At first, the macro-scale model strains from locations (E1, E2, E3 and E4) were extracted and validated using measured strain values from experiment group 1 loading. Figure 9 shows the strain values from MSM and experiments, respectively. By comparing the experimentally measured strains from E1 (on TF sheet) and E4, (on repaired plies) with MSM strain results, the accuracy of the MSM approach can be confirmed. The maximum strain value for the load of 9.52 kN at E4 from the experiment was 6240 microstrains and from MSM was 6371 microstrains, respectively. Similarly, the maximum strain value at E1 for the same load from the experiment was 12,000 microstrains and from MSM was 12,290 microstrains, respectively, which shows that the MSM strain results closely matched the experimental values. Strain measurements for 9.52 kN load.
TF facing sheet elastic modulus.

Micro scale failure
Similar to the experimental results, the MSM macro model analysis showed the critical failure points at locations A and B as shown in Figure 10(i). Since the macro model was derived from the micro and meso models, the critical failure points at the macro scale evolved from the micro and meso-scale failure. Hence, for analyzing the failure behaviour, the elements at critical point B were selected from the micro, meso and finally macro scale, respectively. The micro-scale failed elements results were extracted from the meso model and its position in the meso RVE model is marked by a yellow circle (refer to Figure 13). Figure 10(ii) shows the Von Mises stress plot for the micro RVE model for an applied load of 3 kN (approximately 40% of Group 2 load). This load was randomly selected to analyze the stress distribution within the micro RVE model. Figure 10(iii) and (iv) show the elemental stress distribution of the matrix and fibres. The results show that the stress values for the matrix are maximum at the top, bottom, left and right faces of the RVE due to the transfer of shear loads into the fibres. There is also a large difference between the minimum and maximum matrix stresses. This indicates that the matrix will fail gradually as its elements reach their failure stress at different load levels. The fibre elements on the other hand have a very small difference between the minimum and maximum stress. This implies that the fibre elements will reach their failure stress all at the same time and fail in a brittle manner. Stress plots. (i) Stresses at the critical points (A & B). (ii) Von misses stress_micro RVE. (iii) Matrix element stress_micro RVE. (iv) Fibre element stress_micro RVE. (v) Y direction element stress_micro RVE. (vi) Z direction element stress_miocro RVE.
The matrix and fibre element stresses are reproduced as X, Y and ZX element stresses for two perpendicular paths going through the centre of RVE in the YZ plane, and the resultant graph is shown in Figure 10(v) and (vi), respectively. Here, the X and Y stress components are tensile stresses, while the ZX is a shear stress. The result shows that the Y and ZX stress components are very small compared to the X stress components across the micro RVE. There is also a significant increase in the X stress component at the fibre and matrix boundary. The difference in the tensile stresses between the matrix and the fibre is due to their differences in stiffness. The stiffer fibres carry most of the tensile load in the facing sheet. However, the matrix maximum X stress of 0.0366 GPa is not far from the matrix tensile strength of 0.045 GPa. Meaning that the matrix will fail first as the applied macro load increases. This is in agreement with the observation from experimental results. A small variation in the Y stress component is observed at the matrix and fibre boundary since this component is related to the X stress component by Poission’s ratio.
Figure 11 shows the degree of failure of the matrix and fibre elements of the micro_RVE as the applied load increased. Here, the colour blue is for the failed elements and the red colour denotes intact elements. From no load to an applied load of 8.02 kN (approximately 80% of Group 2 load), the fibre elements did not fail but the majority of the matrix elements had already failed and were removed. Thereafter, the matrix and fibre elements fail at the next load increment of 8.52 kN (approximately 85% of Group 2 load). At the next load increment of 8.76 kN, the microelements failure profile does not change as the micro RVE has softened to the point where it could not carry the additional load for the selected meso scale element strain. These results show that micro-scale failure starts in the matrix rather than the fibres in the facing sheet composite material. With the MSM approach, it was possible to incrementally apply load and study the failure of the micro-scale model. Micro RVE stress plots for varying loads at the critical points. (i) Warp fibre elements at 8.02 kN. (ii) Warp fibre elements at 8.52 kN. (iii) Warp fibre elements at 8.76 kN. (iv) Warp matrix elements at 8.02 kN. (v) Warp matrix elements at 8.52 kN. (vi) Warp matrix elements at 8.76 kN.
Meso scale failure
Figure 12 shows the stress plots of the warp tows, weft tows and matrix elements for an applied bending load of 3 kN (approximately 40% of Group 2 load). Figure 12(i) shows the warp tow element stresses in the X-direction, which reaches a peak at the intersection points of warp and weft edges and the difference between the maximum and minimum stresses is greater than 200 MPa. Here, the warp tow elements show the highest stress compared to the weft tow elements as shown in Figure 12(ii), which justifies the reason for analyzing the warp tows at the micro-scale level. Similar to the micro-scale failure, the meso scale matrix failure started first due to the peak matrix stress of 29 MPa. This value is near the matrix tensile strength of 45 MPa. Matrix failure occurred in straight lines along the warp length direction as shown by the high-stress elements in Figure 12(iii). The stresses from the warp meso RVE were reproduced and are shown in Figure 12(iv) and (v). The result shows that the warp width was positioned across the highest loaded points, and the X stress component of the warp tows is the dominant component as compared to the Y and ZX stress components. The X stress component also reaches its peak at the edges of the warp tows and is the tensile stress (circle marked in Figure 12(iv)). There is an insignificant variation of the Y and ZX stress components along the length warp tows. A similar observation was also seen for the warp width as well (Figure 12(v)). In addition, it can be seen from the stress plots that the warp tow failure occurs at their intersection points with weft tows and across the warp tow edges as seen from the MSM (Figure 12(vi) and the experimental results (Figure 12(vii)). Meso scale failure analysis: MSM and Experimental results. (i) Warp tows. (ii) Weft tows. (iii) Stress plot for Matrix. (iv) Stress along warp length. (v) Stress along warp width. (vi) Warp tow edge failure: MSM model. (vii) Warp tow edge failure: Experiment. (viii) Weft tow failure: MSM. (ix) Weft tow failure: Experiment.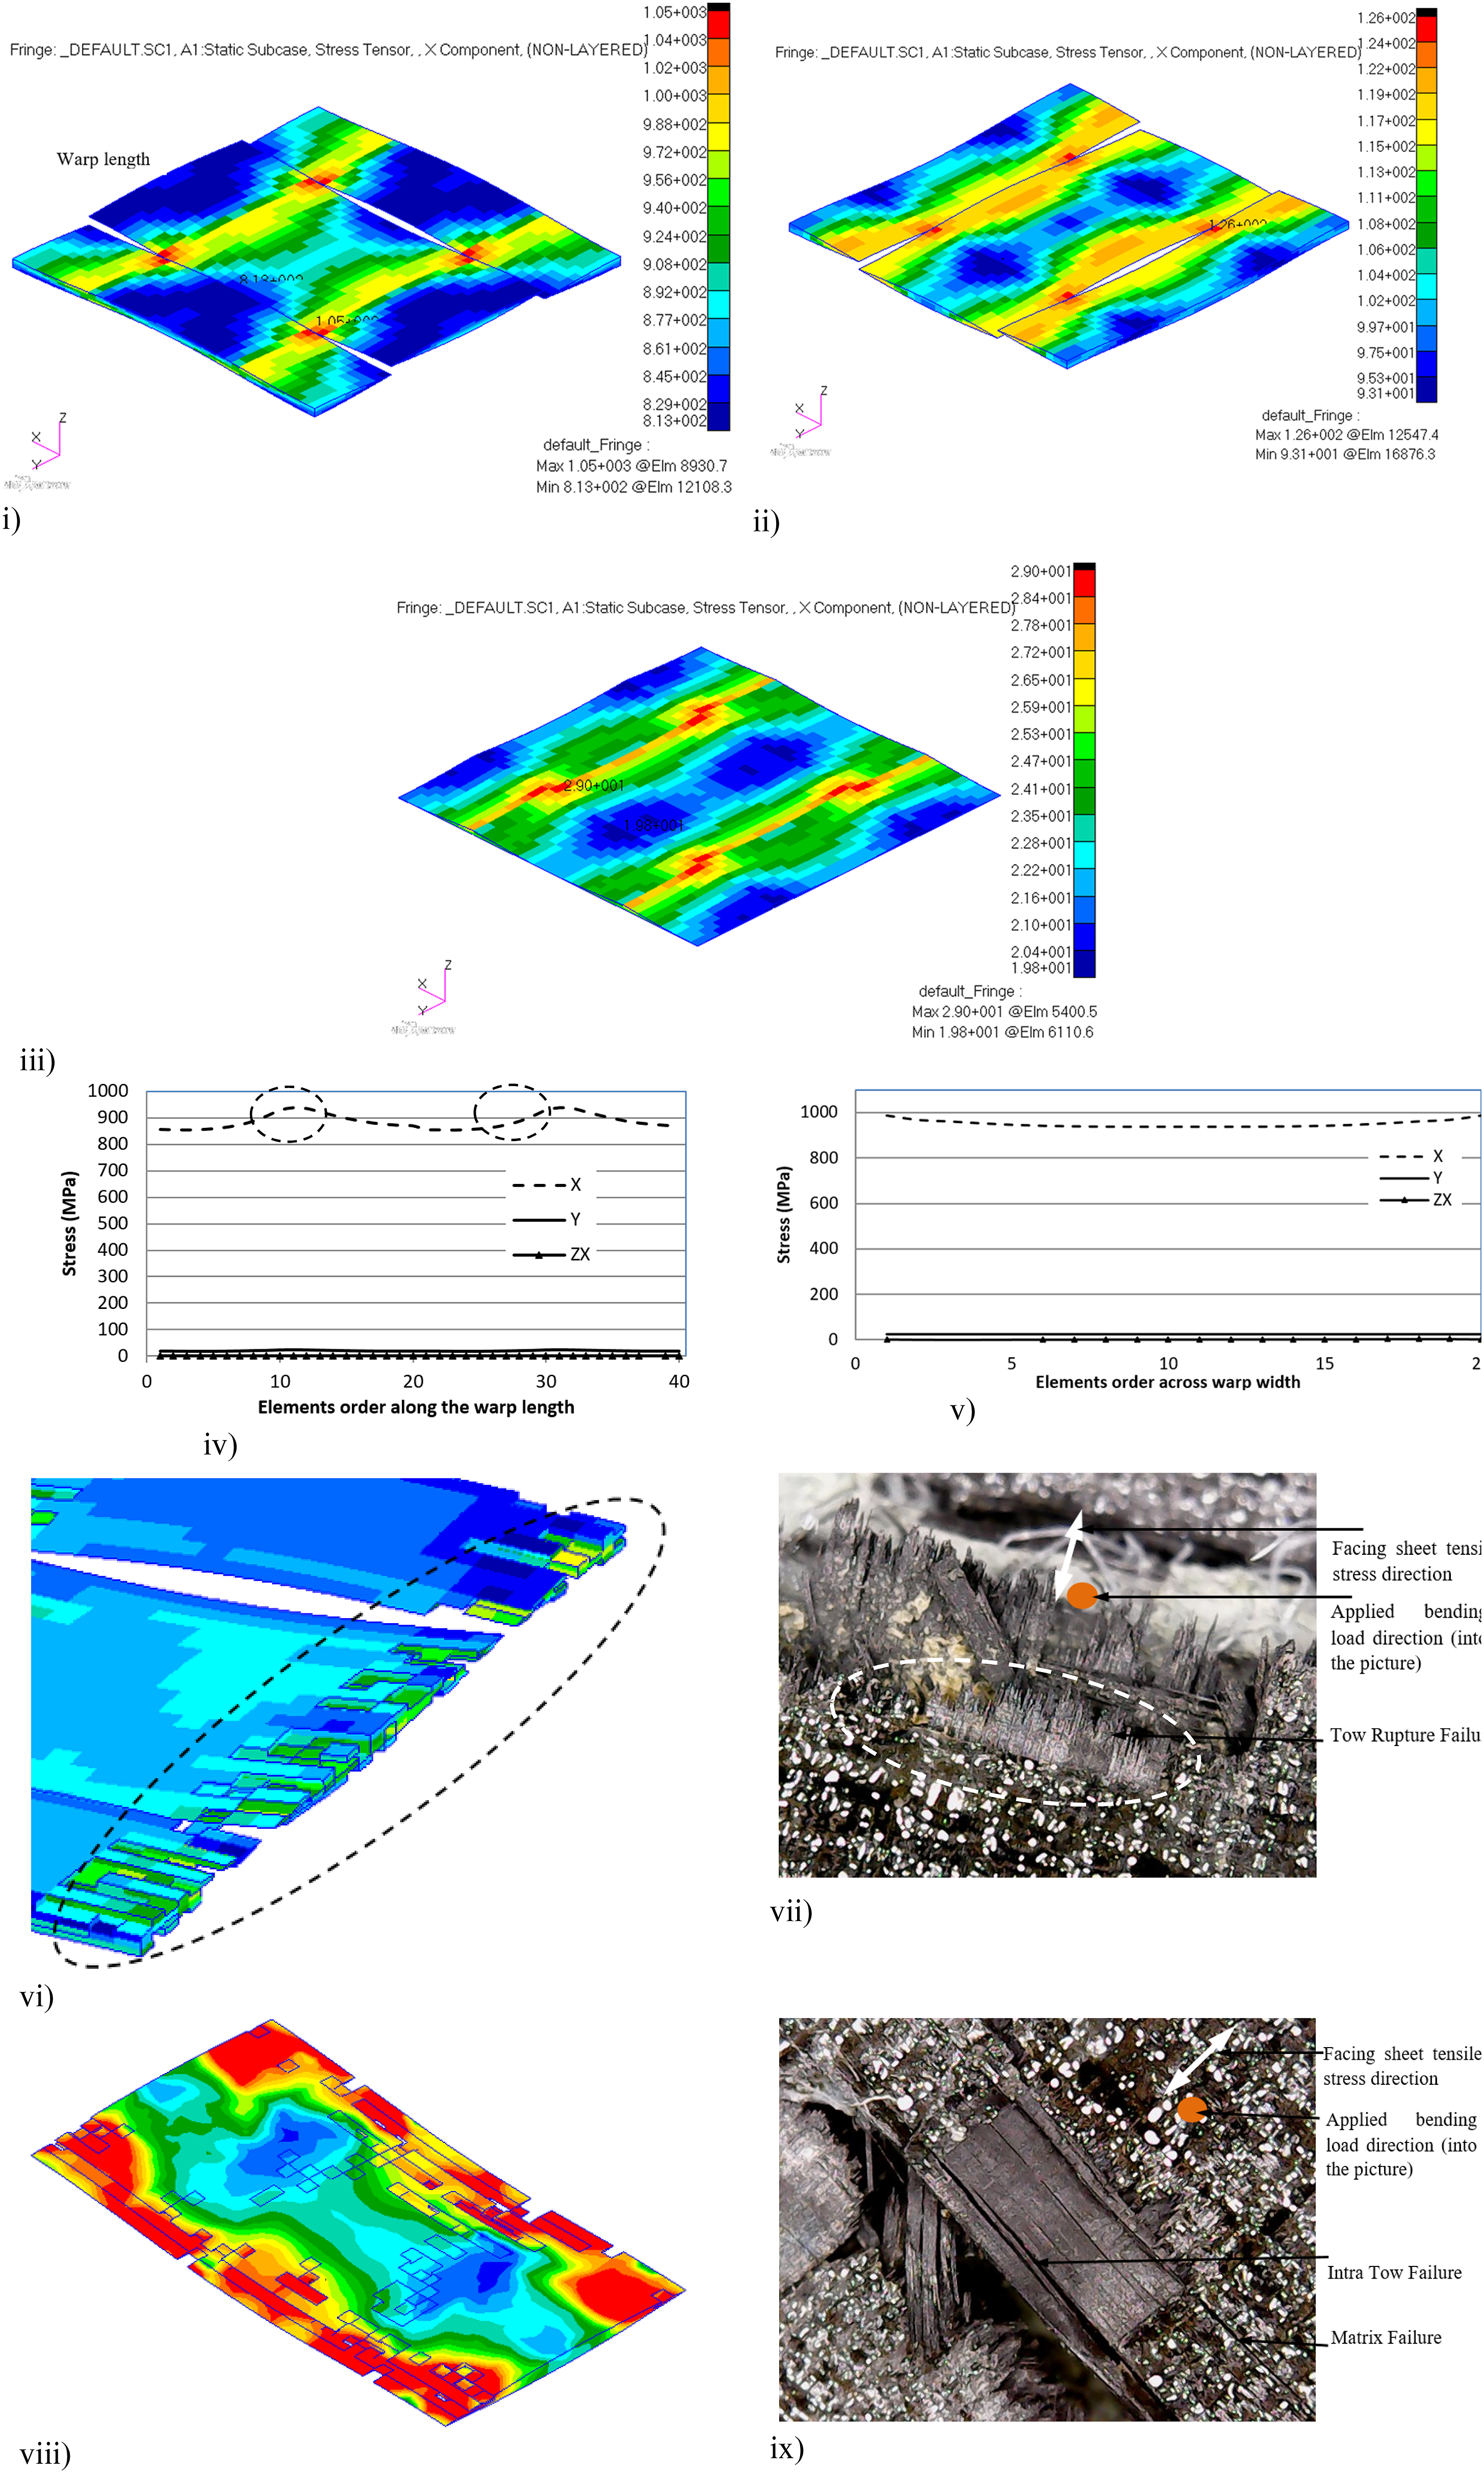
Similar to the warp tow edge elements, the highest stresses are at the intersection points of the weft tow edges. These points have no matrix between the warp and weft tows as a result the meso RVE develops its highest stiffness at these points, which means that the meso model carries a lot of its stresses at these points. Figure 12(viii) and (ix) show results of weft tow failure along the lengthwise edges from MSM and experimental results. The experimental image shows failure along the lengthwise edges of the weft tow and the MSM image shows highly stressed weft tow elements in red, and the failed element was removed as shown in Figure 12(viii). The high-stress points on the weft tows are a result of warp tows transferring loads to the weft tows as they rise over or dip under the weft tows.
Figure 13 shows the degree of failure of the matrix, weft and warp fibre elements as the applied load increased. The meso scale failed elements were captured at critical point B. Here, the colour blue is for the failed elements and red colour for the intact elements. At an applied load of 8.02 kN (approximately 80% of Group 2 load), the majority of matrix elements failed before the warp and weft tow elements. These results are shown in Figure 13(a)–(d). The meso matrix elements exhibited little progressive failure as the load increased. Some warp and weft tow elements failed at 8.02 kN but the majority of the matrix elements failed at the next load increment, that is,, 8.52 kN. The matrix elements do not show any progressive damage failure because there is very little variation in the element tensile stress values in the warp and weft directions. Once the matrix element tensile stress values are above 45 MPa, these elements fail in a brittle manner. The mode of failure for the warp tows was similar to the experimental meso scale results as shown in Figure 12(vii) and (ix). The failed warp tow ends were serrated as shown in Figure 12(vi). The weft tows were dominated by intra-two failure as shown in Figure 12(viii). The meso model predicted a top ply failure at 9.02 kN which is close to the experimental average load of 9.96 kN. Meso RVE failure analysis at critical point B. (a) Matrix elements at 8.02 kN. (b) Matrix elements at 8.52 kN. (c) Matrix elements at 8.76 kN. (d) Matrix elements at 9.02 kN. (e) Weft tows elements at 8.02 kN. (f) Weft tows elements at 8.52 kN. (g) Weft tows elements at 8.76 kN. (h) Weft tows elements at 9.02 kN. (i) Warp tows elements at 8.02 kN. (j) Warp tows elements at 8.52 kN. (k) Warp tows elements at 8.76 kN. (l) Warp tows elements at 9.02 kN.
Macro scale failure
Results from the MSM macro model confirmed the criticality of the two failure locations. These locations are over the Nomex core section of the sandwich beam. They are indicated by the two red strips on the TF sheets in Figure 14(i). The critical points A and B correlate well with the macro-scale experimental specimen (Figure 14(ii)). Macro model tool-facing sheet failure: MSM and Experiments. (i) Tool-facing sheet failure: MSM. (ii) Tool-facing sheet failure: Experiment. (iii) Element stress plot (critical point A). (iv) Element stress plot (critical point B). (v) Element centroid stress: Critical point A. (vi) Element centroid stress: Critical point B.
Comparing the MSM and experimental results, the macro-scale failure in the repaired TF sheet occurred in two critical areas and the failure morphology was a straight line across the facing sheet as demonstrated by the experimental result. Both failure points are within the maximum bending moment region of the sandwich panel. The bending moment can be resolved into a couple-forces that cause tensile stress in the repaired facing sheet. The tensile stress was in the same direction as the warp tow direction. The straight line facing sheet failures occurred when the three plies thick laminates reached their tensile stress strength. Theoretically, the TF sheet tensile strength at points A and B was the same but manufacturing process variables randomly dictated the final weak point of failure. Figure 14(iii) and (iv) show the locations of macro element lists of the tow dominant facing sheet stress components. The images only show the repaired facing sheet within the Nomex core section. At critical point A, the peak stress is in the first repair ply and at critical point B, the peak stress is in the topmost original ply. The graphs of the X and Y stress components show sharp increases in the X stress component at these critical points as shown in Figure 14(v) and (vi). Although critical point A shows higher stresses, the manufacturing variables dictate the final failure location as witnessed from experimental results.
Conclusion and recommendation
The carbon fibre sandwich panels with tool and bag face sheets and aluminium and Nomex cores were manufactured. A damaged slot was introduced on the tool-facing sheet of the sandwich panels and thereafter repaired with filler and repair plies. Two sets of specimens were cut from the sandwich panels. The experiment was conducted on a 5500R Instron testing machine using a four-point bending testing setup. A fractographic analysis of the fracture areas was carried out to analyze the failure behaviour at three length scales. At the macro scale, two critical failure areas were observed at the thinnest points of the tool-facing sheet. The thinnest points experienced the highest tensile stress from the applied four-point bending moment. Point B was located at the edge of the damage slot, and point A was located at the edge of the topmost repair ply. Experimental results showed about a 50 % probability of facing sheet failure at either point A or B. A multiscale model method was developed to analyze the failure behaviour at three length scales. At the micro-scale, only one complete and four segments of fibres within a matrix were modelled. Micro RVE model material properties were obtained directly from the materials suppliers’ specifications. The meso RVE model was modelled with a warp and a weft tows together with two half-width weft and warp tows on their sides. The weft and warp tows had the same thickness and width. They were placed perpendicular to each other. Meso RVE model material properties were obtained from the micro RVE model. At the macro scale, the model was created to capture the geometric features of the plies and cores. The material properties of the plies were determined at the meso scale. To determine the facing sheet static failure load, the MSM approach used an element property degradation scheme based on the element stress values. At the macro scale, MSM predicted the failure locations of critical points A and B exactly at the same positions as the experimental specimens’ failure locations. The meso scale matrix failure was accurately predicted by MSM analysis. The fracture line location for the warp tows was the same for both the experimental specimens and the meso scale model. The main conclusion about the micro-scale was that the matrix failed first before the fibre failed in a brittle manner.
For most CFRP applications, macro-scale failure determines structural failure, but it behaves in a brittle manner, that is, structural failure occurs suddenly, which might be the case for the repaired facing sheets if monitored only at the macro scale. On the other hand, MSM can highlight failure locations at the micro and meso scale levels before the final structural failure at the macro scale occurs. Hence, the MSM analysis has the potential to reduce the high cost of determining the suitability of CFRP applications for highly demanding applications like aircraft primary structures. Rather than testing all possible material configurations, MSM could be used to explore the possible material designs and reserve testing for the final material configurations. In Maintenance Repair and Overhaul operations, it can also be used to support structural health monitoring activities.
Footnotes
Acknowledgements
The authors greatly acknowledge the contribution and support of Mr. Ikarabele Makhate from the University of the Witwatersrand, South Africa in extracting the required results from both experimental and multiscale modelling.
Author contributions
All authors contributed to the conception and design. The compilation of data was performed by Niaz Quader. The first and final drafts were compiled by SD Jacob Muthu. All authors read and approved the final manuscript.
Declaration of conflicting interests
The author(s) declared no potential conflicts of interest with respect to the research, authorship, and/or publication of this article.
Funding
The author(s) received no financial support for the research, authorship, and/or publication of this article.
Data availability statement
The data are included in the manuscript.