
Abstract
This research aims to optimize the mechanical properties of woven fabric composites, especially the elastic modulus. A micromechanics model of woven fabric composites was used to obtain the mechanical properties of the fiber composite, and a genetic algorithm (GA) was employed for the optimization tool. The structure of the fabric fiber was expressed using the width, thickness, and wave pattern of the fiber strands in the woven fabric composites. In the GA, the chromosome string consisted of the thickness and width of the fill and warp strands, and the objective function was determined to maximize the elastic modulus of the composite. Numerical analysis showed that the longitudinal mechanical properties of the strands contributed significantly to the overall elastic modulus of the composites because the longitudinal property was notably larger than the transverse property. Therefore, to improve the in-plane elastic modulus, the resulting geometry of the composites possessed large volumes of related strands with large cross-sectional areas and small strand waviness. However, the numerical results of the out-of-plane elastic modulus generated large strand waviness, which contributed to the fiber alignment in the out-of-plane direction. The findings of this research are expected to be an excellent resource for the structural design of woven fabric composites.
Keywords
Introduction
Fiber-reinforced composites are widely used in industrial fields such as the aerospace and automobile industries owing to their excellent mechanical properties, such as high specific modulus and specific strength. 1 –5 This practical application has encouraged not only experimental but also theoretical research. One of the major focuses in theoretical research is the development of micromechanics models to predict the mechanical properties of woven fabric composites, with several models already proposed. 6 –13 Aitharaju and Averill 6 proposed an analytical/numerical model to consider the geometry of woven fabric in composites. They divided a repeating unit cell into three regions depending on the two waviness: a cross-ply region, fiber waviness in one direction, and fiber waviness in two directions. Huang 7 proposed a micromechanics model to predict the elastic, inelastic, and ultimate strength of composites reinforced with woven and braided fabrics. Byström et al. 8 obtained the elastic properties of woven fabric composites using analytical models and believed that the architecture of the reinforcement in woven composites might have a significant effect on their mechanical properties. Scida et al. 9,10 proposed a micromechanical model to determine the elastic properties of woven fabric composites. They used the thin laminate theory to accommodate strand undulations and integrated the geometrical and mechanical parameters of resin, fill, and warp strands. Other studies applied micromechanical analysis of woven fabric composites to practical engineering systems, including elastic compression behavior of woven fabric composites 11,12 and the design of composite flywheels stacked from circular twill woven fabric rings. 13
Depending on the fiber orientation, fiber-reinforced composites have anisotropic physical properties. Therefore, fiber-reinforced composites have also been analyzed for optimal structure design to improve their physical properties. Genetic algorithms (GAs) are often used to investigate optimal composite structures. GAs are global optimization algorithms introduced by John Holland as a computational model based on the evolution of the natural world. 14 Applications of GA with regard to optimizing composite structures include searching for optimal lamination structures to improve the mechanical properties of composites. 15,16 Kim et al. 17 used a GA to improve the thermal conductivity of woven fabric composites, and Kudela et al. 18 identified elastic constants in the stiffness tensor of woven-fabric-reinforced composites using a GA and wave dispersion curves. Another example is a study that used a micro-GA to optimize the design of a filament winding composite cylinder. 19
To date, most of the research on the optimization of fiber-reinforced composites have focused on the laminate structure consisting of unidirectional fiber composites for each layer. In addition, several numerical studies on woven fabric composites have focused on providing micromechanics models to predict the mechanical properties. Research on structural optimization by improving composite mechanical properties is necessary as a next step in the numerical analysis of woven fabric composites. Therefore, this article aims to find the optimal structure of woven fabric composites to improve their mechanical properties and provide a new approach using a micromechanics model of woven fabric composites and GA. Moreover, the mechanism of connection between the optimized composite structures and the mechanical properties of the composites will be studied. The findings of this research are expected to be an excellent resource for structural designers and engineers in the woven fabric composites industry.
Modeling approach
This study involved the modeling and optimization of the structural design for the improvement of the elastic modulus of woven fabric composites. Two theoretical backgrounds have been used for the purpose of modeling the woven fabric composites to obtain the elastic modulus of the composites and structure optimization. Firstly, geometric structure modeling and elastic modulus prediction of woven fabric composites were performed using the micromechanics model proposed by Scida et al. 9,10 In this process, the fiber strands were regarded as unidirectional (UD) fiber composites, and the properties of these UD composites were obtained by the Mori–Tanaka micromechanics model. As mentioned previously, a GA was used for optimization. All numerical analyses in this study were performed using MATLAB (MathWorks Inc., Natick, Massachusetts, USA).
Woven fabric composites
Modeling for geometric structure of the woven fabric
Woven fabric composites consist of a continuously repeated small unit cell. Therefore, it can be assumed that the physical properties of the unit structure represent the properties of the woven fabric composites. The plain-woven composite shown in Figure 1 was used in this research, and the plain weave structure included fill and warp strands.

Structure of plain-woven fabric and off-axis angles θf and θw : (a) plain-woven fabric, (b) repeating unit cell, (c) cross section of AA line, and (d) cross section of BB line.
To predict the mechanical properties of the woven fabric composites, the structure of the woven fabric should be studied numerically first. The fill and warp strands of the plain weave were expressed by using equations (1) –(6). 9,10 The fill and warp strands consisted of fiber directions in the plane (0° and 90°) and off-axis angles (θf and θw ; see Figure 1). The off-axis angles expressed in equations (1) and (2) were the angles between the horizontal plane and the neutral line of the fill and warp strands, Hf and Hw , which were the expressions of the wave structure of the strands. Equation (3) represents the neutral line Hf of the fill strand. The thickness of the fill strand ef can be obtained by using equation (4).


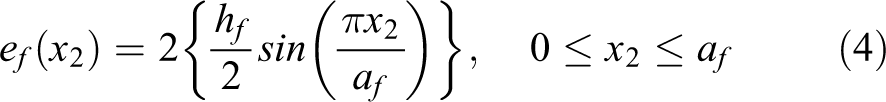
where hw and hf are the maximum thicknesses of the warp and fill strands, respectively; af and aucf are the widths of the fill strands and unit cell in the fill direction (x 1 direction), respectively. In the same way, the neutral line Hw and the thickness ew of the warp strands can be obtained by using the following equations:


where aw and aucw are the widths of the warp strands and unit cell in the warp direction (x 2 direction), respectively. In this study, the gaps between strands were not considered; as such gaps were 0 mm. Therefore, aucf and aucw were the same as the af and aw , respectively. The volume of a unit cell would be calculated as af × aw × (hw + hf ).
To obtain the elastic properties of woven fabric composites, the fiber volume fractions in the fill and warp strands should be considered. The strands can be regarded as UD composite materials that include fibers and a polymer matrix. The fiber volume fraction in the strands can be obtained by the following equation 9 :

where vf , vff , and vfw represent the volume fractions of the entire woven fabric composites, fill strand, and warp strand, respectively. V denotes the total volume of the woven composites; Vfst is the volume of the fill strand, while Vwst is the volume of the warp strand. If the volume fractions of the fill and warp strands are assumed to be the same, then equation (7) can be simplified as following equation:

where Vfs
is the fiber volume fraction in the strands. For reference, the volume ratio of the strand and unit cell
Micromechanics modeling for woven fabric composites
The mechanical properties of woven fabric composites can be obtained from the stiffness matrix of composite materials. 20 “Mechanical properties” here refer to the elastic properties, such as elastic modulus, Poisson’s ratio, and shear modulus. The stiffness matrix for orthotropic materials is shown in Appendix A, which is the inverse of the compliance matrix. To obtain a stiffness matrix of a woven fabric composite, the micromechanics model proposed by Scida et al. 9,10 was used. This micromechanics model employs the thin laminate theory, combining geometric and mechanical variables of the fill strand, warp strand, and matrix and also considers the undulation of the strands. As mentioned previously, because the woven fiber composites are composed of repeating unit cells, the mechanical properties of a unit cell can be reasonably regarded as the properties of the entire composite material. The mechanical properties of the unit cell can be obtained through the stiffness matrix of the cell, which adheres to the following process.
A unit cell consists of three constituents: fill strands, warp strands, and polymer matrix, as shown in Figures 1 and 2. The unit cell can also be considered as an aggregation of a small sliced cuboid element including the polymer matrix, warp strand, and fill strand, as shown in Figure 2. In this figure, the sides of the unit cell were separated into 10 pieces, in x 1 and x 2 axes to show the structure of the woven fabric composites. However, to reduce computational errors in the numerical analyses when obtaining the elastic modulus, the sides of the unit cells were cut into 100 pieces in x 1 and x 2 directions so that the unit cells contained 10,000 sliced cuboid elements.
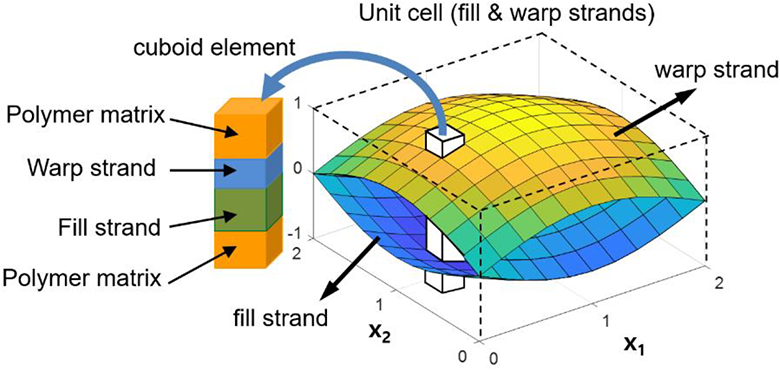
Unit cell of a computer-generated woven fabric composite and a sliced cuboid element.
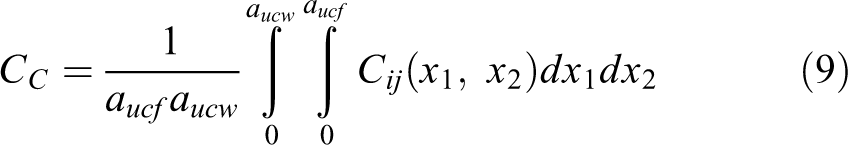
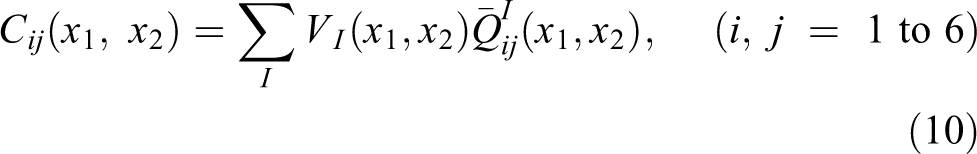
The stiffness matrix of the entire composite (CC ) is a stiffness matrix averaged over the unit cell and is expressed in equations (9) and (10). Equation (10) represents the stiffness matrix Cij (x 1, x 2) of a sliced element located at (x 1, x 2) in the composite. The stiffness matrix can be obtained by summing the stiffness matrices of the fill strand, warp strand, and the polymer matrix multiplied by each volume fraction in the sliced element. 10
where
Equation (11) represents the stiffness matrix

Herein,

where Cm and Cf represent the stiffness matrix of the polymer matrix and fiber, respectively, and Vmud and Vfud represent the volume fraction of the polymer matrix and fiber in the UD fiber composite, respectively. I denotes the unit matrix. The angle brackets (〈 / 〉) indicate the average of all fiber orientations in the composite. However, in a UD fiber composite, all the fibers are aligned in a certain direction. Therefore, the average value of the fiber direction will be specified in a certain direction. The dilute mechanical strain concentration matrix Af in equation (12) is represented as follows:

where S is the Eshelby tensor, the elements of which are shown in Appendix C. 23,24 Herein, the elements were for cylindrical inclusions, which were considered as glass fibers.
Model validation
Before beginning the numerical analysis, the reliability of the present numerical model used for woven fabric composites in this study should be addressed. To validate the present numerical model, Young’s moduli from the model were compared with those reported by Vandeurzen et al. 25 Figure 3 shows this comparison, and it can be concluded that the results were in good agreement. Thus, the numerical model used in this research was sufficiently built. It must be noted that, using the present model, Young’s moduli at fiber volume fractions higher than 0.4 were greater than those previously reported. 25 This is likely due to differences in the applied fiber distribution area; the fibers were previously set to be distributed evenly in each sliced region. 25 However, in the present model, the fibers of a sliced element were present only in the fill or warp strands. This meant that the fiber strands possessed higher fiber volume fractions, as calculated by using equation (8), than those of the sliced region with evenly distributed fibers. Figure 4(a), which is a photograph of the cross section of a woven fabric composite, supports this assumption by showing that the fibers are in the strands separated from the polymer matrix regions. Therefore, it is reasonable to assume that fibers are present only in the fill and warp strands.
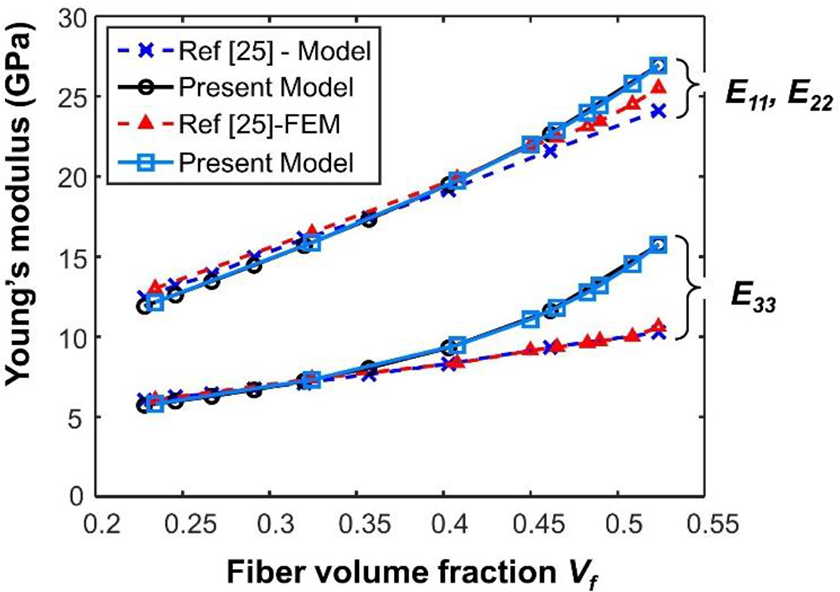
Comparison of Young’s modulus of woven fabric composites, E 11, E 22, and E 33, from the present model with those from reference. 25 E 11 and E 22 are the in-plane moduli of the woven fabric composites, and E 33 is the out-of-plane modulus of the woven fabric composites.

Woven fabric composites: (a) SEM image of the fractured region of a woven fabric composite manufactured by VARTM process and (b) the elastic moduli of the composites and fiber volume fraction of the strands versus fiber volume fraction of woven fabric composites. E 11 s is longitudinal modulus of the UD fiber strands, and E 22 s and E 33 s are the transverse moduli of the UD fiber strands. SEM: scanning electron microscopic; VARTM: vacuum-assisted resin transfer molding; UD: unidirectional.
Figure 4(b) shows the longitudinal and transverse elastic moduli of the strands, E 11 s , E 22 s , and E 33 s , and the volume fraction of the strand Vfs with respect to the fiber volume fraction Vf of the woven fabric composites. In the simulation, the fiber volume fractions of the fill and warp strands were considered to be the same. As shown in the figure, the E 22 s and E 33 s , the transverse properties of the strands increased nonlinearly, whereas E 11 s increased linearly. The strand V fs exceeded 0.6 when the Vf of the composite was greater than 0.4 and was even close to 1 at Vf values greater than 0.55. Therefore, it can be reasonably assumed that the stress field of each fiber overlaps with the stress fields of adjacent fibers in the strand at high V fs, which possibly explains why E 22 s and E 33 s increase nonlinearly when the Vf of the woven fabric composite is higher than 0.4. Furthermore, the increased E 33 s values affected the E 33 of the woven fabric composites and caused a nonlinear increase in E 33 at fiber volume fractions higher than 0.4, as shown in Figure 3. The parametric data used to obtain Figures 3 and 4(b) are shown in Table 1 and were obtained from reference. 25
Parameters used for validation of the model.25

E: elastic modulus; ν: Poisson’s ratio.
Genetic algorithm
GAs, created according to the theory of survival of the fittest in nature, are the parallel and global search algorithms. Typically, a GA consists of two major components: objective function and chromosome string. The objective function is an expression of the problem that the GA tries to solve. A chromosome string is a set of parameters that define a solution to the problem and is gradually transformed into better solutions. GAs produce artificially new offspring in the next generation through reproduction, crossover, and mutation of the chromosome strings, which can be compared to a natural chromosome (a biological genetic element). The suitability of each string is evaluated using an objective function, and strings with superior traits are induced to generate more offspring in the next generation. In this study, the chromosome strings were set in the following format:

Equation (15) shows the objective function for the maximization of the elastic modulus E of woven fabric composites. A chromosome string that produces a higher elastic modulus was considered to be a better string or superior trait.

For reproduction, the best string in the chromosome strings at each iteration was copied to the next generation. The crossover process was performed with two randomly selected chromosome strings, excluding the best and worst strings. For the first process, one of the numbers among 1, 2, or 3 was selected randomly. If “1” was selected, the crossover site would be between hw and hf in equation (14); if “2” was selected, the crossover site would be between hf and aw ; and in the case of “3,” the crossover site was between aw and af . A detailed explanation of the crossover has been provided in reference. 14 In this study, a new chromosome string was added to the system instead of the mutation process, that is, the worst string at each generation was replaced with a new randomly generated string. Herein, “randomly generated” means that the new string was generated with random numbers within the search region.
As explained previously, the GA in this work was modified from the standard GA. In the chromosome string, natural numbers were used instead of binary numbers, and the worst string was replaced with a new string instead of a mutation process. As a global search algorithm, the modified GA was computationally simple, worked well, and provided reasonable optimized results. No reduction in searching ability was observed compared to the standard GA, which is why the modified GA was selected in this work.
The procedure of the GA used in this study is summarized as follows and is shown in Figure 5.

The flow chart of the used in this study. GA: genetic algorithm.
Generate 20 chromosome strings with random numbers in the search area in Table 2. The random numbers are real numbers with two decimal places, and examples of the numbers are shown in Appendix D.
Generate the geometric structure of woven fabric composites using each chromosome string (equations (3) –(6) were used).
The mechanical properties of the woven fabric composites were obtained by using the micromechanics model in the “Woven fabric composites” section.
Process (2) and (3) are repeated to obtain all the mechanical properties of the composites with 20 chromosome strings.
Compare the best among the 20 strings (here, “best” means the one that best matches the objective function), with the best string in the previous generation stored as the best chromosome with the name “best-fit-string.” The better string between the two, which generated a higher elastic modulus, was stored as the best chromosome string.
The best string among the 20 chromosome strings that best matched the objective function was copied to the next generation.
The crossover process was performed with eight strings excluding the best and worst strings.
Replace the worst string with a newly generated chromosome string with random numbers in the search region.
If the best-fit string did not change during the computations over 100 iterations, the best-fit-string was set to be the best chromosome string for optimal structure with a high elastic modulus and ended the GA.
Repeat the process from (1) to (9) 10 times and obtain the mean and standard deviation (SD) of the thickness, width, and elastic modulus of the 10 optimized strings.
Figure 6 shows the GA convergence to maximize E 11 in case 1.
Five simulation cases and their search area.

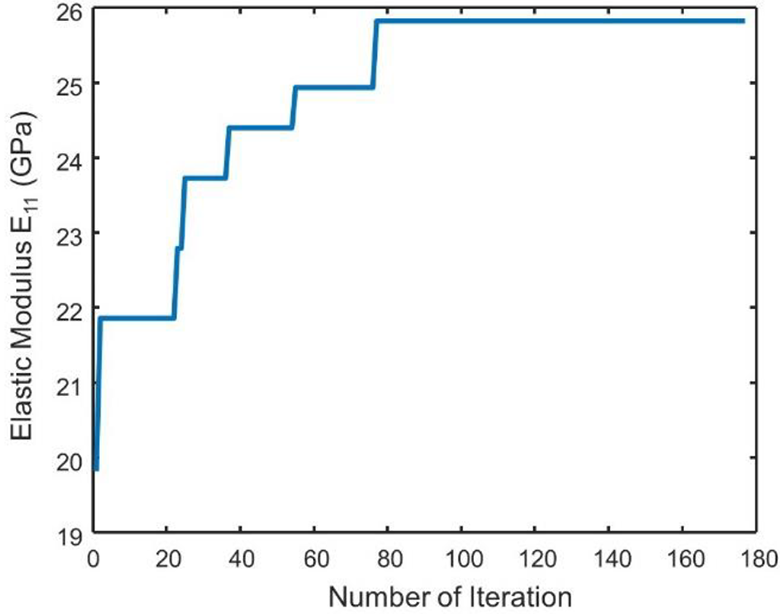
GA convergence for E 11 in case 1. GA: genetic algorithms.
Results and discussion
In the numerical analysis, E-glass fiber and epoxy composites were employed. Young’s modulus and Poisson’s ratio of the glass fiber were assumed to be 72.5 GPa and 0.2, respectively. For epoxy resin, 2.36 GPa and 0.33 were used as Young’s modulus and Poisson’s ratio, respectively. 26 –29 The fiber volume fraction of the plain-woven fabric composites was selected as 0.4, which originated from references. 8,10,30 –33 The fiber volume fractions of woven fabric composites can vary according to the manufacturing processes and application field; however, we wanted to analyze the mechanical behavior with a certain representative fiber volume fraction to eliminate certain redundant case studies. Therefore, we searched the relevant literature and verified that the fiber volume fractions of the woven fabric composites studied in refs 8,10,30 –33 were in the 0.3–0.5 range, which substantially encouraged us to assume 0.4 as the representative fiber volume fraction of the woven fabric composites investigated in this research. Furthermore, the fiber volume fraction of a woven fabric composite is directly related with the fiber volume fraction of the strands. Herein, the latter was determined to be 0.6283, which was within the 0.5–0.75 range that has been previously reported for the fiber volume fractions of the strands studied in the abovementioned works. 8,10,30 –33 For these reasons, values of 0.4 and 0.6283 for the fiber volume fractions of the woven composite and strands, respectively, seem reasonable as representative fiber volume fractions; hence, 0.4 was chosen as the fiber volume fraction of the woven fabric composite in this research.
Five cases were set up for the numerical simulation, and Table 2 presents the search areas and conditions for each case. Case 1 was used to search for an optimal structure within the search area; cases 2 and 3 were used to search for optimal structures with fixed thickness and width of strands, respectively. Case 4 was optimized with a fixed cross section of the warp strand. In case 5, the two thicknesses, hw and hf , were dependent on each other, and the two widths, aw and af , were also interdependent, a decision made for the purpose of investigating the limited thickness and width of the composites. Because of these interdependencies, the crossover operation in the GA was not performed for case 5.
To maximize the elastic modulus of the woven fabric composites in the GA, three elastic moduli E 11, E 22, and E 33 and their summation E 11 + E 22, E 11 + E 33, E 11 + E 22 + E 33 were employed. The sign “+” implies summation with equal priority. For example, if E 11 + E 22 was used as the objective function in GA, both E 11 and E 22 were maximized with equal priority, thereby improving both the elastic moduli simultaneously. However, if there was a dominant modulus among the moduli, the dominant modulus showed priority automatically. For example, in E 11 + E 33, E 11 is the dominant property; therefore, the geometry of the woven fabric composites would be affected more by E 11 than E 33. The relevant case studies are provided as follows.
Analysis of case 1
Table 3 presents the simulation results of case 1, and Figure 7 illustrates the representative geometries for improved elastic moduli. For E 11, thick and long fill strands (large hf and aw ) generated a higher elastic modulus than the other geometries (see Table 3 and Figure 7(a)–(c)); as E 11 was larger, the volume of fill strands was larger. The fibers of the fill strand were aligned along the x 1 axis, while the fibers of the warp strand were aligned along the x 2 axis, which was transverse to x 1. Since the strands were regarded as UD composites, as mentioned previously, the longitudinal elastic modulus of the strands was significantly larger than the transverse elastic modulus. The thickness of the warp strand was less, which implied that the undulation of the fill strand was small. If a strand showed large undulations, the degree of alignment of the fibers in the x 3-axis increased, causing a reduced in-plane elastic modulus (here E 11) and increased out-of-plane modulus E 33. As a result, to increase E 11 of the woven fabric composites, the fill strand should have a large cross-sectional area (large width and thickness) and a long length with low undulation. In Table 3, the width of the fill strands af shows a relatively larger SD than that of the other variables (Table D.1 in Appendix D for the individual optimized geometry data). The larger the af , the larger the E 11 would be. However, a large af could also mean that the composites have long warp strands, which could be a possible explanation for the relatively small E 11 in a unit volume. E 11 is the average, based on the strand volume fractions of the longitudinal elastic modulus of the fill strands and the transverse elastic modulus of warp strands. The transverse properties of the strands were much lower than the longitudinal properties; these contradictory properties generated large strand deviations throughout the 10 repeated simulations.
Optimization results with case 1.

E-M: elastic modulus; SD: standard deviation.
aGray-highlighted rows correspond to the average ± SDs of data Nos 1, 3, 6, and 10 in Table D.2; nonhighlighted rows for E 11 + E 22 + E 33 correspond to data Nos 2, 4, 5, 7, and 8 in Table D.2. Data from No. 9 in Table D.2 were not used to obtain the averages or SDs of the two separated geometries specified (see Table D.2).
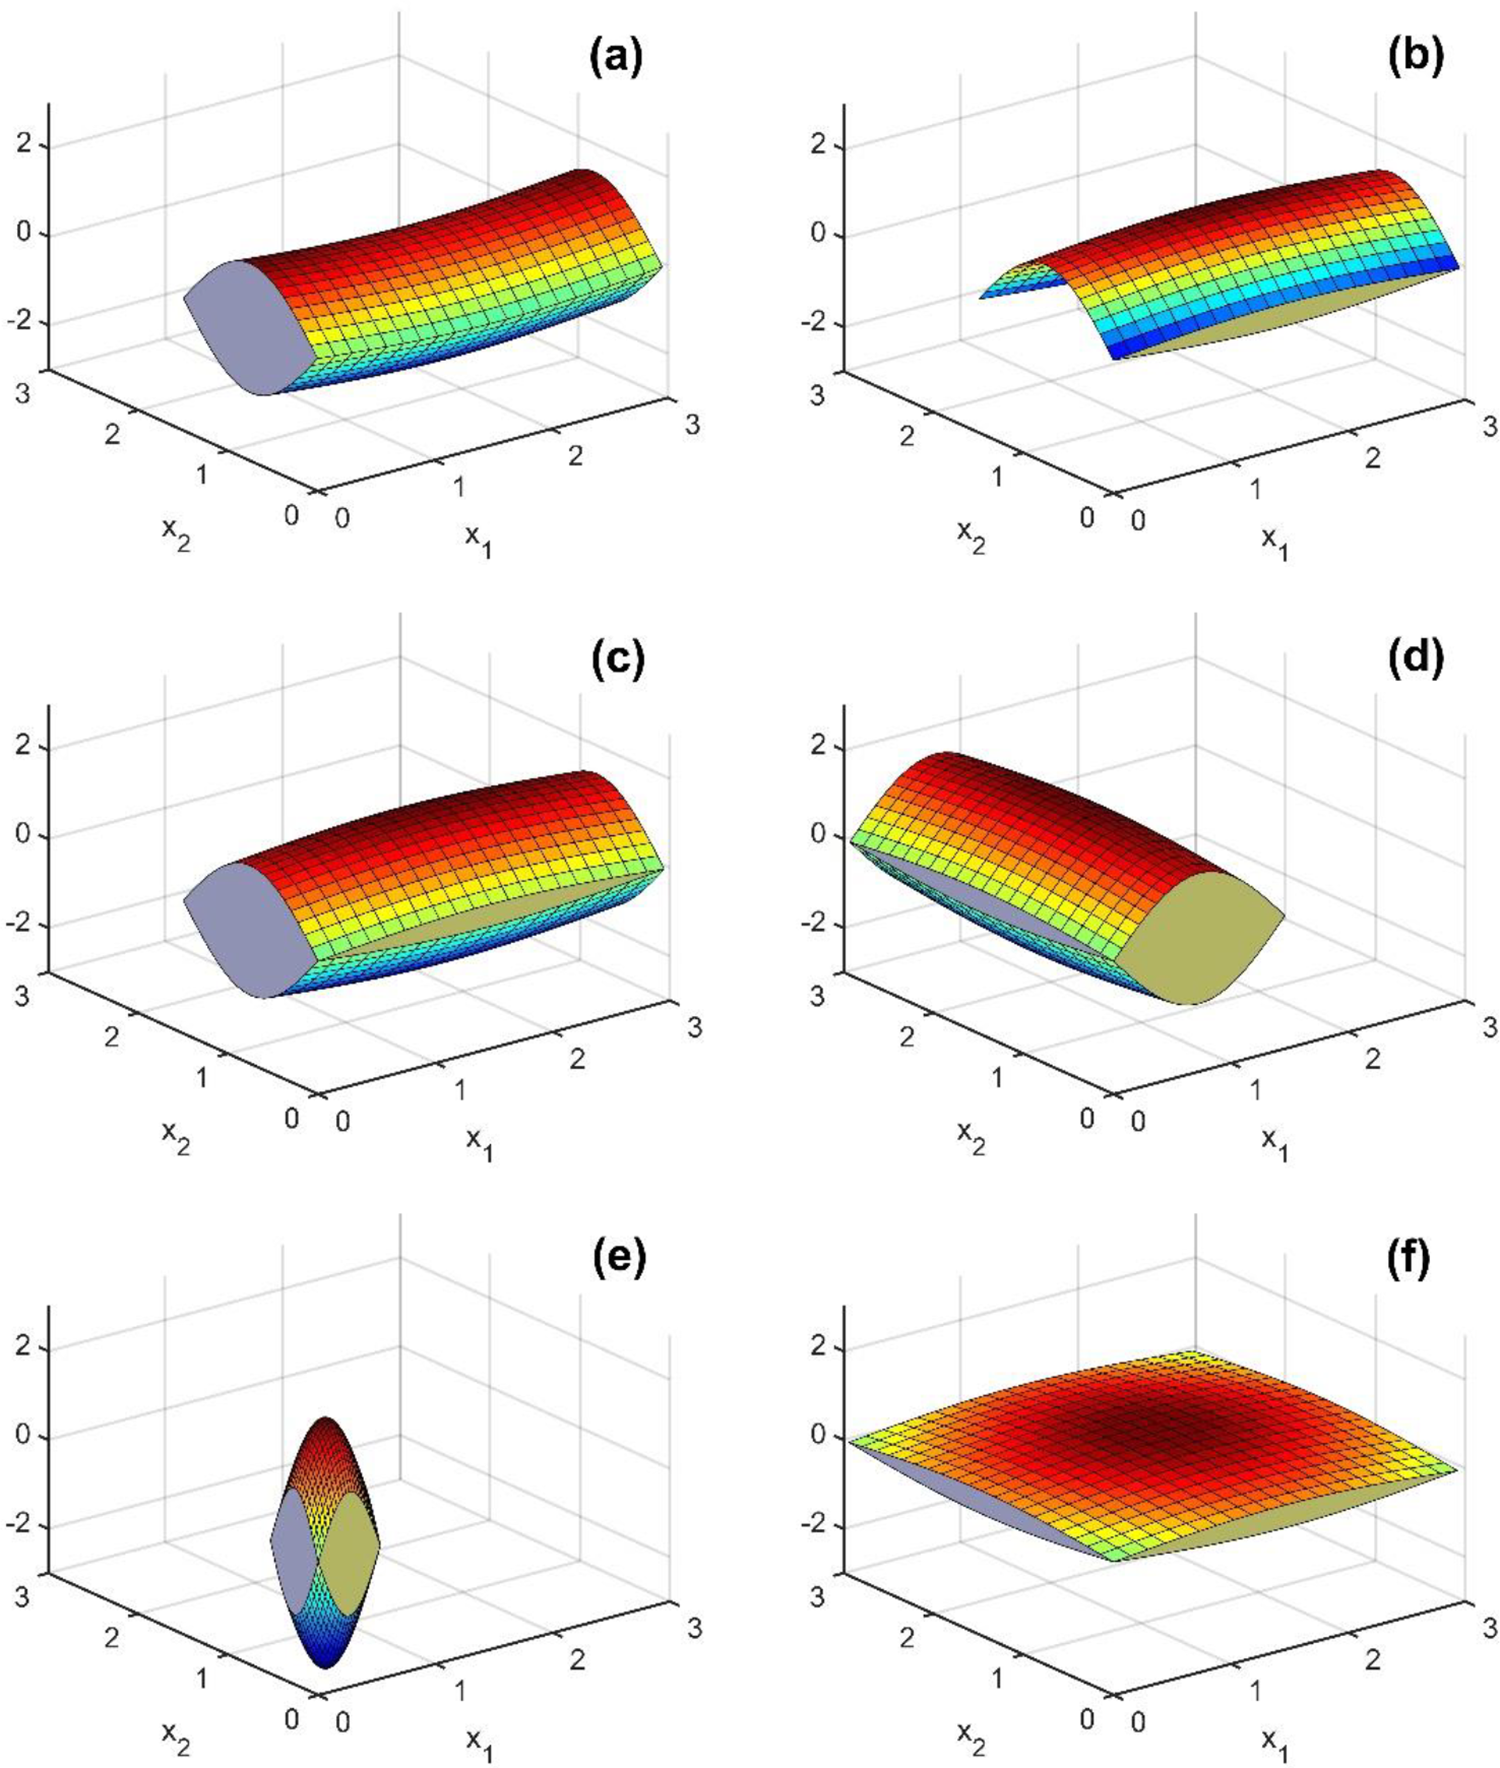
Fill and warp strand drawings with best-fit-strings in case 1: (a) fill strand for E 11, (b) warp strand for E 11, (c) fill and warp strand for E 11 (hw = 0.5 mm, hf = 2.92 mm, aw = 2.95 mm, af = 1.5 mm, E 11 = 25.9 GPa), (d) fill and warp strand for E 22 (hw = 2.94 mm, hf = 0.5 mm, aw = 1.46 mm, af = 2.93 mm, E 22 = 25.9 GPa), (e) fill and warp strand for E 33 (hw = 2.8 mm, hf = 2.85 mm, aw = 0.53 mm, af = 0.53 mm, E 33 = 26.3 GPa), and (f) fill and warp strand for E 11 + E 22 (hw = 0.51 mm, hf = 0.52 mm, aw = 2.93 mm, af = 2.94 mm, E 11 + E 22 = 35.5 GPa).
For E 22, the data showed the opposite result to those of E 11, indicating thick and long warp strands (large hw and large af , Figure 7(d)). The same explanation for E 11 can be applied to E 22. To increase E 22, the volume of the warp strand should be as similarly large as the volume of the fill strand for E 11. In the case of E 33, it was shown that the large thickness and small width in the x 1 and x 2 axes improved the elastic stiffness in the x 3 axis (Table 3 and Figure 7(e)). This was because the small width and large thickness increased the degree of fiber alignment along the x 3 axis. Meanwhile, the modulus of E 33 in Table 3 was slightly larger than those of E 11 and E 22. In E 33, the fiber alignment of both fill and warp strands increased, which meant that the two strands contributed to the improvement of E 33, unlike E 11 and E 22. This might explain the higher elastic modulus of E 33.
In the case of E 11 + E 22, it was shown that the thickness and width of strands were small and large, respectively, as shown in Figure 7(f). Thus, the fabric appeared thin and flat, which was due to the equal priority of E 11 and E 22. The thin and wide strands indicated the low waviness of the fibers or their high in-plane alignment, resulting in a high in-plane elastic modulus. The results of E 11 + E 33 were similar to those for E 11, showing that the fill strand was thick and long, and the warp strand was relatively thin. This was caused by the dominance of E 11 in E 11 + E 33. E 11 was the axial component of the fiber and E 33 was a vertical component of the fiber direction; therefore, E 11 was the dominant property. In the E11 + E22 + E33 scenario, the optimized geometries were divided into two categories as illustrated in Table 3: a large warp strand with a small fill strand (highlighted in gray) and a small warp strand with a large fill strand (nonhighlighted). The individual optimized geometry data are provided in Table D.2, Appendix D.
Analysis of case 2
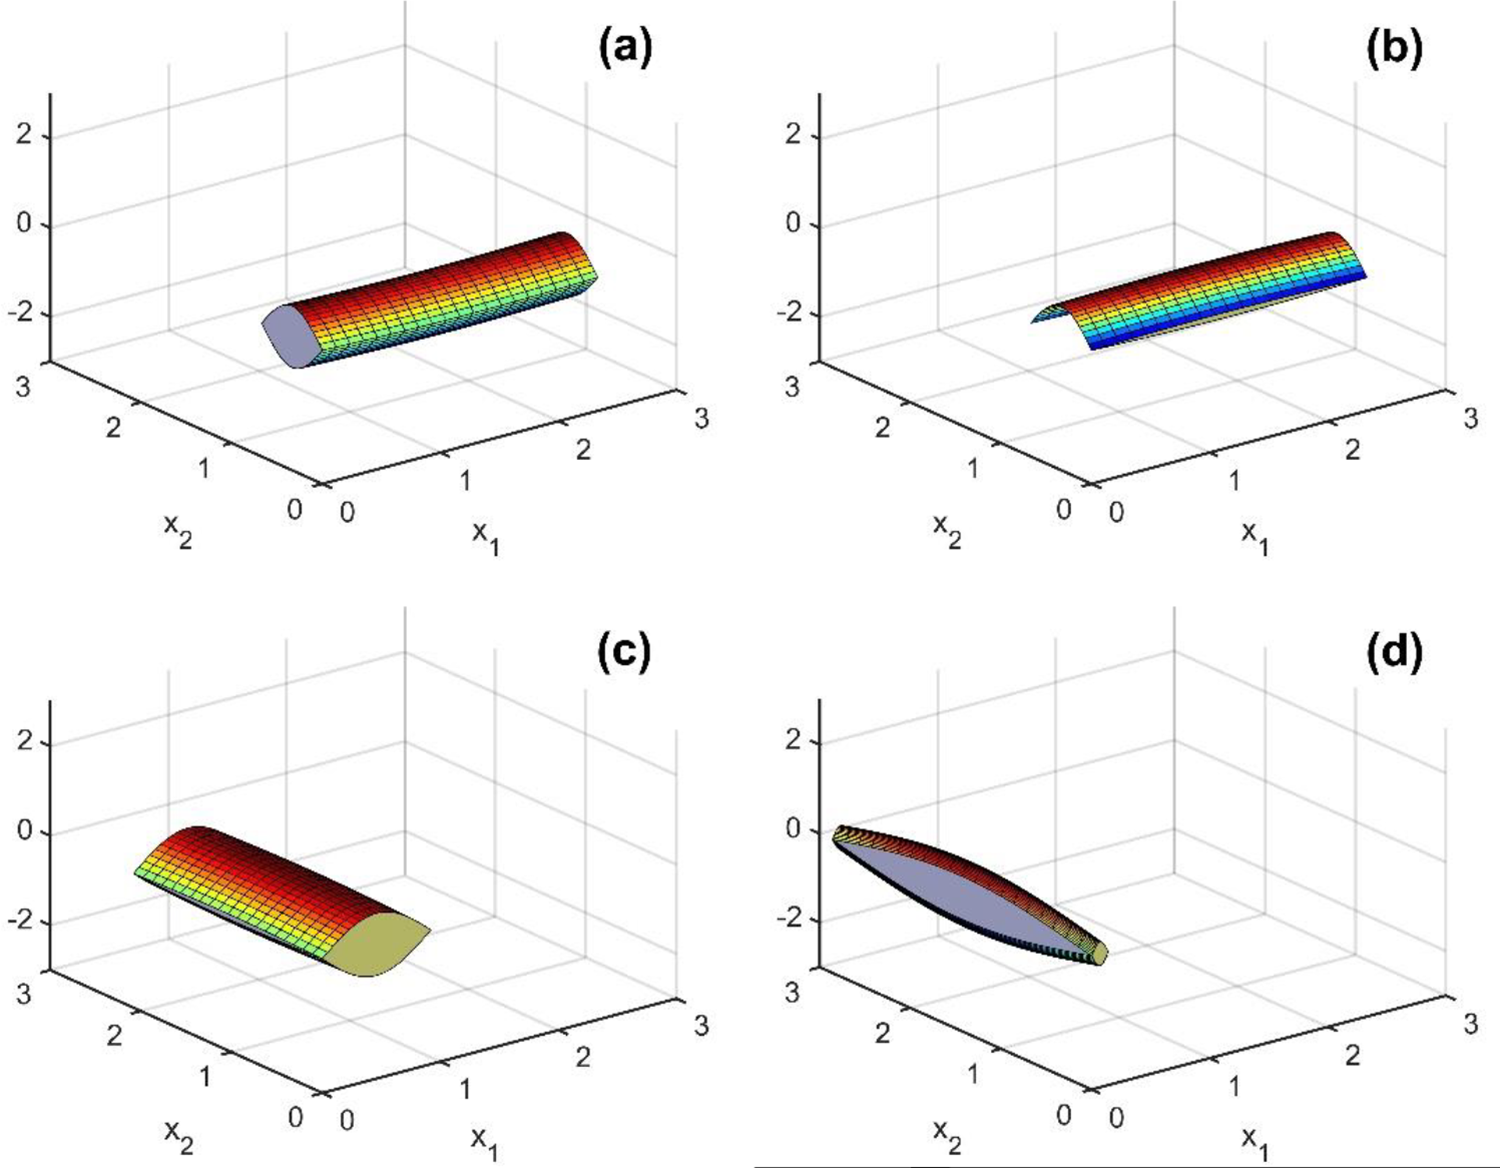
Table 4 presents the optimization results for case 2, in which the thicknesses of the strands, hw and hf , were fixed at 0.5 mm. The widths of the strands, aw , and af , were between 0.5 and 3 mm. With the fixed thicknesses, the length of the strands should have been longer to increase the elastic modulus in the x 1 and x 2 directions. For example, to increase E 11, the composites should have wide cross sections of warp strands (large aw ) and narrow cross sections of fill strands (small af ), which means long fill strands and short warp strands (Figure 8(a)). As mentioned previously, a wide warp strand would lead to a long fill strand in the x 1 direction and longitudinal direction of the fill strand, so that the fabric composite would be stiffer in the x 1 direction (E 11 direction). The wider the warp strand with a fixed thickness, the smaller the degree of alignment along the x 3 axis on the entire fill strand, which also contributed to the improvement of E 11. With regard to the width of the cross section of the fill strands, both advantages and disadvantages exist for a large E 11. Narrow fill strands might cause a decrease in E 11 in the x 1 direction but could form a short warp strand to enhance the overall E 11 per unit volume, thereby increasing the density of E 11 per unit volume. Therefore, the width of the fill strand should be compromised, meaning that a narrow width of the fill strands is preferable in this case. However, to obtain a large E 22, the composites should have narrow cross sections of warp strands (small aw ) and wide cross sections of fill strands (large af ). The results can be explained using the result analysis of E 11 with the change in the perpendicular direction. In the case of E 33, as in Table 3 in case 1, having a width as small as possible increased the degree of fiber alignment in the x 3 direction, which led to an increase in E 33 (Figure 7(e)). The same explanation could be applied to case 2 with the fixed hw and hf (Figure 8(b)). The results of E 11 + E 22 showed that the two strands were as wide as possible. In addition, wide strands with a fixed thickness reduced the fiber alignments along the x 3 direction, which contributed to increasing the in-plane moduli, E 11 and E 22. For E 11 + E 33, E 11 was the dominant property as explained in case 1. Therefore, the geometry for E 11 + E 33 was similar to that of E 11, indicating a wide aw and narrow af . The geometry for the improvement of E 11 + E 22 + E 33 was notably similar to that of E 11 + E 22, due to the dominance of the in-plane properties as compared to the out-of-plane properties.
Resultant geometry and elastic modulus in case 2.


Fill and warp strand drawings with best-fit-strings in case 2: (a) fill and warp strand for E 11 (hw = 0.5 mm, hf = 0.5 mm, aw = 2.99 mm, af = 0.54 mm, E 11 = 18.2 GPa) and (b) fill and warp strand for E 33 (hw = 0.5 mm, hf = 0.5 mm, aw = 0.51 mm, af = 0.52 mm, E 33 = 12.3 GPa).
Analysis of case 3
Table 5 presents the thickness variations in the case of a fixed width of 2 mm to improve elastic modulus. Thick fill and thick warp strands generated an improved modulus, as shown in the cases of E 11 and E 22, respectively (Figure 9(a) and (b)). Because of the increased undulations for E 33, the property in the x 3 direction was increased when both fill and warp strands were thick (Figure 9(c)). However, to increase E 11 + E 22, thin strands would be preferable as they increase the degrees of fiber alignment in the x 1 and x 2 axes, thereby reducing the strand’s undulations (Figure 9(d)). For E 11 + E 33, the thick fill strand, which was aligned along x 1 axis, helped improve the summation of the elastic moduli E 11 + E 33 due to the dominancy of E 11. The geometry for E 11 + E 33 was notably similar to that of E 11. The results of E 11 + E 22 + E 33 were similar to those of E 11 + E 22 because E 33 was the transverse direction of fiber and relatively small when compared to E 11 and E 22.
Resultant geometry with case 3.


Fill and warp strand drawings with a best-fit-string for each optimization in case 3: (a) fill and warp strand for E 11 (hw = 0.51 mm, hf = 2.81 mm, aw = 2.0 mm, af = 2.0 mm, E 11 = 24.1 GPa), (b) fill and warp strand for E 22 (hw = 2.86 mm, hf = 0.51 mm, aw = 2.0 mm, af = 2.0 mm, E 22 = 24.2 GPa), (c) fill and warp strand for E 33 (hw = 2.98 mm, hf = 2.96 mm, aw = 2.0 mm, af = 2.0 mm, E 33 = 16.6 GPa), and (d) fill and warp strand for E 11 + E 22 (hw = 0.51 mm, hf = 0.53 mm, aw = 2.0 mm, af = 2.0 mm, E 11 + E 22 = 33.6 GPa).
Analysis of case 4
In case 4, the thickness and width of the warp strands were fixed as 1 and 2 mm, respectively (see Table 6 and Figure 10). In this case, while the thickness hf and width af of the fill strand were not fixed, the length of the fill strands was almost fixed owing to the fixed aw . The resulting geometry was separated into two types: thick and narrow fill strands for E 11, E 33, and E 11 + E 33 and thin and wide fill strands for E 22, E 11 + E 22, and E 11 + E 22 + E 33.
Resultant geometry with case 4.


Fill and warp strand drawings with a best-fit-string in case 4: (a) fill and warp strand for E 11 (hw = 1 mm, hf = 3.0 mm, aw = 2 mm, af = 0.61 mm, E 11 = 17.9 GPa), (b) fill and warp strand for E 22 (hw = 1 mm, hf = 0.51 mm, aw = 2 mm, af = 2.99 mm, E 22 = 21.6 GPa), (c) fill and warp strand for E 33 (hw = 1 mm, hf = 1.43 mm, aw = 2 mm, af = 0.5 mm, E 33 = 14.0 GPa), and (d) fill and warp strand for E 11 + E 22 (hw = 1 mm, hf = 0.51 mm, aw = 2 mm, af = 2.95 mm, E 11 + E 22 = 33.0 GPa).
To improve E 11, a thick fill strand would effectively increase the volume of the fill strand, as presented in Table 6 and Figure 10(a). However, the small width of the fill strand would also improve the modulus E 11 per unit volume because the small width of the fill strand would contribute to the length reduction of the warp strand whose fiber direction is perpendicular to the direction of E 11. For E 33, a small af would increase the waviness of warp strands, thus increasing the degree of fiber alignment in x 3. The thickness of the fill hf converged to approximately 1.41 mm with the condition of 1 mm for hw and 2 mm for aw . The resultant geometry for E 11 + E 33 was notably similar to that of E 11 due to the dominance of E 11.
To increase E 22, it would be better to make the af large and hf as thin as possible. Because a large af would generate a long warp strand, the volume of warp strand would also be large. Thin hf would indicate that a small waviness of warp strands could contribute to the increase in E 22. Thin hf and large af were also beneficial for the improvement of E 11 + E 22, and the explanation for E 22 can also be applied here. The result of E 11 + E 22 + E 33 was similar to that of E 11 + E 22, with small hf and large af .
Analysis of case 5
The optimized results of case 5 were similar to those of case 1. The difference between the two is that in case 5, the thicknesses were interdependent variables, as were the widths, as specified in Table 2. Because of this difference, while the two case results are similar, they do not match. In addition, owing to the interdependencies in case 5, the optimized values converged to local values in several cases.
E 11 possesses large volumes of fill strands with large values of hf and aw (Figure 11(a) and (b)). E 22 meanwhile shows large volumes of warp strands with large values of hw and af (Figure 11(c)). The results of E 33 were interpreted as two separate categories: a thin, long fill strand with a thick, short warp strand (highlighted in gray in Table 7), and a thick, short fill strand with a thin, long warp strand (nonhighlighted data in Table 7 and illustrated in Figure 11(d)). This behavior originated from the respective interdependencies of the thicknesses and widths. The gray-highlighted E 33 data in Table 7 were the average values obtained from data Nos 1, 2, 4, 6, and 10 in Table D.3 (the gray-highlighted data); accordingly, the nonhighlighted average E 33 values in Table 7 were obtained from data Nos 3, 5, 7, 8, and 9 in Table D.3.
Results with case 5.

Fill and warp strand drawings with best-fit-strings in case 5: (a) fill strand for E 11 (hw = 0.12 mm, hf = 1.38 mm, aw = 2.33 mm, af = 0.67 mm, E 11 = 28.8 GPa), (b) warp strand for E 11, (c) fill and warp strand for E 22 (hw = 1.39 mm, hf = 0.11 mm, aw = 0.92 mm, af = 2.08 mm, E 22 = 28.9 GPa), and (d) fill and warp strand for E 33 (hw = 0.53 mm, hf = 0.97 mm, aw = 0.14 mm, af = 2.86 mm, E 33 = 18.4 GPa). Fill strand is thick and short and warp strand is thin and long.
Similarly, the results of E 11 + E 22 were categorized into two distinctive geometries, which are illustrated in Tables 7 and D.4: warp strands with a larger volume than that of the fill strands (highlighted in gray) and vice versa. As mentioned previously, this was likely to be caused by the two interdependencies between the two thickness variables, hw and hf , and between the two width variables, aw and af . The average large-warp strand values (highlighted in gray in Table 7) were obtained from data Nos. 1, 2, 4, 7, 9, and 10 in Table D.4; accordingly, the average large-fill strand values (the nonhighlighted data in Table 7) were obtained from data Nos. 3, 5, 6, and 8 in Table D.4.
For E 11 + E 33, the fill strands were larger than the warp strands, as shown in the previous cases. Because E 11 and E 22, the two in-plane properties, dominate over E 33, the out-of-plane property, the E 11 + E 22 + E 33 results are similar to E 11 + E 22, which correspond to either larger volumes of warp strands (highlighted in gray in Tables 7 and D.5) or larger volumes of fill strands (the nonhighlighted data).
Conclusions
This research studied the structure optimization of woven fabric composites to improve their mechanical properties, particularly the elastic modulus. A micromechanics of woven fabric composites was used to obtain the mechanical properties of the fiber composite, and a GA was employed as the optimization tool. The structure of the fabric fiber was expressed using the width, thickness, and wave pattern of the fiber strands in the woven fabric composites. In the GA, the chromosome string consisted of the thicknesses and widths of the fill and warp strands, and the objective function was determined to maximize the elastic modulus of the composite.
The strands in the woven fabric composites can be considered as UD composites with high elastic modulus in the longitudinal direction of fibers and low elastic modulus in the transverse direction of the fibers. Therefore, it would be better to have a high volume of strands with large widths and thicknesses in a unit cell to increase the related longitudinal elastic modulus, such as a large volume of fill strand for E 11 and a large volume of warp strand for E 22. Reducing the waviness also contributed to the improvement of the in-plane elastic modulus, thin warp strand for E 11, and the thin fill strand for E 22. For high E 33 in the x 3 or z-axis, it was preferable to create large strand waviness so that the strands had a notably greater thickness and narrow width. The large waviness of the strands indicated that the degree of fiber alignment in the x 3 axis increased. The resulting geometry for E 11 + E 22 was thin and wide, resulting in a high elastic modulus in the plane. Due to the dominance of E 11, the results for E 11 + E 33 were similar to those for E 11. In case 5, the two thicknesses, hw and hf , were interdependent variables, and so were the two widths, aw and af . Despite the divergence of the E 33 and E 11 + E 22 values between cases 1 and 5, which stemmed from these respective interdependencies of the two thickness variables and the two width variables in the latter case, these two cases generally demonstrated similarities in regard to their optimized geometry results.
In summary, to improve the in-plane elastic modulus, the resulting geometry of the composites should include large volumes of related strands and a small waviness of the strand. However, for the out-of-plane elastic modulus, the numerical results generated large waviness of the strands, which contributed to the fiber alignment in the out-of-plane direction.
The findings of this research are expected to provide an excellent basis and insight for the design of woven fabric composites to improve specific mechanical properties in a certain direction. Future works will involve the designing and analysis of optimal structures with fiber volume fractions other than 0.4. Additional GA search areas, which were not considered in this article, could also be included as a part of our future works, along with analyses on Poisson’s ratio and shear modulus. Such extensions of this research will allow abundant data to be provided to designers using fiber-reinforced composites, such as in the aerospace, automobile, or sporting industries.
Footnotes
Declaration of conflicting interests
The author(s) declared no potential conflicts of interest with respect to the research, authorship, and/or publication of this article.
Funding
The author(s) disclosed receipt of the following financial support for the research, authorship, and/or publication of this article: This work was supported by Youngsan University Research Fund of 2020.