
Abstract
Multiscale-reinforced polymers offer enhanced functionality due to the three different scales that are incorporated; microfiber, nanofiber, and nanoparticle. This work aims to investigate the applicability of different polymer-based nanofabrics, fabricated via electrospinning as reinforcement interlayers for multilayer-fiber-reinforced polymer composites. Three different polymers are examined; polyamide 6, polyacrylonitrile, and polyvinylidene fluoride, both plain and doped with multiwalled carbon nanotubes (MWCNTs). The effect of nanotube concentration on the properties of the resulting nanofabrics is also examined. Nine different nanofabric systems are prepared. The stress–strain behavior of the different nanofabric systems, which are eventually used as reinforcement interlayers, is investigated to assess the enhancement of the mechanical properties and to evaluate their potential as interlayer reinforcements. Scanning electron microscopy is employed to visualize the morphology and microstructure of the electrospun nanofabrics. The thermal behavior of the nanofabrics is investigated via differential scanning calorimetry to elucidate the glass and melting point of the nanofabrics, which can be used to identify optimum processing parameters at composite level. Introduction of MWCNTs appears to augment the mechanical response of the polymer nanofabrics. Examination of the mechanical performance of these interlayer reinforcements after heat treatment above the glass transition temperature reveals that morphological and microstructural changes can promote further enhancement of the mechanical response.
Keywords
Introduction/Background
Fiber-reinforced polymer composites (FRPs) and multiscale-reinforced composites have been receiving increasing attention and demonstrating potential as nanotechnology products in the past decade. These nano-enabled composites are distinguished by the embedded nanoscale entities present in the final composite. Nanoscale entities have been targeted for multiscale reinforcements to enhance the performance of FRPs and to expand the multifunctionality of such composite materials. These multiscale-reinforced polymers owe their augmented functions in the synergistic effect of three different phases: the polymer matrix, the fibers that form a macroscale reinforcement, and the nanoscale reinforcement. 1 –4
Introduction of nano-entities in FPRs results in enhancement of matrix-dominated and interface-dominated mechanical properties as well as out-of-plane properties of composites. 1,5 –8 The associated electrical and thermal properties are also altered with addition of nano-reinforcements. However, one of the most attractive enhancements that such nano-enabled composites offer is the inhibition of delamination, which is one of the critical defects met in these structures. 2,9 –11
Several approaches to achieve the above benefits can be identified from the relevant literature. The main challenge highlighted is their incorporation through existing manufacturing infrastructure. Two main embodiment routes can be identified: the nano-enabling of the polymer matrix phase via homogeneous dispersion of nano-entities and the embodiment of preformed nano-enabled assemblies in between the laminas. The introduction of a nanophase and the approach selected for its implementation in the manufacturing sequence have a crucial effect on the fiber volume fraction and thus on the final properties of the composite. 1,3,12,13
Nano-enabling of the polymer matrix involves adequate and homogeneous dispersion of nanofillers, for example, carbon-based nano-entities such as carbon black or carbon nanotubes (doped resin matrices). The efficient enhancement of associated properties is strongly affected by the degree of dispersion, adequate impregnation within the matrix, and appropriate interfacial adhesion between the nano-entities and the carrier polymer matrix. The latter is pivotal with regards to the stress transfer mechanism realized via the interface between the fillers and the polymer matrix. 12 The aforementioned method of nano-reinforcement of FRPs is considered beneficial in terms of its straightforward implementation in the manufacturing process, specifically in the first stage of raw material formation. 1 Nevertheless, addition of nanoparticles in the polymer matrix is associated with increased viscosities 3 inhibiting interfacial adhesion, 14 as well as formation of dry spots 15 and inconsistencies in the final structure, 16 including lack of control in the fiber volume fraction during manufacturing. 2 Another major drawback is filtration of nano-reinforcements by the fiber bed, resulting in insufficient dispersion of the nano-entities and local concentration gradients. 3,13,14
Preformed nano-enabled assemblies constitute another method to introduce the nanoparticle phase in the final composite. Prefabricated films or mats, fabrics, or veils that containing nanoparticles can be used to introduce a nano-reinforcement in the final cured composite. 17 –20 Introduction of such preforms occurs at the lamination stage and does not significantly disrupt the manufacturing sequence. 1,21 Such preformed assemblies are typically thermoplastic and can be used to enhance mechanical and electrical properties. 2,22 –24 Nano-enabled fabrics have affected both the enhancement of interlaminar strength and matrix-dominated properties, as well as on altering out-of-plane properties due to the presence of nanoparticles.
Comparing the two approaches, nanofabrics offer a facile solution in terms of their incorporation in existing production infrastructure. Their introduction can be realized at the layup or lamination stage in both prepreg/autoclave manufacturing processes, as well as hand layup or resin transfer molding. Problems associated with aggregation of nanoparticles leading to inhomogeneous dispersion in the polymer matrix and modification of physical properties (viscosity) observed, render the use of preformed nanofabrics more beneficial compared with direct incorporation of nanoparticles in the matrix. 3,14,21 Nanofabrics are typically fixed on the main fiber bed physically or chemically. Interfacial adhesion between the polymer matrix and the nano-entities and filtration of the nano-reinforcements does not pose a challenge in the case of nanofabrics. 23,24
Nanofabrics with embedded nanoparticles fabricated by thermoplastic polymers tend to have fiber diameters of the order of micrometers or nanometers. Thus, along with the main fiber bed having dimensions within the millimeter range, they offer reinforcement at three different scales, forming hierarchically structured materials. In addition, nanofabrics bridge the two suggested approaches: nanoparticle-doped polymer matrices and interlaminar reinforcement, thus forming hybrid structures.
In this work, three polymers are employed to produce nanofabrics, both plain and with incorporation of multiwalled carbon nanotubes (MWCNTs), to assess their performance as interlayer reinforcements. The intrinsic fractal geometry of these nanofabrics offers reinforcement in multiple scales, mimicking the geometry of feathers. As a true biomimetic example, it employs inspiration from nature to serve multifunctionality 25 by combining both enhancement of associated properties and ultimately weight reduction of the final composite parts on the basis of performance. 2,4 Here, electrospun polyamide, polyvinylidene fluoride (PVDF) and polyacrylonitrile are examined to identify potential novel reinforcement interlayers for FRPs.
Experimental procedures
Fabrication of reinforcement interlayers (nanofabrics)
Three different polymers are employed to fabricate the interlayer reinforcement fabrics. Polyamide 6 (or Nylon 6, PA6), polyacrylonitrile (PAN) and PVDF were (produced by BASF [Ludwigshafen, Germany]) to form nanofabrics, plain, and with nano-reinforcements. The selected nano-reinforcement system is a commercially available distribution of MWCNTs (with purity by weight at 95%), due to their intrinsically high mechanical properties and their potential for enhancement of the corresponding mechanical properties in composite structures. 26 MWCNTs have been produced through chemical vapor deposition and present at an average diameter of 10–40 nm and length of 1–25 µm. MWCNTs are used in different concentrations to investigate the effect of nanoparticle concentration in the final properties of nanofabrics and to identify an optimal concentration for maximum reinforcement of the final nanofabric. To identify this optimum concentration, the saturation point of MWCNTs in each of the three polymer solutions has been identified.
PA6 solutions are prepared by dissolving PA6 pellets in two solvents: formic acid (≥98% purity, Honeywell Fluka [Specialty Chemicals in Seelze, Germany], Thermo Fischer Scientific, Massachusetts, USA.) and acetic acid (≥99% purity, Sigma Aldrich, Misouri, USA) are used to dissolve PA6 pellets under continuous magnetic stirring at 80°C. PAN in powder form is dissolved in n,n-dimethylformadide (DMF, Superlco, Merck. Taufkirchen, Germany) at 75°C under magnetic stirring. PVDF pellets are also dissolved in DMF (Superlco, Merck) in a similar manner, under magnetic stirring and heated to 70°C. The above constitute the plain polymer solutions used to produce nanofabrics, as well as the basis for MWCNT-doped polymer solutions to generate nanofabrics with different MWCNT concentrations. In all three cases, complete dissolution of polymer solids are ensured prior to the addition of MWCNTs.
Polymer solutions are prepared at concentrations ranging from 0.1% w/w to 1.5% w/w for each polymer employed to identify the saturation concentration range for each system. Following the identification of the saturation point, two different concentrations of MWCNTs are employed to fabricate the nano-reinforcement layers as tabulated in Table 1. MWCNTs are initially dispersed in acetone at a standard concentration. The dispersion is sonicated using an ultrasonic bath for 30 min to ensure adequate dispersion. Then, a specific amount of the acetone/MWCNTs dispersion is added to the polymer solution to achieve the target concentration in each case. The polymer/MWCNT dispersion is further sonicated in an ultrasonic bath at elevated temperature (70°C) to ensure homogeneous dispersion. Since the saturation concentration of MWCNTs for each polymer varies, different solution concentrations are examined. Indicatively, PA6 has a lower MWCNT saturation concentration than PAN and PVDF; thus, lower MWCNT concentrations are examined for PA6 in this work.
Nanofabric properties.
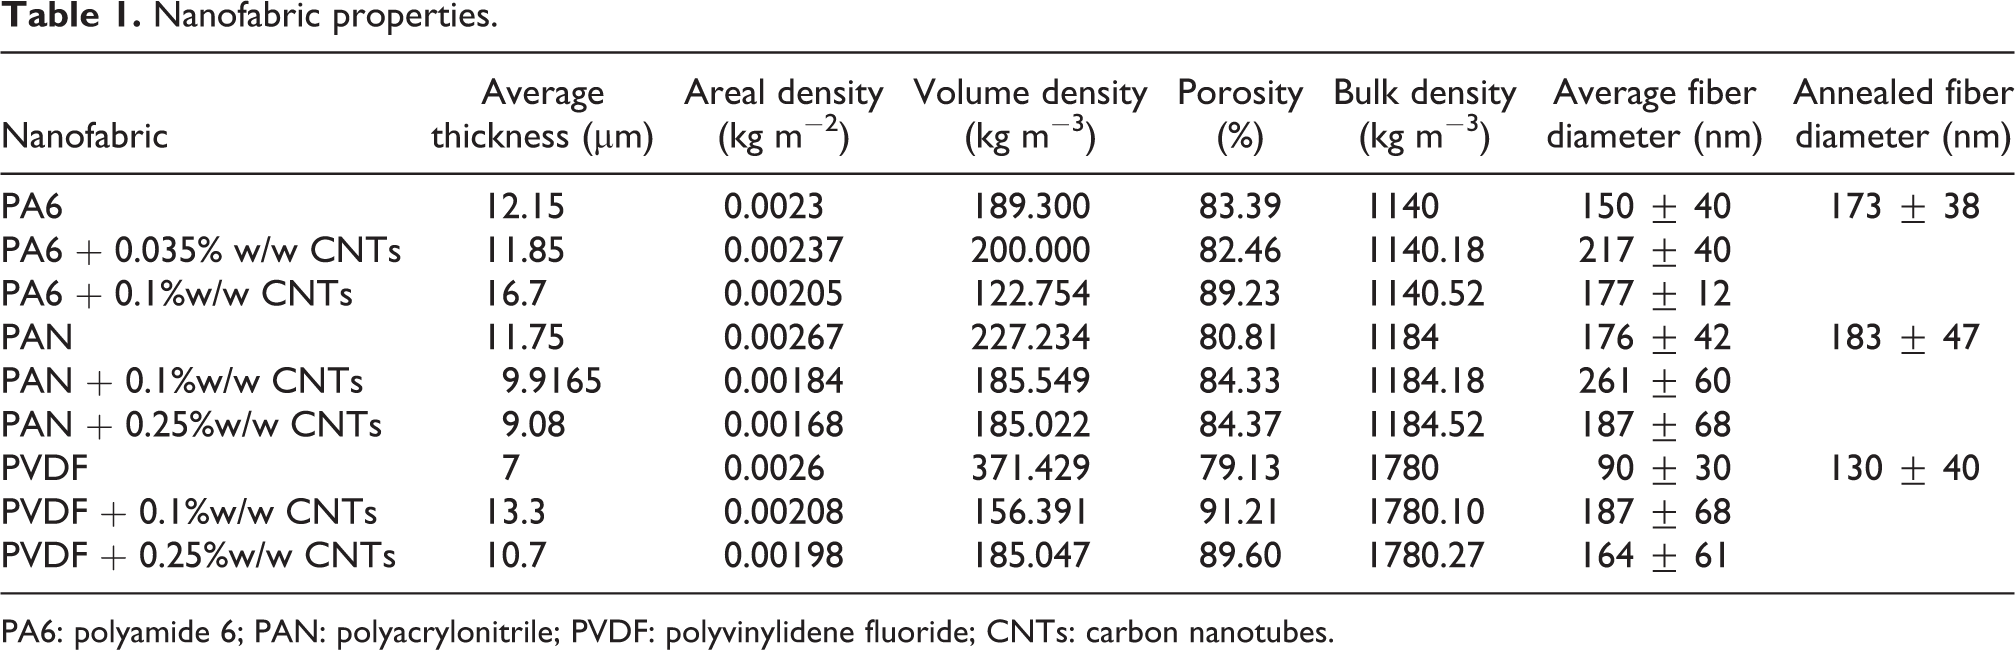
PA6: polyamide 6; PAN: polyacrylonitrile; PVDF: polyvinylidene fluoride; CNTs: carbon nanotubes.
Following the solution preparation, both plain and MWCNTs polymer solutions are electrospun using a needle-less apparatus for high viscosity polymers at substrate speeds from 0.07 m min−1 to 0.15 m min−1 and at a voltage of 50–70 kV. Electrospinning of all nanofabrics is performed at ambient conditions.
Characterization of reinforcement interlayers (nanofabrics)
The resulting nanofabrics are characterized in terms of their thickness and their areal density following fabrication. Scanning electron microscopy (SEM) is employed to investigate the morphology and microstructure of the nanofabrics, using a Quanta microscope from FEI (Oregon, USA). Prior to the microscopic examination, a very thin Ag coating (a few nm) is deposited on the specimens by sputtering to increase their conductivity and reduce the charging effects. Images are acquired at 1 and 5 kV accelerating voltages for low and high magnifications, respectively. Nanofiber diameters are measured using a commercially available software (ImageJ, 1.53a, Wayne Rasband, National Institutes of Health, USA). Average values and standard deviations (SDs) of these diameters are calculated by taking at least 40 measurements on individual nanofibers. The nanofiber diameters of specimens both as received and annealed are reported in Table 1.
The thickness of the nanofabrics is measured using a Mitutoyo gauge, and their aerial density is measured by weighing a specific area on a high accuracy scale under controlled conditions to avoid humidity absorbance. The volume density of each nanofabric is calculated as the areal density over the respective thickness. Finally, porosity is calculated through the bulk density of the polymers, using values from suppliers material safety data sheets (MSDS) datasheets and equation (1).

The thermal behavior of fabricated nanofabrics is investigated via differential scanning calorimetry (DSC). DSC experiments are performed using a Q-Series DSC by TA Instruments (Delaware, USA) at the Advanced Materials and Devices Laboratory (AMDE) lab and the Laboratory of Advanced Materials and Constructions at the Aristotle University of Thessaloniki. All plain specimens are tested, since addition of CNTs should not contribute to the thermal properties of nanofabrics; however, PA6 and PA6 + 0.035% w/w CNTs are compared. A different temperature range is selected for each polymer, according to their expected melting point. For PAN, temperature ranged from room to 350°C; for PVDF from room temperature to 215°C; and finally, for both PA6 specimens (with or without CNTs), the range was increased to 275°C. The heating rate for all experiments is 2.5°C min−1 and 5°C min−1. Lower heating rates are employed to calculate the crystallinity of nanofabrics. DSC experiments are performed in a heat/cool/heat manner to investigate crystallinity of nanofabrics and remove any previous thermal history effects. Crystallinity is calculated using the following equation 26 :

where x
c
is the degree of crystallinity (%), ΔH
m
is the melting enthalpy (J g−1), ΔH
c
is the crystallization enthalpy, and
Annealing of reinforcement interlayers
In alignment with typical manufacturing processes of FRPs, the generated nanofabrics are further annealed to test their behavior at processing conditions during fabrication of composite panels. Nanofabrics are heat-treated at 84°C for 4.5 h using a laboratory oven.
Tensile strength tests
Tensile tests are performed using a custom-made tensile apparatus, part of which is shown in Figure 1. The setup comprises an aluminum frame, which carries: (i) a 10-kgf load cell (Applied Measurements Limited, Berkshire, United Kingdom), (ii) a draw wire sensor extensometer (Series SX50, Waycon, GmbH, Munich, Germany), and (iii) a pair of parallel jaw grips for tensile testing rated at 500 N (Mecmesin Ltd, Slinfold, West Sussex, United Kingdom) for holding the specimens. Analog voltage signals from the two sensors are acquired through a module equipped with a data acquisition card with 12-bit digitization (OM-USB-1208FS, Omega Engineering Inc., Connecticut, USA), providing 0.0098 V resolution for the load cell and the extensometer. Calibration of the load cell was performed in-house, by static loading with of known masses which were independently measured on a scale and added in increments of 10 g. The voltage signal was acquired over a period of 60 s with a sampling rate of 100 Hz, resulting in 6000 samples. Due to analog-to-digital conversion and electrical noise fluctuations, the voltage within was quantized to a set of three to four discrete values. The frequency of each discrete voltage value was computed as the number of its occurrences divided by the total number of samples. Therefore, a most probable voltage value was computed as the weighted average of each voltage value. Subsequently, the average voltage values were compared against the corresponding weight of each mass. The draw wire extensometer calibration was performed by the manufacturer. The resolution of the force and displacement measurements are 0.25 N and 200 µm, respectively.

Custom-made tensile apparatus and specimen used in tensile strength tests.
Specimen mounting and testing
To obtain well-resolved measurements, two strips of nanofabrics are tested instead of a single layer. The two-sheet nanofabric is then cut to individual specimens of 210 mm length by 32 mm width using a rotary trimmer paper cutter machine. Subsequently, the specimen was mounted to the parallel jaw grips for testing. The specimen is preloaded with approximately 0.5 N and the gauge length is recorded between the grips, which ranged between 122 mm and 125 mm. Load is applied to the specimen in displacement control by a vertical stage with manual motion at an average loading rate ranging between 5 mm min−1 and 12 mm min−1. Five to seven specimens are tested per nanofabric system. All specimens are loaded monotonically until failure. A typical tensile test progression is shown in Figure 2 for PVDF + 0.25%w/w CNTs at different strain levels. The extension and lateral contraction varied for each nanofabric system. Failure was evident by separation of the nanofabric strips in two segments and a simultaneous drop in the voltage reading. Acceptable tests are considered as those for which both sheets of nanofabric failed simultaneously, resulting in four to five specimen measurements per nanofabric system. Voltages from the extensometer and load cell were recorded at a rate of 25–50 Hz for offline processing.

Tensile loading progression for PVDF + 0.25%w/w CNTs electrospun nanofabric at strains: (a) 0, (b) 0.06, (c) 0.10, and (d) 0.27. PVDF: polyvinylidene fluoride; CNTs: carbon nanotubes.
Data reduction
Following acquisition, the data are averaged in the force values corresponding to displacements and converted to engineering stress and strain. As tested materials are highly porous and have thickness of a few microns, stress calculations are performed using a porosity-corrected definition of stress, which considers the areal density, A d , density of bulk, plain PA6/PAN/PVDF, ρbulk, as independently measured parameters.
The porosity-corrected stress is derived as follows:


For the direct comparison between the stress of nanofabric composites containing different amounts of CNTs with the corresponding plain nanofabrics (same polymer precursor), the corrected stress presented above is normalized by the density of the plain nanofabric i.e., by dividing equation (3) with

where A is the cross-sectional area (m2), A c is the corrected area (m2), accounting for porosity, σ c is the corrected stress (MPa).
From the tensile stress–strain curves, several parameters are extracted. The elastic gradient is computed as the slope of a least-squares fit to the linear portion of the stress–strain curve. Yield stress was determined as the intersection of the stress–strain curve with a line parallel to the elastic gradient and offset by a standard strain of 0.002. The tensile strength at breaking is the maximum stress recorded and the corresponding strain is the strain at breaking. Furthermore, resilience is computed numerically as the area under the stress–strain curve up to the yield stress and tensile strength at breaking.
Results
Characterization of nano-reinforcement layers
Fabricated nano-reinforced layers are characterized in detail and their properties are tabulated in Table 1. Since their potential as interlayers is assessed in this work, it is important to obtain the average thickness as well as the respective densities. Finally, porosity is another important aspect for of their mechanical performance. As observed in Table 1, for PA6 + 0.1% CNTs, even though larger average thickness is measured, the associated areal density is decreased compared with plain PA6 and PA6 + 0.035% CNTs. This is attributed to the higher volume fraction of pores per unit volume of material for PA6 + 0.1% CNTs. Bulk densities at different MWCNT concentrations are calculated using the rule of mixtures. It is noteworthy that the density change is marginal and thus the bulk density of the plain polymer is used for calculations of stress.
SEM enabled detailed examination of fabricated nonwoven nanofabrics. The average fiber diameter has been measured and is reported in Figures 3 and 4. The average nanofiber diameter varies between polymer solutions employed and is affected by the concentration of MWCNT in solution. Average diameters and SD are tabulated in Table 1. In all cases, fibers appear to have random orientations within the nanofabric. Higher magnification images demonstrate that fibers are continuous and of circular cross-section, with smooth surfaces. Comparing the nanofiber diameters of nonannealed and annealed specimens (Figures 3 and 5) revealed that heating affects the geometry of the nanofiber, by increasing the fiber diameter. This effect is more profound in the case of PVDF nanofabric. Similar behavior is observed by Lam et al., 27 where they have observed an increase of the measured diameter after annealing of PVDF-trifluoroethylene electrospun nanofibers. This observation was attributed to nucleation of cavities and microvoids, along with potential aggregation of reorganized molecular chains. 27
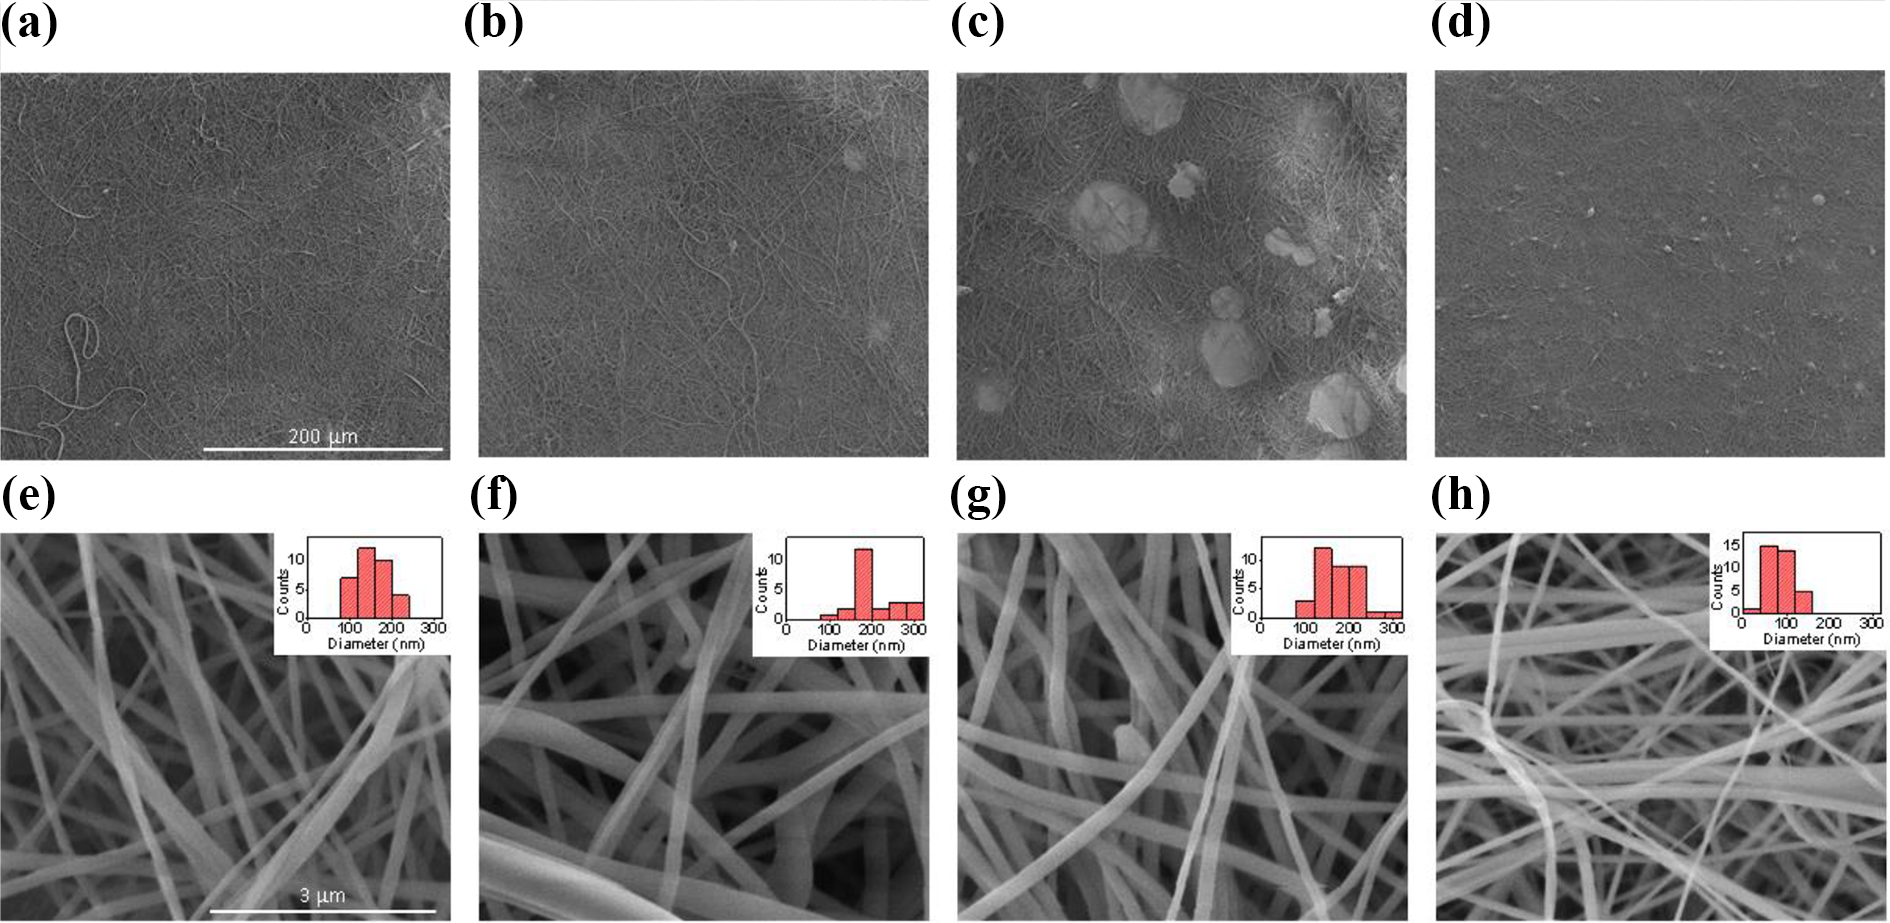
Low and high magnification SEM images of (a) and (e) PA6, (b) and (f) PA6 + 0.035% CNTs, (c) and (g) PAN, and (d) and (h) PVDF electrospun nanofabrics. SEM: scanning electron microscopy; PA6: polyamide 6; PAN: polyacrylonitrile; PVDF: polyvinylidene fluoride; CNTs: carbon nanotubes.

SEM images of annealed nanofabrics: (a) PA6, (b) PAN, and (c) PVDF. SEM: scanning electron microscopy; PA6: polyamide 6; PAN: polyacrylonitrile; PVDF: polyvinylidene fluoride.

Low (top row) and high (bottom row) magnification SEM images of (a) PAN + 0.1% CNTs, (b) PAN + 0.25% CNTs, (c) PVDF + 0.1% CNTs, (d) PVDF + 0.25% CNTs, and (e) PA6 + 0.1% CNTs. SEM: scanning electron microscopy; PA6: polyamide 6; PAN: polyacrylonitrile; PVDF: polyvinylidene fluoride; CNTs: carbon nanotubes.
DSC measurements enabled investigation of the thermal response of the nanofabrics and provided insight in the crystal structure of each type of nanofabric. Starting with PA6, the DSC curves are presented in Figure 6. From the heat flow graph, the glass transition temperature (T G) and melting temperature (T M) can be deduced. T G is around 48°C (data range not shown) and T M is around 220°C, which is in agreement with values from relevant literature. 28 –30 It is worth noticing the absence of an exothermic crystallization peak. This observation is supported by the second heat curve that follows a cooling cycle in DSC (Figure 6). This can be explained by examination of the crystalline state of electrospun PA6. PA6 is a polymorphic material with more than one energetically favorable crystalline structures. 29 The most common crystalline structure met in commercially available bulk PA6 is the α-form. However, electrospun PA6 was previously shown to form the γ crystalline structure. 30 α-form crystals are prevalent when slow crystallization occurs, whereas γ-form is more commonly produced from rapid crystallization. 30 Thus, electrospun PA6 exists in a γ-form crystalline phase due to rapid cooling that it undergoes. Nevertheless, a double melt peak is observed. This is attributed to melting of different crystal structures that might be present due to reorganization of thermodynamically unstable crystals. 31 Hence, this double peak is not prominent during the heat/cool/heat cycle performed as observed in Figure 6.

DSC curve for PA6 for heat/cool/heat cycles with a heating rate of 2.5°C min−1. DSC: differential scanning calorimetry; PA6: polyamide 6.
The respective heat flow curves for PA6 + 0.035% CNTs are presented in Figure 7. As expected, the thermal behavior of PA6 + CNTs nanofabrics is closely related to that of plain PA6. The incorporation of CNTs in the electrospun polymer does not appear to affect the thermal behavior of the resulting nanofabric, making the polymer matrix dominant for thermal response. T G is around 48°C (data range not shown here) and T M is around 221°C, demonstrating no difference to plain PA6 nanofabrics.

DSC curve for PA6 + 0.035% CNTs for heat/cool/heat cycles with a heating rate of 2.5°C min−1. DSC: differential scanning calorimetry; PA6: polyamide 6; CNTs: carbon nanotubes.
PVDF nanofabrics exhibit lower T M as seen in Figure 8 (second heating step). T G is around 53°C (data not shown here) and T M is around 154°C, which is in close agreement with values reported in the literature. 32,33 In a similar manner to PA6, PVDF is a polymorphic polymer met in five phases: α, β, γ, δ, and ε phase. 34 Electrospinning typically yields β-phase PVDF; however, the amount of this phase strongly depends on operating parameters of the electrospinning setup such as the flowrate distance of the collector, and voltage. 33 The observed melting point for β-phase PVDF according to Singh et al. is approximately 158°C, 33 which is in close agreement with the melting point measured in the presented results. This has been studied thoroughly by different groups and can be explained by the formation mechanism of electrospun nanofibers along with the molecular structure of PVDF. It was concluded that the polymer solution jet is stretched (at high stretching ratios), which leads to orientation of polymer chains along the fiber length, giving rise to β-phase PVDF. 35 Nevertheless, this will be investigated experimentally using Fourier-transform infrared (FTIR) in the future.

DSC curve for PVDF for heat/cool/heat cycles with a heating rate of 2.5°C min−1. DSC: differential scanning calorimetry; PVDF: polyvinylidene fluoride.
DSC analysis of PAN nanofabrics reveals a different type of thermal behavior than PA6 and PVDF. Analysis of DSC data for PAN indicated a sharp exothermic peak as seen in Figure 9. The heat flow curve for the second heating (Figure 9) appeared not to include any crystallization or melting peak. This behavior is expected and is attributed to the degradation of PAN starting near its melting point (around 280°C). However, since the degradation reaction of PAN is exothermic, it tends to mask its endothermic melting peak on typical DSC curves. 36 Therefore, since the endothermic melting peak is masked, no information can be concluded for crystallinity of the specimen. However, since no crystallization peak is observed at temperatures below the degradation point, it is postulated that the PAN electrospun nanofabric is not amorphous. Degradation is irreversible; thus the second heating curve in Figure 9 does not show any change in heat flow.

DSC curve for PAN at the second heating step (heat/cool/heat) with a heating rate of 2.5°C min−1. DSC: differential scanning calorimetry; PAN: polyacrylonitrile.
Calculated crystallinity is presented in Table 2. Crystallinity is calculated using equation (2), and values were obtained for the first and second heating step as well as the cooling step performed. It is apparent from the presented results in the first heating step that electrospun nanofibers exhibit increased crystallinity values, attributed to the intrinsic crystal-forming rate when nanofibers are electrospun. It is noteworthy that CNTs appear to play an important role on crystallinity of electrospun nanofibers. PA6 + CNTs demonstrated higher crystallinity values compared with plain PA6, highlighting the role of nanoparticles during formation of nanofibers. It is postulated that nanoparticles act on inducing crystallization via the increased amount of nucleation sites available, 38 resulting in nanofibers of higher crystallinity.
Crystallinity values determined from DSC.

PA6: polyamide 6; CNTs: carbon nanotubes; PVDF: polyvinylidene fluoride.
Effect of CNTs concentration on tensile performance
In Figures 10 to 12, engineering strain is plotted against engineering stress for each nanofabric composite, computed using equation (4) and the values of Table 1. The experimental data points for each tested specimen are shown as a cloud, with filled circle symbols to illustrate the scattering of measurements. Superimposed on the graph is the average curve shown as a solid line. The average curve is obtained by linearly interpolating the stress data for each specimen and averaging them over the common range of all specimens.
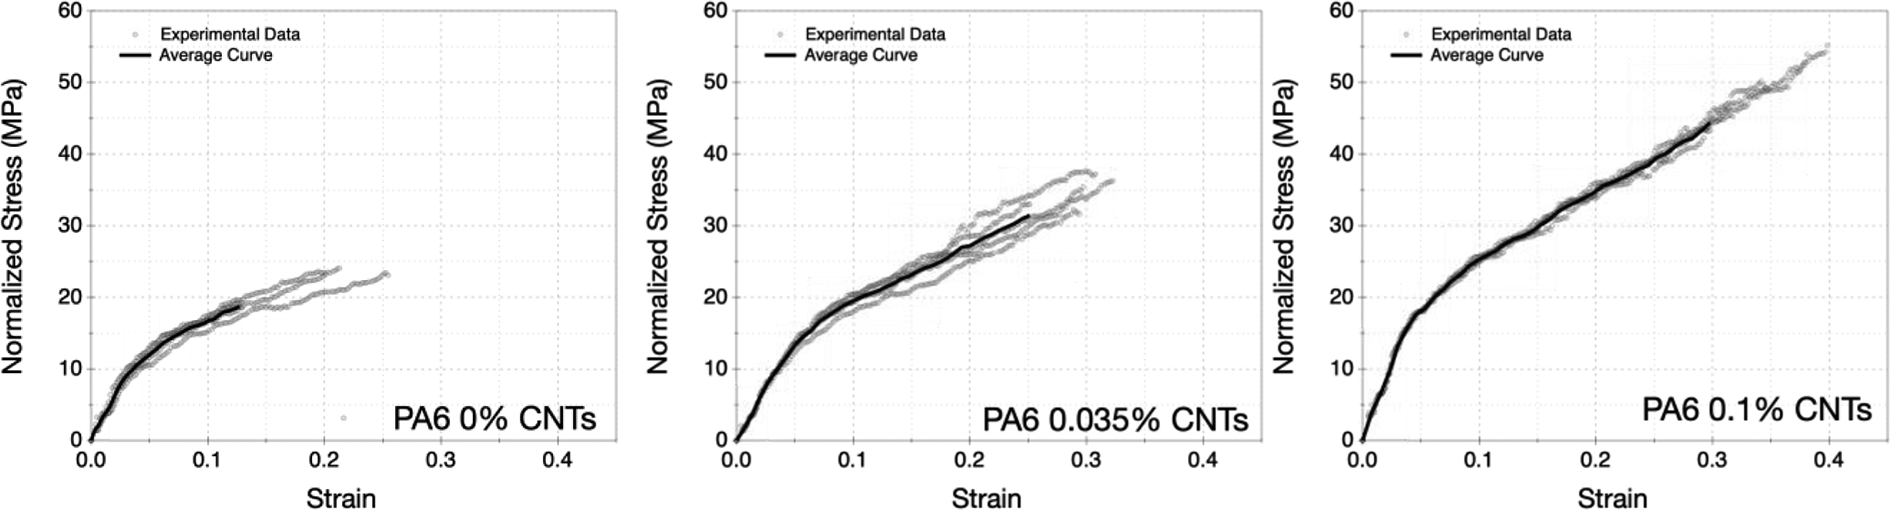
Normalized stress against strain for PA6 nanofabrics with various CNT concentrations. PA6: polyamide 6; CNT: carbon nanotube.

Normalized stress against strain for PAN nanofabrics with various CNT concentrations. PAN: polyacrylonitrile; CNT: carbon nanotube.
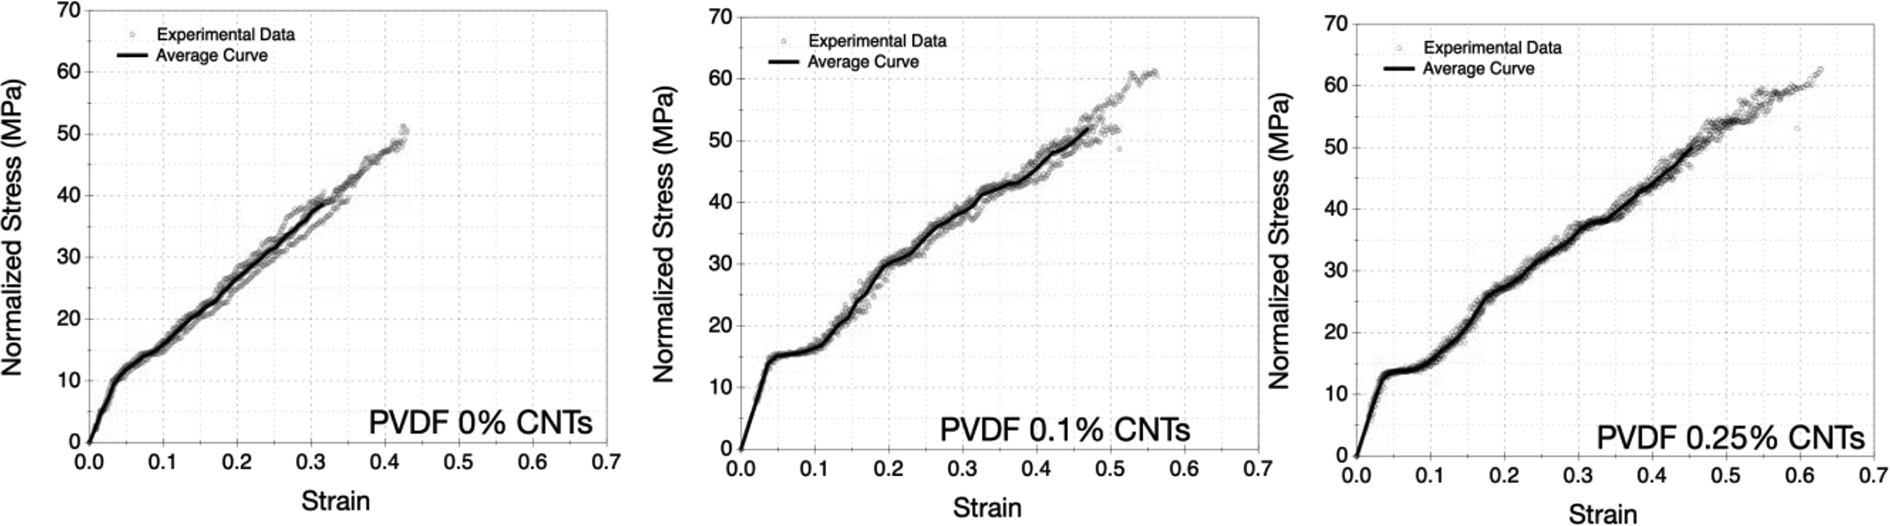
Normalized stress against strain for PVDF nanofabrics with various CNT concentrations. PVDF: polyvinylidene fluoride; CNT: carbon nanotube.
Each nanofabric system presented a unique stress–strain response, which allowed identification of some prominent characteristics of their average behavior. For PA6, the stress–strain response for all CNTs concentrations shown in Figure 10, exhibits an initial linear portion, which gradually becomes nonlinear without presence of a definite yield point. PAN, as shown in Figure 11, follows a bilinear or elastoplastic type of stress–strain behavior with a definite yield point, which occurs at approximately 2% strain. The same behavior is observed regardless of CNTs concentration.
For PVDF, on the other hand, it is observed that the stress–strain curve changes character depending on CNT concentration as shown in Figure 12. Specifically, the stress–strain curve for PVDF with no CNTs exhibits an initial linear part followed by a gradually softening portion, in the range of approximately 3–8% strain, which reaches a nearly imperceptible plateau before continuing linearly, albeit with a softer gradient than the initial portion. With the addition of CNTs, a definite yield plateau develops between 4% and 8% strain, after which strain hardening is observed, similar to the system without CNTs. In general, yield as well as tensile strengths are either enhanced or remain unaffected with the addition of CNTs in all three nanofiber systems.
For PAN, addition of MWCNTs does not significantly affect the tensile response of nanofabrics. This could be explained by similar porosities measured for all PAN nanofabric systems. Nevertheless, as mentioned above, the DSC response of PAN has not confirmed the degree of crystallization for PAN electrospun nanofabrics. Although one can speculate that addition of MWCNTs might create nucleation sites to increase crystallinity, this may not be the case as observed with PAN tensile characterization and requires further investigation.
In the observed response of nanofabrics described above, it is clear from Table 3 that increasing the nanoparticle content in electrospun nanofibers results in increased in-plane tensile strength of the nanofabric, even for PVDF. Due to the jet trajectory during electrospinning, nanofibers are arranged in a randomly oriented manner, forming a complex 3D network, 39 resulting in improved mechanical response.
Tensile properties of nanofabric.

PA6: polyamide 6; PAN: polyacrylonitrile; CNTs: carbon nanotubes; PVDF: polyvinylidene fluoride.
The addition of CNTs to interlayer reinforcements has been previously shown to increase overall crystallinity of the system by providing nucleation sites. 40,41 Crystallization of the polymer in the vicinity of CNTs can increase the load transfer and can, therefore, enhance tensile properties of the composite. Although electrospinning induces fast solidification, which normally hinders crystallization, Naebe et al. have shown that CNT-reinforced electrospun PVA had increased crystallization levels, which led to improvement in strength. 42
The strain to failure increases notably in PA6 and marginally in PVDF with higher concentrations of CNTs, while a marginal increase is also observed for PAN (Table 3). This is in contrast with other works in the literature, where electrospun polymer nanofabrics behave in a more brittle manner when CNTs are added. For example, Hou et al. found that the strain to failure of electrospun PAN fibers decreases with increasing MWCNTs content. 43 Resilience follows the same trend as yield strength and elastic gradients and reduces significantly with added CNTs only in the case of PVDF as tabulated in Table 3. On the other hand, toughness as an integrated quantity over the whole stress–strain curve depends on strain and tensile strength at breaking. Therefore, a large enhancement in toughness for PA6 and PVDF with addition of CNTs is observed, with no significant improvement for PAN.
Mechanical response at the nanofiber level has also been examined, since addition of CNTs and the electrospinning process affects the tensile strength of the solid phase (nanofiber level) due to microstructural changes within the electrospun fiber. The mechanical behavior is distinctively different between the nanofabric and nanofiber level. This is attributed to interactions between nanofibers as well as formation of a 3D network with inherently different porosities and nanofiber diameters in the nanofabric.
To investigate the effect of CNTs to strength of each nanofiber type, equation (3) is used to transform force–displacement data to porosity-corrected stress–strain data, using the pertinent values of Table 1. The derived tensile properties are presented in Table 4. It is observed that yield strength for PA6 and PAN remains unaffected with addition of CNTs, while for PVDF, it is reduced. For PA6, tensile strength at breaking increases nearly 50–60%, with addition of CNTs and a significant increase in maximum strain at breaking is also observed. The PAN system shows a mild reduction in tensile strength at breaking and a marginal improvement in maximum strain. Interestingly, PVDF shows an approximately 50% reduction in tensile strength with the addition of CNTs, which is accompanied by a dramatic increase in the maximum strain at breaking. The elastic gradient for all nanofiber systems is mildly affected with added CNTs, but compared with all nanofiber, PAN, in general, appears to be the stiffest.
Tensile properties of nanofiber.

PA6: polyamide 6; PAN: polyacrylonitrile; CNTs: carbon nanotubes; PVDF: polyvinylidene fluoride.
In an attempt to understand the enhancement of mechanical response of PA6 electrospun nanofibers upon the addition of MWCNTs, the mechanical load transfer mechanism from the polymer matrix to MWCNTs should be considered. The enhancement is attributed both to CNT slip within the fibers and to presence of nanopores on the fiber surface as effective sites for stress concentration. 44 When stress is applied beyond a threshold value, slippage of MWCNTs in the direction of applied stress results in necking, that is more profound at the end of an embedded MWCNT within the fiber. Nanopores, on the other hand, act as effective sites where stress concentration results in plastic deformation and subsequently necking of the fiber. 45
In PVDF nanofibers, according to Huang et al., 46 addition of MWCNTs, even at small concentrations (0.01 wt%), has a detrimental effect to the preferred orientation of PVDF chains and thus on crystallinity of the nanofiber composite. Transmission electron microscopice observations revealed that, although some MWCNTs are well aligned along the fibers, the majority agglomerates or entangles, which justify their effect on the orientation of PVDF crystals. 45 This phenomenon can be attributed to either the inherent dispersion characteristic of MWCNTs in polymeric precursors, or to unoptimized electrospinning parameters, which cannot fully disperse the CNTs during deposition. 46 Similar results have been reported for electrospun PEO/MWCNT nanofibers with higher CNT concentration, and the phenomenon has been attributed to the irregularity of MWCNTs. 46 In addition, it is well known that electrospinning and addition of CNTs in PVDF can increase the amount of β-phase in the crystal. Wang et al. have shown that Young’s modulus of PVDF/MWCNT nanofabrics decreases linearly with increasing MWCNTs because of the higher amount of β-phase forming. 47 It is, therefore, deduced that similar behavior takes place for the concentrations under investigation and that possible decreasing crystallinity with increasing MWCNTs content is responsible for the reduction in tensile strength observed in PVDF/MWCNTs systems. However, this will be validated with DSC experiments in the near future, since in the case of PA6, it has been proven that MWCNTs promote nucleation of crystallization (Table 2). In addition, poor dispersion and agglomeration of MWCNTs may also be responsible for the decrease in strength, associated with lower crystallinity levels. 48
Finally, for PAN nanofibers, the behavior of tensile strength is similar to that at the nanofabric level. In other words, there is no significant increase from plain to CNT-reinforced PAN nanofibers. Given the imperceptible improvement in tensile strength upon addition of CNTs in PAN nanofabrics, it is postulated that CNTs influence on crystallization is not as prominent as in PA6. Further investigation through X-ray powder diffraction or FTIR is to understand the mechanism of action of the nanoparticles in the dispersion system upon electrospinning.
Effect of annealing on tensile strength
The effect of heat treatment on tensile behavior of the three nanofabrics is shown in Figures 13 to 15. There is an observable improvement in the overall mechanical performance of all nanofabrics, with the most noticeable improvement in PA6. The difference in tensile behavior after heat treatment can be attributed to morphological and microstructural changes that occur within the nanofibers. SEM image analysis before and after heat treatment has shown that the average fiber diameter increases when heat is applied to the system. The normalized tensile stress of annealed nanofabrics demonstrates higher values for the three polymers tested. This is also congruent with the observed results. Upon annealing, PVDF nanofiber diameter increased by approximately 44%, in comparison with PA6 and PAN nanofiber diameters that increased by approximately 15% and 4%, respectively. In addition, it is well known that crystallinity of PA6, 49 PAN, and PVDF 50 fabrics increases, when thermally treated, leading to higher stiffness. The effect of heat treatment on tensile behavior of a similar nanofabric system was investigated by Choi et al. Using high resolution SEM observations, they found that heat treatment at temperatures above T G resulted in an enhancement of the interaction among nanofibers in the electrospun nanofiber sheet, forming a 3D network of nanofibers. 51 In agreement with experimental observations, simulation of nanofiber mats under tension has shown that stiffness and maximum strength are related to the number of fiber–fiber fusion points. 39
Effect of annealing on the stress–strain response of PA6 nanofabrics. PA6: polyamide 6.

Effect of annealing on the stress–strain response of PAN nanofabrics. PAN: polyacrylonitrile.

Effect of annealing on the stress–strain response of PVDF nanofabrics. PVDF: polyvinylidene fluoride.
Conclusions
Nanofabrics with various amounts of MWCNT reinforcements have been successfully fabricated by electrospinning polymer solutions of PA6, PAN, and PVDF. Their applicability as interlayer reinforcements to fiber-reinforced composites has been assessed through their microstructural and mechanical properties. The reinforcement mechanism is based on the hierarchical structure formed by three incorporated scales: the fibers in macroscale, electrospun nanofibers in the microscale, and MWCNT reinforcement in the nanoscale. Electrospinning resulted in continuous nanofibers of circular cross-section, randomly oriented in nonwoven mats, containing large volume fraction of pores. The crystallinity of electrospun nanofibers increased when nanoparticles are incorporated (PA6 vs. PA6 + 0.035% CNTs). This observation led to the conclusion that nanoparticles act as nucleation sites, enhancing crystallization of the polymer solution. Higher crystallinity is associated with increased mechanical response, which was confirmed by higher tensile strength at breaking as observed, by comparison between PA6 and PA6 + 0.035%CNTs nanofabrics.
The PAN nanofabric exhibited significantly higher TG and Tm compared with PA6 and PVDF, and thus has the potential to be used in systems requiring higher processing temperatures. In general, higher amounts of MWCNTs increased strength and strains to failure. This enhancement in mechanical properties can potentially be exploited to enhance the interlaminar strength of fiber reinforced composites, by more effectively transferring loads between adjacent plies. Lower strength values obtained for PVDF with MWCNTs were attributed to phase transformation and lower crystallinity. Nevertheless, PVDF exhibited more ductility when reinforced with MWCNTs, rendering them applicable for enhancement of vibrational damping properties at the composite level. Heat treatment at temperatures in alignment with typical fabrication temperatures (above the TG ) enhances the mechanical performance of the nanofabrics.
In future studies, dynamic mechanical analysis will be pursued for testing dynamic properties of the nanofabrics, as it is particularly pertinent to their application as mechanical loading enhancers in nanocomposite laminates and other structures. Furthermore, applicability of nanofabrics for use in environments other than standard temperature and pressure will be investigated.
Footnotes
Declaration of conflicting interests
The author(s) declared no potential conflicts of interest with respect to the research, authorship, and/or publication of this article.
Funding
The author(s) disclosed receipt of the following financial support for the research, authorship, and/or publication of this article: This work was co-funded by the European Regional Development Fund and the Republic of Cyprus through the Research and Innovation Foundation (Project: ENTERPRISES/0916/0030).