
Abstract
Background
Haemophilia A (HA) is a bleeding disorder, due to a deficiency in factor VIII (FVIII). These patients are unable to produce a stable fibrin clot in the propagation phase of coagulation as they do not generate sufficient thrombin. The primary treatment for HA in South Africa remains replacement therapy with standard half-life FVIII clotting factor concentrate, aimed at reducing bleeding episodes.
Objectives
To evaluate the effect of varying concentrations of FVIII on whole blood (WB) clot architecture and kinetics during clot formation in patients with severe HA.
Design
A cross-sectional study where blood from 20 patients with HA was exposed to FVIII ex vivo and compared to a control group of 20 healthy individuals.
Methods
Scanning electron microscopy (SEM) was used to study WB clot architecture and thromboelastography® (TEG®) was used to quantify WB clot kinetics.
Results
Scanning electron microscopy studies revealed that patients with HA have sparse, disorganized fibrin networks with limited crosslinking and red blood cells (RBCs) stacked in rouleaux formation. Haemophilia A blood spiked to a 10 to 15 IU/dL FVIII concentration showed improvements in the organisation of the fibrin network with some altered RBCs. In addition, blood spiked to a 30 to 35 IU/dL FVIII concentration showed an increase in fibrin formation with normal RBCs. Thromboelastography® showed that patients with HA had an increased clot initiation time and decreased clot strength. When spiked to a 10 to 15 IU/dL FVIII concentration the clot kinetic profile showed normalization. However, an increase in FVIII concentration higher than 30 IU/dL showed altered clot architecture and kinetics.
Conclusion
Based on the current study, FVIII levels at 10 to 15 IU/dL improved clot kinetics but did not normalize the architecture. It may be sufficient for prevention of haemorrhages. Factor VIII levels at 30 to 35 IU/dL resulted in rapid but weaker clot formation. However, at this concentration the clot architecture was normalised which is important for haemostasis. Here it was also evident that the findings of these two modalities (TEG® and SEM) should not be separated but interpreted in conjunction with each other.
Introduction
Haemophilia A (HA) is a rare X-linked inherited bleeding disorder, caused by a deficiency of coagulation factor VIII (FVIII). 1 As such, it predominantly affects males with a frequency of 1 in 5000 live male births. 1 Patients with HA are unable to maintain haemostasis as they have impaired thrombin generation, which causes the formation of an unstable fibrin clot that is easily dissociated by fibrinolysis. 2 During clotting, the structure of the formed fibrin fibres directly affects the rate of fibrinolysis. 3
The architecture of a clot is characterized by fibrin fibre diameter and the size of the fibrin pores, the larger the diameter, the larger the pores. 4 An equilibrium between the viscoelastic and fibrinolytic properties of a clot is essential for normal haemostasis. 4 Several studies have indicated that a high thrombin concentration produces a dense fibrin clot composed of thin fibres and inversely, a low thrombin concentration produces a loose clot with thick fibrin fibres.3,5 Thinner fibres produce more branches which form a stable fibrin mesh, whereas thicker fibres produce a more rigid clot. To ensure equilibrium, a clot should be composed of a combination of both thick and thin fibres, to provide enough stability and rigidity to withstand arterial pressure due to blood flow. 4 During clotting, patients with HA form a temporary platelet plug, however, they are not able to produce a stable fibrin clot in the propagation phase of coagulation as they do not generate sufficient thrombin. 2
There is limited scanning electron microscopy (SEM) data available on the whole blood (WB) of patients with HA treated ex vivo with varying concentrations of FVIII, as most studies have investigated plasma fibrin strands in these patients. Also, the combination of WB thromboelastography® (TEG®) and SEM to characterize clot kinetics and architecture in patients with HA at varying concentrations of FVIII have not fully been studied. Therefore, the current study aimed to examine WB clot kinetics and architecture at varying concentrations of FVIII in patients with severe HA, using SEM and TEG®. The investigation was also done at FVIII concentrations that would prevent bleeding and were considered equivalent to a standard dose of emicizumab.
Methods and Materials
Design
In this cross-sectional study a total of 40 adult male participants were used. Blood samples were collected from 20 healthy control individuals and 20 patients with severe HA that voluntarily enrolled for this study. Ethical approval was granted by the Faculty of Health Sciences Research Ethics Committee of the University of Pretoria, South Africa (39/2020). Written informed consent was obtained from all the participants (available on request).
Blood Sampling
Blood was collected according to the guidelines of the ethics committee. A volume of 9 mL peripheral blood was drawn from a vein in the antecubital area into two evacuated 4.5 mL citrate tubes (BD Vacutainer®, Plymouth, UK), with 3.2% (0.105 M) buffered sodium citrate solution. All blood testing took place within 4 hours of sample collection. The participants recruited for the control group comprised healthy, nonsmoking males between the ages of 40 and 80 years, with no known chronic conditions, and excluding individuals who use anticoagulation therapy or vitamin supplements. The recruitment of the patient group consisted of patients with moderate and severe HA defined by FVIII levels of 1 to 5 IU/dL and FVIII < 1 IU/dL, respectively, as determined by a one-stage clotting assay. The exclusion criteria for the patient group were patients who developed antibodies against infused FVIII, had a history of smoking and patients on chronic medication for conditions other than HA. The patients were required to avoid FVIII infusion in the preceding 48 hours to the blood draw. Patients were recruited from the Haemophilia Clinic at Steve Biko Academic Hospital, Pretoria, Gauteng, South Africa.
The FVIII spike was chosen in a range of 10 to 15 and 30 to 35 IU/dL FVIII activity. The 10 to 15 IU/dL level was selected since literature suggests that the number of joint bleeds decreased to approximately zero in patients with more than 12 IU/dL FVIII level.6–8 The interest in the 30 to 35 IU/dL is seeded in the belief that elevation of FVIII to levels of ∼30 IU/dL will arrest a bleed. According to the World Federation of Haemophilia 2020 guidelines, levels from 30 IU/dL FVIII are adequate to treat deep muscle bleeds and substantial blood loss. The guidelines also suggest that peak levels of 10 to 20 IU/dL are adequate to treat superficial muscle and joint bleeds with no neurovascular compromise. 9
Preparation of the Factor VIII Concentrate
Human FVIII concentrate (Haemosolvate Factor VIII, National Bioproducts Institute, Pinetown, South Africa) was reconstituted using 10 mL of sterile water. A 1 in 100 dilution of the reconstituted FVIII concentrate was prepared with sterile water.
Spike A Group
To achieve a 10 to 15 IU/dL FVIII level, 100 µL of the 1:100 dilution was added to 800 µL of citrate native blood.
Spike B Group
To achieve a 30 to 35 IU/dL FVIII level, 500 µL of 1:100 diluted FVIII concentrate was added to 500 µL of citrated native blood. These ratios of FVIII concentrate to blood were adjusted accordingly if they were not in the desired FVIII range. To confirm that the WB had the correct FVIII range, a FVIII quantification assay was performed.
Factor VIII Quantification Assay
The blood sample was centrifuged at room temperature for 15 min at 1048 × g. The FVIII-deficient plasma was reconstituted with 1 mL of distilled water and incubated at room temperature for 15 min. The FVIII deficient (Siemens, Munich, Germany), actin Factor sensitivity to lupus (FSL) (Siemens, Munich, Germany) and calcium chloride (CaCl2) (Siemens, Munich, Germany) were loaded into the analyser. The test plasma was removed from the blood tube and was placed in a sample cup. The sample cup was placed in a tube holder, loaded into the coagulation analyser and testing was initiated. The analyser automatically aspirated 15 µL of plasma and placed it in a cuvette, 40 µL of FVIII-deficient plasma was then added to the cuvette. At 60 s, the analyser added 40 µL of actin FSL and finally, at 190 s, the analyser added 40 µL of CaCl2 to the cuvette and gently mixed the sample. The CaCl2 started the reaction and the time it took for a clot to develop was measured in seconds and converted to a percentage using a standard curve.
Thromboelastography® Assay
The TEG® assay was performed on four groups of samples: the native HA, spiked group A, spiked group B, and control samples. The TEG® assays were performed on citrated WB using a TEG® 5000 computer-controlled device (Haemoscope Corporation, IL, USA). A volume of 20 µL of a 0.2 M CaCl2 solution (Sigma-Aldrich, St. Louis, USA), was added to a loaded TEG® cup. Subsequently, 340 µL of citrated WB was added and the assay was left to run. The specialized TEG® computer programme monitored the clot kinetics around pre-programmed parameters. The TEG® measured 7 parameters that included reaction time (R time), kinetics time (K time), alpha angle, maximal amplitude (MA), maximum rate of thrombus generation (MRTG), time MRTG (TMRTG) and total thrombus generation (TTG). 10 The units and a description of each of these parameters are shown in Table 1. Only clot formation was measured therefore the test was terminated as soon as the MA had been achieved.
TEG® Viscoelastic Parameters for Whole Blood.

Scanning Electron Microscopy
Smears for SEM were prepared for each of the four groups from the citrated WB. A total of 2 µL of 0.2 M CaCl2 was added to 34 µL of blood onto a 10 mm glass coverslip and gently mixed. The blood smears were left to clot. The smears were fixed (4% formaldehyde and 1% osmium tetra-oxide), dehydrated serially (30%, 50%, 70%, 90% and three times with 100% ethanol) and dried with hexamethyldisilane (Sigma-Aldrich, St. Louis, USA). Full details of sample preparation from the fixation step can be seen in Pretorius et al. 10 The coverslips were mounted onto aluminium plates and carbon coated.
A Zeiss ULTRA plus FEG-SEM (Zeiss, Oberkochen, Germany) was used to visualize the red blood cells (RBCs), formed clots, and fibrin fibres. The in-Lens detector was used to view the samples at an accelerating voltage of 1 kV. The sample analysis consisted of a series of micrographs to represent the features of interest to the study. The morphological features of interest included RBC shape, RBC interaction, fibrin network distribution and crosslinking as well as the overall appearance of the clot architecture.
Statistical Analysis
Basic descriptive statistics for numerical data and percentage/proportion for categorical data were used in the data analyses. A Mann-Whitney U test for nonparametric data was performed. Statistical significance was set at P < .05. The analysis was carried out on Graphpad8® prism software (San Diego, CA). The sample size calculation for this study was based on the Wilcoxon-Mann-Whitney test. A study with an effect size of 1.5 required a total sample size of 30 participants (15 patients and 15 controls). The power calculation was carried out using Gpower 3.1.7.
Results
The results from the TEG® showed that the control group had normal clot kinetics as all of the viscoelastic parameters were within the normal ranges (Table 2). The native HA group showed a typical hypocoagulable viscoelastic profile as the R time, kinetics and the TMRTG were increased and the angle, MA, MRTG, and TTG were all significantly decreased compared to the healthy controls. The clot kinetics for the HA spike A group normalized as all the parameters were within the normal ranges. However, the HA spike B group clot kinetics were not altered in a consistent way in that R time and TMRTG were reduced, kinetics time normalized, and the alpha angle increased whereas MA, MRTG, and TTG were all reduced.
Viscoelastic Results From the TEG® Analysis.
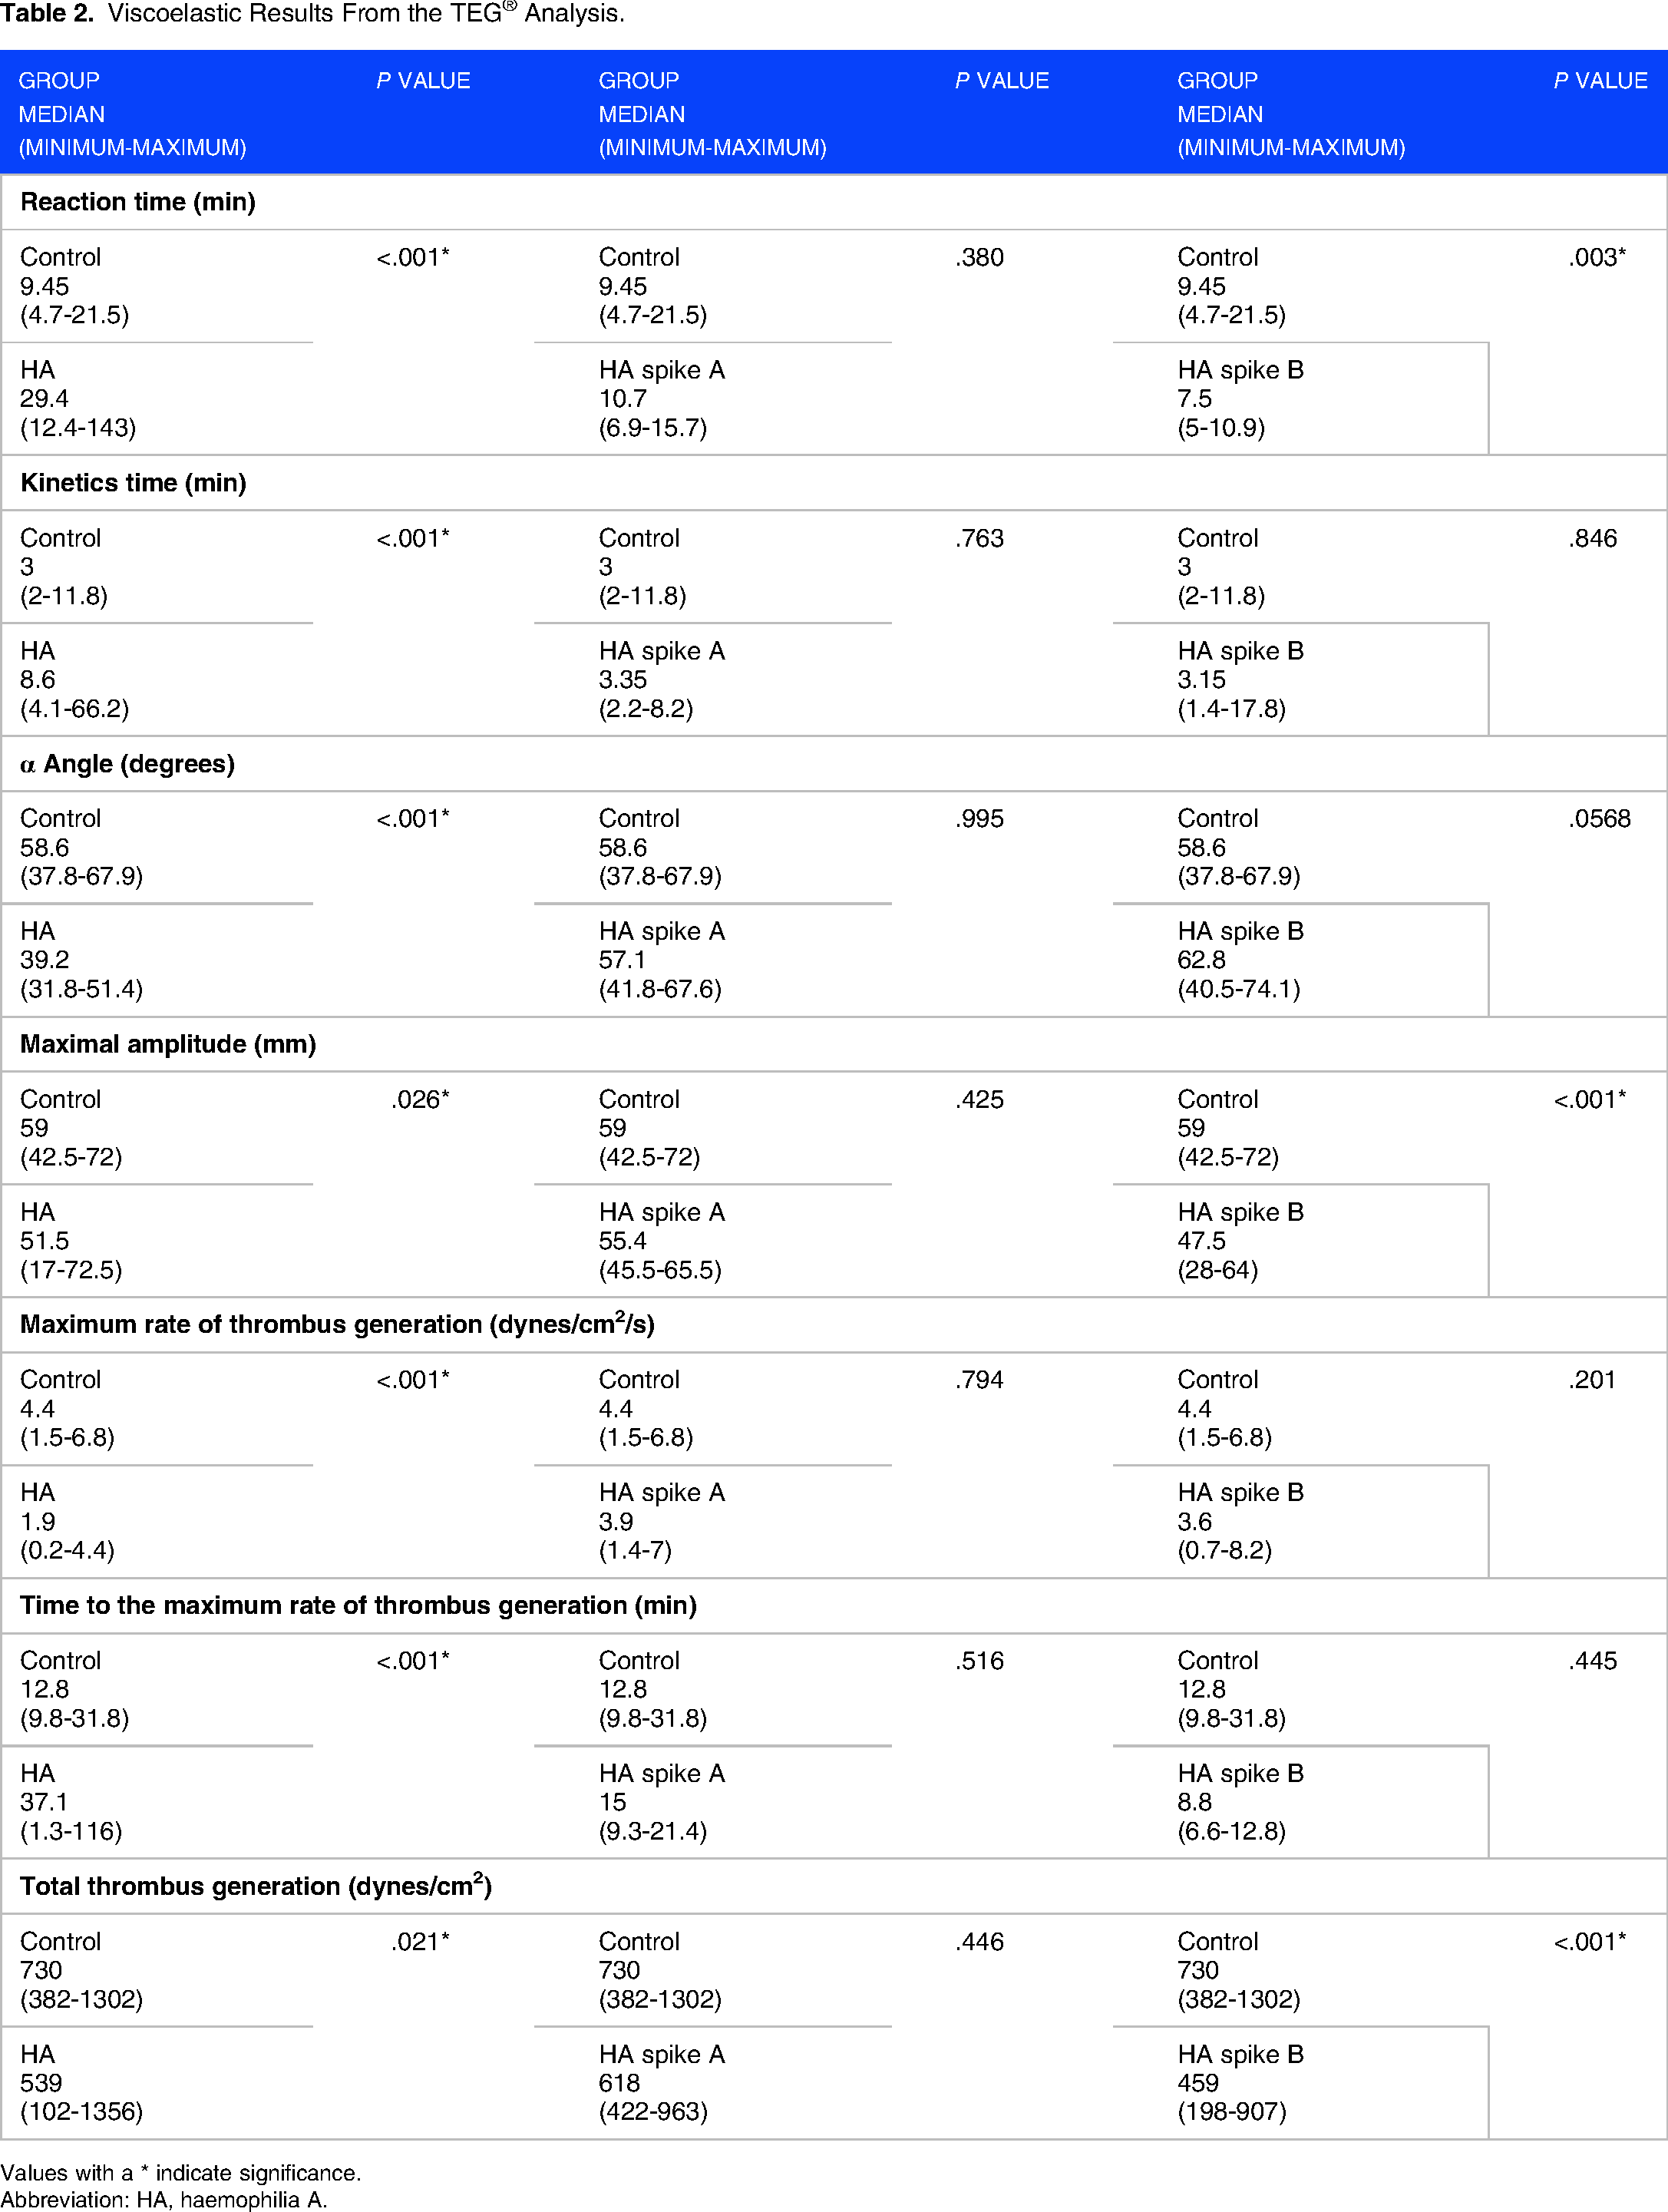
Values with a * indicate significance.
Abbreviation: HA, haemophilia A.
The SEM produced ultrastructural clot morphology which provided information on RBC shape and interaction as well as fibrin fibre formation and distribution. Representative SEM micrographs of each group can be seen in Figure 1. Images were taken of clots generated before and after the ex vivo addition of FVIII concentrates. The clots from the control participants (Figure 1A and B) appeared organized and uniform whereas the clots from the patients with native HA (Figure 1C and D) were more compact with RBCs stacked in rouleaux formation. There were a few, sparse fibrin strands, which were disorganized. The patient with HA spike A group (Figure 1E and F) showed some altered RBC shapes, however, the RBCs had much less rouleaux formation with fibres that appeared to be fused with the RBCs. A greater number of crosslinking between the fibres was noted. The clot architecture of the patient spike B group (Figure 1G and H) most closely resembled that of the control group.
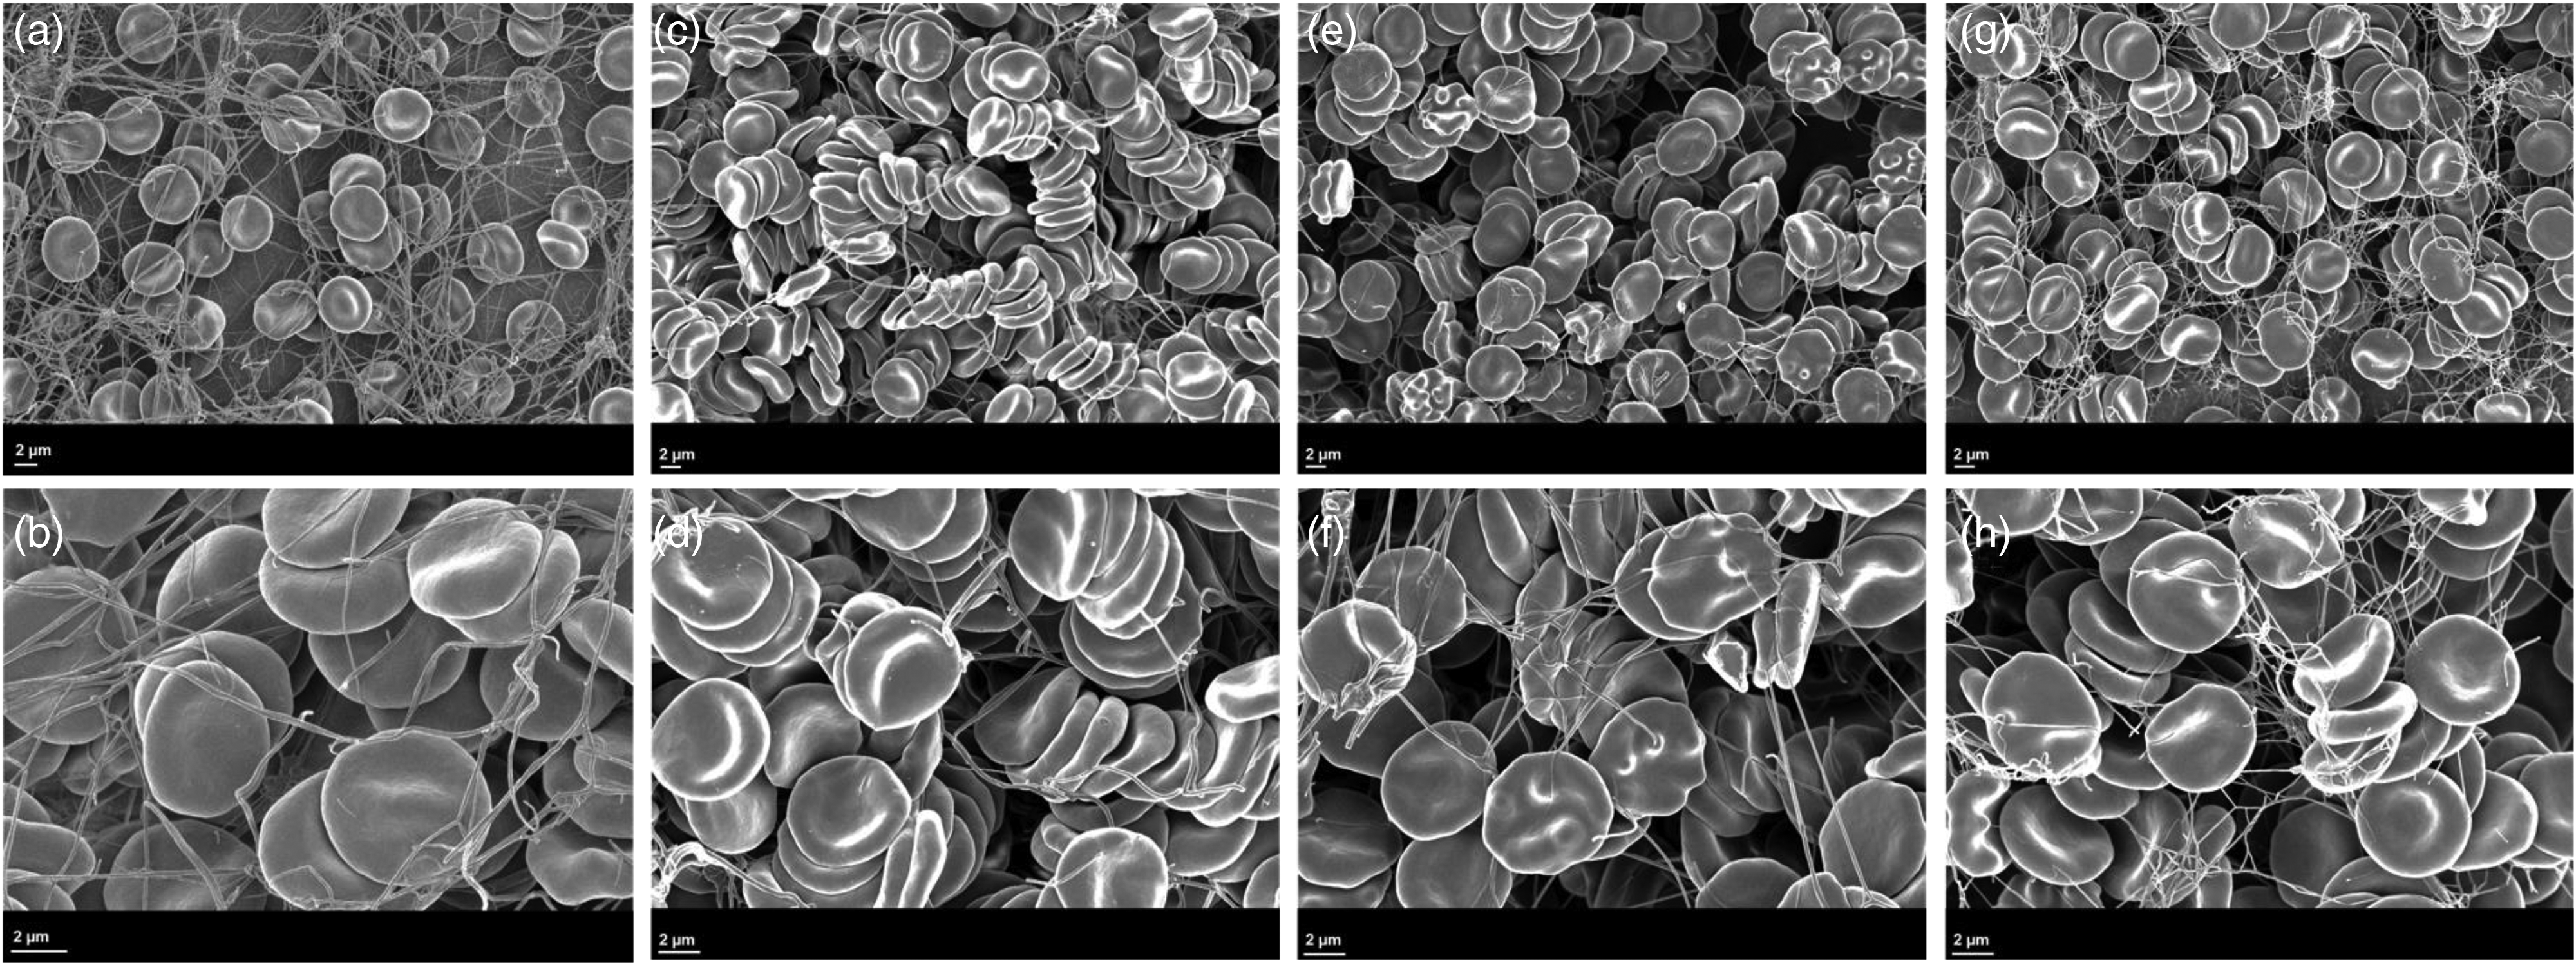
Micrographs of patients with HA and control participants using SEM. Micrographs A and B represent a clot from the control group with normal RBCs and fibrin fibres. Micrographs C and D represent a clot from the patient with native HA group with normal-shaped RBCs, stacked in rouleaux formation, and a compact clot structure. Micrographs E and F represent a clot from the patient with HA spike A group. The RBCs had an altered shape with fibres that appears to be fused with the RBCs. A greater number of crosslinking fibres with closer interlinking between the fibres was appreciated when compared to that of the patients with native HA. Micrographs G and H represent a clot from the patient with HA spike B group. Many fibres created a uniform, organised network with closer interconnecting links. Normal RBC shape with less rouleaux formation was noticed. Abbreviations: HA, haemophilia A; RBCs, red blood cells; SEM, scanning electron microscopy.
Discussion
The hallmark of HA is the repetitive bleeding into muscle and joints. The treatment of HA mostly includes replacement therapy using FVIII concentrates. Replacement therapy has been beneficial in the management of HA, particularly when administered prophylactically. The aim of prophylactic FVIII therapy is to prevent bleeding by changing the phenotype of severe HA to that of moderate HA, that is, increasing FVIII to more than 1 IU/dL. In recent years novel nonreplacement therapies, like the chimeric bispecific antibody emicizumab, have been developed and introduced to be used for routine prophylaxis in patients with HA. According to the observations by den Uijl et al. 6 patients with low FVIII baseline levels exhibit the highest risks for joint bleeds, whereas patients with FVIII activity levels exceeding 10 IU/dL exhibit a much lower risk and no joint bleeds are expected in patients with FVIII baseline levels of 15 IU/dL and higher. This study evaluated the effect of FVIII at this and other concentrations on clot architecture and kinetics during clot formation.
The clot kinetics of the HA group showed a typical hypocoagulable profile with a prolonged rate of clot formation, a decreased thrombin burst leading to a weak and less stable clot (Table 2). Vuiff et al. 11 optimised TEG® conditions to monitor therapy in patients with HA. They also observed a prolonged reaction time and decreased thrombin generation in patients with severe HA. 11
The addition of FVIII concentrate adjusted the clotting profile of both the spike A and spike B groups. The clot kinetics of the HA spike A group resembled a normal viscoelastic profile (Table 2). Therefore, the 10 to 15 IU/dL FVIII spiked levels normalised the clot kinetics of the patients with HA. The viscoelastic profile for the HA spike B group were altered with a decreased clot initiation time, however a weaker clot formed. The TEG® profiles of the spike A group suggested a better quality of clot that formed compared to the spike B group. This is suggestive that the FVIII concentration of 10 to 15 IU/dL is adequate to repair clot kinetics to a state that is comparable to healthy individuals. Despite this, when the SEM is considered, the improved clot kinetics did not result in normalisation of clot architecture.
The impaired thrombin generation in patients with HA affects the formation of fibrin and impacts the quality of the clot that is formed. The morphological properties of the clots seen in the HA native group confirmed the results from the TEG® when compared to the control group. The sparse and disorganised fibrin network confirmed that these patients lack the ability to produce proper fibrin strands. These characteristics may have contributed to the formation of a weak and less stable clot. The clot architecture in the HA spike A group, compared to that of the control group, had a decrease in fibrin formation with an increase in RBC rouleaux formation. This may have contributed to the normalisation of the clot kinetics in this group. The HA spike B group showed normally shaped RBCs with an increase in fibrin formation with more crosslinking when compared to the native and spike A groups. The increased fibrin may have contributed to the decreased initiation time seen with the TEG®.
The SEM images revealed irregular, porous fibrin clots composed of thick and short fibres before FVIII treatment. The clots had recovered after FVIII replacement almost to levels in control samples, revealing compact fibrin with smaller intrinsic pores. To the best of our knowledge, this is the first description of fibrin porosity and structure before and after FVIII treatment of selected patients with haemophilia. It supports thrombin generation as the main determinant of fibrin structure in haemophilic plasma. Observations by Shimonishi et al. agreed with this study as it was observed that the FVIII-deficient plasma produced irregular, porous fibrin clots composed of thick and short fibres in patients with HA. In the presence of FVIII, the clots recovered almost to levels in control samples, revealing compact fibrin with smaller intrinsic pores. 12 Shimonishi et al. 12 also investigated the effect of emicizumab using SEM and noted that emicizumab-induced fibrin clots that were thinner and denser compared to those in the FVIII-deficient plasma.
Limitations
This study contains a low number of patients as they were only recruited from a single clinic, due to the strict inclusion criteria and COVID-19 restrictions.
Conclusion
It may be beneficial to include a TEG® assay in the workup of a patient with HA as this provides a detailed description of the clot kinetics, even though TEG® assay would need to be standardized. This study showed that clot architecture did not normalize at FVIII concentrations of 10 to 15 IU/dL, however the kinetics improved to suggest that these levels may be adequate for sustained prophylaxis whether by factor replacement or FVIII equivalence introduced by nonreplacement therapy. At FVIII concentrations of 30 to 35 IU/dL the clot kinetics as assessed by TEG® showed that clots formed more rapidly but that clot strength was not normalized. However, despite this the clot architecture improved/normalized which supports improved haemostasis. Here it was also evident that the findings of these two modalities (TEG® and SEM) should not be separated but interpreted in conjunction with each other.
Footnotes
Acknowledgments
The authors would like to acknowledge all the participants who agreed to participate in this study and Dr Jan Gert Nel for his contribution to initial concept and protocol development.
Author contribution(s)
Author Contributions
All the authors have approved this manuscript to be published.
Availability of Data and Materials
Data may be made available on request.
Ethics Approval and Consent to Participate
The Faculty of Health Sciences Research Ethics Committee of the University of Pretoria (South Africa) approved this study (ethics clearance number 39/2020). Ethical approval was renewed annually. Approval from the National Health Research Database has also been granted to access patient records. Written informed consent was obtained from all the participants (available on request). Blood was collected following the relevant guidelines of the ethics committee.
Consent for Publication
Written consent has been obtained from all participants for the data obtained in this study to be published.
Declaration of Conflicting Interests
The author(s) declared no potential conflicts of interest with respect to the research, authorship, and/or publication of this article.
Funding
The author(s) disclosed receipt of the following financial support for the research, authorship, and/or publication of this article: This work is based on research supported in part by the National Research Foundation of South Africa (grant number: 121872).