
Abstract
Objectives
To compare the agreement between percentile ranks from 4 multi-morbidity scores.
Design
Population-based descriptive study.
Setting
Olmsted County, Minnesota (USA).
Participants
We used the medical records-linkage system of the Rochester Epidemiology Project (REP; http://www.rochesterproject.org) to identify all residents of Olmsted County, Minnesota who reached one or more birthdays between 1 January 2005 and 31 December 2014 (10 years).
Methods
For each person, we calculated 4 multi-morbidity scores using readily available diagnostic code lists from the US Department of Health and Human Services, the Clinical Classifications Software, and the Elixhauser Comorbidity Index. We calculated scores using diagnostic codes received in the 5 years before the index birthday and fit quantile regression models across age and separately by sex to transform unweighted, simple counts of conditions into percentile ranks as compared to peers of same age and of same sex. We compared the percentile ranks of the 4 multi-morbidity scores using intra-class correlation coefficients (ICCs).
Results
We assessed agreement in 181,553 persons who reached a total of 1,075,433 birthdays at ages 18 years through 85 years during the study period. In general, the percentile ranks of the 4 multi-morbidity scores exhibited high levels of agreement in 6 score-to-score pairwise comparisons. The agreement increased with older age for all pairwise comparisons, and ICCs were consistently greater than 0.65 at ages 50 years and older.
Conclusions
The assignment of percentile ranks may be a simple and intuitive way to assess the underlying trait of multi-morbidity across studies that use different measures.
Introduction
The accumulation of multiple chronic conditions (multi-morbidity) as compared to peers of the same age and sex has been proposed as a clinical marker of acceleration of the aging processes.1-4 We and others have previously shown that the number of chronic conditions increases steeply with older age, and may be influenced by factors such as sex, race, ethnicity, and socioeconomic status.2,5-8 Thus, persons who have accumulated more chronic conditions than peers of the same age and sex may be experiencing accelerated aging.
If accumulation of chronic conditions is indeed a marker of accelerated aging, an agreed upon list of relevant chronic conditions across the lifespan would be optimal. Unfortunately, there is no consensus about how many conditions or clusters of conditions, or what severity of conditions, are needed to define multi-morbidity. 9 The variability in the numbers and types of conditions included in studies and the lack of age-, sex-, race-, and ethnicity-specific normative data hinders the comparison of study results from different research groups. We have recently reported normative data separately by age and sex in a well-defined US population using a multi-morbidity score of 20 chronic conditions defined by the US Department of Health and Human Services (DHHS).10,11 Furthermore, we showed that the age- and sex-specific percentiles were predictive of 1-year and 5-year mortality. However, it is unclear how this measure compares with other measures of multi-morbidity.
To address the lack of consensus in multi-morbidity scoring methods, we calculated 4 multi-morbidity scores ranging from 18 conditions to 190 conditions in a well-defined US population. 10 After mapping the scores to age- and sex-specific percentiles, we investigated whether the 4 multi-morbidity scores had similar performance (agreement) in measuring a common underlying “construct” of multi-morbidity.12,13
Methods
Study population
We used the medical records-linkage system of the Rochester Epidemiology Project (REP) to identify all persons who lived in Olmsted County, Minnesota at any time between 1 January 2005 and 31 December 2014 (10 years). To be included, persons were required to have reached at least one birthday while a resident of the county within the study time frame; however, we excluded persons who did not provide authorization to use their medical record information for research, as per Minnesota legal requirements. 14 Persons in the sample were stratified into birthday cohorts at the single year level from age 0 (birth) through age 110 years, and regardless of the calendar year in which the birthday occurred. If persons resided in the county at several birthdays, they were included in the analyses multiple times (but always at different ages). Additional details about the study population were reported elsewhere. 10
Scoring systems used to assess multi-morbidity
The 4 multi-morbidity scores included in the comparison study.

DHHS = Department of Health and Human Services, 20 condition score; ICD = International Classification of Diseases; REP = Rochester Epidemiology Project; CCS = Clinical Classifications Software, 190 chronic condition score; CHAP = Body system chapters (collapsed CCS system), 18 chapters score; ELIX = Elixhauser Comorbidity Index, 31 condition score.
Many conditions are similar across the 4 different scores; however, the level of granularity differs among the scores. For example, hypertension is included in the DHHS list as one condition, whereas ELIX splits hypertension into two conditions (uncomplicated and complicated hypertension). The same is true for how ELIX splits diabetes into complicated and uncomplicated variants. The level of granularity varies greatly for cancer: the CCS score includes 33 separate types of cancer; the DHHS and CHAP scores group together all types of cancer into one category; the ELIX score includes 3 separate types of cancer for lymphoma, metastatic cancer, and solid tumors without metastasis. For more details, see Supplemental Digital Content 1.
Statistical analyses
Quantile regression was used to model the raw multi-morbidity scores across age and separately within women and men. Because the multi-morbidity scores are integer values (counts) ranging between 0 and a maximum number of conditions (e.g., 20 or 190), we used methods for calculating quantiles for counts as described elsewhere. 24 The modeling involves a step of adding a random amount of jitter from a uniform distribution between 0 and 1 to each observed multi-morbidity score. We performed 30 replicates of the jitter process and averaged across the modeled quantiles to generate the final quantile profile for each score. Quantile regression was modelled using the gcrq function (growth charts regression quantiles) available as part of the quantregGrowth package in R. Although our agreement analyses focused on the quantiles in the adult population at ages 18 years through age 85 years, quantile regression models included birthdays from age 0 (birth) through age 95 to stabilize the younger (left side) and older (right side) ends of quantile regression curves.
The raw multi-morbidity scores of each person on a given birthday were transformed into percentile (quantile) ranks as compared to peers of same age and sex in the general population. Thus, the raw multi-morbidity scores derived from 4 lists with broadly different numbers of conditions were transformed into a common range from 1st percentile through 99th percentile. For simplicity, and because we found no significant differences in our previous study, we did not fit separate percentile regression models by race (Whites vs. non-Whites) or by ethnicity (Hispanics vs. non-Hispanics). 10 However, we did assess the agreement of the 4 scores separately in race and ethnicity strata.
We calculated intraclass correlation coefficients (ICC) assuming two-way random effects (i.e., a random set of included persons and a random set of multi-morbidity scores from amongst the universe of possibilities). In particular, we calculated the absolute agreement ICC using the icc function available as part of the irr (inter-rater reliability) package in R. 25 This ICC is given the notation of ICC(2,1) by Shrout and Fleiss and as ICC(A,1) by McGraw and Wong and in the irr package documentation.12,13,25 The estimates of ICCs were accompanied by 95% confidence intervals. Scatter-plots of the pairwise multi-morbidity percentile scores were created (quantile-quantile plots) and included a reference line drawn on the one-to-one diagonal and a locally weighted regression (lowess) smoothed line. The lowess line provided a visual reference of deviation from the one-to-one diagonal line. 26
To give a better visual representation of data density, a random amount of noise (jitter) in the range negative one to one (-1 to 1) was added to each percentile rank for quantile-quantile scatter plots. This was necessary because percentiles are predicted at integer values and many points would otherwise overlap. We conducted ICC analyses for women and men separately and combined. However, for simplicity, scatter plots are shown for women and men combined. All analyses were performed using SAS version 9.4 (SAS Institute) and R version 3.6.2.
Results
Study population
We identified 262,064 persons who resided in Olmsted County at some time between 1 January 2005 and 31 December 2014. Among those persons, 238,010 had reached at least 1 birthday while a resident and had given permission for the use of their medical records for research (see Figure, Supplemental Digital Content 2). We included persons more than once if they reached multiple birthdays during the 10-year period, but always at different ages. The total number of birthdays reached was 1,458,094, and the median number of birthdays was 6 per person (interquartile range of 3-10). However, we included in the quantile regression models only the 1,456,052 birthdays at age 0 (birth) through age 95 (among 237,791 unique persons). This age restriction ensured that quantile regression models were firmly anchored at younger ages and at older ages. The final agreement analyses were undertaken on the percentile ranks from 1,075,433 birthdays at ages 18 through 85 years (among 181,553 unique persons).
Percentile ranks of multi-morbidity
Characteristics of persons included in each of the adult birthday age cohorts (ages 18 to 85 years).*
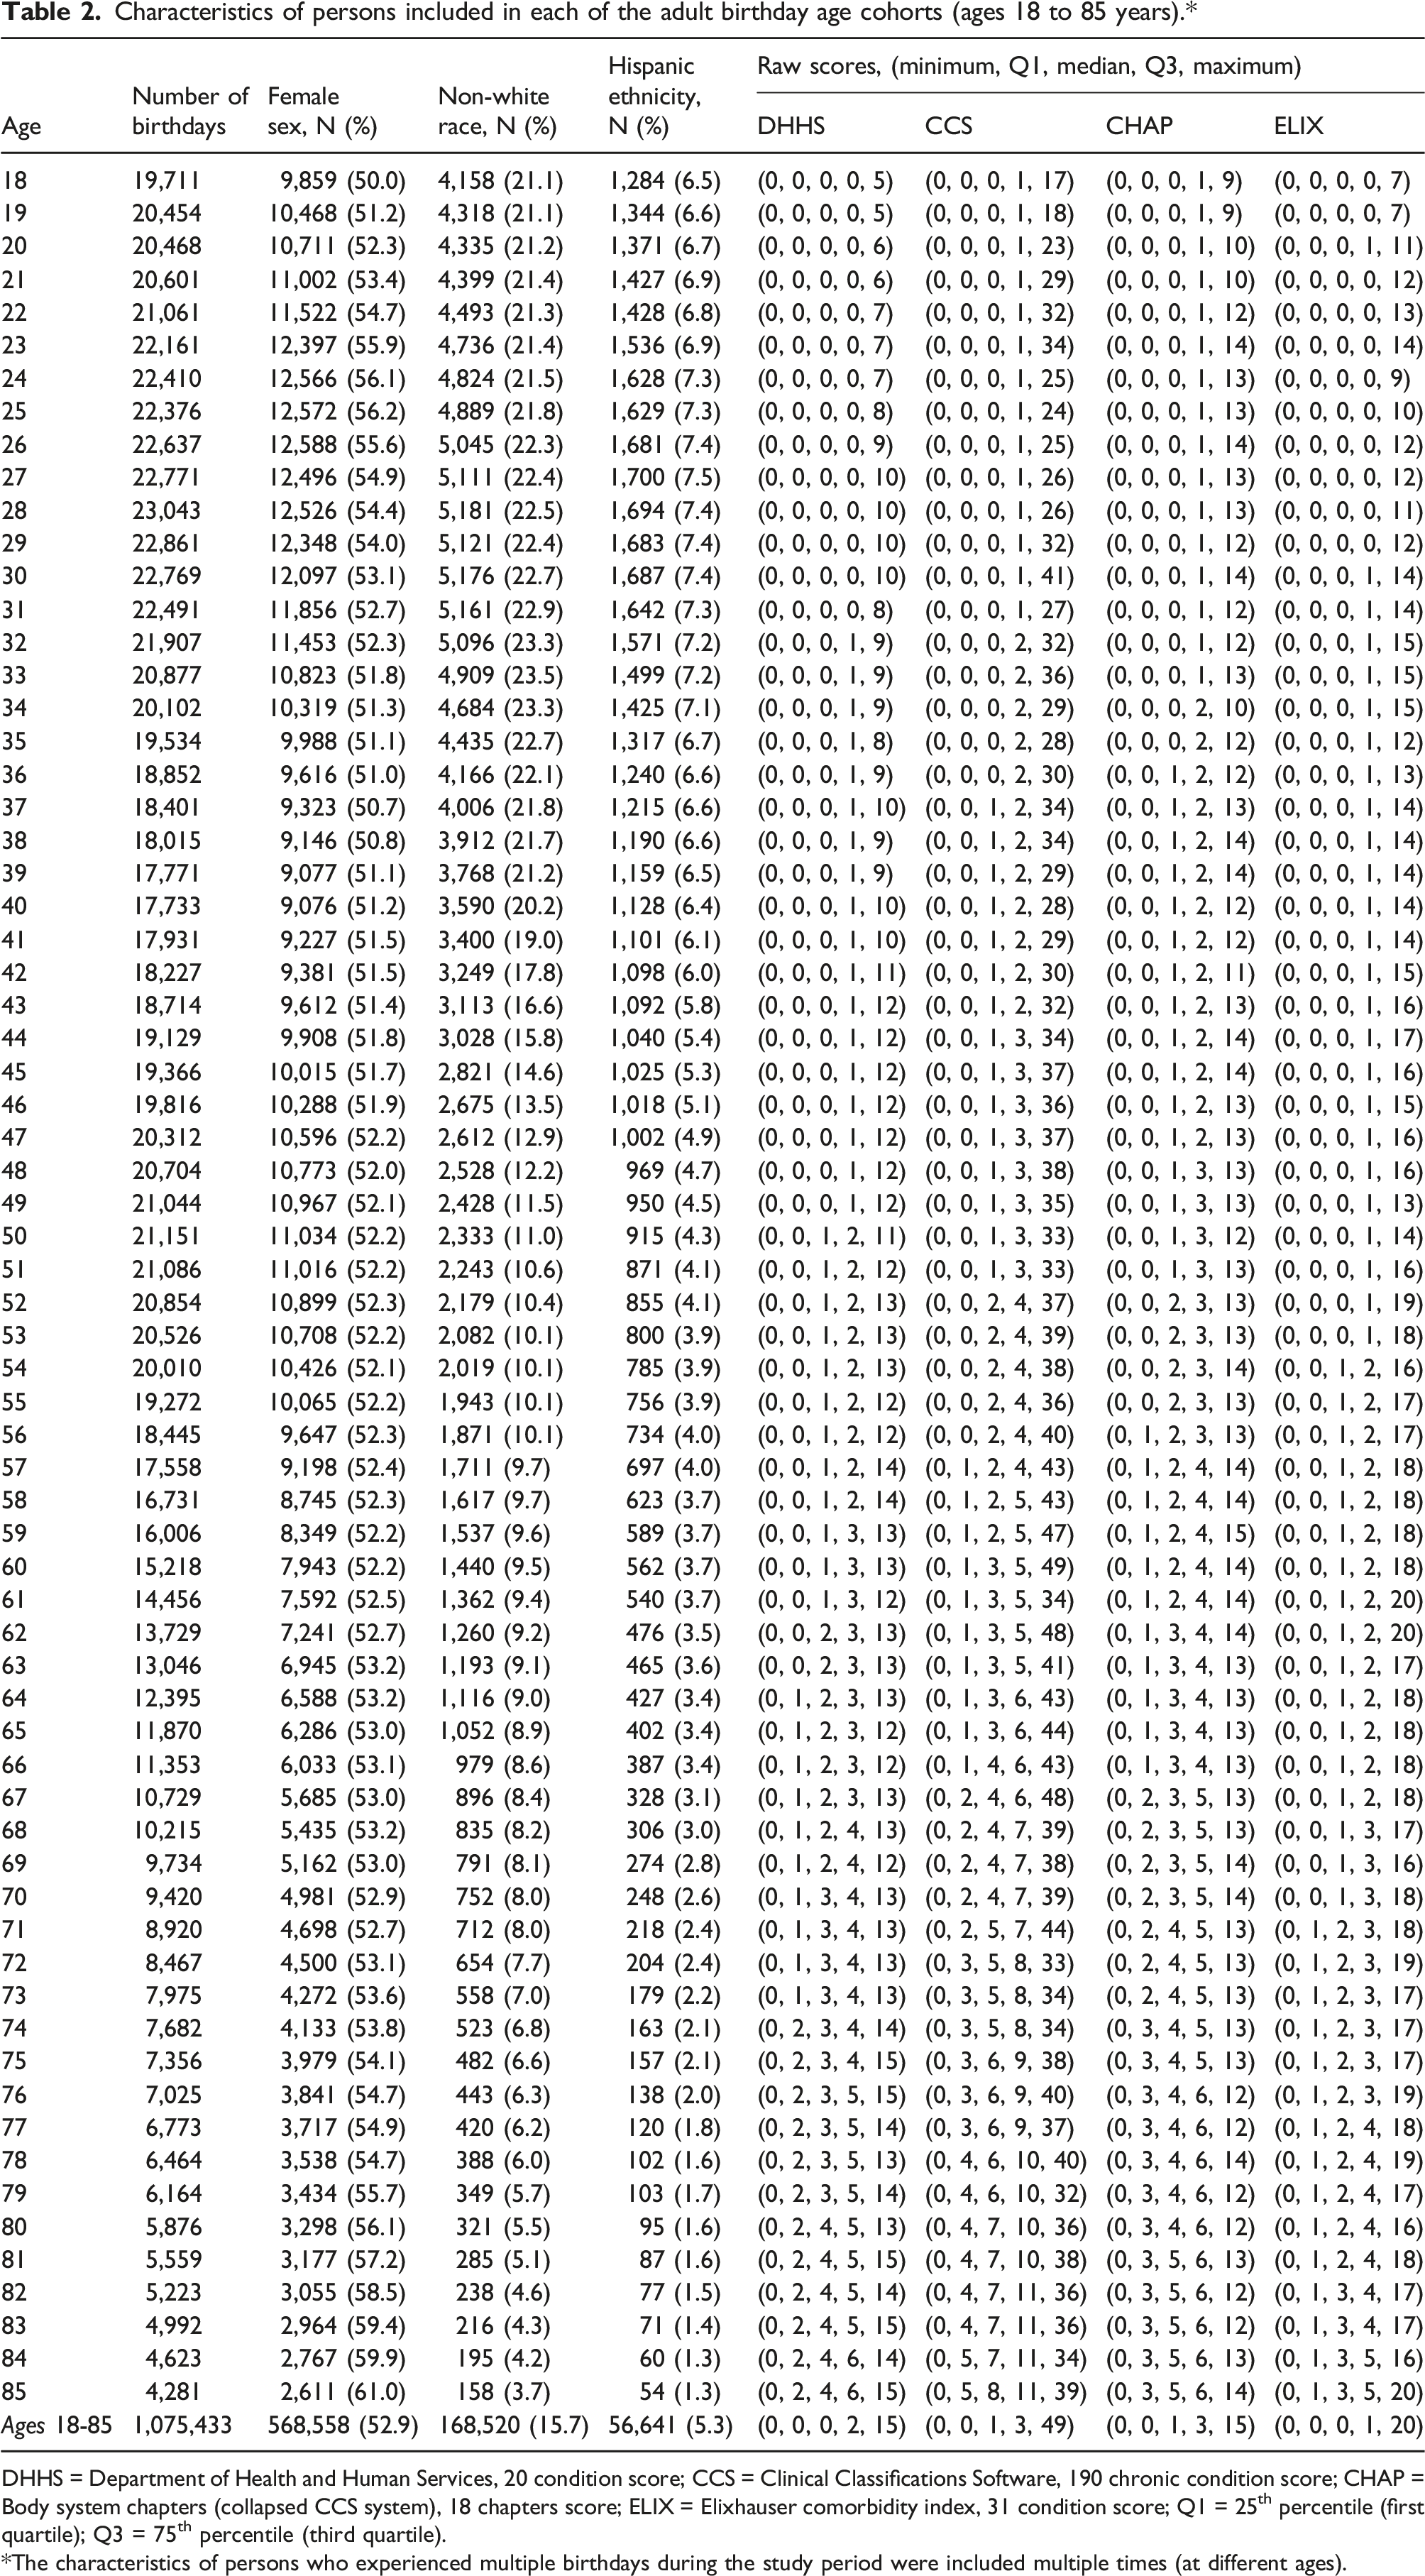
DHHS = Department of Health and Human Services, 20 condition score; CCS = Clinical Classifications Software, 190 chronic condition score; CHAP = Body system chapters (collapsed CCS system), 18 chapters score; ELIX = Elixhauser comorbidity index, 31 condition score; Q1 = 25th percentile (first quartile); Q3 = 75th percentile (third quartile).
The characteristics of persons who experienced multiple birthdays during the study period were included multiple times (at different ages).
Agreement in 6 pairwise comparisons between the 4 multi-morbidity score percentile ranks by age in 5-year increments for both sexes combined and separately for women and men.*

ICC = intraclass correlation coefficient; DHHS = Department of Health and Human Services, 20 condition score; CCS = Clinical Classifications Software, 190 chronic condition score; CHAP = Body system chapters (collapsed CCS system), 18 chapters score; ELIX = Elixhauser comorbidity index, 31 condition score.
The persons who experienced multiple birthdays during the study period were included multiple times (at different ages).
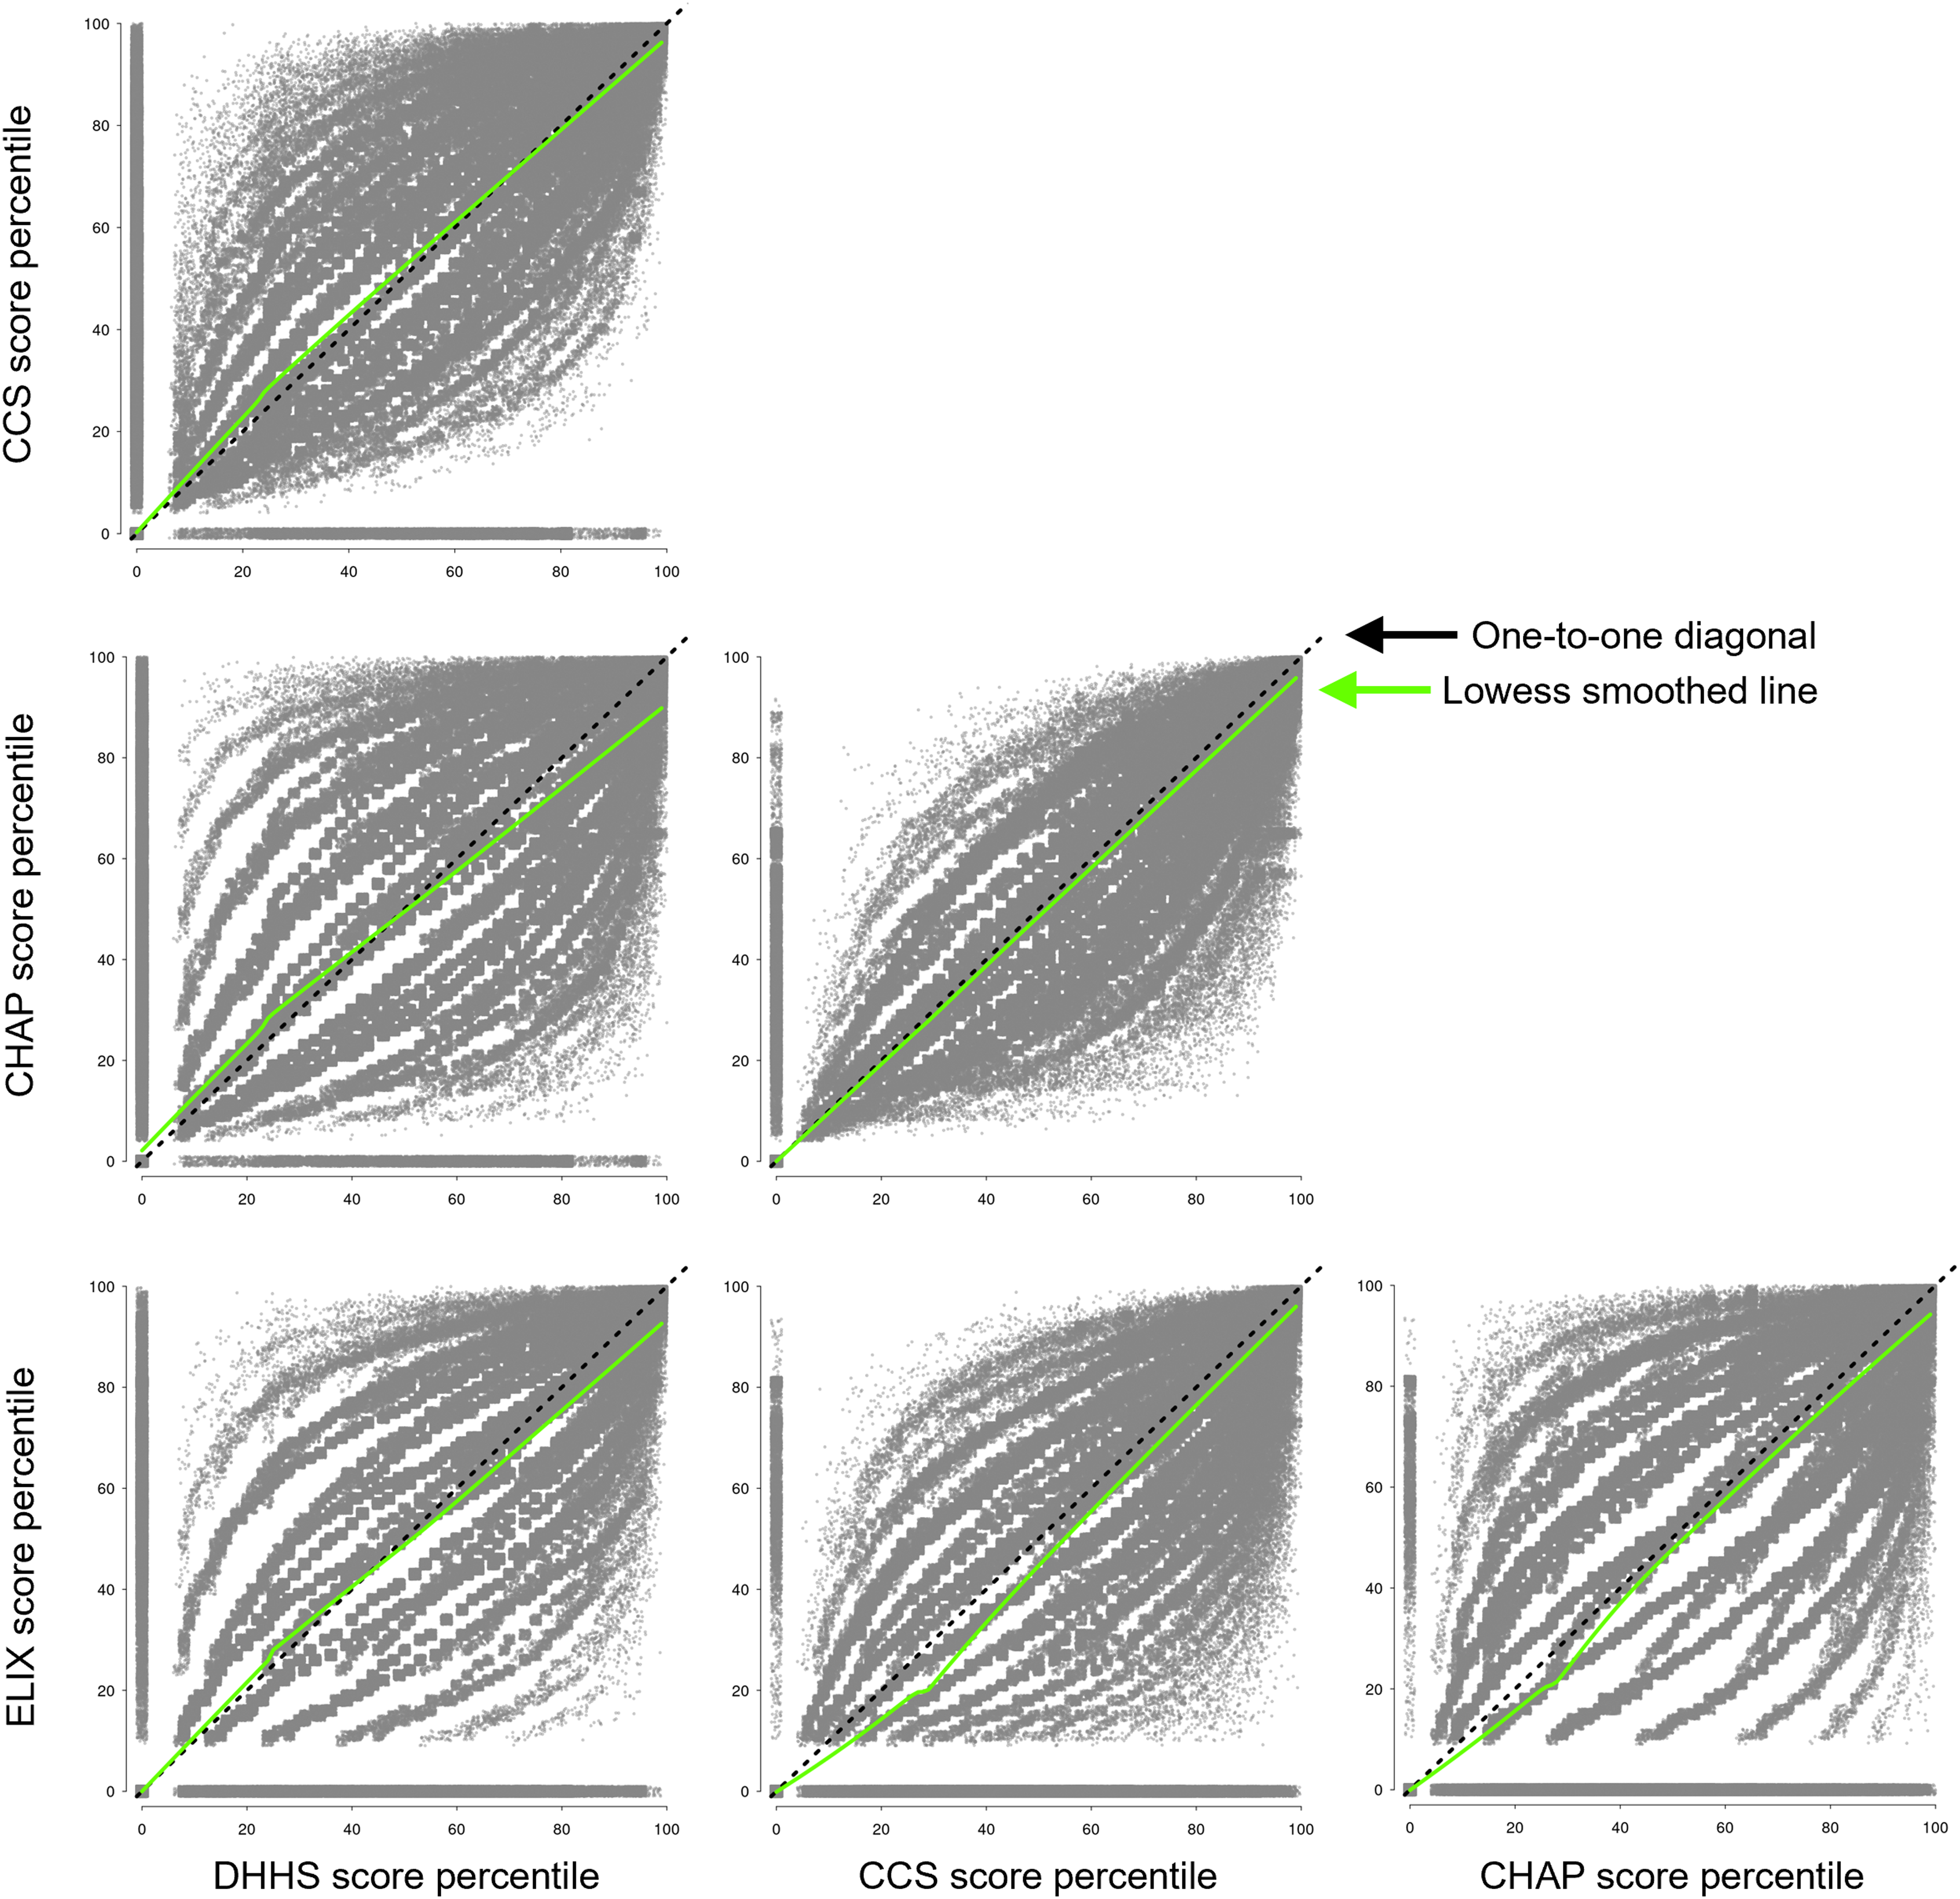
Quantile-quantile scatter plots of percentile ranks for 6 pairwise comparisons between the 4 multi-morbidity scores. For visual reference, the one-to-one diagonal line (black dashed line and black arrow) and the lowess smoothed line (green solid line and green arrow) are shown. Strong agreement between the scores was observed for all 6 comparisons. Abbreviations: CCS = Clinical Classifications Software, 190 chronic condition score; CHAP = Body system chapters (collapsed CCS system), 18 chapters score; DHHS = Department of Health and Human Services, 20 condition score; ELIX = Elixhauser comorbidity index, 31 condition score.
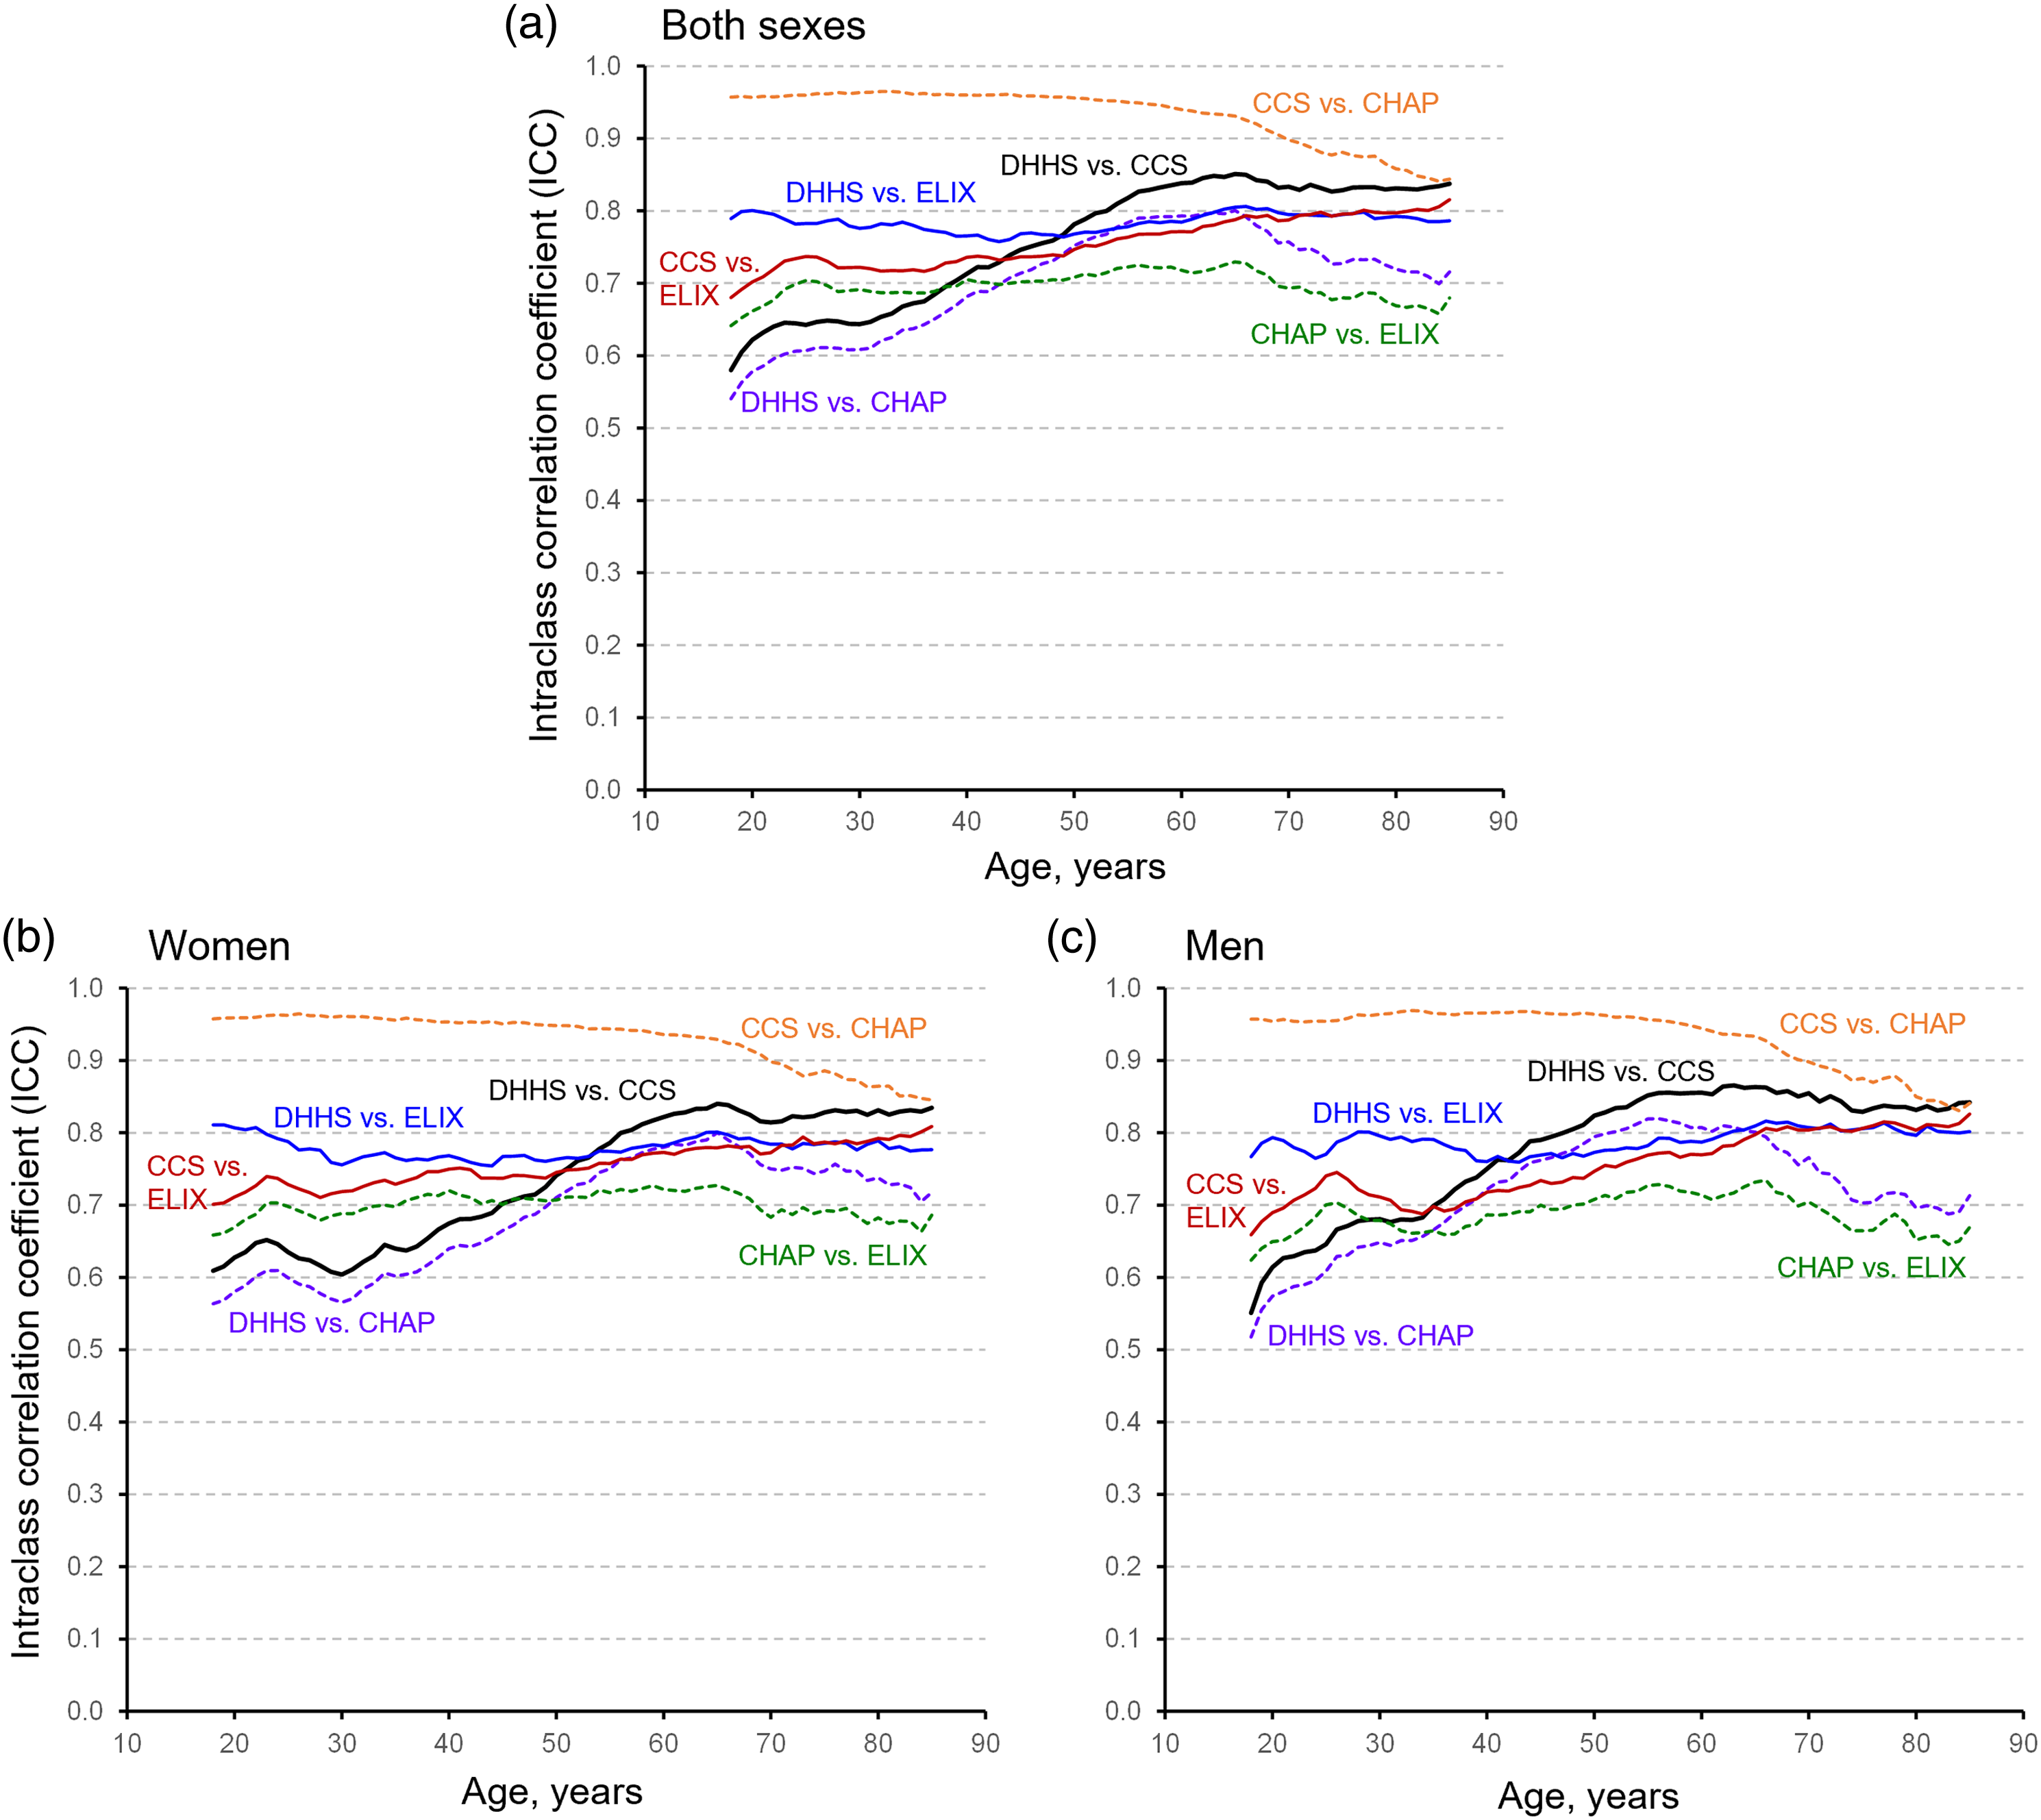
Intraclass correlation coefficients for 6 pairwise comparisons between the 4 multi-morbidity percentile ranks plotted across age (18 to 85 years) for both sexes combined (panel A) and separately for women (panel B) and men (panel C). Abbreviations: CCS = Clinical Classifications Software, 190 chronic condition score; CHAP = Body system chapters (collapsed CCS system), 18 chapters score; DHHS = Department of Health and Human Services, 20 condition score; ELIX = Elixhauser comorbidity index, 31 condition score.
The table in Supplemental Digital Content 5 shows the ICC values for 6 pairwise comparisons between the 4 multi-morbidity percentile ranks scores by age (in 10-year increments), by race (non-White and White), and by ethnicity (Hispanic and non-Hispanic). The results from the 6 pairwise comparisons were similar across race and ethnic groups.
Discussion
Principal findings
After transformation of multi-morbidity scores into age- and sex-specific percentile ranks, the 4 scores exhibited high levels of agreement and supported the idea of a common underlying “multi-morbidity” construct. In particular, the 2 commonly used and clinically derived multi-morbidity scores, DHHS and Elixhauser, exhibited substantial agreement across all adult ages 18 through 85 years. As expected, we observed almost complete agreement between the 190 CCS chronic conditions score and the condensed 18 CCS Chapters (CHAP) score at all ages. The agreement between percentile ranks was lower at ages younger than 50 years when both scores included a small number of conditions (DHHS vs. CHAP), or when at least 1 score included a small number of conditions (DHHS vs. CCS). However, in general, the pairwise agreement across the 4 multi-morbidity percentile ranks was higher at ages 50 years and older.
We included scores ranging from 18 chapters of the CCS to 190 CCS chronic conditions. Our findings suggest that the percentile rank of a person compared to peers of same age and sex is a consistent measurement across 4 multi-morbidity scores, particularly at ages 50 years and older. The lack of agreement of multi-morbidity percentile ranks in younger persons is somewhat expected because younger persons are generally healthier, have fewer medical visits, and have a limited range of observed raw multi-morbidity scores. In addition, most multi-morbidity scores include conditions common in the aging population (e.g., hypertension) but less frequently include conditions common in young persons (e.g., autism). For example, the DHHS score does not include obesity or anemia, whereas these conditions are included in the CCS and Elixhauser scores (and may both be common and important in younger persons). Thus, when transforming raw multi-morbidity scores to a percentile rank, the addition of 1 additional chronic condition leads to a marked jump in a person’s percentile rank. In other words, multi-morbidity scores consisting largely of age-related conditions can only assess the upper tail of percentile ranks at younger ages. By contrast, persons at older ages have a broader range of observed raw multi-morbidity scores, allowing for more granularity in classifying persons into percentile ranks as compared to their peers.
Our analyses demonstrate strong agreement of the multi-morbidity percentile ranks for the 20 DHHS conditions as compared to the percentile ranks obtained using the more extensive list of 190 CCS chronic conditions and the 31 Elixhauser conditions. The agreement was particularly strong at ages 50 years and older. In summary, our study suggests that the 20 DHHS conditions are adequate in number and type to assign percentile ranks relative to peers of the same age and sex and to capture the underlying trait of multi-morbidity as well as the 190 CCS chronic conditions and the 31 Elixhauser conditions.
Unfortunately, there is no consensus on how many conditions, what clusters of conditions, or what severity of conditions should be used to define multi-morbidity.9,28-30 Our results suggest that the underlying trait of multi-morbidity may be well captured by a multi-morbidity score with as few as 18 to 20 conditions, particularly at older ages. Furthermore, our results suggest that agreeing upon a universal set of conditions to define multi-morbidity may not be necessary if the conditions included in a score cover a broad range of body organ and sensory systems. Our findings are consistent with some models in frailty research which suggest that an accumulation of “deficits” is a proxy measure of aging.31,32 The 4 multi-morbidity scores included in our study can be thought of as alternative ways of summarizing chronic conditions as accumulated deficits. Indeed, our previous results for mortality risk using percentile ranks of multi-morbidity (DHHS 20 conditions) are strikingly similar to results from a study using a frailty index that included 46 deficits.10,33 Therefore, the current study extends to multi-morbidity research a methodology that has been used previously in some frailty research. 34
Strengths and weaknesses
The strengths of this study include access to medical record data (specifically, billing codes) on all conditions for an entire geographically-defined population across age, sex, race, and ethnic groups, regardless of insurance status, socioeconomic status, and care delivery setting. This study design should have minimized selection bias. Medical record data are often difficult to obtain in the United States because there is no centralized health care surveillance system and no comprehensive, clinical records-based data sets for all ages and for all regions. 35 Therefore, the REP offered a unique setting to study multi-morbidity across all ages within a local context.5,11 In addition, because data were generated historically as part of routine medical care, persons were not involved in remembering or reporting medical events or diagnoses. This study design should have minimized recall bias.
A limitation of this study, which is shared with many other similar studies, is the limited validity of ICD-9 codes from administrative databases to define each specific chronic condition. Previous REP studies have shown that codes may be assigned in error, and manual review of the medical records is often needed to ascertain whether a person truly has the disease or condition of interest.5,36-40 We recently published a comparison of ICD-9 codes vs. nurse abstraction of the full medical charts to identify 17 of the 20 chronic conditions included in the DHHS score. 41 The remaining 3 conditions could not be studied because they were too uncommon in the study sample (hepatitis, HIV infection, and autism spectrum disorder). Sensitivity and positive predictive value varied across the 17 chronic conditions, and were also influenced by the use of at least 1 diagnostic code or of at least 2 diagnostic codes separated by more than 30 days. 41 In this study, we limited false positive diagnoses by requiring at least 2 diagnostic codes separated by more than 30 days to define each individual condition for all 4 of the multi-morbidity scores. However, we may have undercounted certain conditions (reduced sensitivity).
Second, we only considered 4 multi-morbidity measures. There is not agreement on the optimal number and type of conditions needed to define multi-morbidity, or on the advantages and disadvantages of using weights for the conditions included. The optimal way to measure multi-morbidity likely depends on the purpose of the study.28-30 For example, we have consistently used the DHHS score in our previous studies of multi-morbidity.2,5,6,9,10,41 In this study, we investigated 4 multi-morbidity scores, all of which are defined using readily accessible ICD-9 code listings.15-18,20 We calculated simple unweighted multi-morbidity scores of the number of conditions at fixed ages. Because of feasibility and space limitations, we did not include all of the commonly used multi-morbidity scores in our comparisons. 29 However, we included scores with a wide range in number and type of included conditions (from a condensed grouping of 18 body-system chapters to 190 individual chronic conditions). In addition, we did not compare the 4 multi-morbidity scores in their ability to predict specific outcomes (e.g., hospitalization or 1-year mortality). Our analyses focused on whether the 4 multi-morbidity scores agreed in their measurement of the underlying “construct” of multi-morbidity in a well-defined population.
A third limitation of our study is the cross-sectional nature of the analyses used to develop the percentile ranks. 42 The persons residing in the county over a 10 calendar-year period were sampled based on having reached a certain birthday age. Therefore, the percentile distributions were based on the assumptions that all persons in a given age and sex stratum had the same multi-morbidity score profile regardless of the calendar year of the measure or of the calendar year of their birth. Our previous study of the DHHS score percentiles showed no systematic shifts in the distribution of multi-morbidity scores over the 10 calendar-year study period and no birth cohort effects. 10
Fourth, we did not assign percentile ranks separately in strata by race and ethnicity. Indeed, our previous study found that the percentile distribution of the DHHS scores did not vary by race or ethnicity in our population. 10 In the race and ethnicity stratified analyses in this study, the differences in agreement of the 4 multi-morbidity scores were small.
Finally, our study focused on a single geographically-defined US population, and the percentile distribution of multi-morbidity may differ in other populations. Nevertheless, the demographic and socioeconomic characteristics of our population are similar to those of the upper Midwest and of a large segment of the entire US population. 27 In addition, we emphasize that for our analyses of the agreement of the 4 score percentile ranks, a person functioned as his/her own comparison (i.e., 4 different scores were calculated using the same diagnostic information in a 5-year window of time before an index birthday). However, the percentile ranks may exhibit lower agreement in other populations if the frequencies of underlying conditions that make up the scores vary substantially. Replication of this study in other populations in the US and worldwide will allow for a more thorough understanding of the agreement between multi-morbidity measures.
Comparison with other studies
There is a growing body of literature describing the patterns of multi-morbidity in populations in the United States and worldwide;28,29 however, we are not aware of studies that have compared percentile ranks across several multi-morbidity scores to assess agreement. Our findings suggest that the use of percentile ranks is consistent across 4 multi-morbidity scores applied to the same population. Further studies are needed to confirm that this convergence of measures is also maintained across populations with different baseline prevalence of conditions. If this convergence is maintained, results from studies using different numbers or types of chronic conditions to define multi-morbidity may be compared using percentile ranks. Our results also suggest that a limited set of conditions covering the body’s key sensory and organ systems may be sufficient to capture multi-morbidity status, particularly at ages 50 years and older. This finding has both clinical and research implications. Further research is needed to determine whether percentile ranks may be a more comparable way of predicting future adverse outcomes (e.g., hospitalization or short-term mortality) in the absence of an agreed upon universal measure of multi-morbidity.
Conclusions
Percentile ranks may provide a simple and intuitive measure of the health of persons as compared to peers of the same age and same sex living in the same population. The use of percentile ranks in research projects may also increase comparability across populations for studies using different numbers or types of chronic conditions to define multi-morbidity.
List of abbreviations
CCS: Clinical Classifications Software (CSS)
CHAP: CCS Chapters
DHHS: US Department of Health and Human Services
ELIX: Elixhauser comorbidity index
gcrq: growth charts regression quantiles
HIV: human immunodeficiency virus
ICC: Intra-class correlation coefficients
ICD-9: International Classification of Diseases, Ninth Revision
irr: inter-rater reliability
REP: Rochester Epidemiology Project
Supplemental Material
Supplemental Material - Convergence of four measures of multi-morbidity
Supplemental Material for Convergence of four measures of multi-morbidity by Brandon R. Grossardt, MS, Alanna M. Chamberlain, PhD, Cynthia M. Boyd, MD, MPH, William V. Bobo, MD, MPH, Jennifer L. St Sauver, PhD and Walter A. Rocca, MD, MPH in Journal of Multimorbidity and Comorbidity
Footnotes
Acknowledgements
The authors would like to thank Ms. Kristi Klinger for her assistance in typing and formatting the manuscript.
Author contributions
BRG, JLS, and WAR were involved in the conception and design of the study. BRG and WAR conducted the data analyses. BRG drafted the manuscript. All authors (BRG, AMC, CMB, WVB, JLS, and WAR) contributed to the interpretation of the data and provided critical revisions of the manuscript. All authors (BRG, AMC, CMB, WVB, JLS, and WAR) also approved the final version to be published.
Declaration of conflicting interests
The author(s) declared no potential conflicts of interest with respect to the research, authorship, and/or publication of this article.
Funding
The author(s) disclosed receipt of the following financial support for the research, authorship, and/or publication of this article: This work was supported by the National Institute on Aging, National Institutes of Health [grant AG 052425]. In addition, this study used the resources of the Rochester Epidemiology Project (REP) medical records-linkage system, which is supported by the National Institute on Aging, National Institutes of Health [grant AG 058738], by the Mayo Clinic Research Committee, and by fees paid annually by REP users.
Ethics approval
All study procedures and ethical aspects were approved by the institutional review boards of both Mayo Clinic and Olmsted Medical Center. Because the data collection was historical, persons were not required to provide a study-specific informed consent but did provide a general consent to use their medical records for research (Minnesota legal requirements).
Data availability
To obtain the data that support the findings of this study, the user must submit a brief outline of the intended use of the data (no longer than a page). In addition, the user will be required to sign a data sharing agreement and pay for the preparation of the shared file of de-identified data.
Disclaimer
The content of this article is solely the responsibility of the authors and does not represent the official views of the National Institutes of Health (NIH) or the Mayo Clinic.
Supplemental Material
Supplemental material for this article is available online.
References
Supplementary Material
Please find the following supplemental material available below.
For Open Access articles published under a Creative Commons License, all supplemental material carries the same license as the article it is associated with.
For non-Open Access articles published, all supplemental material carries a non-exclusive license, and permission requests for re-use of supplemental material or any part of supplemental material shall be sent directly to the copyright owner as specified in the copyright notice associated with the article.