
Abstract
Background:
Polycystic ovary syndrome (PCOS) is one of the most prevalent endocrinopathies among young women. Ultrasound evidence of polycystic ovaries is one of its crucial diagnostic criteria.
Objectives:
Our main objective is to study the contribution of ultrasound data in diagnosing PCOS. In addition, we aim to establish a new cutoff point for the use of ultrasound and to determine its sensitivity as well as its specificity.
Design:
It was a prospective study, including all patients presenting with clinical hyperandrogenism.
Methods:
The ultrasound examination of these patients was performed using a novel ultrasound machine (18 MHz) compared to an older ultrasound machine (2 Hz–8 MHz). Inclusion criteria encompassed adult female patients over 18 years presenting symptoms suggestive of PCOS, particularly hyperandrogenism and oligo-anovulation, meeting Rotterdam’s diagnostic criteria. Prior to inclusion, assessments were conducted to eliminate other potential causes explaining hyperandrogenism or menstrual disorders in both groups.
Results:
We examined 92 patients diagnosed with PCOS. Menstrual disorders were the main symptoms, with amenorrhea being more frequent in the PCOS group (G1) (48.9% vs the control group (G2): 11.1%). The follicle number was significantly lower in the control group, as assessed by both ultrasound machines (p < 10−3). The accuracy of the new ultrasound device was evaluated compared to the old one using the receiver operating characteristic (ROC) curve, revealing a cutoff of 18 follicles (sensitivity of 68.1%, specificity of 100%) and an area under the curve of 0.955. We found a significant difference between the median values of the number of follicles (NF) by both ultrasound machines (18 vs 12). It was positively correlated with an index of r = 0.916. For the volume, it was distinctively higher in G1 (p < 10−3). ROC curve analysis revealed an ovarian volume cutoff of 9.25 ml with a sensitivity of 48.9% and a specificity of 100%. Both ultrasound machines were positively correlated with an index of r = 0.979 (p < 10−3).
Conclusion:
In conclusion, we were able to establish significant correlations between the new and the old ultrasound devices for both the NF and ovarian volume. Our study is distinctive as it represents the first on the African continent to re-evaluate the ultrasound criterion for PCOS.
Plain language summary
In this study, we explored patients using ultrasound to better diagnose Polycystic Ovary Syndrome (PCOS) in North African women. Ovarian follicles are small sacs in a woman’s ovaries that not only release eggs but also produce important hormones like estrogen and progesterone. These hormones regulate the menstrual cycle, prepare the body for pregnancy, and influence many aspects of a woman’s health and well-being. We set new standards for measuring follicles and ovaries to improve diagnosis accuracy. Background: Polycystic Ovary Syndrome (PCOS) is often diagnosed using ultrasound in North African women. Current ultrasound standards may not be accurate enough for this group. This study aimed to improve PCOS diagnosis by setting new standards for measuring ovarian sizes and follicle numbers. Methods: We reviewed a new ultrasound method. We then established new measurement thresholds specific to North African women. These new standards were tested for accuracy in diagnosing PCOS. Results: Our new measurement thresholds were more accurate in diagnosing PCOS. The improved standards led to better identification of PCOS in North African women. This suggests that current ultrasound methods might need adjustments based on population-specific data. Conclusions: Using ultrasound with new measurement standards can improve PCOS diagnosis in North African women. Adjusting diagnostic criteria to specific populations may enhance overall healthcare outcomes.
Introduction
Polycystic ovary syndrome (PCOS) is an endocrine and metabolic disorder that frequently affects women of reproductive age, with an estimated prevalence of 116 million women (3.4%), making PCOS the leading endocrinopathy in young women of reproductive age.1,2
PCOS arises from a complex interplay of hormonal dysregulation originating from both the ovaries and the central endocrine system. 2 This dysregulation involves disturbances in the hypothalamic–pituitary–ovarian (HPO) axis, leading to aberrant levels of, which, in turn, disrupt ovarian follicular development and steroidogenesis. 3 In addition, insulin resistance plays a significant role in PCOS pathogenesis, contributing to hyperinsulinemia, which further exacerbates ovarian dysfunction and androgen excess. 4 It leads to an excessive production of androgens, particularly testosterone, usually produced in small quantities in the female body.3,4 Currently, the diagnosis is made in the presence of at least two of the three Rotterdam criteria, namely clinical (hirsutism, moderate to severe acne, androgenic alopecia) or biological hyperandrogenism, and oligo-anovulation (irregular or absent ovulation). According to the Rotterdam criteria, cycles shorter than 21 days or longer than 35 days are considered anovulatory 5 and the presence of at least one ovary with more than 12 follicles of 2–9 mm in diameter and/or an ovarian volume (OV) greater than 10 ml without the presence of cysts or dominant follicles is considered on endovaginal ultrasound.6,7
However, in recent years, advances in imaging technology have improved the ultrasound appearance of polycystic ovaries, providing a more accurate view of the internal structure of the ovary.8,9
Therefore, after more than 20 years of establishing the Rotterdam criteria, it is emphasized that new ultrasound standards are needed to diagnose ultrasound polycystic ovaries, especially the change in the threshold number of follicles (NF) per ovary (modified to 20 or more).5,10 This has certainly been facilitated by the advent of new ultrasound devices with deep probes capable of reaching 8 MHz, but no study in the African continent has investigated the new criteria for ultrasound PCOs.
Apart from the OV and the NF, some other ultrasound characteristics help diagnose PCOS: follicular distribution pattern (FDP), number of antral follicles (NAF), resistance index (RI), pulsatility index (PI) of uterine and ovarian arteries, and ovarian stromal (OS) echogenicity.11,12
However, the follicular threshold as well as these parameters have been mainly validated in European or American studies using state-of-the-art ultrasound machines. In Africa, no study has validated these parameters using the latest generation ultrasound machines. 13
Our study was, therefore, the first effort aiming to compare ultrasound parameters for the exploration of PCOS on the African continent. Its purpose was to validate the follicular threshold and ovarian size in PCOS using the latest generation ultrasound machine (18 MHz) compared to the standard device (2 Hz–8 MHz).
Patients and methods
It was a prospective, analytical, and diagnostic single-center study focusing on all patients seeking care for PCOS over 12 months. We followed recent 2023 guidelines in the diagnosis of PCOS. 10 The reporting of this study conforms to the Supplemental Material—STARD Checklist. 11
The following criteria were included in this study:
Adult female patients over the age of 18 years old
All patients who attended consultations for symptoms suggestive of a PCOS diagnosis (particularly clinical or biochemical hyperandrogenism and oligo-anovulation)
The group with PCOS phenotype A (who had all three Rotterdam’s diagnostic criteria)
Before including these patients, an assessment was conducted to eliminate all other potential causes explaining the symptoms of hyperandrogenism or menstrual disorders in both groups.
We excluded patients with other conditions that could mimic the symptoms of PCOS, such as hyperprolactinemia, congenital adrenal hyperplasia, and thyroid disorders. All the hormonal assessments for these conditions were checked up in all patients and were normal. In addition, patients on medications known to affect hormonal profiles were excluded, such as hormonal contraceptives, glucocorticoids, antipsychotics, and antiepileptic drugs.
We conducted a sample size calculation using the formula appropriate for our study type:

where:
n = sample size
z = confidence level: for a confidence level of 95%, z = 1.96
p = prevalence of PCOS in the Tunisian female population of reproductive age estimated at 4.73% (represents the prevalence of PCOS in Tunisia in 2019 among women aged 15–45 years)
i = tolerated margin of error = precision: we want to know the true proportion within 5%.
The calculation yields a sample size of n = 70 patients. Therefore, this threshold would be statistically representative of the population. Since recruitment took place over 1 year, we increased the final number due to the likely increase in PCOS prevalence since 2019. The final sample consisted of n = 92 patients.
Hormonal exploration
We checked for any use of hormonal treatments (cortisone, thyroxine, combined oral contraceptives).
Prolactin (PRL), testosterone, estradiol (E2), follicular stimulating hormone (FSH), and luteinizing hormone (LH) levels were measured from morning venous samples taken at the beginning of the follicular phase (days 3–5) of the spontaneous menstrual cycle. The samples were collected in a dry tube for the measurement of all hormones.
Ultrasound explorations
The examination was conducted with abdominal ultrasounds on the third to the fifth day of the menstrual cycle. Each ovary was anatomically studied about the utero-ovarian ligament. The parameters included the following: NF, OV, ovarian parenchyma, and FDP.
The ultrasound examination was performed using two different devices: ALOKA ALPHA 6, ALOKA (2 Hz–8 MHz) and CANON Aplio A, CANON (18 MHz).
Group analysis
The study population was divided into two groups:
G1: Included patients who had all three Rotterdam’s diagnostic criteria (phenotype A in the phenotypic classification of PCOS).
G2 (control group): Included patients who were not diagnosed with PCOS.
Statistical analysis
We used statistical software (IBM SPSS Version 23.0) for data entry and analysis. The reference software used is Calrivate Endnote X6.5. The results of the assays were expressed as averages. To compare patients in the two subgroups, we used the Student’s “t” test for quantitative variables and the Chi-square test for qualitative variables when the validity conditions allowed. The association between two quantitative variables was studied using the Pearson correlation coefficient.
The correlation study between two quantitative variables was performed using the Spearman correlation (the non-parametric equivalent of the Pearson correlation).
The search for the validity threshold of ultrasound parameters with a device >8 MHz compared to a device <8 MHz was done using the receiver operating characteristic (ROC) curve. The area under the curve (AUC) corresponds to the probability that a randomly chosen patient with the diagnosis has a higher value than a patient without the diagnosis (assuming the diagnosis is associated with higher values). The more informative the test, the more the ROC curve will be in the upper-left quadrant of the graph, and the closer the ROC is to 1. An AUC > 0.7 is considered good. A test with an AUC of 0.5 (corresponding to the diagonal) performs no better than chance.
Results
Our study population comprised 92 female patients divided into two groups (G1 and G2) of 47 and 45 patients, respectively. The median age of our patients was identical between the two groups, 22 years [20, 27] in G1 and 22 years [21, 28] in the control group, with extremes ranging from 18 to 39 years. The distribution of patients according to age was comparable in both groups (p = 0.510). In terms of cycle duration, G1 exhibited a median of 38 days [28, 60], significantly longer than the control group’s 29 days [28, 31]. Notably, spaniomenorrhea occurred in 48.9% of G1 patients compared to 11.1% in the control group. The frequency of cycles per year was lower in G1, with a median of 10 [6, 12], whereas the control group averaged 12 cycles per year [11, 12].
The frequency of androgenic alopecia was 22.2% for the control group versus 53.2% in G1, while acne was present in 97.9% of cases for G1 and 84.4% of cases in the control group.
The frequency of hirsutism was 76.6% in G1, significantly higher than in the control group, around 55.6%. Hirsutism was mild in 17% of cases in G1 and 40% of cases in the control group (Table 1).
Evaluation of hirsutism between the two groups G1 and G2.

G1, Group 1; G2, Group 2.
There was no difference regarding cholestasis within G1 and the control group; however, a significant difference was noted between the two groups concerning cytolysis. LH was 9.04 mIU/ml [7.48–12] for G1 and 7 mIU/ml [5.91–8.33] for the control group. The LH/FSH ratio was greater than 1 in 83% of cases for G1 versus 17.8% for the control group (Table 2).
Hormonal assessment measured in G1 and G2.
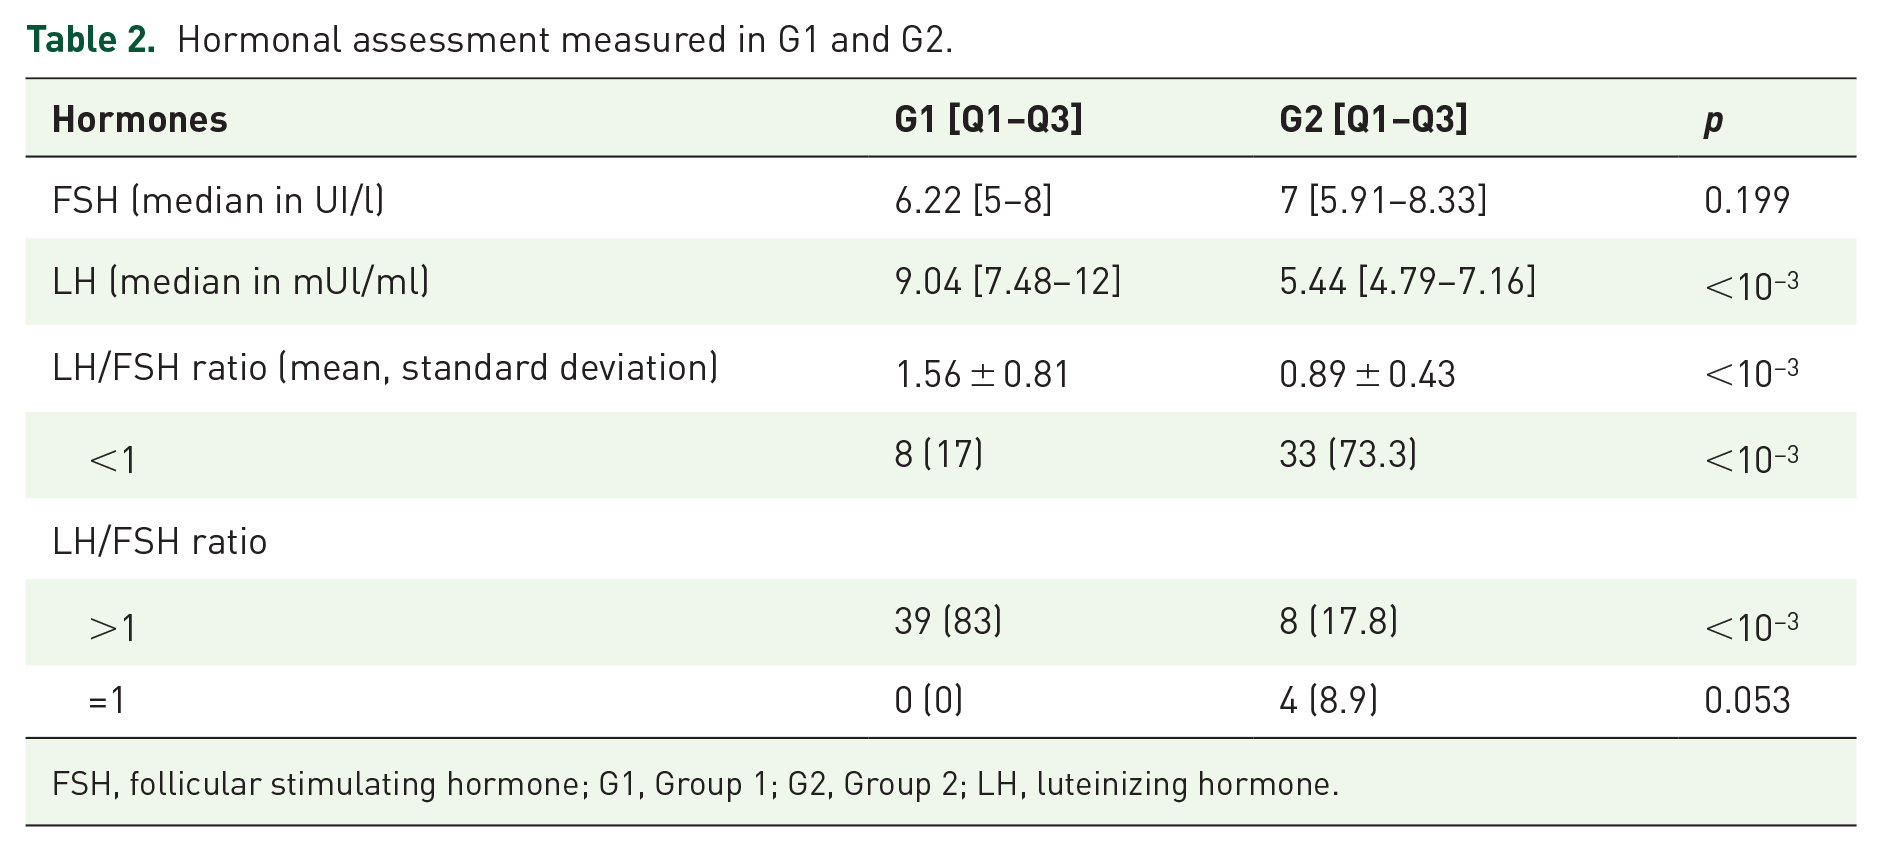
FSH, follicular stimulating hormone; G1, Group 1; G2, Group 2; LH, luteinizing hormone.
Testosterone levels were markedly higher in G1 (0.779 ± 0.173 ng/ml) compared to the control group (0.416 ± 0.145 ng/ml), reflecting hyperandrogenemia prevalent in 91.5% of G1 patients versus 6.7% in the control group. E2 levels were also significantly higher in G1.
The mean volume of the right ovary (RO) measured by the new and old ultrasound machines was 9.57 ml ± 4.9 and 8.59 ml ± 4.36 for G1, and 4.57 ml ± 2.37 and 3.93 ml ± 2.2 for the control group, respectively. Meanwhile, the average volume of the left ovary (LO) measured by CANON and ALOKA was 9.94 ml ± 5.02 and 8.99 ml ± 4.26 for G1 and 4.47 ml ± 2.12 and 4.04 ml ± 2.05 for the control group. The median value of the NF in the RO estimated by the new and old ultrasound machines was 20 follicles [14–22] and 12 follicles [10–14] for G1, and 9 follicles [7.5–12.5] and 6 follicles [4–9] for the control group, respectively.
The OS was hyperechoic in both ultrasound machines, in 80.9% of cases for G1 and 24.4% of cases for the control group. The follicles had a peripheral distribution, forming a string of pearls in 11.1% of cases in the control group, significantly lower than the 66% observed in G1.
The accuracy of the new ultrasound machine was assessed in comparison to the old ultrasound machine using the ROC curve. In the case of PCOS, the ultrasound criterion is a diagnostic parameter; therefore, the objective was to determine the NF value that ensures better specificity while maintaining an acceptable sensitivity and specificity ratio.
For the diagnosis of ultrasound-based PCOS, the ROC curve analysis revealed a cutoff of 18 follicles with a sensitivity of 68.1% and a specificity of 100%. The AUC was 0.955 with a confidence interval of [0.914, 0.995] (Figure 1).
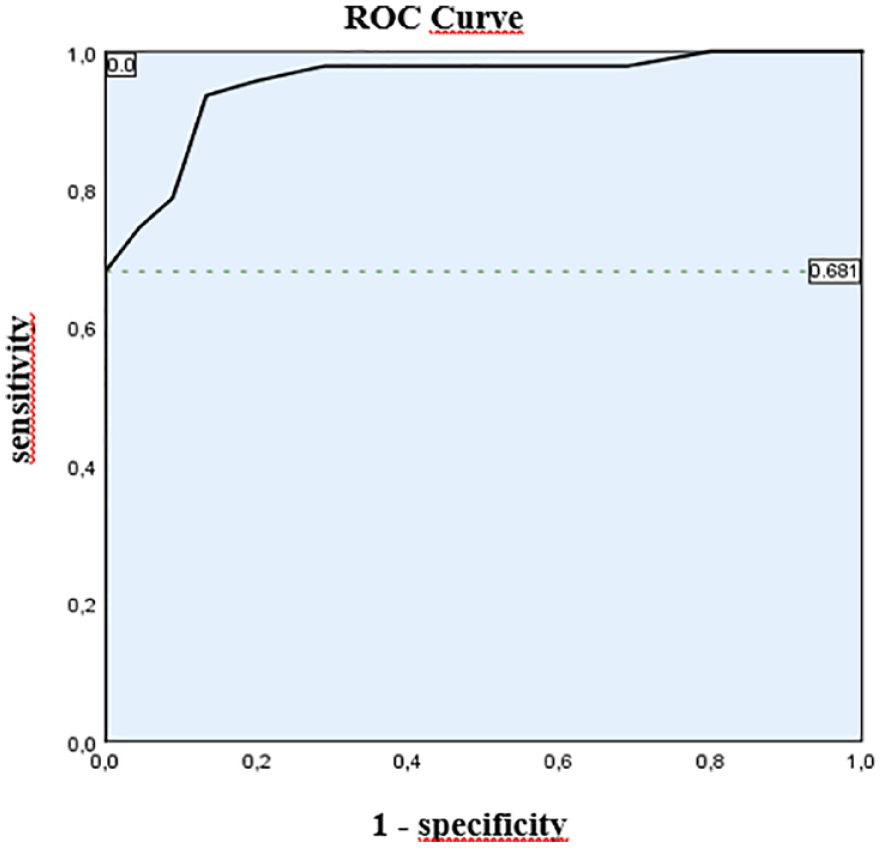
ROC curve of the follicle counts measured with 18 MHz.
Regarding OV, the ROC curve analysis identified a cutoff of 9.25 cm3 with a sensitivity of 48.9% and a specificity of 100%. The analysis of the same curve showed a cutoff that increases with decreasing sensitivity. The AUC was 0.87 with a confidence interval of [0.798, 0.942] (Figure 2).

ROC curve of the ovarian volumes measured by the ultrasound machine at 18 MHz.
The ordinate expresses sensitivity, and the abscissa expresses (1-specificity). The reference point is the intersection of a sensitivity of 48.9% and a specificity of 100%, which corresponds to a volume (VO) of 9.25 cm3 (orange dotted line). The intersection of a sensitivity of 59.6% and a specificity of 78% corresponds to a volume (VO) of 9 cm3 (green dotted line).There was a significant difference between the median values of NF measured by the two ultrasound machines: 20 [16–21] by CANON versus 12 [11–13] by ALOKA. The NF measured by both ultrasound machines was positively correlated with a correlation index (r) of 0.916 (Figure 3).

Scatter plot correlation of follicle numbers detected by two ultrasound machines (r = 0.979, p < 10−3).
For ovarian size, both ultrasound machines were positively correlated with a correlation index (r) of 0.979 (Figure 4).

Scatter plot correlation of the ovarian volumes (OVs) detected by two ultrasound machines (r = 0.979, p < 10−3).
Discussion
The ultrasound evidence of PCOS has been reported for many decades in the literature. The relevance of the morphological structure of female gonads in the diagnosis of PCOS has sparked debates. This study enabled us to establish a new cutoff for the use of ultrasound, as well as determine its sensitivity and specificity. To our knowledge, this was the first study aiming to compare the ultrasound parameters of an older device to those of a new ultrasound machine for exploring North African PCOS patients.
Since 1980, with the introduction of real-time high-resolution ultrasound devices, more precise criteria have been established. Adams et al. used abdominal ultrasound to define PCOS. 14 Ultrasound features of PCOS were characterized by follicles measuring 2–6 mm in diameter, although their specific number was not defined. 15 Subsequently, they were defined as the presence of 12 follicles or more, measuring between 2 and 9 mm throughout the ovary and/or a volume greater than 10 cm3. 16
However, this choice was based on a literature review and expert discussions, lacking an analysis of the ROC curve. Hence, since 2003, a significant amount of literature has been published challenging the Rotterdam ultrasound criteria for PCOS. According to a study by Dewailly et al., with the improvement of high-definition imaging technology, it was recommended to use the Antral Follicle Count (AFC) to define PCOS, setting the threshold at ⩾25. However, this recommendation was valid only when the transducer frequency was ⩾8 MHz. 17
In this study, we revised the diagnostic thresholds for ultrasound PCOS established by the Rotterdam consensus while comparing two ultrasound devices with differing frequency ranges. This approach included a re-evaluation of the NF threshold in addition to the OV. By using a state-of-the-art ultrasound device (1.8 Hz–18 MHz) compared to the standard ALOKA ALPHA 6 device (2 Hz–10 MHz), we anticipated higher thresholds for AFC and OV in the context of PCOS.
In a study conducted by Dewailly et al. in 2011, using an ultrasound device with a transducer of 5–9 MHz, a threshold of 19 follicles was obtained. 9 As for Köşüş et al., the mean NF was 10 and 5 for the PCOS group and controls, respectively. 18 In 2017, Sujata and Swoyam concluded a threshold of 18 follicles using an ultrasound device with a frequency of 6–12 MHz. 19 Our results were consistent with the findings in the literature.
The NF’s threshold from our study exceeded by 50% as stated by the Rotterdam consensus. Indeed, in our study, the cutoff for the NF by the new ultrasound device (with an abdominal probe ⩾8 MHz) determined by the ROC curve was 18 with a sensitivity of 68.1%, a specificity of 100%, and an AUC of 0.955. Whereas it was only 12 follicles by the ALOKA device with an abdominal probe of 2–6 MHz. The NF by both ultrasound devices was positively and significantly correlated (r = 0.916).
According to literature data, cutoff intervals ranged from 10 to 26, with an AUC of 0.909 for the threshold of 10, being the lowest, and an AUC of 0.987 for the threshold of 20 follicles, being the highest. 9 Of all determined values, the NF’s cutoff was almost always higher than that used by the Rotterdam criteria but varied among authors.
Several key factors could explain the variations in follicle count between different studies. We used a much more recent ultrasound technology with a transducer frequency ⩾8 MHz. The improvement in image quality offered by newer devices since the time of the Rotterdam consensus likely facilitated the detection of an accumulated NF in our study, especially those of small size with a diameter ⩽2 mm or those that were adjacent. 20
In our study, the median value of the OV was 9.57 cm3 ± 4.9, measured by the new generation ultrasound device (⩾8 MHz) versus 8.59 cm3 ± 4.36 by the old ultrasound device (2–6 MHz).
According to literature data, in a study conducted by Atiomo et al. 21 in 2000, the OV threshold was set at 9 cm3 with a sensitivity of 88 and a specificity of 71. For Chen et al., the OV was measured with a 6 MHz probe and a threshold of 7.9 was set with a sensitivity and specificity of 85.2% and 92.6%, respectively While for Chen et al., the OV was measured with a 6 MHz probe, a threshold of 7.9 was set with sensitivity and specificity of 85.2% and 92.6%, respectively. 22 In a study conducted by Sujata et al. in 2017, involving 131 women and using an ultrasound device with a frequency of 6–12 MHz, an OV threshold of 11.23 cm3 was noted. 19
In our study, the OS was hyperechoic with both ultrasound devices in 80.9% of women with PCOS. This aligns with the work of Adams et al. in 1985, who characterized PCOS by the presence of a strongly echogenic OS. 23
Information from existing studies suggested that the OS was a significant indicator of PCOS presence. Increased echogenicity of the OS appeared to be correlated with histological findings, including prominent theca and fibrous thickening of the albuginea, as described by Stein and Leventhal in 1935. 23
According to Kyei-Mensah, among the most reliable characteristics was the OS exhibiting hyperechogenicity. 24 However, in a study using abdominal ultrasound with a 5 MHz transducer, Buckett et al. found no significant difference in average stromal echogenicity between groups. 25
Regarding FDP, in a recent study conducted by Wang et al. in 2023, the sensitivity and specificity were 73% and 82%, respectively, for the peripheral distribution of follicles. 26 This aligns with the data from our study, where 66% of women with PCOS had a peripheral FDP, resembling a string of pearls.
In PCOS, the ultrasound criterion is a diagnostic parameter; hence, the objective was to identify NF and the OV values that ensure better specificity while maintaining an acceptable sensitivity and specificity ratio.
In this study, the analysis of the ROC curve revealed a cutoff of 9.25 cm3 with a sensitivity of 48.9% and a specificity of 100%. The analysis of the same curve found a cutoff that increased with decreasing sensitivity. The AUC was significantly 0.87, and both ultrasound devices were positively correlated with an index of r = 0.979.
According to literature data, cutoff ranges for the OV varied between studies and fluctuated between 7 and 13 cm3. In the study by Lujian et al., the OV threshold was consistently around 10. 8
This variability is explained, on the one hand, by the different characteristics of the ultrasound devices used, noting that the use of a frequency >8 MHz is highly recommended, and, on the other hand, by the difference in the ethnicity of women in each study.
The thresholds for NF and OV in diagnosing PCOS will always be subject to constant evolution, given the continuous emergence of new ultrasound devices with higher resolution and more advanced features. It is essential to consider the specific characteristics of each ultrasound device when establishing a diagnosis. Although 3D ultrasound remains an option, its superiority over NF or VO has not yet been demonstrated by studies, leaving this alternative in suspense.
An intriguing avenue for further exploration lies in drawing parallels between the effects of PCOS and uterine aging on reproductive outcomes. Just as PCOS, characterized by endocrine signal alterations, can profoundly impact fertility, uterine aging has been increasingly recognized as a factor influencing reproductive success. 27 Exploring potential interactions between the endocrine dysregulation seen in PCOS and the physiological changes associated with uterine aging could offer valuable insights into understanding and managing fertility issues in PCOS patients. Furthermore, it is noteworthy to consider recent advancements in therapeutic approaches for PCOS management. Investigating the efficacy of novel therapeutic strategies like metformin or Glucagon-Like Peptide-1 (GLP-1) agonists in PCOS patients. 28 These interventions hold promise in addressing not only the endocrine dysregulation but also the associated metabolic disturbances in PCOS. Moreover, integrating novel therapeutic strategies such as modified resveratrol with established treatments like metformin or GLP-1 agonists may offer comprehensive care for individuals with PCOS, emphasizing the importance of personalized approaches in managing this complex condition. 29
Our study undoubtedly had certain limitations. First, aside from the ultrasound data collected, the PI and RI could not be thoroughly studied as the uterine and ovarian arteries were very fine and delicate to assess. Even with our state-of-the-art ultrasound device, we were unable to identify and measure their indices in the majority of our patients. This limitation was attributed to the existence of other more powerful ultrasound devices and the obesity of some patients, making these arteries less visible. Second, assays for certain hormones such as delta 4-androstenedione and SDHEA were not performed. These hormones, even if measured as a secondary assessment, could have provided more information on the hyperandrogenic phenotype of our patients.
Conclusion
The increasing prevalence of PCOS has elevated it to the most common endocrinopathy in women of reproductive age. The advent of newer devices and high-frequency probes has enabled a more precise internal view of the ovaries, suggesting more specific criteria for defining this syndrome. Our data led to the determination of a new cutoff of 18 follicles with a sensitivity of 68.1% and a specificity of 100%. For OV, a cutoff of 9.25 cm3 was identified with a sensitivity of 48.9% and a specificity of 100%. Our study confirmed significant correlations between the new, high-frequency ultrasound device (⩾8 MHz) and the old ultrasound device for NF and OV. However, the ultrasound diagnosis of PCOS remains under constant reevaluation, particularly with the continuous emergence of increasingly advanced high-resolution technologies, such as 3D ultrasound.
Supplemental Material
sj-docx-1-reh-10.1177_26334941241270372 – Supplemental material for Validation of the follicular and ovarian thresholds by an 18-MHz ultrasound imaging in polycystic ovary syndrome: a pilot cutoff for North African patients
Supplemental material, sj-docx-1-reh-10.1177_26334941241270372 for Validation of the follicular and ovarian thresholds by an 18-MHz ultrasound imaging in polycystic ovary syndrome: a pilot cutoff for North African patients by Taieb Ach, Ayoub Guesmi, Maha Kalboussi, Fatma Ben Abdessalem, Emna Mraihi and Houda El Mhabrech in Therapeutic Advances in Reproductive Health
Footnotes
References
Supplementary Material
Please find the following supplemental material available below.
For Open Access articles published under a Creative Commons License, all supplemental material carries the same license as the article it is associated with.
For non-Open Access articles published, all supplemental material carries a non-exclusive license, and permission requests for re-use of supplemental material or any part of supplemental material shall be sent directly to the copyright owner as specified in the copyright notice associated with the article.