
Abstract
Background
Despite the ubiquity of multilevel sampling, design, and analysis in mental health implementation trials, few resources are available that provide reference values of design parameters (e.g., effect size, intraclass correlation coefficient [ICC], and proportion of variance explained by covariates [covariate R2]) needed to accurately determine sample size. The aim of this study was to provide empirical reference values for these parameters by aggregating data on implementation and clinical outcomes from multilevel implementation trials, including cluster randomized trials and individually randomized repeated measures trials, in mental health. The compendium of design parameters presented here represents plausible values that implementation scientists can use to guide sample size calculations for future trials.
Method
We searched NIH RePORTER for all federally funded, multilevel implementation trials addressing mental health populations and settings from 2010 to 2020. For all continuous and binary implementation and clinical outcomes included in eligible trials, we generated values of effect size, ICC, and covariate R2 at each level via secondary analysis of trial data or via extraction of estimates from analyses in published research reports. Effect sizes were calculated as Cohen d; ICCs were generated via one-way random effects ANOVAs; covariate R2 estimates were calculated using the reduction in variance approach.
Results
Seventeen trials were eligible, reporting on 53 implementation and clinical outcomes and 81 contrasts between implementation conditions. Tables of effect size, ICC, and covariate R2 are provided to guide implementation researchers in power analyses for designing multilevel implementation trials in mental health settings, including two- and three-level cluster randomized designs and unit-randomized repeated-measures designs.
Conclusions
Researchers can use the empirical reference values reported in this study to develop meaningful sample size determinations for multilevel implementation trials in mental health. Discussion focuses on the application of the reference values reported in this study.
Plain Language Summary
To improve the planning and execution of implementation research in mental health settings, researchers need accurate estimates of several key metrics to help determine what sample size should be obtained at each level of a multi-level study (e.g., number of patients, doctors, and clinics). These metrics include the (1) effect size, which indicates how large of a difference in the primary outcome is expected between a treatment and control group, (2) intraclass correlation coefficient, which describes how similar two people in the same group might be, and (3) covariate R2, which indicates how much of the variability in an outcome is explained by a background variable, such as level of health at the start of a study. We collected data from mental health implementation trials conducted between 2010 and 2020. We extracted information about each of these metrics and aggregated the results for researchers to use in planning their own studies. Seventeen trials were eligible, and we were able to obtain statistical information on 53 different outcome variables from these studies. We provide a set of values which will assist in sample size calculations for future mental health implementation trials.
Keywords
Background
Statistical power analysis is essential to designing implementation trials that achieve the dual goals of robustly testing scientific hypotheses while minimizing the use of finite scientific resources (Cohen, 2013; Faul et al., 2009; Kraemer & Blasey, 2016; Lipsey, 1995; Muthén & Muthén, 2002; Sedlmeier & Gigerenzer, 1989). Using power analysis, investigators determine the smallest sample size required to statistically detect the effect of interest (Hedges & Hedberg, 2007). If the sample is too small, statistical analyses will not detect an effect even if one exists (Cohen, 1992; Rosenthal et al., 1994). Conversely, enrolling a larger sample than necessary wastes resources and unnecessarily burdens participants. Balancing these priorities is especially important in implementation trials because the cost of recruiting and retaining sites and participants is often high.
Sample size calculation for implementation trials is often complicated by the multilevel context within which healthcare is delivered (Eccles & Mittman, 2006; Novins et al., 2013; Proctor et al., 2009). This multilevel context (e.g., patients nested within clinicians nested within clinics) generates dependencies within the data which result in incorrect statistical inferences if they are not accounted for by the statistical models (e.g., mixed effects; generalized estimating equations) (Goldstein, 2013; Snijders & Bosker, 1999). The use of these models requires specialized procedures for determining the necessary sample size at each level of the design.
Statistical theory for computing required sample sizes in multilevel designs is well-developed (Bell et al., 2008; Hox et al., 2018; Konstantopoulos, 2008b, 2008a; Raudenbush, 1997; Raudenbush & Liu, 2000; Scherbaum & Ferreter, 2009; Snijders, 2014) and software tools are available (Bhaumik et al., 2008; De Jong et al., 2010; Raudenbush & Liu, 2000; Zhang & Wang, 2009). However, these tools require investigators to input multiple design parameters which are often unknown, yet highly influential. Key design parameters for multilevel trials include (1) the anticipated effect size of the implementation strategy, which quantifies the expected standardized effect of the strategy relative to control at the study endpoint, (2) the intraclass correlation coefficient (ICC or ρ), which quantifies the degree of within-unit correlation or dependency among individuals nested within the same unit (e.g., patients nested within a provider); and (3) the proportion of variance explained by covariates (covariate R2), which indicates how much of the variance in the outcome is explained by baseline control variables, such as participant demographic characteristics or pretest scores on the outcome (Snijders, 2014; Raudenbush & Liu, 2000). Obtaining accurate estimates of these design parameters is essential because relatively small changes in their values substantially influence the required sample size. For example, minor variations in effect size (Cohen's d = .25, .35, .45) and ICC (ρ = .02, .08, .12) can alter the number of sites required for adequate power from 21 to more than 99.
For any trial, the choice of which design parameter estimates to use in power analysis should be guided by estimates obtained from similar prior research and knowledge of the minimum clinically important differences in the given context. For example, the effect size estimate would ideally reflect the minimum clinically important benefit, with guidance from prior research about what effect sizes are reasonable given the substantive area. Unfortunately, design parameter estimates are rarely included in published research reports (Eldridge et al., 2004; Isaakidis, 2003), particularly in the still nascent field of implementation science (Pinnock et al., 2017; Wilson et al., 2017), despite clear guidance from the Consolidated Standards of Reporting Trials (CONSORT) extension for cluster randomized trials (Campbell et al., 2004). For example, in reviewing the effect of the CONSORT extension, Ivers et al. (2011) found that only 18% of 300 cluster randomized trials reported ICC values. Recent reviews suggest reporting rates are still low (Offorha et al., 2022). This leads investigators to develop power analyses based on crude rules of thumb (Killip, 2004) or on unreliable estimates from small pilot studies (Hedges & Hedberg, 2007; Killip, 2004; Kraemer et al., 2006; Leon et al., 2011). Many research proposals rely on Cohen's small, medium, and large effect size ‘guidelines’ even though Cohen strongly cautioned against using his guidelines as benchmarks (Cohen, 1988). Empirical studies confirm the importance of discipline-specific design parameter values by showing that these values vary greatly by discipline and outcome (Bosco et al., 2015; Dong et al., 2016; Hedges & Hedberg, 2007, 2013).
Discipline-specific plausible values of design parameters are needed to determine sample sizes for implementation trials in mental health but are currently not available. The goal of this study was to fill that gap by systematically identifying multilevel implementation trials focused on mental health evidence-based interventions (EBIs) and extracting from the analysis of those trials values of effect size, ICC, and covariate R2 for all reported continuous and binary implementation and clinical outcomes. We sought to summarize the central tendency and range of these design parameters in order to provide plausible reference values for implementation scientists to determine sample size in their own trials in mental health settings. In addition, we examined the relationship between the magnitude of each of the design parameters and selected study characteristics (e.g., outcome type, measurement approach) with the goal of providing investigators with more nuanced guidance for designing trials.
Method
We identified potentially eligible mental health implementation trials through searches of NIH RePORTER, a congressionally mandated, web-based repository of NIH-funded research in the USA. RePORTER allows users to identify trials funded by specific Institutes/Centers (i.e., National Institute of Mental Health (NIMH); in response to specific funding opportunity announcements; by key words; by project type (e.g., research grants, centers); and for specific start and end dates. To ensure the capture of relevant trials, four searches were conducted using different functions: (1) key word search, (2) funding opportunity announcement search for dissemination- and implementation-related proposals, (3) study section search (e.g., Dissemination and Implementation Research in Health, now known as Science of Implementation in Health and Healthcare), and (4) grant mechanism search. With help from a reference librarian and RePORTER staff, we used key words to optimize trial discoverability. See Supplemental File 1 for search parameters.
Eligibility Criteria
We limited our search to trials funded by the US NIMH with the assumption that federally funded trials were more likely to be appropriately powered and rigorously designed. Trials were included if they (1) randomly assigned units (e.g., persons, teams, clinics) to implementation strategies, (2) collected quantitative data on one or more implementation outcome or clinical outcome, (3) included nested or clustered observations, and (4) ended from January 1, 2010 to December 30, 2020.
Trials were excluded if they (1) only examined feasibility, acceptability, or appropriateness of an EBI, (2) only examined feasibility or acceptability of an implementation strategy, (3) only examined technology-based delivery versus in-person delivery of an EBI, (4) focused on HIV/AIDS (in the US, funding for HIV/AIDS is provided under the umbrella of NIMH), (5) were administratively terminated by NIMH prior to study completion (and therefore lacked data), and (6) were clinical effectiveness trials or hybrid type I effectiveness-implementation trials that only tested a clinical intervention versus a no-treatment control group. The latter were excluded because they did not have comparative data on implementation strategy effects.
Study Identification
Title and Abstract Screen
Two reviewers (NW and a doctoral-level social work researcher) screened all project titles and abstracts to determine potential eligibility. Reviewers met weekly to compare inclusion/exclusion decisions; disagreements were resolved through discussion with a third author (SM). In cases where the abstract was unclear, trials were retained to avoid premature exclusion of eligible trials.
Research Report Identification and Selection
Each NIH RePORTER project webpage lists all published articles which acknowledge the project's support (https://report.nih.gov/faqs). We extracted all articles linked with potentially eligible projects. Duplicate articles, non-empirical, and review articles were excluded. Two members of the research team (NC and a doctoral-level researcher) screened titles and abstracts of the remaining articles to identify those eligible for full-text retrieval and further screening. Disagreements on screening decisions were resolved through consensus. If no articles relevant to the study's primary aims were located from RePORTER, we searched for publications on ClinicalTrials.gov, PubMed, Google Scholar, and professional webpages of the study's principal investigator. Articles that met the criteria from these sources were downloaded as full texts to DistillerSR ( DistillerSR, 2023 ), a web-based systematic review management software, for additional screening (see the study flow chart in Supplemental File 2).
We included all articles that (1) had a primary aim that tested the effects of one or more implementation strategies on implementation or clinical outcomes, or (2) reported quantitative data on implementation determinants in relation to implementation or clinical outcomes in mental health settings. Articles were excluded if there was no evidence of a clustered design, no randomization to conditions, or no quantitative outcomes. We also excluded articles that only used count-dependent variables. To minimize the burden on principal investigators, we only retained the article reporting on the first endpoint of trials with multiple eligible articles.
Data Collection and Analysis
Design parameter extraction and calculation
We aimed to extract three design parameters—effect size (Cohen's d), ICC, and covariate R2 (R2cov)—from all eligible trials for all continuous and binary implementation and clinical outcomes. We used two extraction procedures. First, two members of the research team (NW & NC) independently extracted design parameter values (d, ICC, R2cov) for all implementation and clinical outcomes from published study reports using a structured, web-based platform. Conflicts were resolved by re-reviewing the report to generate consensus. Second, if values were not reported in publications, we contacted principal investigators directly to calculate design parameter values from their primary data (i.e., secondary data analysis). Initial contacts with investigators occurred via email, followed by web-based virtual or telephone meetings. Investigators were offered two options to share design parameters from their study: (1) share de-identified data with our team and we would calculate the design parameters directly, or (2) receive code for the statistical package of their choice, written by our team, run it on their data locally, and share the resultant output with us (where the output included the targeted design parameters). We leveraged the substantial professional network of our authorship team to solicit participation. Investigators who did not respond were contacted twice within one month after the initial invitation and a third time approximately six months later. Participating investigators or their analysts were compensated $2500 for their time.
We followed well-established guidelines for calculating Cohen's d (Cohen, 1992; Rosenthal et al., 1994), ICC (Campbell et al., 2004; Hedges & Hedberg, 2013), and R2cov (Dong et al., 2016; Hedges & Hedberg, 2013) for each outcome variable. Effect sizes were calculated using Cohen's d (Cohen, 1992; Rosenthal et al., 1994) because it is the metric most often required by statistical power programs. We computed effect sizes based on raw data or values reported in articles when unable to obtain model-estimated effect size estimates. Calculation details are provided in Supplemental File 1. We were able to calculate the effect size unadjusted for covariates for most trials; however, one trial only provided covariate-adjusted effect sizes which we included in our analyses. To assess whether inclusion of this covariate-adjusted effect size had an important impact on the results, we compared the central tendency and variation with and without this value (i.e., sensitivity analysis).
Intraclass correlation coefficients for continuous outcomes were calculated using the one-way ANOVA with random effects method described by Raudenbush & Bryk (2010). This approach partitions the unadjusted variance in the outcome by the level of the design (e.g., within-cluster variance vs. between-cluster variance) and produces k-1 ICCs (where k is the number of levels in the design), each of which indicates the proportion of total variance between units at a given level (see Supplemental File 1 for further details). Consequently, we extracted k-1 ICCs per outcome, per study. The calculation of ICCs for dichotomous (binary) outcomes is an area of ongoing research (Chan, 2019; Eldridge et al., 2009). We used a formula that is employed by many power analysis programs (e.g., PASS) and which assumes a continuous underlying trait that follows a logistic distribution (Ahn et al., 2020, p. 20; Eldridge et al., 2009). Supplemental File 1 provides further details.
Values of R2cov were calculated using formulas provided by Hedges and Hedberg (2013) and Dong et al. (2016). This method, which is sometimes called the reduction in variance components approach (LaHuis et al., 2014), was selected because it is frequently used in power analysis programs. The method produces a measure of R2cov for each level of the design; these R2cov values describe the proportion of variance in the outcome at that level that is explained by the covariates.
Study characteristic coding
Two reviewers (NW and NC) independently coded study characteristics using a form based on the Standards for Reporting Implementation Studies checklist (Pinnock et al., 2017). Coded study characteristics included: participant population; provider population; study setting; EBI; trial type (e.g., hybrid type II); trial design (e.g., individual randomized repeated measures, cluster RCT, multisite cluster RCT, stepped wedge); level of randomization; sample size (by level); implementation strategy conditions; implementation strategy targets (e.g., patient, provider, clinic); type of implementation outcome; type of clinical outcome; measurement approaches (e.g., observed, self-report); covariates included in the analysis (as applicable); and year of publication. Supplemental File 1 provides additional details on study characteristic coding.
Statistical Analysis
Data synthesis
We anticipated that the magnitude of effect sizes would depend on the implementation conditions compared. For example, a comparison of two active and equally potent implementation strategies might produce a smaller effect size than a comparison of a standard implementation strategy (e.g., training) vs. the same standard strategy plus an enhancement (e.g., training + audit and feedback). Accordingly, we categorized effect sizes into two types: (1) standard vs. enhanced effect sizes compared conditions in which both arms received one or more of the same strategies (i.e., standard) and one condition received an additional strategy (i.e., enhanced); (2) comparative effectiveness effect sizes compared conditions in which each arm received a distinct and potentially equally potent implementation strategy. Effect sizes for standard versus enhanced comparisons were calculated so that positive values indicated the superiority of the enhanced condition. Effect sizes from comparative effectiveness comparisons were calculated such that the condition with the more favorable effect was the referent, resulting in all positive effect size values. This permitted a standardized assessment of the overall magnitude of effects within these types of trials.
In order to generate meaningful descriptive analyses of the extracted ICCs, we divided ICCs into three conceptually distinct categories and produced separate descriptive analyses for each category. Category one included ICCs calculated from a repeated measures design (e.g., time within person) with only two levels, where time/observation = level 1 and person/unit = level 2. We labeled these longitudinal ICCs (ρL); they represent the within-unit correlation between observations on the same unit over time. The second category of ICCs included those calculated at level two of trials with cross-sectional designs (e.g., endpoint-only designs) as well as ICCs calculated at level three of trials with repeated measures designs (e.g., visit within person within clinic). We labeled these cross-sectional level 2 ICCs (ρC2); they represent the within-cluster correlation between participants within the same cluster. The third category included ICCs calculated at level three of trials with cross-sectional designs and at level four of trials with repeated measures designs. We labeled these cross-sectional level 3 ICCs (ρC3). Because of important differences in conceptualization and magnitude, we present separate summaries of each type of ICC.
No research reports provided values of R2cov; consequently, these were available only when research teams permitted secondary analysis of their data. We extracted R2cov values for each outcome at all study levels where investigators included covariates; models included all the covariates investigators used within the adjusted models. We did not calculate values of R2cov for longitudinal trials because most power analysis programs do not permit inclusion of covariates for these models (PASS 2024, 2024; Raudenbush et al., 2011). The lower bound for values of R2cov was constrained to 0.
Results
Study Selection and Characteristics
In total, the search yielded 17 trials which met inclusion criteria, reported in 17 publications. Supplemental File 2 shows the flow of trials from initial identification into the pool of included trials. Table 1 presents descriptive information on the 17 trials included in our analyses. There were no stepped-wedge or multi-period cluster randomized trials; all trials employed parallel arms designs. Of the 17 trials, five were individually randomized with repeated measures, eight were cluster randomized, and four were cluster randomized with repeated measures. Among the latter two groups, the mean number of clusters at the highest level of clustering (e.g., level 2 in a two-level cluster randomized design and level 3 in a three-level cluster randomized with repeated measures design) was 29.4 (min = 5, max = 90).
Characteristics of Included Implementation Trials.
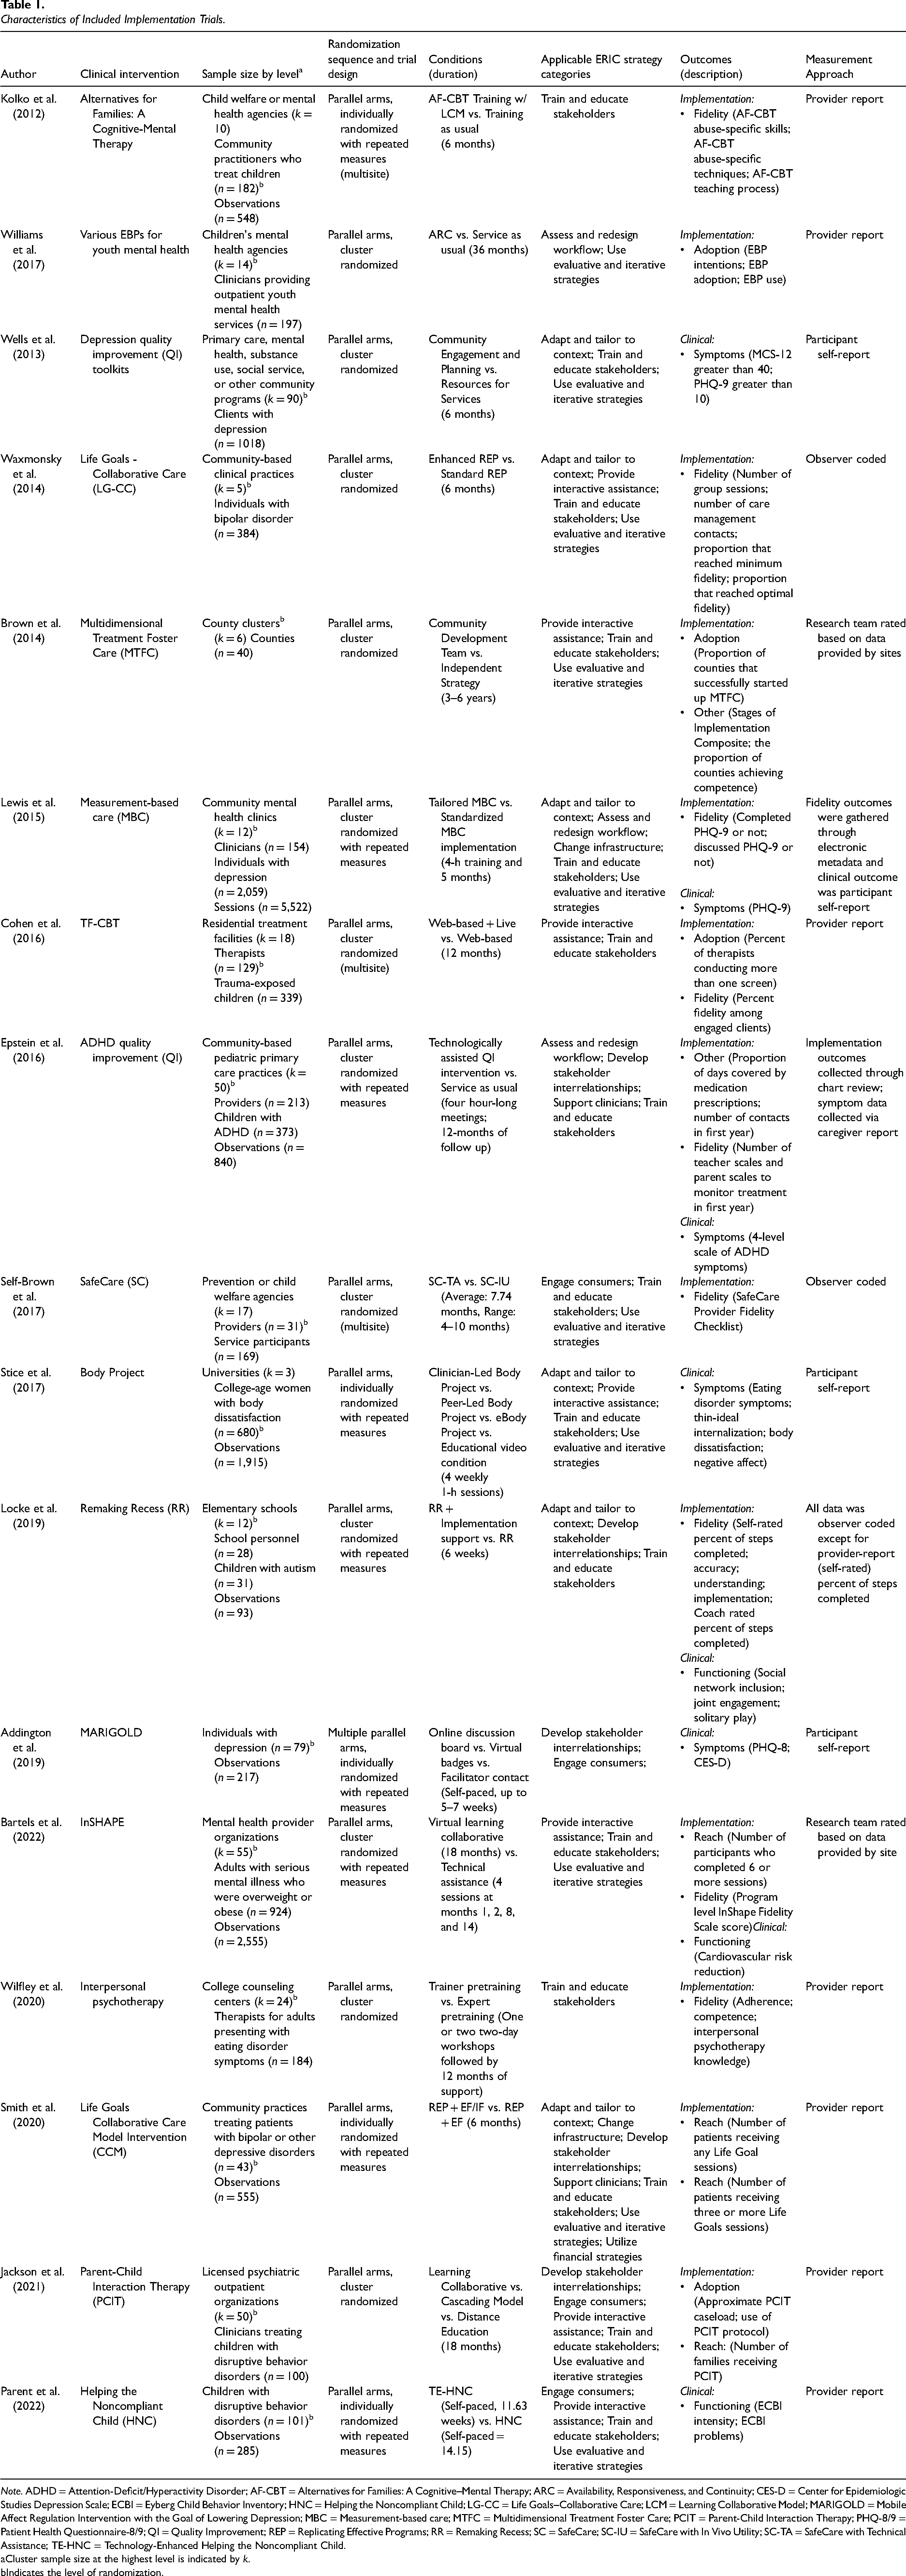
Note. ADHD = Attention-Deficit/Hyperactivity Disorder; AF-CBT = Alternatives for Families: A Cognitive–Mental Therapy; ARC = Availability, Responsiveness, and Continuity; CES-D = Center for Epidemiologic Studies Depression Scale; ECBI = Eyberg Child Behavior Inventory; HNC = Helping the Noncompliant Child; LG-CC = Life Goals–Collaborative Care; LCM = Learning Collaborative Model; MARIGOLD = Mobile Affect Regulation Intervention with the Goal of Lowering Depression; MBC = Measurement-based care; MTFC = Multidimensional Treatment Foster Care; PCIT = Parent-Child Interaction Therapy; PHQ-8/9 = Patient Health Questionnaire-8/9; QI = Quality Improvement; REP = Replicating Effective Programs; RR = Remaking Recess; SC = SafeCare; SC-IU = SafeCare with In Vivo Utility; SC-TA = SafeCare with Technical Assistance; TE-HNC = Technology-Enhanced Helping the Noncompliant Child.
Cluster sample size at the highest level is indicated by k.
Indicates the level of randomization.
From these trials, we extracted 53 outcome variables for which design parameters were calculated. The average number of outcomes per trial was 3.12 (SD = 1.58). For 31 of the outcomes, design parameters were calculated using primary data from the research team; for 22 outcomes, design parameters were extracted from published articles. Implementation outcomes (n = 37) were more common than clinical outcomes (n = 16). Supplemental File 3 provides a list of ERIC strategies used in eligible trials, as classified by the investigative team.
Effect Size
We extracted 83 effect sizes, representing 100% coverage of all 53 outcome variables in the 17 trials. The number of effect sizes is greater than the number of outcomes because trials with more than two conditions contributed multiple effect sizes per outcome. The average number of conditions per trial was 2.23 (SD = 0.56, min = 2, max = 4). Effect sizes for 35 contrasts (for 31 outcomes) were generated via secondary analysis of trial data; the remainder were generated from articles.
Figure 1 shows the distribution of effect sizes for each type of trial. The median effect size for standard vs. enhanced comparisons was d = 0.35 (IQR = 0.07–0.60, n = 47 effect sizes from n = 36 outcomes). The median effect size for comparative effectiveness trials was d = 0.20 (IQR = 0.12–0.35, n = 36 effect sizes from n = 24 outcomes from n = 8 studies).

Distribution of Effect Sizes (Cohen’s d) from Implementation Trials in Mental Health Settings.
Table 2 presents effect size values as a function of outcome type and measurement approach. Results of the linear mixed models failed to provide evidence of statistically significant differences in mean effect sizes by outcome type (standard vs. enhanced: F[5, 28.06] = 0.91, p = .492; comparative effectiveness: F[4, 11.68] = 1.35, p = .308) or measurement approach (standard vs. enhanced: F[2, 24.21] = 1.46, p = .251; comparative effectiveness: F[2, 4.83] = 0.73, p = .527), likely due to the small number of included studies. Sensitivity analyses indicated that inclusion of the covariate-adjusted effect size did not meaningfully alter the results.
Distribution of Effect Size by Study Characteristics.

Note. Effect sizes (d) are reported as M and SD. Standard vs. standard + enhanced designs consist of contrasts between a trial arm that receives one or more implementation strategies and a trial arm that receives all of the strategies in the other arm plus one or more additional strategies (e.g., distribute educational materials vs. distribute educational materials + facilitation). Comparative effectiveness designs contrast trial arms with heterogeneous sets of implementation strategies (e.g., technical assistance vs. facilitation).
Intraclass Correlation Coefficient
We extracted 47 ICC values from 31 (of 53, 58%) outcome variables across 10 (of 17; 59%) trials. Of these 47 ICC values, 18 were longitudinal (ρL), 22 were cross-sectional at level 2 (ρC2), and seven were cross-sectional at level 3 (ρC3). The median longitudinal ICC was 0.50 (IQR = 0.31–0.54, n = 18). The median cross-sectional level-2 ICC was 0.10 (IQR = 0.04–0.22, n = 22). The median cross-sectional level-3 ICC was 0.09 (IQR = 0.06–0.15, n = 7). Figure 2 shows the distribution of ICC values for each category. All ICC values were unadjusted for covariates.

Distribution of Intraclass Correlation Coefficients (ICC) from Implementation Trials in Mental Health settings.
Table 3 presents mean ICC values by outcome and study characteristic. Results of the linear mixed models failed to provide evidence of statistically significant differences of mean ICC values by outcome type (ρC2: F[4, 9.87] = 2.39, p = .122; ρC3: F[2, 2.06] = 4.87, p = .166; ρL: F[3, 2.94] = 4.58, p = .124), measurement approach (ρC2: F[2, 17.01] = 1.76, p = .202; ρC3: F[1, 3.34] = 0.28, p = .628; ρL: F[2, 3.99] = 1.99, p = .252), or population (ρC2: F[1, 8.70] = 0.02, p = .898; ρL: F[2, 8.09] = 2.39, p = .153).
Distribution of Intraclass Correlation Coefficients by Study Characteristics.

Note. M and SD are reported for longitudinal ICCs ρL, and cross-sectional ICCs at level 2 ρC(2), and level 3 ρC(3). All ICCs are unadjusted.
Covariate R2
Only 10 trials, incorporating 27 outcomes, included covariates and there was substantial heterogeneity across trials in the covariates included. Given our goal of understanding how much variance in outcomes was explained by covariates that investigators believed were important, we computed R2cov values for all studies with available data (15 of 27 outcomes (60%) across six trials). The number of R2cov values extracted for each outcome varied depending on the number of levels in the design and the nature of the outcome variable (i.e., R2cov cannot be computed at level 1 for binary outcomes). From the 15 outcomes analyzed, we were able to extract 12 R2cov estimates at level 1
Distribution of R2cov by Level
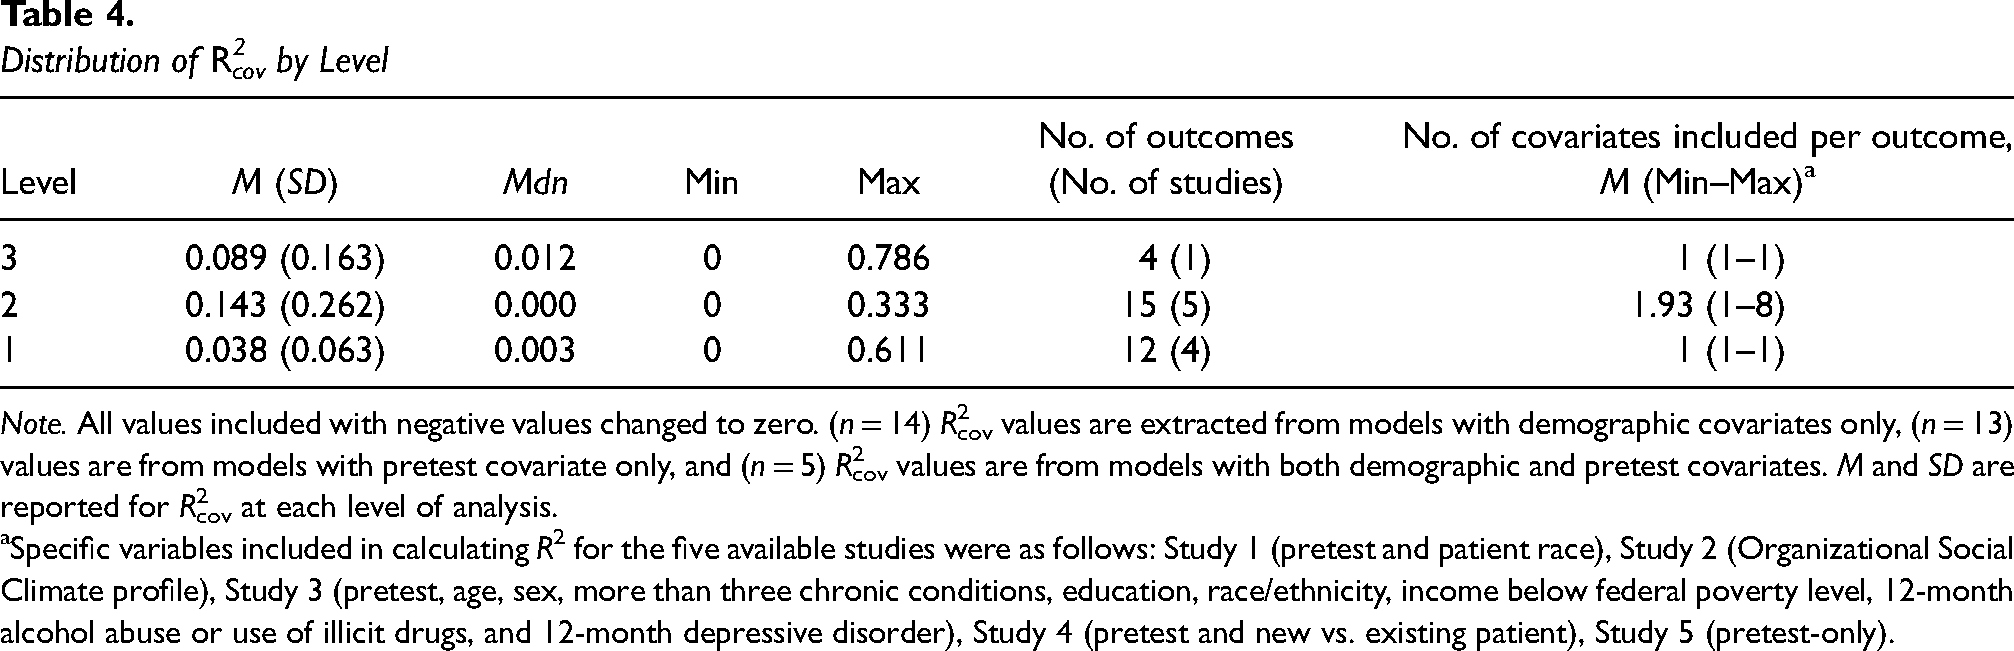
Note. All values included with negative values changed to zero. (n = 14) R2cov values are extracted from models with demographic covariates only, (n = 13) values are from models with pretest covariate only, and (n = 5) R2cov values are from models with both demographic and pretest covariates. M and SD are reported for R2cov at each level of analysis.
Specific variables included in calculating R2 for the five available studies were as follows: Study 1 (pretest and patient race), Study 2 (Organizational Social Climate profile), Study 3 (pretest, age, sex, more than three chronic conditions, education, race/ethnicity, income below federal poverty level, 12-month alcohol abuse or use of illicit drugs, and 12-month depressive disorder), Study 4 (pretest and new vs. existing patient), Study 5 (pretest-only).
Discussion
This study bridges a major methodological gap in the design of implementation trials in mental health by presenting empirical reference values for effect size, ICC, and covariate R2. The reference values presented in this paper represent plausible and meaningful estimates of design parameters to inform sample size determination for multilevel implementation trials in mental health. Given recent increases in NIH funding for implementation research (Neta et al., 2021; Purtle et al., 2015; Tinkle et al., 2013), we hope future research will add to the database of values presented here. In the meantime, these findings offer a crucial resource for investigators to design efficient and effective implementation trials. Below, we offer guidance on how investigators might use these values to inform their own trials.
One of the strengths (and weaknesses) of the nascent field of implementation science is the wide range of outcomes, populations, clinical interventions, implementation settings, implementation strategies, and trial design choices available to, and made by, implementation researchers. While this diversity likely increases the specificity and utility of knowledge generated by the field over the long term, in the short term it challenges efforts to produce evidence summaries. Despite this study's exclusive focus on implementation trials in mental health, examination of Tables 2 and 3 reveals several outcomes and study designs for which few or no trials were available. These sparse data signal that the reference values presented in this study offer a starting point for more robust compendiums in the future.
The distributions of design parameter values observed in this study are within the range of reference values reported in other substantive areas, yet are distinct enough to highlight the importance of field-specific reference values for determining sample size. For example, the mean effect sizes for clinical outcomes observed in these implementation trials were comparable to effects in trials comparing evidence-based psychotherapies to services as usual (e.g., Weisz et al., 2013). It was also not surprising that the mean effect sizes for implementation outcomes were descriptively higher than those for clinical outcomes, given implementation strategies’ focus on changing practice. Studies of ICC for student achievement (e.g., math and reading) and social and mental health outcomes in schools have tended to generate higher ICC reference values than those observed for clinical outcomes in this study (Dong et al., 2016; Hedges & Hedberg, 2013). However, this study's clinical outcome ICCs of 0.08 and 0.05 at levels 2 and 3 are at the higher end of ICC values observed for clinical and quality of life outcomes in primary care settings (Elley et al., 2005; Smeeth & Ng, 2002) and in implementation trials in primary care and hospitals (Campbell et al., 2005). In addition, the median cross-sectional ICC values for implementation outcomes observed in this study (i.e., 0.10 and 0.09 for levels 2 and 3, respectively) are higher than those reported for implementation outcomes in cluster-randomized implementation trials from primary care and hospital settings in the UK (median ICC of 0.06; Campbell et al., 2005), possibly due to greater heterogeneity of disease areas and medical specialities included in the study by Campbell et al. (2005).
Due to the heterogeneity of covariates included in these studies and the sparseness of data, we caution researchers against using the covariate R2 values reported here as inputs for specific power analyses. However, these values do provide a window into the magnitude of variance in outcomes explained by the covariates that implementation researchers have used in their studies to date. Interestingly, the covariate R2 values observed in these studies were considerably smaller than those observed in compendia of educational trials, where covariate R2 routinely meets or exceeds 50% (Dong et al., 2016; Hedges & Hedberg, 2013). This is an important area for future implementation research in mental health because high values of covariate R2 (e.g., from pretests of the outcome), can dramatically reduce the required cluster sample size (e.g., up to 50% or more, Bloom et al., 2007).
None of the studies located by our review used stepped-wedged, multiple-period, or sub-cluster designs, although, these are an important and growing part of implementation research (Davis-Plourde et al., 2023; Hemming et al., 2020; Ouyang et al., 2022). Special considerations are needed when calculating power for these designs (Korevaar et al., 2021) and we refer readers to relevant literature (Davis-Plourde et al., 2023; Hemming et al., 2020; Kasza et al., 2019; Kelcey et al., 2021; Ouyang et al., 2022). Caution may also be warranted when calculating ICCs using studies with few clusters.
Application
The selection of design parameter estimates for determining sample size in multilevel trials depends on the trial design (e.g., longitudinal vs. cross-sectional), variation between clusters, the feasibility of collecting covariate information, and what is considered a clinically meaningful difference in the given trial's context (Raudenbush, 1997). The design parameters presented in this study can be used to aid power analyses for multilevel implementation trials. For example, the effect size estimates presented in Table 2 can help ensure researchers are not overly optimistic; whereas values of ICC provide plausible estimates which may apply to a range of scenarios. In this section, we describe how our results might be applied to determine sample size for two hypothetical implementation trials.
A common design in our sample was a study in which patients were nested within providers within sites. As an example, consider a proposed study where the outcome of interest is a continuous score for intervention fidelity, measured at the patient level, with randomization of sites to implementation strategies and a two-tailed hypothesis that an enhanced implementation condition will have higher mean fidelity at the study endpoint compared to standard implementation. Using Table 2, an investigator may determine that a plausible minimum detectable effect size is d = 0.4. Drawing on Table 3, the investigator may determine that plausible values of ICC at the clinician (ρC2), and site levels (ρC3) are 0.21 and 0.10, respectively. Drawing on substantive knowledge of the implementation area, the investigator may estimate covariate R2 values will be 0.05, 0.36., and 0.12 at levels 1, 2, and 3, respectively. Assuming the trial will enroll an average of four patients per clinician and seven clinicians per site, the investigator would need to enroll 28 sites to adequately power (>0.8) the trial at the 95% confidence level (a = .05), as calculated by the R Shiny App PowerUpR (Ataneka et al., 2023).
Another common design was a repeated-measures study with observations nested within sites and sites randomly assigned to conditions. For example, a study may randomly assign sites to two different implementation strategies and compare the difference in reach across sites, operationalized as the number of patients who received a target dose of an EBI (e.g., 3 + sessions) within the site, measured at baseline and quarterly thereafter for 12 months after the initial training (i.e., total of four measurement occasions). The contrast of interest would be differences in reach at 12 months. From Table 2, the investigator may select d = 0.54 as a reasonable value for the minimum detectable effect size at 12 months. Examining the ICCs for the reach outcome in Table 3, the investigator may select 0.68 as a reasonable estimate of ICC (i.e., ρ, representing the within-unit correlation) size. Assuming the model includes no covariates, and alpha is set at .05, the investigator would need to enroll 64 sites to adequately power (>0.8) the trial (Zhang et al., 2023), as calculated by the software PASS 2022 (which uses formulas from Ahn et al., 2020).
Future Implications
Results of our study highlight important directions for future research. First, the frequent omission of design parameters, such as ICC, from implementation research reports in mental health underscores the importance of changing scientific norms within the field. We consider this an opportune moment to open a conversation about the importance of ensuring that guidelines (Brown et al., 2015) to promote reporting of critical data elements are followed. Second, we believe normative change is needed within the discipline of implementation science with regard to data sharing. Despite our focus on federally-funded trials (for which data should presumably be available) and availability of resources to support researchers who shared data or conducted secondary analyses of their data, we were only able to obtain ICCs for 59% of trials. In some cases, investigators were amenable to sharing data or conducting analyses but were unable to do so due to resource limitations (e.g., the study statistician was no longer funded) or legal or policy restrictions (e.g., Institutional Review Board would not allow sharing of de-identified data). One practical way to address this is to change requirements for data sharing for federally-funded research. As of the writing of this article, it does not appear that the U.S. National Institute of Mental Health Data Archive (NDA; NIMH Data Archive, n.d.) requires trials with nested designs to report ICC for primary or secondary outcomes or to provide site identifiers for all observations (which represents the minimum necessary meta-data to calculate ICCs from within the archive). Modified reporting guidelines could address these limitations.
Limitations
This study represents the first step toward providing implementation researchers in mental health with meaningful reference values of design parameters to accurately determine sample size and calculate statistical power for trials. Given the preliminary stage of research in this area, our study has limitations. First, our focus on NIMH-funded trials, while intended to ensure studies were well-designed and adequately powered, may have resulted in the omission of important trials funded by other sources. For example, although NIMH funds research globally, none of the trials in our sample were conducted outside the United States. Second, the field was nascent during the period we collected data and in future years there will likely be more implementation trials from which larger samples of design parameters can be extracted. Future research can build on the database presented here. Third, the application of implementation science in mental health during this early period of the field's development is highly heterogeneous so we opted to analyze the data descriptively instead of using meta-analytic methods. Even when analyzed within subgroups that can be conceptualized as coming from the same sampling distribution (e.g., comparative effectiveness studies of strategies to improve fidelity), only a subset of trials provided the information necessary to compute the precision of the extracted design parameter estimates and some cell sizes were too small to robustly test the relationships between specific study characteristics and design parameter values. Also, even among studies where design parameters were available, the precision of these estimates might be questionable, especially in trials where there were a small number of clusters. We anticipate future reviews will address these weaknesses through the inclusion of larger samples of larger trials.
Conclusion
This work addresses a ubiquitous methodological barrier that undermines the advancement of implementation science in mental health by providing empirically based reference values for design parameters needed to determine sample sizes in multilevel implementation trials. The paper offers a model for future research that improves the field's ability to design efficient and adequately powered implementation trials.
Supplemental Material
sj-docx-1-irp-10.1177_26334895241279153 - Supplemental material for Calculating power for multilevel implementation trials in mental health: Meaningful effect sizes, intraclass correlation coefficients, and proportions of variance explained by covariates
Supplemental material, sj-docx-1-irp-10.1177_26334895241279153 for Calculating power for multilevel implementation trials in mental health: Meaningful effect sizes, intraclass correlation coefficients, and proportions of variance explained by covariates by Nathaniel J. Williams, Nicholas C. Cardamone, Rinad S. Beidas and Steven C. Marcus in Implementation Research and Practice
Supplemental Material
sj-docx-2-irp-10.1177_26334895241279153 - Supplemental material for Calculating power for multilevel implementation trials in mental health: Meaningful effect sizes, intraclass correlation coefficients, and proportions of variance explained by covariates
Supplemental material, sj-docx-2-irp-10.1177_26334895241279153 for Calculating power for multilevel implementation trials in mental health: Meaningful effect sizes, intraclass correlation coefficients, and proportions of variance explained by covariates by Nathaniel J. Williams, Nicholas C. Cardamone, Rinad S. Beidas and Steven C. Marcus in Implementation Research and Practice
Supplemental Material
sj-xlsx-3-irp-10.1177_26334895241279153 - Supplemental material for Calculating power for multilevel implementation trials in mental health: Meaningful effect sizes, intraclass correlation coefficients, and proportions of variance explained by covariates
Supplemental material, sj-xlsx-3-irp-10.1177_26334895241279153 for Calculating power for multilevel implementation trials in mental health: Meaningful effect sizes, intraclass correlation coefficients, and proportions of variance explained by covariates by Nathaniel J. Williams, Nicholas C. Cardamone, Rinad S. Beidas and Steven C. Marcus in Implementation Research and Practice
Footnotes
Acknowledgments
We wish to thank Dr. Sara Cullen of the University of Pennsylvania School of Social Policy and Practice for her work screening titles and abstracts.
Contributions
NJW served as lead for conceptualization, methodology, writing–original draft, writing–review and editing, investigation, project administration, and funding acquisition. NCC served as lead for formal analysis, data curation, investigation, writing–original draft, and writing–review and editing. RSB served as lead for conceptualization and writing–review and editing. SCM served as lead for conceptualization, methodology, and writing–review and editing.
Declaration of Conflicting Interests
The author(s) declared the following potential conflicts of interest with respect to the research, authorship, and/or publication of this article: NJW, NCC, and SCM have no conflicts of interest to declare. RSB is principal at Implementation Science & Practice, LLC. She is currently an appointed member of the National Advisory Mental Health Council and the NASEM study, “Blueprint for a national prevention infrastructure for behavioral health disorders,” and serves on the scientific advisory board for AIM Youth Mental Health Foundation and the Klingenstein Third Generation Foundation. She has received consulting fees from United Behavioral Health and OptumLabs. She previously served on the scientific and advisory board for Optum Behavioral Health and has received royalties from Oxford University Press. All reported activities are outside of the submitted work.
Funding
The author(s) disclosed receipt of the following financial support for the research, authorship, and/or publication of this article: Research reported in this publication was supported by the U.S. National Institute of Mental Health of the National Institutes of Health under Award Number R21MH126076 (PI: Williams). The content is solely the responsibility of the authors and does not necessarily represent the official views of the National Institutes of Health.
Supplemental material
Supplemental material for this article is available online.
References
Supplementary Material
Please find the following supplemental material available below.
For Open Access articles published under a Creative Commons License, all supplemental material carries the same license as the article it is associated with.
For non-Open Access articles published, all supplemental material carries a non-exclusive license, and permission requests for re-use of supplemental material or any part of supplemental material shall be sent directly to the copyright owner as specified in the copyright notice associated with the article.