
Abstract
Background
Sustained delivery of evidence-based treatments (EBTs) is essential to addressing the public health impacts of youth mental health problems, but is complicated by the limited and fragmented funding available to youth mental health service agencies. Supports are needed that can guide service agencies in accessing sustainable funding for EBTs. We conducted a pilot evaluation of the Fiscal Mapping Process, an Excel-based strategic planning tool that helps service agency leaders identify and coordinate financing strategies for their EBT programs.
Method
Pilot testing of the Fiscal Mapping Process was completed with 10 youth mental health service agencies over a 12-month period, using trauma-focused cognitive-behavioral therapy or parent–child interaction therapy programs. Service agency representatives received initial training and monthly coaching in using the tool. We used case study methods to synthesize all available data (surveys, focus groups, coaching notes, document review) and contrast agency experiences to identify key findings through explanation building.
Results
Key evaluation findings related to the process and outcomes of using the Fiscal Mapping Process, as well as contextual influences. Process evaluation findings helped clarify the primary use case for the tool and identified the importance—and challenges—of engaging external collaborators. Outcome evaluation findings documented the impacts of the Fiscal Mapping Process on agency-reported sustainment capacities (strategic planning, funding stability), which fully explained reported improvements in outcomes (extent and likelihood)—although these impacts were incremental. Findings on contextual factors documented the influence of environmental and organizational capacities on engagement with the tool and concerns about equitable impacts, but also the view that the process could usefully generalize to other EBTs.
Conclusions
Our pilot evaluation of the Fiscal Mapping Process was promising. In future work, we plan to integrate the tool into EBT implementation initiatives and test its impact on long-term sustainment outcomes across various EBTs, while increasing attention to equity considerations.
Plain Language Summary Title
Pilot-Testing a Tool for Planning the Sustainable Financing of Youth Mental Health Treatments that Work
Youth mental health treatments that work must be consistently available to improve youth mental health in our communities, but funding for these treatments is often limited and hard to access. Youth mental health service agencies need tools that can help guide them in accessing sustainable funding for evidence-based treatments. We developed the Fiscal Mapping Process, an Excel-based strategic planning tool for planning sustainable financing of youth mental health treatment programs, and conducted a 1-year pilot-testing evaluation with 10 youth mental health service agencies. We used case study methods to compare and contrast agency experiences with using the tool, related to the process, outcomes, and contextual influences on using the Fiscal Mapping Process. Key findings included clarification of the ideal characteristics of contributors and treatment programs for using the tool; initial confirmation that the tool can improve agency-reported capacities for sustaining treatments that work and long-term sustainment outlooks, although these impacts were incremental; and documentation of the influence of environmental and organizational capacities on engagement with the tool, concerns about equitable impacts, and user views that the process could be applied to a wide range of treatment models. In summary, our pilot evaluation of the Fiscal Mapping Process showed that this tool is promising for supporting the financial sustainment of treatments that work in youth mental health services. In future research, we plan to incorporate the tool into real-world training initiatives with mental health service agencies, test its impact on long-term sustainment across a variety of treatment models, and incorporate attention to equity considerations.
Keywords
Introduction
U.S. mental health systems urgently need to address the societal impacts of youth mental health problems with extensive and sustained delivery of high-quality child and adolescent mental health treatments (Alves-Bradford et al., 2020; Shim, 2021). One in five youth experience mental health problems (Bitsko et al., 2022; Duong et al., 2021; Okwori, 2022), and mental health conditions are now one of the leading health problems among youth (Mei et al., 2020) with economic impacts of $250 billion each year (Doupnik et al., 2020; Torio et al., 2015). Numerous evidence-based treatments (EBTs) have been shown in rigorous research to improve youth mental health outcomes and be ready for widespread implementation (Masters et al., 2017; Weisz & Kazdin, 2017), that is, adoption and integration in usual care settings (Bauer & Kirchner, 2020). To improve youth mental health at a population level, youth mental health service agencies (hereafter, “service agencies”) must implement EBTs far more widely and consistently (Kazak et al., 2010; Williams & Beidas, 2019).
Despite their promise, the increased direct costs (e.g., training, materials) and indirect expenses (i.e., lost productivity or billable hours) of delivering EBTs are often a major barrier to their sustainment in usual care (Bond et al., 2014; Lang & Connell, 2017; Roundfield & Lang, 2017; Scudder et al., 2017). Sustainment refers to the continued use of an EBT after the initial implementation process is complete (Shelton et al., 2018; Urquhart et al., 2020), and is essential to public health benefits (Aarons et al., 2014). Financially, sustainment requires service agency staff to navigate the complex, multilevel, and dynamic influences to secure ongoing resources for treatment delivery (Chambers et al., 2013; Shelton et al., 2018; Stewart et al., 2016; Willging et al., 2015). The present study evaluated a novel strategic planning tool, the Fiscal Mapping Process, that we designed to support service agencies in navigating financial sustainment of EBTs.
Design of the Fiscal Mapping Process
The Fiscal Mapping Process (Dopp et al., 2023a, 2020) is a structured Microsoft Excel workbook that guides service agency representatives through completion of five steps, focused on strategic planning for sustained funding of EBTs. Figure 1 illustrates the five steps of the Fiscal Mapping Process: (1) identify resources needed, (2) specify funding objectives, (3) brainstorm financing strategies, (4) complete the Fiscal Map for EBT by linking financing strategies to objectives, and (5) monitor progress over time. We adapted these steps from an established implementation mapping process (Fernandez et al., 2019), an approach recommended for strategic, tailored selection of implementation strategies (Powell et al., 2017). Resource tabs within the workbook contain instructions and useful information (e.g., completed examples, step-specific resources).

Illustration of the Five Steps of the Fiscal Mapping Process
Details of the development process have been published along with the tool (Dopp et al., 2023b). In brief, we designed the Fiscal Mapping Process in partnership with 48 expert participants, representing 10 U.S. youth mental health service agencies and their partners from intermediary organizations (which provide training and guidance on the delivery of specific EBTs; Franks & Bory, 2015) and funding agencies (diverse public and private sources). We used surveys to achieve consensus on the Fiscal Mapping Process steps and incorporate a compendium of 23 potential financing strategies (Dopp et al., 2020; North et al., 2023), then refined the tool through a series of focus groups and 1 year of pilot testing by service agencies.
The Fiscal Mapping Process is grounded in the Public Health Sustainability Framework (Schell et al., 2013), which details core EBT sustainment capacity domains (i.e., structures and processes supporting sustainment). The two most relevant domains for the tool are funding stability and strategic planning, and it was designed to target increasing those capacities as its primary outcomes. Funding stability capacity is defined as having a consistent base of financial resources for an EBT program. The Fiscal Mapping Process helps service agencies achieve funding stability by securing resources for EBT implementation and sustainment activities through financing strategies (Dopp et al., 2020), such as increased fee-for-service reimbursement, grant funding, and contracts (Stroul, 2007; Stroul et al., 2009). Financing strategies are a subset of implementation strategies, which are any activities or methods that support the use of EBTs in usual care (Powell et al., 2015; Waltz et al., 2015).
Strategic planning is defined as the processes guiding a program's directions, goals, and strategies. It is the central sustainment capacity in Schell et al.'s (2013) framework because it coordinates all other capacities (including funding stability) into a sustainment-oriented plan. For example, a single funding source is rarely sufficient for sustainment of EBTs (North et al., 2023), so the Fiscal Mapping Process guides service agencies through strategically combining and coordinating various financing strategies to achieve funding stability (Jaramillo et al., 2019; Mundey et al., 2021; Willging et al., 2015). Success might require leveraging professional networks to identify viable financing strategies (partnerships capacity) or providing information about their EBT program to potential funders (communications capacity). For these reasons, we developed the Fiscal Mapping Process as a strategic planning tool for financial sustainment, rather than focusing it solely on funding issues (e.g., a budgeting-focused tool).
The Present Evaluation
We next sought to evaluate the preliminary impacts of the Fiscal Mapping Process on EBT sustainment outcomes during pilot testing. Specifically, service agencies piloted using the tool to support sustainment of two well-established youth mental health EBTs: parent–child interaction therapy (PCIT) for disruptive behavior problems in youth ages 2–7 and their caregivers (Kaminski & Claussen, 2017; Thomas et al., 2017), and trauma-focused cognitive-behavioral therapy (TF-CBT) for traumatic stress symptoms in youth ages 3–18 (Dorsey et al., 2017; Pollio et al., 2014). By including widely disseminated EBTs with different clinical foci, age groups, and formats, we sought to maximize generalizability of the Fiscal Mapping tool across a wide variety of financial sustainment challenges within the available resources for pilot testing.
We used comparative case study methods (Bartlett & Vavrus, 2017; Yin, 2018), synthesizing a variety of quantitative and qualitative data sources to understand service agencies’ efforts to sustain EBTs through the tool. Comparative case studies are useful for deriving higher-order understanding of a phenomenon by comparing and contrasting the experiences of multiple cases, permitting in-depth insights even with small samples and nonrandomized evaluations. Other applications of these methods in implementation research have evaluated EBT implementation and sustainment (Folker et al., 2018; Thompson et al., 2022), tools for supporting high-quality EBT delivery (Zeitlin et al., 2016), and system- and policy-level influences on the implementation process (Bullock & Lavis, 2019; Dickson et al., 2022).
This study was a pilot evaluation of the Fiscal Mapping Process that combined diverse sources of input in a comparative case study analysis. Our research questions were: (1) How was the Fiscal Mapping Process used by service agencies? (2) What impacts did the Fiscal Mapping Process have on EBT sustainment capacities and outcomes at service agencies? and (3) What factors influenced service agencies’ abilities to use the Fiscal Mapping Process? The questions cover the evaluation of process, outcomes, and contextual influences, respectively.
Method
We followed the Standards for Reporting Implementation Studies (StaRI; Pinnock et al., 2017) to describe this evaluation, and the Template for Intervention Description and Replication (TIDieR; Hoffman et al., 2014) to describe the Fiscal Mapping Process. Full study details are available in a protocol paper (Dopp et al., 2022); here, we only summarize methods for the comparative case studies.
Study Design
Our comparative case study design (Yin, 2018) synthesized mixed-method data sources (Palinkas et al., 2011). Specifically, we used an embedded, multiple-case design in which each youth mental health service agency represented a case (k = 10) of using the Fiscal Mapping Process for EBT sustainment planning. The mixed-method approach was qualitative and quantitative (qualitative-dominant) and examined convergence between data sources; we emphasized qualitative data more because the quantitative effects from small pilot studies are not reliable indicators of effects (Leon et al., 2011).
Our design was “embedded” (Yin, 2018) because each case included multiple units of analysis (i.e., perspectives from different roles) and “multiple-case” (i.e., comparative), grounded in a replication logic in which conclusions were generated by examining patterns of findings across cases. Expert guidance recommends including approximately 10 cases for subtle between-case comparisons (Yin, 2018), representing multiple perspectives in each case (Bartlett & Vavrus, 2017).
Pilot testing and data collection lasted from August 2021 to November 2022. This timeline coincided with intensive periods of the COVID-19 pandemic, but all research activities were conducted virtually which helped to minimize disruption.
Case and Participant Recruitment
Our study protocol (Dopp et al., 2022) provides an in-depth description of the recruitment process. Briefly, we recruited 10 service agencies across the United States, each represented by participants from three key roles in youth mental health services: service agency, intermediary, and funding agency. We sought a diverse range of service agencies, but to be eligible, the provision of mental health services needed to be one of the organization's primary functions. Using snowball sampling methods, intermediary representatives (expert EBT trainers) nominated service agencies with whom they had worked to implement PCIT or TF-CBT in the prior 5 years. We invited those agencies to apply to the project; as part of the application process, applicants identified service agency representatives (including clinical and/or financial management roles) and funding agency partners. To be eligible, service agencies need to have implemented the EBT of focus (PCIT or TF-CBT) with at least one clinician and enroll at least one affiliated service agency representative and funding agency representative.
Procedure
Participants provided informed consent electronically during project enrollment, and also at the beginning of each data collection activity (either electronically or verbally). All procedures were reviewed by the RAND Institutional Review Board and determined to not constitute human subjects research (Protocol #2020-N0607); nevertheless, we followed all ethical principles for the protection of human research participants to minimize any risk of harm. For example, all communications about data collection activities (e.g., focus group scheduling and facilitation) were conducted by a team member other than the Fiscal Mapping Process coach (described next), to avoid undue influence.
Table 1 provides a summary and timeline of all pilot testing and data collection activities relevant to the comparative case studies and three research questions. Participation in specific activities was optional, so each service agency varied in its engagement and data sources.
Pilot-Testing and Data Collection Activities with Service Agencies for Evaluating the Fiscal Mapping Process
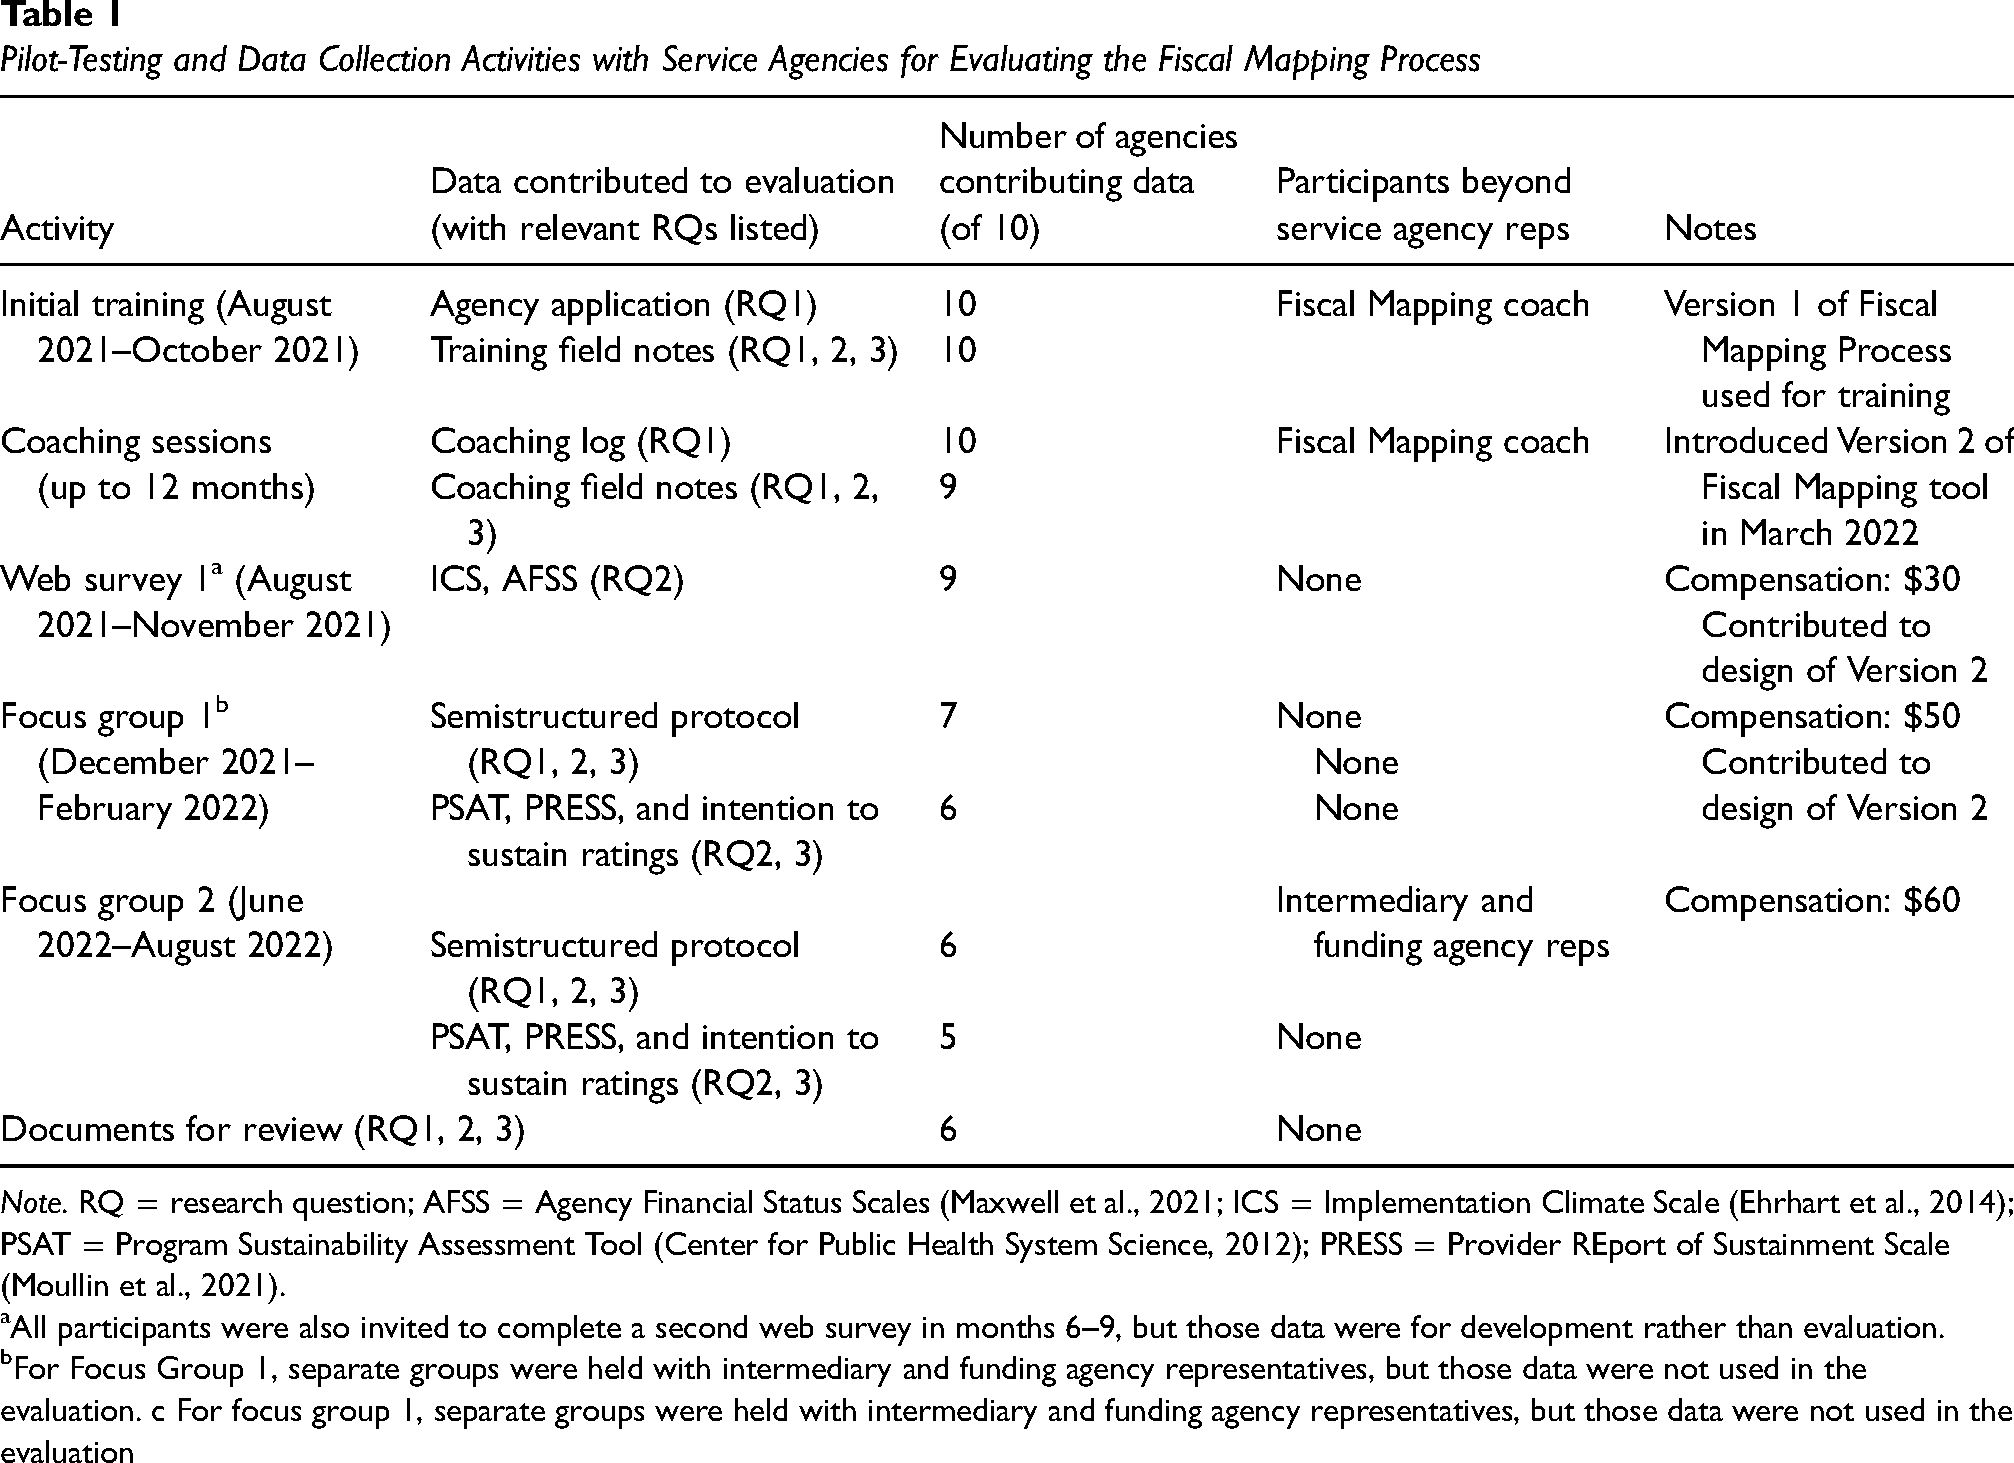
Note. RQ = research question; AFSS = Agency Financial Status Scales (Maxwell et al., 2021; ICS = Implementation Climate Scale (Ehrhart et al., 2014); PSAT = Program Sustainability Assessment Tool (Center for Public Health System Science, 2012); PRESS = Provider REport of Sustainment Scale (Moullin et al., 2021).
All participants were also invited to complete a second web survey in months 6–9, but those data were for development rather than evaluation.
For Focus Group 1, separate groups were held with intermediary and funding agency representatives, but those data were not used in the evaluation. c For focus group 1, separate groups were held with intermediary and funding agency representatives, but those data were not used in the evaluation
Pilot-Testing Activities
The published Fiscal Mapping Process tool (Dopp et al., 2023b) includes a report detailing our development and pilot-testing process, which we summarize briefly here. Before initiating pilot testing, we created an initial prototype of the Fiscal Mapping Process (Version 1) which was subsequently refined throughout pilot testing based on participant feedback and coach experiences. Two Fiscal Mapping coaches (the principal investigator and project manager, both with training in mental health service delivery and EBT implementation) supported five service agencies each. Pilot testing began with an initial training for the service agency representatives, followed by up to 12 months of coaching. Service agency representatives sometimes engaged with funding agency or intermediary representatives between coaching sessions, but only service agency representatives participated in coaching sessions (see Table 1).
Fiscal Mapping Process Tool
We used Version 1 of the Fiscal Mapping Process for the training and initial coaching sessions. After 6 months of pilot testing, we provided an updated Version 2 that incorporated feedback from coaching, Web Survey 1, and Focus Group 1. Major changes included adding details to the tool steps; revising content on the resource tabs; and creating space for documenting action items. After introducing Version 2, we developed a Completion Checklist for self-monitoring completion of the tool and piloted it with service agencies; this checklist was incorporated into the published tool. The final, published Fiscal Mapping Process incorporated additional feedback from participants and quality assurance processes during publication, but these additions were relatively minor (e.g., updates to the color scheme, optional budgeting worksheet) and not relevant for this evaluation because that version of the tool was finalized after pilot testing.
Initial Training
Each service agency separately completed an initial training in the Fiscal Mapping Process upon project enrollment. This training was a 2.5- to 3-hour virtual session, led by the assigned Fiscal Mapping coach while the other coach provided technical support and took detailed field notes. One to three service agency representatives participated per training. The agenda included introductions; a practical, interactive overview of the Fiscal Mapping Process steps (including time for representatives to start completing them); and planning for coaching and data collection activities.
Coaching Sessions
Each service agency was offered monthly virtual coaching sessions up to 12 months posttraining; k = 9 agencies completed two or more sessions. Coaching sessions were brief and focused on providing support for applying the tool to the agency's EBT program (e.g., answering practical questions, troubleshooting barriers, offering support and encouragement). The coaches also gathered feedback on the Fiscal Mapping Process, introduced tool updates to the service agencies over time (e.g., Version 2, Completion Checklist), and encouraged plans for continued use of the tool after pilot testing. The coaches maintained a log of all contacts with assigned service agencies in a shared Microsoft Excel spreadsheet and took detailed field notes during each coaching session.
Data Collection
We collected qualitative and quantitative evaluation data from service agencies through surveys, focus groups, and document review (see Table 1), and also used coaching records (i.e., field notes, coaching log, agency project applications). Service agency representatives were involved in all data collection activities. Funding agency and intermediary representatives participated in the second round of focus groups together with service agency representatives, but otherwise mainly contributed to the development of the tool. Table 1 reports details of timing and compensation for each activity.
Web-Based Survey
We used SelectSurvey, a secure web-based platform, to administer a survey at the start of the project (a second survey was fielded later, but those data were used for development, not evaluation). Survey 1 respondents (n = 16, k = 9 agencies) rated their service agency's EBT implementation climate (Implementation Climate Scale [ICS]; Ehrhart et al., 2014) and financial status for EBT implementation (Agency Financial Status Scales [AFSS]; Maxwell et al., 2021).
Focus Groups
We held two rounds of focus groups with service agency representatives—at the mid-point and end of pilot testing—in which they discussed the impacts of the Fiscal Mapping Process on EBT program sustainment. Focus groups were organized separately for each service agency, and conducted as an interview if the agency only had one representative. In the second focus group, the service agency's funding and intermediary partners were also invited to participate. A note-taker recorded detailed notes and we audio-recorded the discussions for later verification. Following each focus group, service agency representatives completed a web-based questionnaire that included the Program Sustainability Assessment Tool (PSAT; Center for Public Health System Science, 2012; Calhoun et al., 2014), which measures Public Health Sustainability Framework domains (including strategic planning and funding stability, the capacities targeted by the Fiscal Mapping Process); (b) the three-item Provider REport of Sustainment Scale (PRESS; Moullin et al., 2021) to measure extent of EBT sustainment; and (c) a one-item rating of their likelihood of sustaining the EBT over the next year. All measures asked about the EBT of focus for pilot testing (PCIT or TF-CBT). Agency participation rates in Focus Groups 1 and 2 were 70% and 60%, respectively; in both cases, representatives from one agency did not complete the follow-up questionnaire.
Document Review
Throughout pilot testing, we asked service agencies to share any documents relevant to their use of the Fiscal Mapping Process, including copies of completed tools. k = 6 service agencies provided at least one document; completed tools were the most common (five of six), but we also received examples of financing strategies (e.g., grant proposals, service contracts) and EBT program evaluation or community outreach materials. Given the range of documents provided, we used document review as a secondary data source.
Analytic Strategy
Initial Data Processing
Before beginning the case study analysis, we analyzed each data source individually. We calculated overall scores and subscale scores for each quantitative scale (ICS, AFSS, PSAT, PRESS), and summarized scores at the agency level for each timepoint. For focus groups, we conducted preliminary rapid qualitative analyses (Hamilton & Finley, 2019; Taylor et al., 2018) of notes to highlight important themes; many of these themes related to the development of the Fiscal Mapping Process (e.g., suggestions for improvement), so we do not present them here. We still reviewed all notes again for each agency's case study analysis, but the initial rapid analysis helped guide our approach and interpretation.
Comparative Case Study
Our comparative case study analysis (Yin, 2018) involved synthesizing all available quantitative and qualitative data for each case (i.e., service agency) into a descriptive summary, identifying the contributions of specific sources to the conclusions. To structure our approach to case studies, we created a case summary template (see Supplemental File 1 for a blank template) that we completed for each case—that is, service agency—following the instructions in an accompanying development guide (see Supplemental File 2).
Analysis proceeded as follows: (a) the first and third authors (the Fiscal Mapping coaches) compiled and reviewed all data sources, then organized the evidence within Section A of the case study template for each case they coached; (b) the second or fourth author peer-reviewed each Section A, and the coach incorporated their feedback; (c) the second author completed the deidentified case summary narrative (Section B of the template) for each case, summarizing characteristics of the service agency, EBT program, and state context as well as documenting information relevant to the three research questions; (d) the first author reviewed each Section B and the second author incorporated their feedback; and (e) all coauthors reviewed and refined the final case summaries.
Once the individual case summaries were complete, we compared and contrasted experiences across the 10 cases through the replication logic of a multiple case study (Yin, 2018). Financial sustainment is a complex, dynamic process and service agencies had varied experiences with the Fiscal Mapping Process, so we did not encounter literal replication, in which the same result occurs across cases. Instead, we focused on theoretical replication, in which different findings occur across cases for understandable reasons. Given the evaluative purpose of our research questions, our primary analysis technique (Yin, 2018) was “explanation building,” in which explanatory propositions were derived from the data, then evaluated against other data sources (from the same case(s) and across cases) to carefully rule out plausible rival explanations, and refined as needed. We prioritized explanations that best represented all available evidence, lacked plausible rival explanations, and reflected the most significant aspects of the service agencies’ experiences with the Fiscal Mapping Process. We organized the findings by research question and identified illustrative quotes for each explanation presented.
Results
Table 2 summarizes baseline characteristics reported by the 10 service agency cases, including state, agency, and EBT program factors. Supplemental File 3 presents the final case summaries.
Baseline Characteristics Reported by 10 Youth Mental Health Service Agencies that Piloted the Fiscal Mapping Process

Note. CAC = Children's Advocacy Center; CMHC = community mental health center; EBT = evidence-based treatment; PCIT = Parent–Child Interaction Therapy; TF-CBT = Trauma-Focused Cognitive-Behavioral Therapy; BIPOC = Black, Indigenous, and other people of color; NR = not reported.
Average score: 0 = not at all, 1 = slight, 2 = moderate, 3 = great, 4 = very great.
Research Question 1: How the Fiscal Mapping Process Was Used by Service Agencies
Table 3 summarizes the characteristics of pilot-testing participants (e.g., assigned coach, service agency roles represented) and activities (e.g., training, coaching) involved at each service agency. Agencies participated in coaching for an average of 9 months (M = ∼6 sessions, range = 0–10) and coaching sessions averaged ∼22 min each (range = 16–42).
Summary of Fiscal Mapping Process Participants and Activities for the 10 Pilot-Testing Service Agencies

Note. AD and MG = coach initials (first and third authors, respectively). Y = yes, N = no, mixed = intermittent or temporary engagement, N/A = not applicable.
Table 4 reports four findings identified from the process evaluation. First, we found the best “use case” for the Fiscal Mapping Process was with (a) EBT programs that were integrated into the agency's core services and that (b) had financial needs or barriers as a high-priority issue for sustainment. This combination of greater level of commitment and complexity for a program, plus relevance of the tool to sustainment needs, made engagement in the Fiscal Mapping Process worthwhile. Notably, outpatient EBT programs were seen as harder to sustain than programs in residential services, due to the latter receiving more adequate reimbursement from payors.
Comparative Case Study Findings for the Process Evaluation of Piloting the Fiscal Mapping Process (Research Question 1)

Note. EBT = evidence-based treatment.
Second, successful use of the Fiscal Mapping Process required collaboration among team members with clinical manager, financial manager, and senior leadership roles (sometimes with one team member fulfilling multiple roles) to synthesize expertise. Lack of clinical manager input made it unlikely that an agency would engage with the tool or coaching at all (they were the “driving force”) whereas teams without financial manager and/or senior leader input found it challenging to make progress because they lacked key information or decision-making authority.
Third, coaching was valuable for making full use of the Fiscal Mapping Process, but also difficult to prioritize. Agencies with high engagement in coaching reported that their coach helped them create protected time, answered questions, and provided external motivation and support; one agency relied exclusively on coaching and did not use the Excel tool. However, attendance at coaching sessions was inconsistent and participants agreed that prioritizing it among their competing demands was challenging, regardless of their engagement level.
Fourth, the Fiscal Mapping Process can support collaboration with funding partners, but only a few service agencies did this. Many other Fiscal Mapping teams reported that communication with funders had to go through someone not on their team. The agencies that used the tool for this purpose still found it challenging to identify and connect with relevant contacts at funding agencies (who often changed or were unresponsive), and described these interactions as sensitive due to the power dynamic in which the funder held most or all of the decision-making authority.
Research Question 2: Impacts of the Fiscal Mapping Process on EBT Sustainment Capacities and Outcomes
Table 5 reports scores from the follow-up questionnaires administered after each focus group (PSAT, PRESS, likelihood of sustainment) including interim ratings, final ratings, and the change in score between ratings. Table 6 details three findings from the outcome evaluation.
Interim and Final Sustainment Capacity and Outcome Ratings for Service Agencies Pilot Testing the Fiscal Mapping Process

Note. PSAT = Program Sustainability Assessment Tool; PRESS = Provider REport of Sustainment Scale; NR = not reported; N/A = not applicable.
PSAT was scored as follows: 1 = to little or no extent, 7 = to a very great extent.
PRESS was scored as follows: 0 = not at all, 1 = slight extent, 2 = moderate extent, 3 = great extent, 4 = very great extent.
Likelihood of sustainment was scored as follows: −3 = very unlikely, −2 = likely, −1 = somewhat unlikely, 0 = neither likely or unlikely, 1 = somewhat likely, 2 = likely, 3 = very likely.
Comparative Case Study Findings for the Outcome Evaluation of Piloting the Fiscal Mapping Process (Research Question 2)
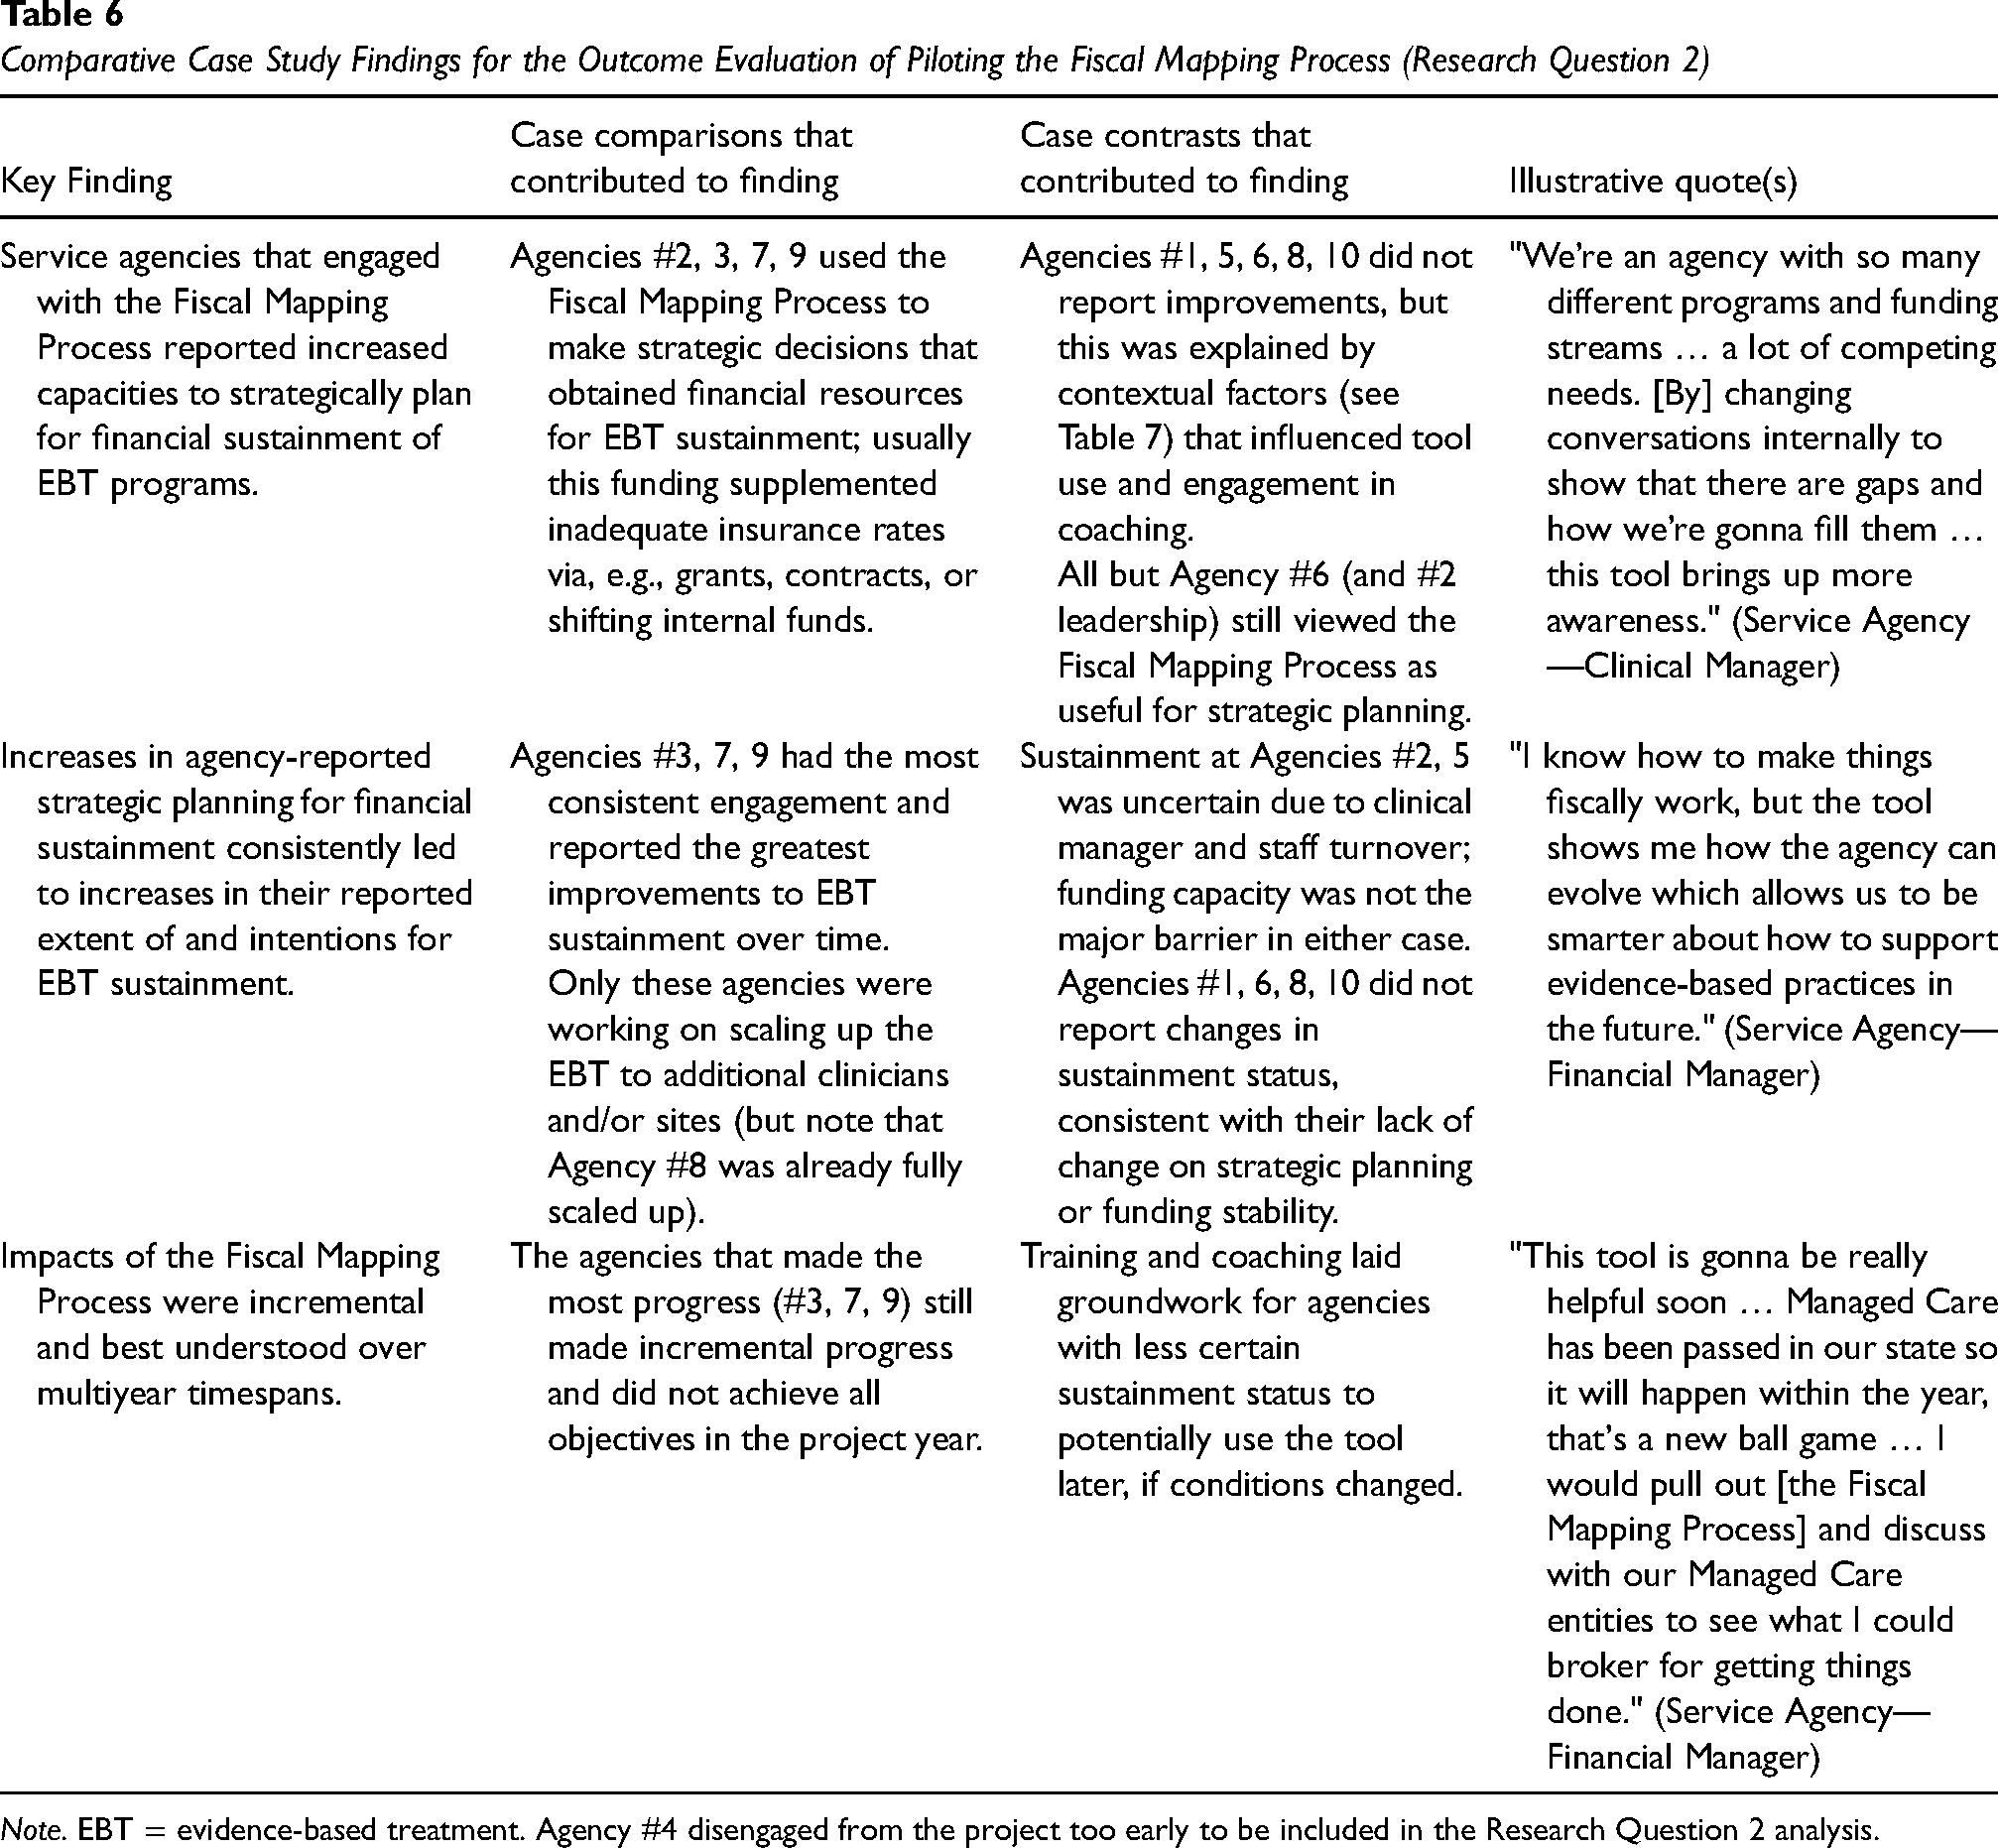
Note. EBT = evidence-based treatment. Agency #4 disengaged from the project too early to be included in the Research Question 2 analysis.
First, we found that service agencies that engaged with the Fiscal Mapping Process also reported increased capacities to (a) use strategic decision-making (i.e., strategic planning) for (b) obtaining financial resources for EBT sustainment (i.e., funding stability). The resulting Fiscal Map usually combines service reimbursement from Medicaid or other government sources with supplemental funds from sources like grants, contracts, or shifting internal funds. (As an illustration, see Supplemental File 4 for two hypothetical completed examples of Fiscal Maps, which are also an embedded resource in the published tool; Dopp et al., 2023a.)
Second, when agencies reported increases in strategic planning for financial sustainment, there was a fully consistent association with increased EBT sustainment extent and/or likelihood; that is, in all cases where capacity ratings changed, so did sustainment ratings, and anytime sustainment did not change, we also did not find changes in the targeted capacities. Many agencies with lower engagement with the Fiscal Mapping Process reported maintaining a preproject level of sustainment, but only the agencies with increased capacities reported increased or expanded sustainment (e.g., all planned to scale up the EBT to additional clinicians and/or sites).
Third, the impacts of the Fiscal Mapping Process were incremental and may be best understood over long timespans. None of the agencies in the sample achieved all their funding objectives during the year-long pilot, suggesting that multiple years of follow-up are likely needed to fully understand the impact of the tool.
Research Question 3: Factors That Influenced Use of Fiscal Mapping
Table 5 also reports interim, final, and change scores for two additional PSAT capacities, environmental support and organizational capacity, that were especially relevant to Research Question 3. Furthermore, PSAT total scores are presented, which summarize all eight sustainment capacity domains captured by that measure.
Table 7 presents the five findings from our analysis of contextual influences. Before describing those findings, it is important to recognize that the COVID-19 pandemic was a major contextual influence shared by all service agencies in this project. Although none of our findings were pandemic-specific, the strain on communities and health systems certainly contributed to the dynamics of these factors and was noted by many participants (see Supplemental File 3).
Comparative Case Study Findings for Contextual Influences on Piloting the Fiscal Mapping Process (Research Question 3)
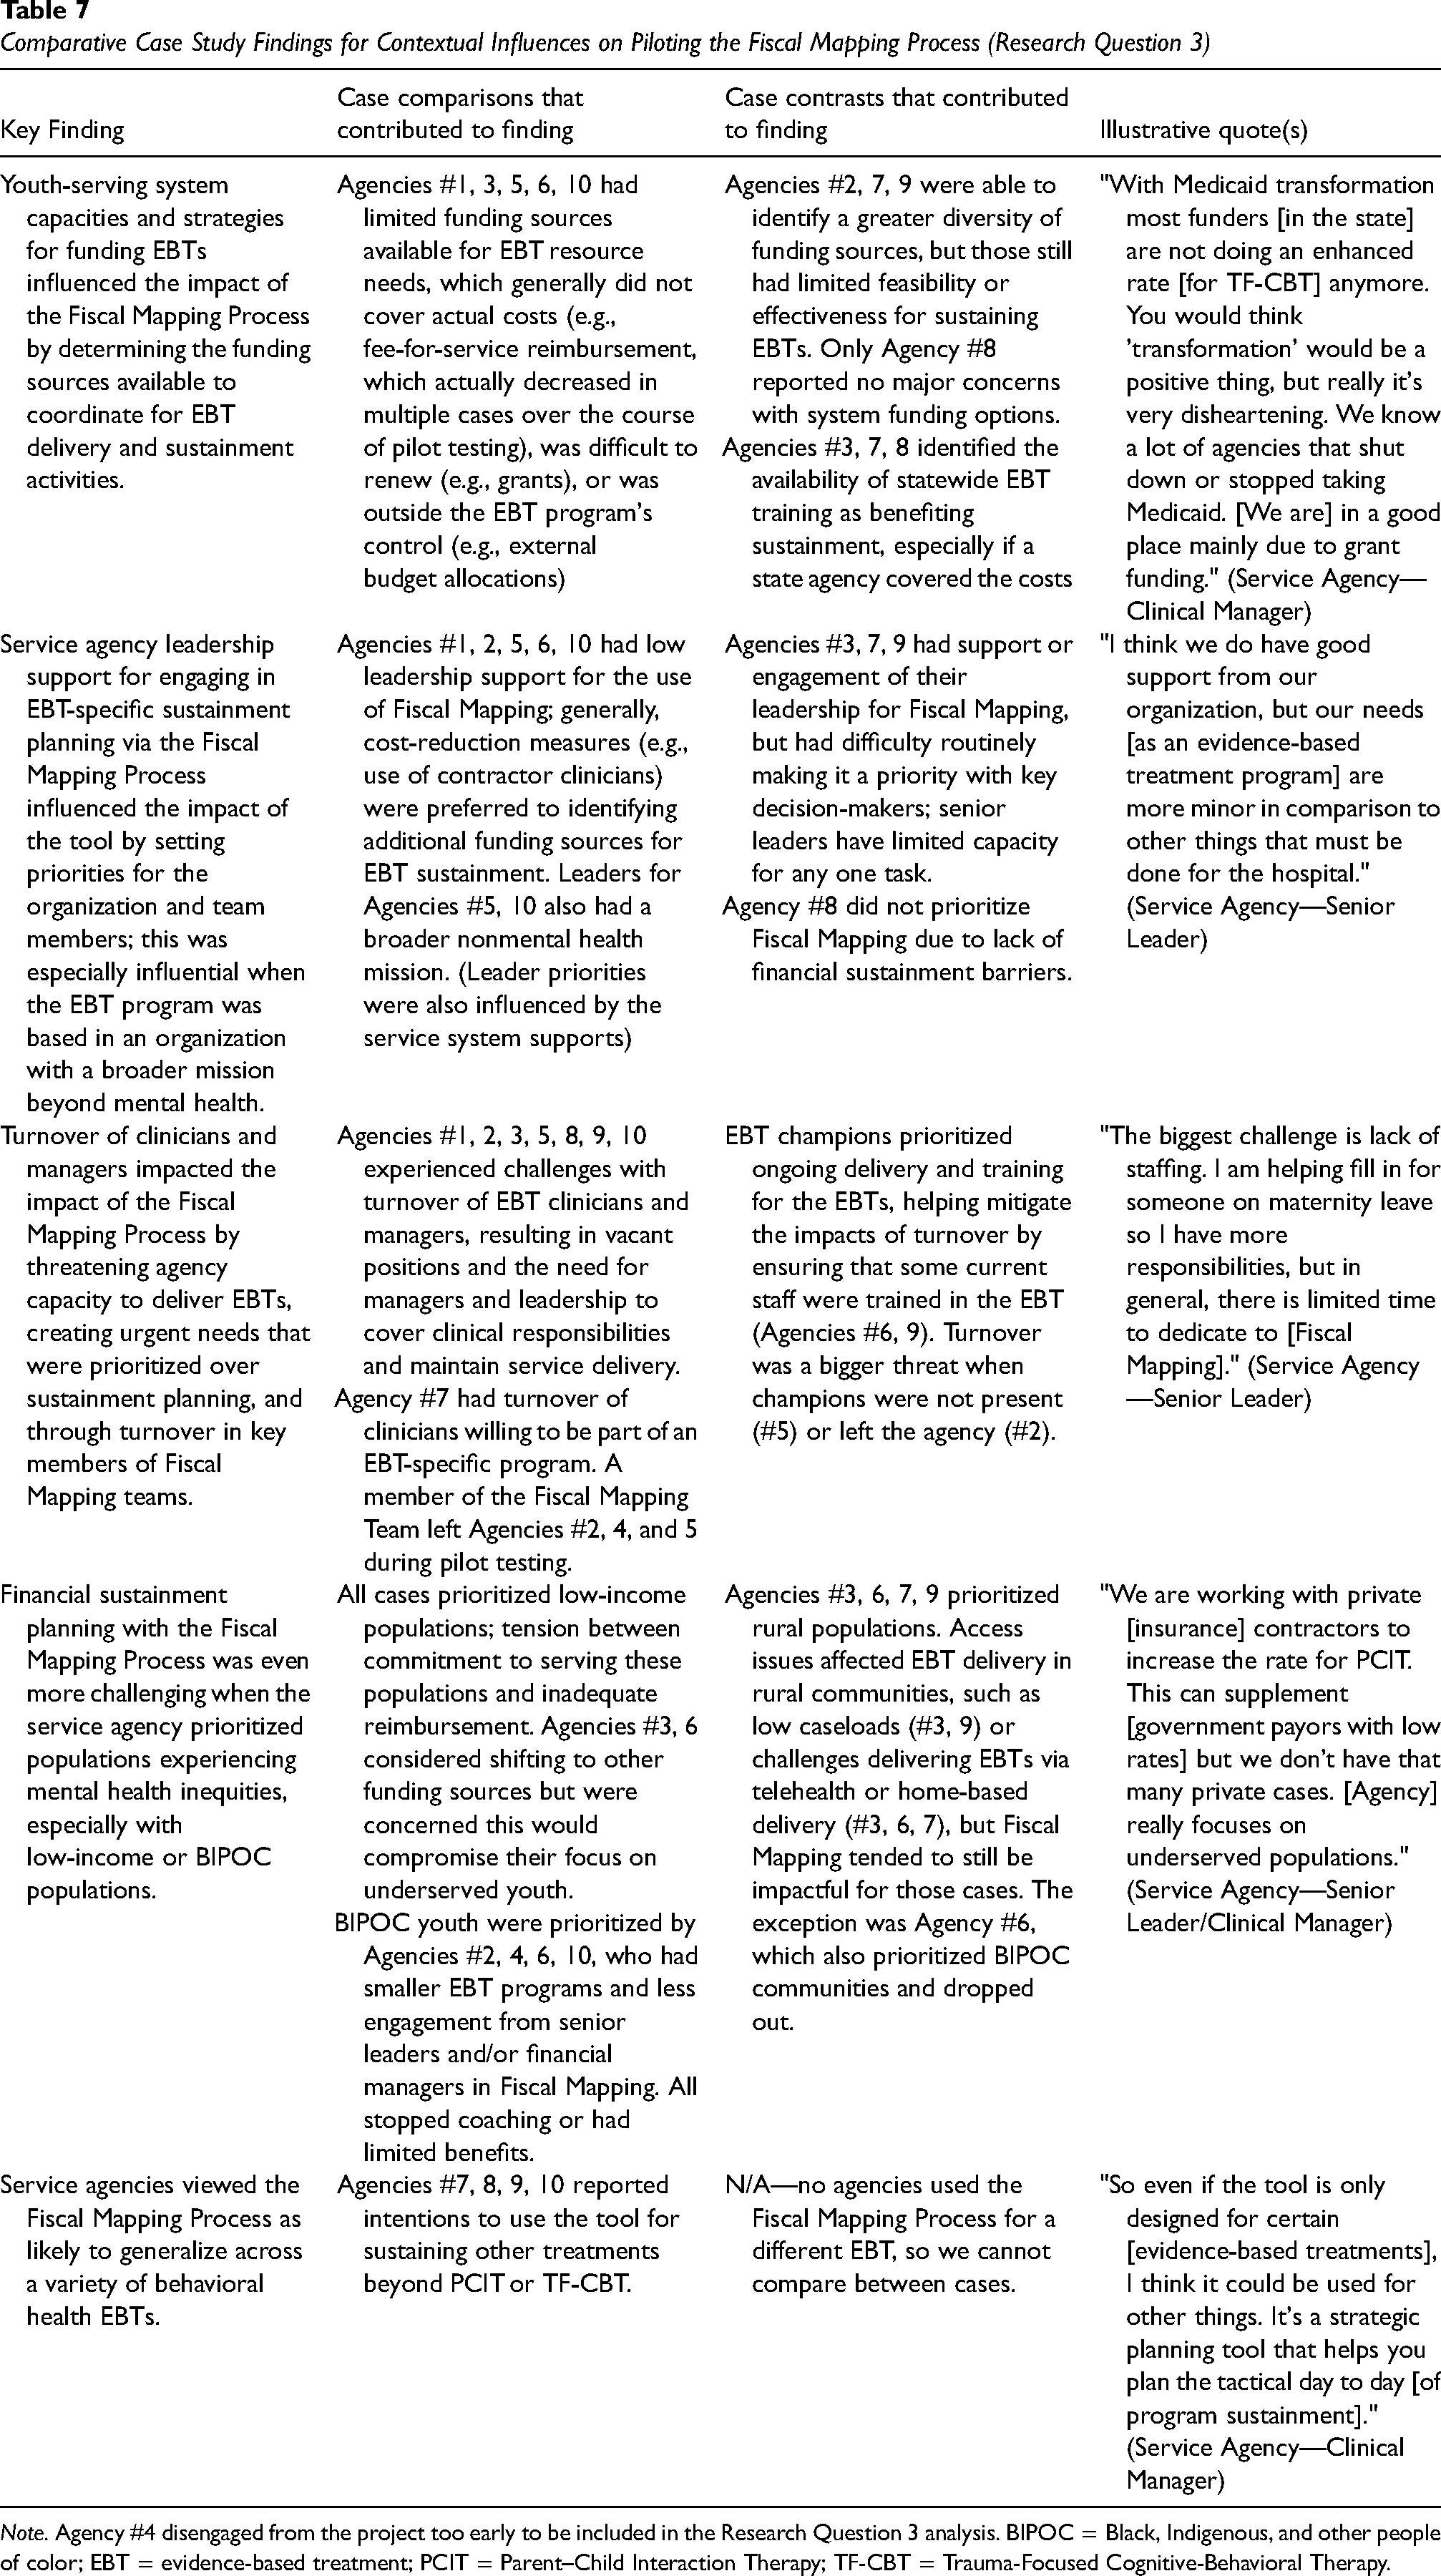
Note. Agency #4 disengaged from the project too early to be included in the Research Question 3 analysis. BIPOC = Black, Indigenous, and other people of color; EBT = evidence-based treatment; PCIT = Parent–Child Interaction Therapy; TF-CBT = Trauma-Focused Cognitive-Behavioral Therapy.
Our first finding was that youth-serving system capacities and strategies for funding EBTs influenced the impact of the Fiscal Mapping Process (extra-organizational environmental support). The available funding determined the options that could be coordinated for EBT delivery and sustainment activities through the tool. Funding sources were often limited in feasibility (for service agencies to obtain) and effectiveness (in providing adequate funding to sustain EBTs), hence the need to coordinate multiple funding sources. Medicaid and other government reimbursement rates were viewed as inadequately low, and several agencies experienced rate decreases during the project, which made Fiscal Mapping feel less useful.
Second, service agency leadership support for engaging in EBT sustainment planning and decision-making influenced the impact of the Fiscal Mapping Process (internal environmental support). Leadership set priorities for the organization and team members, including the relative importance of Fiscal Mapping, and those priorities were influenced by external system supports as well. Consistently prioritizing strategic planning for one EBT was challenging even with supportive leaders, given the numerous administrative demands they experienced; when leaders were not supportive, they generally favored reducing costs instead. Leadership priorities were especially influential in two cases where the EBT program was based in an organization with a broader mission beyond mental health services.
Third, the turnover of clinicians and managers influenced the impact of the Fiscal Mapping Process by focusing attention on the organizational capacity to deliver the EBT. Reasons for turnover varied (e.g., leaving the agency due to low pay, COVID-related issues, vacancy created by promotion, clinician unwillingness to serve in an EBT-specific program) but consistently created a dynamic in which maintaining service delivery had to be prioritized over long-term strategic planning. Nearly every agency experienced turnover-related challenges, including turnover in key members of their Fiscal Mapping teams. However, the presence of individuals who championed (i.e., made a priority) delivery of the EBT mitigated the impact in some cases, as champions worked to ensure that some current staff were always trained in the EBT.
Fourth, Fiscal Mapping was especially challenging when the service agency prioritized populations experiencing mental health inequities. When serving low-income populations, service agencies experienced tension between their commitment to serving these populations and reimbursement sources for low-income populations (e.g., Medicaid) being inadequate to sustain EBTs. Agencies in our sample that prioritized serving Black, Indigenous, and other people of color (BIPOC) faced even more unique challenges and were least likely to benefit. These agencies tended to be smaller (i.e., fewer sites and/or EBT clients) and did not have consistent input from senior leaders and/or financial managers on their Fiscal Mapping teams; one agency also noted that training in culturally adapted EBT was expensive and difficult to access. In contrast, participating agencies that prioritized rural populations, despite still encountering access challenges, were relatively successful with the tool.
Finally, service agency representatives viewed the Fiscal Mapping Process as likely to generalize across a variety of behavioral health EBTs beyond PCIT and TF-CBT. Nearly half of the agencies reported intentions to use the tool for sustaining other treatments, although they typically described it as broadly applicable and did not detail plans for using the tool with specific treatment models.
Discussion
We used comparative case methods to complete a pilot evaluation of the Fiscal Mapping Process, a tool that helps youth mental service agencies coordinate financing strategies for sustaining EBTs. Using mixed-method data sources, we compared and contrasted the process, outcomes, and contextual influences experienced by 10 U.S. service agencies that pilot-tested the Fiscal Mapping Process to plan for the sustainment of TF-CBT or PCIT. Our comparative case study design enabled us to identify complex and nuanced explanations across diverse sources of evidence despite the small sample available for this pilot study, similar to the rich findings of prior comparative case studies from implementation research (Bullock & Lavis, 2019; Dickson et al., 2022; Folker et al., 2018; Thompson et al., 2022; Zeitlin et al., 2016). Moreover, our findings provide in-depth, real-world illustrations of theoretical concepts from public finance and nonprofit services research, showing how organizations pursue their goals—in this case, sustaining EBTs—by navigating complex resource networks to identify and secure diverse funding sources (see e.g., Hillman et al., 2009; Weber & Waeger, 2017).
Our process evaluation findings helped clarify the primary use case for the Fiscal Mapping Process was with service agencies that (a) had or were developing EBT programs; (b) focused on EBT programs with immediate financial sustainment challenges; and (c) engaged clinical manager, financial manager, and senior leader representatives. Other process findings highlighted the importance—and challenges—of service agencies engaging with external collaborations, such as coaches and funding partners, while using the tool. Our outcome evaluation findings documented impacts of Fiscal Mapping Process use on both sustainment capacities (strategic planning and funding stability) and outcomes (extent and likelihood) ratings for engaged service agencies. Furthermore, the relation between capacities and outcomes was fully consistent, providing robust initial evidence that the Fiscal Mapping Process supports EBT sustainment through the capacities it targeted.
Full understanding of implementation mechanisms must account for contextual factors, as demonstrated by the Research Question 3 findings. Multiple dimensions of environmental support (both external and internal) and organizational capacity (especially related to workforce turnover) influenced the impact of the Fiscal Mapping Process, largely explaining cases in which service agencies did not strongly engage with and obtain benefit from the tool. Given these contextual influences, it is important to treat financial sustainment of EBTs as a complex system that the Fiscal Mapping Process can help service agencies navigate, rather than seeking a singular mechanism by which the tool exerts its effects. For example, a recent study using the Public Health Sustainability Framework found that multiple combinations of sustainment capacities were adequate for sustainment, depending on the context (consistent with our case examples, e.g., improving strategic planning was less relevant for the service agency that already had high sustainment capacity in other domains; Cooper et al., 2022).
The youth population served was another important contextual influence, with notably limited benefits of the Fiscal Mapping Process for agencies that primarily serve low-income and especially BIPOC youth—a major concern for equitable outcomes. This builds on equity-focused implementation research, which consistently documents how efforts to implement and sustain EBTs often maintain or increase mental health disparities unless achieving health equity is centered as the primary goal (Baumann & Cabassa, 2020; Park et al., 2018; Shelton et al., 2023). More broadly, U.S. mental health systems are chronically underfunded (Dieleman et al., 2020), with serious workforce issues such as low pay, high education debt, and limited professional development (Conrad, 2023; Goldman et al., 2020) fueling turnover and poor service outcomes—especially in public systems that primarily serve low-income and BIPOC families (Last et al., 2022). We must incorporate an equity focus into implementation tools and strategies like the Fiscal Mapping Process, to make it more responsive and useful for navigating the major system-level issues that inequities in mental health service recipients and providers.
There are important limitations to the generalizability of our findings. We piloted the Fiscal Mapping Process with a small sample of service agencies that had the capacity and interest for a long-term research project. We were also limited to a single year and only able to observe incremental impacts, rather than larger-scale changes in, for example, EBT delivery volume. All pilot-testing service agencies were already sustaining an EBT, which may have limited how much benefit Fiscal Mapping could provide; for example, measures of agency implementation climate (ICS) and financial status (AFSS) were not as useful as we anticipated for our case study analysis, because they showed limited variability (see Table 2). Nevertheless, these limitations are all reasonable considering that pilot studies are meant to understand the feasibility and potential of novel approaches, rather than provide replicable estimates of intervention effects (Leon et al., 2011). Furthermore, we must continue adapting the Fiscal Mapping Process to disseminate it broadly. Many service agencies found coaching to be essential, but our coaching model was research-funded and not scalable. Furthermore, participants viewed the Fiscal Mapping Process as generalizable to other behavioral health treatments and service models, but we were not able to directly examine generalizability beyond PCIT and TF-CBT; it remains unclear how much customization of the step content and resources would be required for other EBTs, especially beyond youth mental health EBTs designed for individual, outpatient delivery (e.g., complex, high-intensity models like Multisystemic Therapy; Henggeler & Schaeffer, 2019).
To address these evaluation and generalizability limitations, we plan to support a more widespread scale-up of the Fiscal Mapping Process by embedding it in Learning Collaboratives and evaluating its effects. Learning Collaboratives are an implementation strategy in which an intermediary brings together multiple service agencies and roles (e.g., clinicians, senior leaders) to learn an EBT and develop plans to sustain it (Ebert et al., 2012). We envision intermediaries coaching service agencies in use of the Fiscal Mapping Process, and brokering conversations with senior leaders and funding agencies to improve funding stability (Lengnick-Hall et al., 2020). Learning Collaboratives could also support the use of Fiscal Mapping across implementation phases (Moullin et al., 2021), such as preimplementation decisions about which EBTs are financially viable. Regarding future evaluation, we plan to examine the effects of the Fiscal Mapping Process (vs. usual Learning Collaboratives without the Fiscal Mapping Process) on a range of implementation and service outcomes (e.g., number of EBT recipients; Proctor et al., 2011) across multiple years and implementation phases. It will also be important to further test strategic planning and funding stability capacities as mechanisms of the tool's effects (Lewis et al., 2018), and whether environmental and organizational capacities can also be targeted.
In sum, we pilot-tested and evaluated a Fiscal Mapping Process for promoting financial sustainment of EBTs in youth mental health service agencies. We found that the tool shows promise for sustainment planning, but needs refinements to be scalable within existing implementation supports (e.g., Learning Collaboratives)—especially system issues that drive mental health inequities. We will continue to pursue development and large-scale evaluation of the Fiscal Mapping Process to help direct resources where they are most needed to support effective practices and promote health.
Supplemental Material
sj-docx-1-irp-10.1177_26334895241249394 - Supplemental material for Pilot evaluation of the Fiscal Mapping Process for sustainable financing of evidence-based youth mental health treatments: A comparative case study analysis
Supplemental material, sj-docx-1-irp-10.1177_26334895241249394 for Pilot evaluation of the Fiscal Mapping Process for sustainable financing of evidence-based youth mental health treatments: A comparative case study analysis by Alex R. Dopp, Maddison N. North, Marylou Gilbert, Jeanne S. Ringel, Jane F. Silovsky, Mellicent Blythe, Dan Edwards, Susan Schmidt and Beverly Funderburk in Implementation Research and Practice
Supplemental Material
sj-docx-2-irp-10.1177_26334895241249394 - Supplemental material for Pilot evaluation of the Fiscal Mapping Process for sustainable financing of evidence-based youth mental health treatments: A comparative case study analysis
Supplemental material, sj-docx-2-irp-10.1177_26334895241249394 for Pilot evaluation of the Fiscal Mapping Process for sustainable financing of evidence-based youth mental health treatments: A comparative case study analysis by Alex R. Dopp, Maddison N. North, Marylou Gilbert, Jeanne S. Ringel, Jane F. Silovsky, Mellicent Blythe, Dan Edwards, Susan Schmidt and Beverly Funderburk in Implementation Research and Practice
Supplemental Material
sj-docx-3-irp-10.1177_26334895241249394 - Supplemental material for Pilot evaluation of the Fiscal Mapping Process for sustainable financing of evidence-based youth mental health treatments: A comparative case study analysis
Supplemental material, sj-docx-3-irp-10.1177_26334895241249394 for Pilot evaluation of the Fiscal Mapping Process for sustainable financing of evidence-based youth mental health treatments: A comparative case study analysis by Alex R. Dopp, Maddison N. North, Marylou Gilbert, Jeanne S. Ringel, Jane F. Silovsky, Mellicent Blythe, Dan Edwards, Susan Schmidt and Beverly Funderburk in Implementation Research and Practice
Supplemental Material
sj-xlsx-4-irp-10.1177_26334895241249394 - Supplemental material for Pilot evaluation of the Fiscal Mapping Process for sustainable financing of evidence-based youth mental health treatments: A comparative case study analysis
Supplemental material, sj-xlsx-4-irp-10.1177_26334895241249394 for Pilot evaluation of the Fiscal Mapping Process for sustainable financing of evidence-based youth mental health treatments: A comparative case study analysis by Alex R. Dopp, Maddison N. North, Marylou Gilbert, Jeanne S. Ringel, Jane F. Silovsky, Mellicent Blythe, Dan Edwards, Susan Schmidt and Beverly Funderburk in Implementation Research and Practice
Footnotes
Acknowledgments
First and foremost, we are grateful to the service agency, funding agency, and intermediary representatives who partnered with us to design and evaluate the Fiscal Mapping Process. Second, we thank Isabelle González and Grace Hindmarch for their assistance with administering focus groups. Third, we appreciate the contributions of expert consultants Dana Hagele, Douglas Luke, David Mandell, and Byron Powell to the design and execution of this project. Fourth, we thank Trista Campos, Olatunda Martin, and Natalie Richards for project administration, including the management of our project newsletter. Finally, we are grateful to Monique Martineau, Kristen Meadows, Emily Cantin, and Haley Okuley for their contributions to the design and development of the Fiscal Mapping Process.
Authors’ Contributions
AD designed and oversaw all aspects of the study, including all data collection and analysis, and wrote the first draft of this article. MN and MG also contributed to data collection and analysis; AD and MG wrote the first draft of each case summary, and MN refined and standardized all case summaries, after which all three authors completed the comparative case study analysis. All other authors contributed to conceptualization of the study, development of the data collection and analysis plans, and interpretation of findings, with an order of authorship determined by the extent of their contributions. All authors reviewed and provided feedback on this article.
Availability of Data and Materials
Quantitative data generated and analyzed during this study are available through the NIMH Data Archive: ![]() . Due to the small sample size and in-depth case descriptives provided, our qualitative data are not available through any data archives, but deidentified data are available from the corresponding author upon reasonable request with adequate protections for confidentiality in place.
. Due to the small sample size and in-depth case descriptives provided, our qualitative data are not available through any data archives, but deidentified data are available from the corresponding author upon reasonable request with adequate protections for confidentiality in place.
Declaration of Conflicting Interests
The authors declared no potential conflicts of interest with respect to the research, authorship, and/or publication of this article.
Ethics Approval and Consent to Participate
All procedures were reviewed by the RAND Institutional Review Board and determined to not constitute human subjects research (Protocol #2020-N0607); nevertheless, we followed all ethical principles for the protection of human research participants to minimize any risk of harm during their participation, including the collection of informed consent at the start of the project and as part of each data collection activity.
Funding
The authors disclosed receipt of the following financial support for the research, authorship, and/or publication of this article: This project was directly supported by an award from the U.S. National Institute of Mental Health (R21MH122889; principal investigator: Alex R. Dopp). The funder did not influence the content of this article; furthermore, the views expressed are those of the authors and do not necessarily represent the views of the National Institute of Mental Health.
Supplemental Material
Supplemental material for this article is available online.
References
Supplementary Material
Please find the following supplemental material available below.
For Open Access articles published under a Creative Commons License, all supplemental material carries the same license as the article it is associated with.
For non-Open Access articles published, all supplemental material carries a non-exclusive license, and permission requests for re-use of supplemental material or any part of supplemental material shall be sent directly to the copyright owner as specified in the copyright notice associated with the article.