
Abstract
The fastener pull-through resistance is a key performance index of composite laminates used for engineering application, and increasing research attention is being paid to developing methods for its calculation or estimation. The currently available research methods mainly focus on the standard test and the finite element analysis for determining the pull-through resistance of composite laminates suffering transverse load by the fasteners. Based on the results of the fastener pull-through resistance experiment performed on X850 composite laminates, a model for estimating the maximum affordable load of composite laminates for the fastener pull-through resistance is proposed, using generalized regression neural network technology. The inputs of this model are simplified to six parameters: the proportion of the ±45° layer of the laminates, the number of the layers, the thickness of the laminates, the bolt head shape, whether the bolt has a washer or not, and the nominal diameter of the bolt; the Gauss function is used as the hidden layer function. The model uses a large portion of the experimental data to train for finding the optimal smoothness factor, which is used to reconstruct the model, and simulation is performed with the remainder of the experimental data. The comparison between the estimated results using the model and the experimental results shows that the generalization ability of the proposed model can meet the estimation requirements. Moreover, the pull-through resistance of composite laminates under transverse load from a fastener can be estimated with high accuracy after some standard fastener pull-through resistance tests of the composite laminates.
Introduction
Composites are structural materials with properties superior to their constituent materials, for instance, the density of carbon fiber-reinforced plastic (CFRP) is usually less than 1/4 that of steel, while its strength is 5–7 times that of steel, which have been extensively applied in many engineering fields and have replaced many traditional materials. It has been proved that the weight of an aircraft can be reduced by 10% and above, if the aircraft structures can be fully built with composite materials, 1 and then, the total cost incurred over the entire service life of the aircraft can also be greatly decreased. As an example, saving 1 kg weight of a narrow-body airplane is equivalent to a 2000 L fuel saving over its life cycle, which means the saving cost is around US$1000, depending on the fuel price. Therefore, the application position and usage of composites have become one of the key indexes to measure the advanced degree of performance of an aircraft. The structural connection types of composite laminates mainly include bonding and mechanical joints. Because of their sensitivity to manufacturing defects and environment conditions, ensuring the good quality of bonding joints of composite laminates has been a long-term issue. Compared with mechanical joints, the bonding joints of composite laminates lack the structural redundancy, too. Therefore, the mechanical joints, especially the bolt joints, are generally chosen instead of the bonding joints in aviation structures for high safety and reliability. The failure modes of composite laminate joints, such as tension, shear, extrusion, and splitting, have been extensively investigated both in engineering and in scientific fields, and significant progress has been made. However, the study on the pull-through failure of bolt joints is relatively insufficient when they are used in composite laminates.
Generally speaking, the out-of-plane tension or compression loads should be avoided according to design criteria and requirements for composite laminates 2 ; however, these issues remain since they have been largely ignored. Typically, when a composite panel has a secondary-bend, it generates out-of-plane stress near the bolt heads. The fastener heads crush onto the laminate surface and are forced through it. Therefore, for joints loaded in shear, the pull-through failure is a design issue, which is a through-thickness mode of failure. According to the description in ASTM D7332 “Standard Test Method for Measuring the Fastener Pull-Through Resistance of a Fiber-Reinforced Polymer Matrix Composite,” 3 the typical process of bolt pull-through behavior of composite laminates generally undergoes four key steps (Figure 1). Before reaching the failure load, the load–displacement curve of the composite laminate specimen suffering pull-through load from a bolt shows discontinuous load decrease (amplitude less than 10%) for the first time, which is the initial critical failure load point (1). Next, the load–displacement curve passes through the failure load point (2) and then shows a significant load drop (amplitude greater than 10%). Since the composite structure does not yet fail entirely, the specimen can continue bear the load to reach the maximum load point (3). Ultimately, the failure of the bolt or the laminate specimen separates the bolt and the specimen, which is impossible to keep any bearing capacity (the bearing load becomes to zero abruptly). That is the rupture point (4).

Typical load–displacement curve of composite laminate specimens due to bolt pull-through load.
As early as 1977, Freedman 4 performed an experimental and simulation study on the liquid hammer effect caused by a missile hitting the wing fuel tank of an aircraft, which created a pull-through trend of the wing panel bolts. Carbon-fiber-reinforced composite laminates (especially for thick shells) were found to be more sensitive to the thickness direction (through-plane direction) load than metallic materials. Liu et al. 5 believed that under the same conditions, the pull-through resistance of hygroscopic composite laminates was significantly lower than that of a dry specimen when bearing out-plane load. Elder et al. 6 established a geometrically simplified and fast calculation model based on cohesive interface elements and the LS-DYNA solver (version 971). Compared with the results of a pull-through resistance test, it was concluded that the efficiency of calculation was greatly improved by the simplified finite element model, but the accuracy was only at an acceptable level (prediction error from 15% to 30%, depending on the stress components). Gunnion et al., 7 Körber 8 and Banbury et al. 9,10 conducted studies for the pull-through resistance tests and finite element simulations of composite laminates suffering out-plane load, and similar conclusions were drawn that the initiation of the pull-through failure is caused by the bolts in composite laminates with oblique shear cracks and local interlaminar delamination in the matrix near the bolt’s head. Finally, a series of hole-centered conical cracks was formed on the back surface of the loaded laminate. Ćwik et al. 11 reported that the volume fraction of CFRPs influences on the maximum pull-through failure load. Catalanotti et al. 12 conducted a pull-through resistance test of composite laminates and then performed a finite element analysis based on the cohesive interface elements and UMAT technology. It was suggested in the investigation that the initial delamination near the bolt hole occurred at the initial critical failure load point. As the increasing of the load, the intralaminar fracture occurred gradually, and the specimen was damaged and finally penetrated by the head of the bolt, showing the pull-through phenomenon of the composite laminate. Kelly and Hallström 13 reported that the initial critical failure load was approximately 20–30% of the failure load. The pull-through failure originated from the shear damage of the matrix in or near the surface layer, which was close to the contact between the laminate and the outer edge of the bolt head. Adam et al. 14 established a finite element model based on the cohesive interface element using discrete layer technology and compared the computational results with those obtained in the pull-through resistance tests of composite laminates. They found that the pull-through failure was initiated by the transverse shear damage of the matrix, and the damage expansion followed a stepwise routine. Eventually, these damages caused delamination failure, and the structure lost its capacity of bearing loads.
In summary, the process of formation, development, accumulation, and completion of the pull-through failure of composite laminate bolt joints is complex and involves multiple damage modes. In the open literature, most of studies have been mainly focused on the formation mechanism of the pull-through failure of composite laminates with the out-plane load caused by bolts, damage evolution under quasi-static loads, and until the ultimate failure. The dominated method is finite element technology comparing with standard pull-through resistance experiments or just experimental study. However, either the standard test method or finite element analysis method is time-consuming or expensive, it is not suitable for the case of rapid and low-cost engineering applications. A machine learning-based method is proposed for this purpose in the current study. In the proposed method, a small amount of experimental data is used to build up a prediction model, which can quickly predict the pull-through resistance of composite bolt joints. From the point of view of discovering the inherent laws of experimental data and subsequent prediction, a generalized regression neural network (GRNN) technology is selected to be trained and validated by the experimental data. Then, the prediction model is used for estimating the pull-through resistance of composite laminates due to out-plane load caused by bolts. The results show that the proposed model has high efficiency, good convergence, and accuracy, and it is significant for designing composite laminate joints in aeronautical engineering applications.
Experiment of pull-through resistance of composite laminates
Experimental scheme
The pull-through resistance experiment of composite laminates specimen was conducted at room temperature in accordance with the method B in ASTM D7332. Five different stacking sequence of laminates were considered in this study, which lead to a total of 25 groups and 201 specimens. A targeted selection was made based on the size and the type of bolts commonly used in civil aircraft engineering application. The typical hole size and shape of bolt head was selected. Two head shapes for bolts were selected for the experiment, that is, cylindrical head and countersunk head, and there are five nominal diameters, 5/32, 6/32, 8/32, 12/32, and 16/32 in. Some of the bolts were assembled with washer. The setup of the pull-through resistance experiment for composite laminates is shown in Figure 2. The experimental fixtures include the clamp pulling head and the fixed base, both of which are made of A3 steel. The fixed base is fastened to the bottom plate of the testing machine through four bolts at four corners. The composite laminate specimens are placed in the “Ω” groove of the fixed base. The bolt hole in the center of a specimen coincides with the thick-through hole at the bottom of the fixed base, and the edges of the specimens are parallel to those of the fixed base. The testing bolt connects the central hole of the specimen and the clamp pulling head which is used to apply the displacement. In the same, the testing bolt and the clamp puling head go through the central thick-through hole of the fixed base with a sufficient clearance. The clamp pulling head and the loading head of the testing machine are connected by a large pin to apply a displacement.

Diagram of composite laminates pull-through experiment.
The shape of the specimens in the current experimental study is regular rectangle, the length is 150 mm, the width is 107.95 mm, and the central hole is placed for the installation of the bolt used for the pull-through testing. The composite material for laminates is Cycom X850-35-12KIM+-190-ATL Prepreg. All the specimens used in this experiment were manufactured by automatic tape laying machine or manual paving. Table 1 presents five stacking configurations of composite laminate experiment specimens.
Stacking sequence of composite laminate specimens.
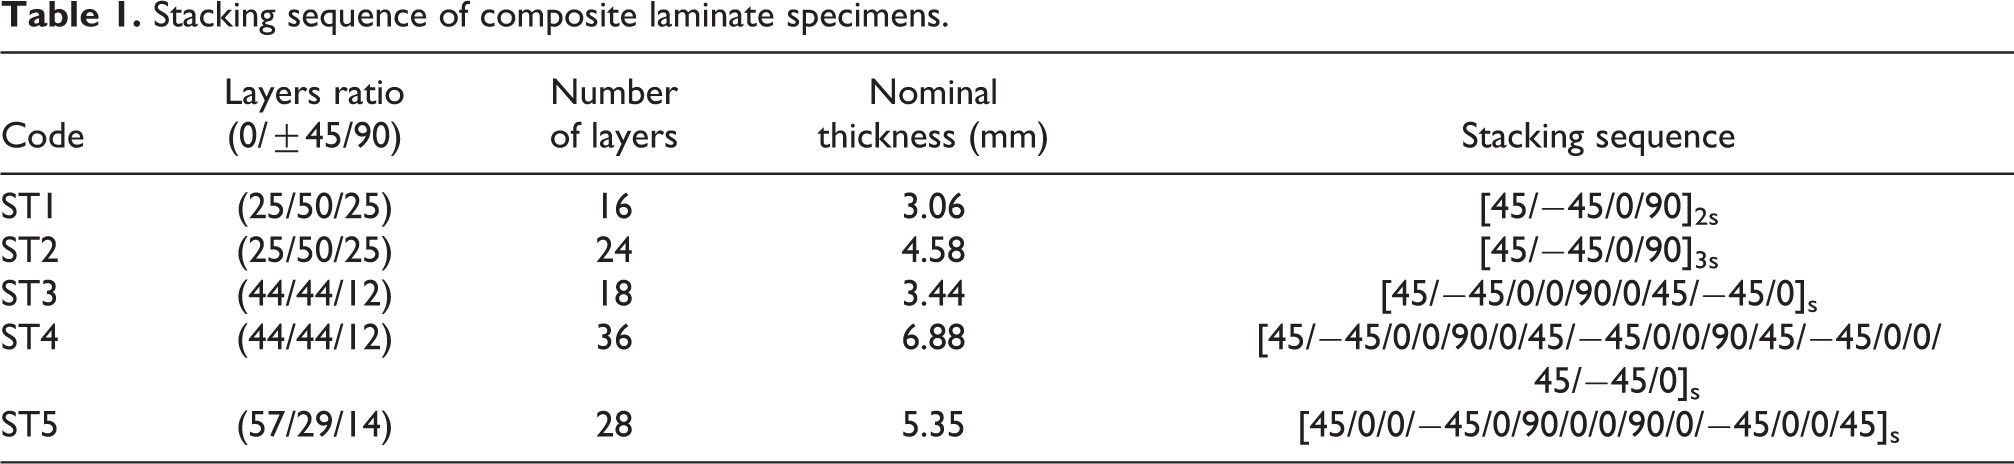
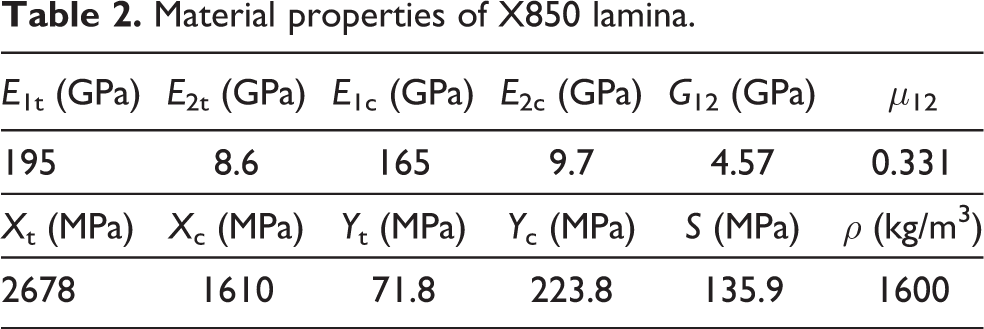
The forming process of autoclave with vacuum bag was adopted to cure the specimens with the pressure of 0.6 MPa and the temperature of 180°C maintained for 180 min. After curing, the nominal thickness of a composite layer is 0.191 mm, and then, the actual thickness of laminates is between 2.96 mm and 6.88 mm. A series of standardized tests, such as tensile strength test, shear strength test, and so on have been carried out on the X850 lamina in advance, and the mechanical properties of the material are listed in Table 2.
Material properties of X850 lamina.
The experiment of pull-through resistance of composite laminates was completed on a ±100 kN tensile testing machine according to the test method B mentioned in ASTM D7332. The main steps are as follows. (a) Set the temperature and humidity of the laboratory and keep it within the required range (temperature within ±3°C, humidity with ±3%). (b) Group the specimens and measure the critical dimensions of the specimens. Measure the width and length of the specimens with a vernier caliper (with an accuracy of 0.02 mm), the thickness (four positions around the center hole of the specimens) with a micrometer (with an accuracy of 0.001 mm), and record all the measured data. (c) Place a specimen under the base of the fixture, use the bolt to pass through the hole of the specimen, the through hole of the base and the through hole of the load head of the fixture, install the nut using a torque wrench and twist it to the required value (within ±10%), and record the value of the torque. (d) Assemble all parts properly, the specimen and fixture are aligned on the testing machine, and the fixed base is connected to the base of the tensile testing machine. The pulling head of the fixture is clamped on the tensile head of the testing machine. The tensile displacement load is applied at the rate of 0.5 mm/min during the testing. After reaching the maximum load point, the load is continued until the maximum load drops by 30%, and the load value and the corresponding failure mode are recorded. (e) Observe the load–displacement curve and the first load drop. The first peak load on the curve before the load drops by 10% is recorded as the critical initial failure load. (f) Calculate the average value of each group of test data as the final result.
Experimental results
In a typical pull-through resistance test, the composite laminates are suffering the out-plane load caused by the bolt. The failed joint structure shows a hole-centered arch and a conical crack failure formed on the back surface, opposite to the loaded surface of the composite laminate, as mentioned in the literature (Figure 3). The bolt penetrates the specimen directly, and the structure of the joint loses its bearing capacity because of the failure. The indentation on the specimen surface can be observed on the bearing surface near the central hole, which is extruded by the outer ring edge of the bolt head under the transverse load from the bolt. However, a large area of delamination damage occurs and is accompanied by matrix fragmentation around the central hole of the specimen, which implies that the main failure mode of pull-through is delamination. According to the experimental phenomena and data (Table 3), the failure mode for all 25 groups of specimens in the current pull-through resistance experiment is delamination failure. The maximum load borne by X850 laminates ranges from 6.96 kN to 38.29 kN. For the same material system of composite laminates, it has been proved that the key factors that affect the pull-through resistance are the contact projection area between the bolt head and the specimen, the thickness of the specimen, and the proportion of layers in different directions. All the various parameters related to key factors mentioned above can be divided into two types: specimen status and bolt status. These parameters are governing the bolt pull-through resistance of the composite laminates, which are given in Table 3. And some variables (such as type of bolt head and so on will be defined in following sentence) mentioned in the table are simplified for quantitative characterization. In the specimen section, N ±45° is the proportion of the number of ±45° layers in the composite laminates, N layer is the number of composite laminates, and t is the average thickness of the laminates (in mm). In the bolt section, S refers to the shape of the bolt head (flat head and countersunk head are expressed as S = 0 and 1, respectively), W refers to whether the bolt with a washer or not (expressed as W = 1 and 0, respectively), and D is the nominal diameter of the bolt (in mm). Max load (in kN) is the maximum load of the composite laminates under the transverse bolt load.

Specimen after pull-through test. 11
Experimental results of the pull-through resistance test of composite laminates under the bolt transverse load.

Prediction model of pull-through resistance
Generalized regression neural network
Artificial neural network (ANN) provides a very popular approach to solve complex problems, 15 which is originated from the research of information processing based on the observation of neuronal behavior patterns. Error back-propagation neural network (BPNN) solves the problem with supervised leaning, but it may easily be impeded by the problems with local extreme values. Furtherly, the applications of BPNN may be hindered by the determination of the numbers of hidden layer and neuron nodes, which depend on the user’s experience and skill. Moreover, the radial basis function (RBF) neural network may suffer from the overlearning phenomenon in some cases. As an alternative, the GRNN has the characteristics of fast convergence speeds and a good function approximation ability. While it comprises of a simple structure which is a modification of the RBF. Therefore, GRNN is widely used in various engineering and science fields where involve prediction and estimation.
Topological structure of prediction model
The pull-through resistance of the composite laminate under the out-plane load caused by the bolt is the result of a combination of numerous factors. Considering the limitation of experiment information, this study chooses the status of the specimen (the proportion of a certain angle layer, the number of layers, and the thickness of the composite laminates) and the status of the bolt (the head shape, with a washer or not and the nominal diameter of the bolt) as the input variables of the prediction model, and the maximum load of the pull-through failure is taken as the output variable. Spent’s study shows that the GRNN with a four-layer structure can achieve infinite approximation for nonlinear problems 16 ; hence, it is suitable for solving practical problems with nonlinear relations. In this study, the prediction model for the pull-through resistance estimation is based on the GRNN framework. Based on the aforementioned analysis of influencing factors and the determination of inputs and output, it is easy to determine the neural network topology of the prediction model. Notably, the number of neurons in the input layer of the model is 6, the number of neurons in the output layer is 1, the number of neurons in the hidden layer is equal to the number of training samples, and the number of neuron nodes in the summation layer is 2. The topological structure is shown in Figure 4.
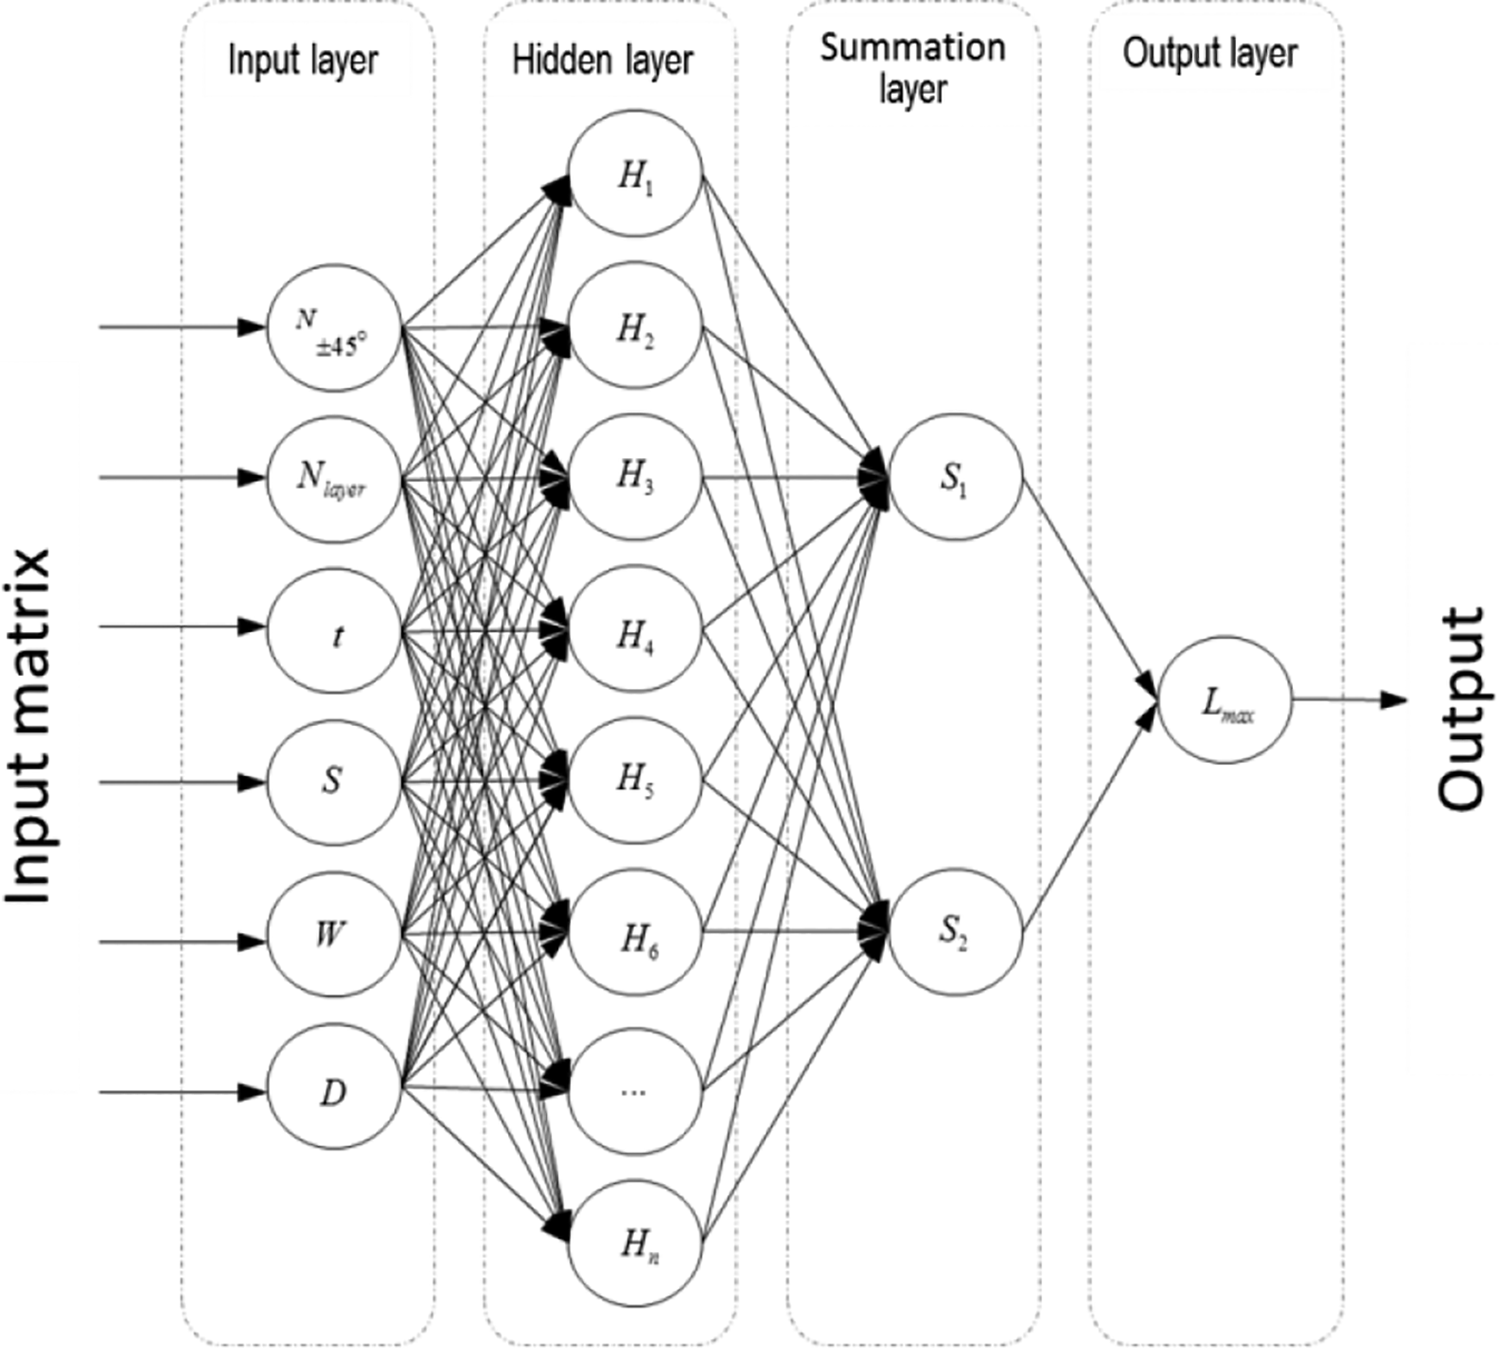
Topological structure of the estimate model.
Algorithm of the estimate model
The theoretical basis of the GRNN is obtained from the nonlinear kernel regression analysis. For two random variables X and Y, the joint probability density can be expressed as f(x, y). In the current study, the dependent variable Y is the maximum load (output), and the independent variable X is one parameter (input) for the pull-through testing. If the observed value X of the independent variable x is known, the conditional mean of y given x is as follows

The conditional mean value must be estimated from a sample of y and x when f(x, y) is unknown. By performing nonparametric estimates (such as Parzen method) on the samples, the joint probability density function f(X, Y) of independent and dependent variable is deduced to be

where p is the number of dimension of the input variable, n is the number of capacity of the observation sample,

It can be seen from equation (3) that the particular estimator
Distinct from the BPNN, the training process of the GRNN does not need any iteration, and therefore, the determination of algorithm parameter is much simpler than other ANN techniques. The training process is essentially the process of determining the smooth factor
The mean square deviation (MSD) between the predicted values of the GRNN model and the experimental values is selected as the objective function for the searching of the best smoothness factor σ best. The GRNN model is constructed with σ under different values. The majority of the experiment data is used to train the GRNN model, while a small portion of the experimental data is employed to validate the trained GRNN model. The predicted results from the trained GRNN model are compared with the experimental data, and the MSD is calculated. The corresponding σ with the minimum MSD is considered to be the best σ best. Finally, the GRNN model is reconstructed with σ best, and then, it is used to estimate the maximum failure load. The MSD formula is given as follows

The polling traversal cross-check method has the following steps. Firstly, determining a search interval, the starting search point
Model validation
Data preparation
The values of the input and output parameters of the GRNN-based pull-through resistance estimation model have a big range of magnitude. The ratio of certain layer numbers in the composite laminates, the number of laminates, the thickness of laminates, the shape of the bolt heads, the bolt with a washer or not, the nominal diameter of the bolt, and the maximum failure load are in a different magnitude order. They are 10−1, 101, 100, 100, 100, 100, and 101, respectively. To avoid the influence of magnitude order on the accuracy of the prediction model, all the experimental samples are normalized and converted into the interval of [−1, 1]. The predicted outputs from the trained GRNN model are processed inversely, and the purpose of inverse procedure is to convert the predicted output values back to their original range. Data normalization formulas are expressed in equations (5) and (6), and the inverse procedure are formulated in equations (7) and (8)
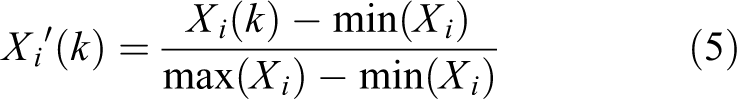


According to the description in “Experimental results” section, the input dimension of the prediction model is 6 (i = 1,…,6), corresponding to columns 2 to 7 in Table 3, for estimating pull-through resistance of the composite laminates under the bolt’s transverse load. The output dimension of the prediction model is one (j = 1), corresponding to column 7 in Table 3. The experimental sample group is k = 1, 2, 3,…,25. In practical applications, the built-in functions of premnmx, postmnmx, and tramnmx in MATLAB are generally used for normalization. Therefore, the conversion process and results are not described here in detail.
Parameter optimization
The GRNN-based model for estimating pull-through resistance of composite laminates under the bolt’s transverse load involves a few parameters that need adjustment. However, by selecting the MSD as the objective function, the prediction model is trained by adjusting the smoothing factor σ to be the best. It is clear the searching is in a one-dimensional space. The search interval e of the smoothing factor is set to
Estimated results of the model
After the prediction model was reconstructed with the optimal parameter σ best, the rest five groups of samples are taken as inputs, and the prediction model was used to predict. The estimated maximum failure load is restored from the original value by the inverse transformation formula. The comparison between the estimated results and the experimental data is given in Table 4. It can be observed from Table 4 that the estimated values of maximum failure load are very close to the experimental values in the pull-through resistance experiment. The former values are obtained using the five groups of validation data by the prediction model. The range of absolute error is from −1.40 kN to 1.15kN, the percentage error is within [−0.49%, 9.44%], and the maximum percentage error is less than 10%. The above discussion shows that the generalization ability of the prediction model can meet the engineering requirements and its estimation accuracy is high.
Comparisons between the estimated results from GRNN model and experimental data.

GRNN: generalized regression neural network.
An analysis was carried out for two groups of data with high percentage error. It seems to be related to the sufficiency of learning on the input dimensions of neural network, and the proportion of training repeat data in a specific dimension of the two groups of data is not balanced with the other groups. For example, for the group of data with a percentage error of 9.44%, in the dimension of the number of layers of the specimens, data groups with the value equal to 16 layers in the whole training group is 2, the proportion in this dimension is only for 10%, far less than the proportion of other numbers. Similarly, for the data group with a percentage error of 7.38%, the nominal diameter of the bolt of 4.76 in the training groups is also not enough in the proportion. Therefore, the prediction accuracy of these two groups of data is slightly worse than those of the other group.
Conclusion
The capability of composite laminates to withstand out-of-plane loads has gradually become a bottleneck, which has restricted their engineering applications. Assessment of the pull-through resistance of composite laminates under transverse loads caused by bolts is an important step in the mechanical joint design of composite laminates. To solve the issues of the standard test methods and finite element method, a machine learning method is proposed for the prediction of the put-through resistance of composite joints in this article. The GRNN is used to build up the prediction model with a small sample of experimental results and estimate the pull-through resistance of composite laminates with bolt connections. The input parameters for the proposed prediction model are the status of specimens (the specific proportion of laminates, the number of laminates, the thickness of laminates) and the status of the bolt (the shape of bolt heads, whether the bolts are equipped with a washer or not, the diameter of bolt). After training the prediction model by randomly selecting a group of experimental data, the optimized parameters are used to reconstruct the model. While the rest experimental data are employed to validate the accuracy of the predication model. By comparing and analyzing the predicted results with the experimental data, it can be concluded on the whole that the predication model has good convergence, high calculation efficiency and produces accurate predictions. The analysis shows that the accuracy of the prediction model may be related to the training adequacy of each input dimensions. It has a decent ability to discover the rule of the test data and predict the pull-through resistance of composite laminates. Moreover, it provides an effective and a fast method for estimating the pull-through resistance of bolt connections. In this study, the influence of the selection of ANN on the prediction results is not enough explored. It is hoped that further research can be carried out in this area, and the prediction effect of several kinds of common neural network models can be compared.
Footnotes
Declaration of conflicting interests
The author(s) declared no potential conflicts of interest with respect to the research, authorship, and/or publication of this article.
Funding
The author(s) received no financial support for the research, authorship, and/or publication of this article.