
Abstract
The purpose of this research is to optimize the fresh and strength properties of concrete with various incorporation ratios of polyvinyl alcohol (PVA) fibre and nano-Fe2O3 by design of experiment approach. Central composite design of response surface methodology was used to acquire the optimal composition of process variables, and the influence of process variable on the fresh and strength properties of concrete was also verified. A total of five responses (Y Slump, f ck,7, f ck,28, f t,7 and f t,28) were considered in this study, and the factors and the level of each response was 2 and 3, respectively. Regression models for Y Slump, f ck,7, f ck,28, f t,7 and f t,28 were tested; the statistical significance of each process variable was assessed through analysis of variance and Pareto chart, and the obtained models were expressed in the form of second-order polynomial equation. The test results revealed that incorporation of PVA and high-reactive nano-Fe2O3 improved the strength of the concrete; however, the higher level incorporation exhibited unpronounced effect on the strength enhancement. The incorporation of nano-Fe2O3 enhanced the compressive strength to the maximum of 7.44%. The high-reactive nano-Fe2O3 accelerated the hydration process of concrete and enhanced the particle packing density of the concrete by filling the micropores. However, the higher incorporation of nano-Fe2O3 leached out the surplus silica from the concrete and reduced the strength enhancement of the cement composite matrix. The regression analysis results revealed that the most significant and contribution factor for f ck,7 and f ck,28 is the linear term nano-Fe2O3 (X 2), 99.81% contribution, and for f t,7 and f t,28 is the linear term PVA (X 1), 75.75% contribution. Pareto chart and surface plot analysis also revealed the same as above. The optimal proportion of design variables against f ck,7, f ck,28, f t,7 and f t,28 were obtained and the percentage of error of the confirmation tests for Y Slump, f ck,7, f ck,28, f t,7 and f t,28 were less than 3%.
Introduction
In the present era, concrete is the widely used construction material in the construction industry due to its high durability to cost ratio. 1,2 However, the reduced tensile properties of the concrete confine its applications, where the flexural and tensile properties of the concrete are predominant. Since the occurrence of numerous disasters around the world, in recent years, the researchers are showing more interest to enhance the tensile and energy absorption capacity of the concrete structures to resist seismic, fatigue, impact and blast loadings. 3 Even though the strength of the concrete is higher, the tensile and energy absorption capacity of the concrete are very poor under above such loadings. It has been well documented that the inclusion of different types of fibres including steel and synthetic fibres significantly enhanced the tensile, toughness, impact resistance and energy abortion capacity of the concrete. As the fibre-reinforced concrete (FRC) exhibits numerous benefits, it has been widespread in various high-end structural applications including floors, walls, precast elements and offshore structures. 4 – 6 Even though the inclusion of fibre reduced the crack development and improved the tensile strength capacity of the concrete, the inclusion of fibre has no significant improvement on the compressive strength capacity of the concrete. Yongchun Cheng et al., 7 Bencardino et al. 8 and Feifei Jiang et al. 9 reported that the dosage of steel and synthetic fibre in concrete marginally influenced the tensile strength of the concrete and improved the interfacial bond strength of concrete. Therefore, it is very imperative to increase the compressive strength of the concrete, where the compressive tensile properties of the concrete are predominant for its application. 10
It has been documented that the introduction of nanomaterials either may be in the spherical materials form (includes nano-SiO2, nano-Al2O3, nano-TiO2, nano-Fe2O3, nano-ZnO etc.) or may be in the tube materials in the concrete densify the concrete by filling concrete pores, enhance the hydration process and significantly enhance the compressive strength of concrete. 11 – 13 In recent years, more research studies have been carried out on the inclusion of nanoparticles in concrete production. Hakamy et al. 14 documented that the inclusion of nano-clay in the cement composites enhanced the pozzolanic reaction and microstructure as well. Sara Allalou et al. 15 and Zhen He et al. 16 found that the higher pozzolanic activity and nucleation of calcium silicate hydrate (C–S–H) formed by the calcined halloysite nano-clay and nano-SiO2 in the mortar improved the concrete strength, which in turn improved the abrasion resistance of the concrete. Jingyi Liu et al. 17 reported that the toughness, dynamic modulus, flexural elastic modulus and strength properties of the mortar incorporated with brucite nano-fibre were very higher. The test results of Rahmat Madandoust et al. 18 revealed that the hybrid combination of nano-SiO2, nano-Fe2O3 and nano-CuO2 improved the density of the mortar by filling the pores led to the increase in strength and durability of the mortar.
Since the presence of nanomaterials either may be in the spherical materials form or may be in the tube materials form in the cement composites improved the strength of the concrete, an attempt was made here to improve the strength of the polyvinyl alcohol (PVA) fibre-reinforced concrete (PFRC) by incorporating nano-Fe2O3. Since the fibre and nano-Fe2O3 are too expensive, it is very imperative to design a favourable and optimistic proportion of PVA and nano-Fe2O3 in concrete production. In addition, the influence of such material combination on the concrete strength is also needed to be analysed. There are several methods available to achieve the favourable proportion, which include factorial design, design of experiment (DOE), Taguchi design method and response-level design. Among the several methods, DOE is a unique method to study the influence of independent variables on the experimental results. DOE optimizes the number of tests to be carried out, provides a relationship between independent variables and empirical model, and finally provides the optimum response of the experimental data. 19 Response surface methodology (RSM) is one of the mathematical and statistical methods of DOE that allows us to study the influence of the independent variables on the responses with minimum experiments. 20 – 26 Since the RSM provides efficient and accurate results, it has been widely applied in the field of concrete technology. 27 – 30 So central composite design (CCD)-RSM-based statistical analysis was performed to acquire the optimal composition of process variables (PVA and nano-Fe2O3) and the influence of process variables on the fresh and strength properties of concrete was also verified. The study factors or independent variables were volume fraction of PVA fibre and weigh fraction of nano-Fe2O3. CCD was used to design the experiment and the responses of the present study were fresh concrete properties (slump value), compressive strength and split tensile strength.
Response surface method
The RSM was progressed in the year of 1951 and still, it is used as a well-established tool for DOEs. 19 In addition, RSM is having a strong relationship with regression analysis. Since the RSM is a blend of statistical and mathematical methods, the interaction between the set of independent variables on response can be easily established. In addition, the RSM can be effectively used in a place where the output parameters are significantly influenced by multiple parameters. CCD is a well-renowned method in RSM to design the experiments and the number of experiments or the design experiments can be ascertained using equation (1).

where k is the independent variables or number of input parameters, ‘2 k ’ is the factorial points with n factorial runs, ‘2k’ is the axial runs and ‘c’ is the central runs. The first-order model fitted through the factorial runs and the axial runs to fit the second-order sentences. 19 For a non-linear and complex system, the second-order polynomial equation (equation (2)) is used to describe the relation between the independent variables and to predict the response.
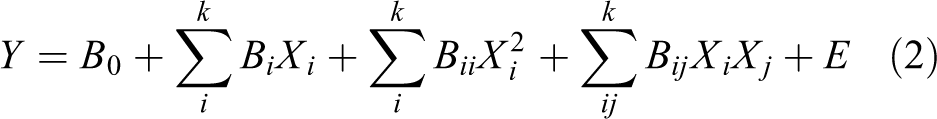
where ‘Y’ represents the predicted response (in the present study denoting slump value, compressive strength at the age of 7 and 28 days and tensile strength at the age of 7 and 28 days); B 0 is the intercept; Bi , Bii and Bij are the linear (first-order) coefficient, quadratic (second-order) coefficient and coefficient of interaction effect, respectively; Xi and Xj are the independent variables; and E is the random error associated. The preciseness and the accuracy of the model can be verified through predicted R 2, adjustable R 2, root mean square error, mean square error and the relative per cent deviation.
Factors, levels and specimen details
In RSM, to create the DOEs, initially, the number of independent variables (factors) and their levels need to be provided. The range of the levels is 3, 5 and 7, according to the number of runs. Based on the factors and levels obtained, the experimental design or test program can be obtained. The two-factor CCD method was used to evaluate the influence of PVA fibre and nano-Fe2O3 on fresh concrete properties (slump value), compressive and split tensile strength properties of concrete. A total of five responses were considered in this study, and the factors and the level of the response was 2 and 3, respectively, with 8 axis points and 5 midpoints. The independent variables, variables coding, factors and levels are listed in Table 1. For each response, 13 runs were considered and the details of the 13 mixture are presented in Table 2.
Parameters level in CCD model.

CCD: central composite design; PVA: polyvinyl alcohol.
Mixture proportion of concrete incorporated with PVA and nanoparticles.a

PVA: polyvinyl alcohol; W/C: water–cement.
a W/C ratio (cement + nanoparticles) – 0.4, fine aggregate – 457 kg/m3, coarse aggregate – 1054 kg/m3 and plasticizer – 1.5%.
Experimental investigation
Materials
Ordinary Portland cement in compliance with IS 456:2000 31 was used as a binding material in this study. The specific gravity of the cement was tested according to IS 8112: 2013 32 and the specific gravity was about 3.12. The natural river sand obtained from the Cauvery river basin passing through 4.75-mm sieve was used as fine aggregate. Sieve analysis (IS 2386(1):1963) was carried out for fine aggregate and the test results were confirmed the Zone II classification. The sand was tested to determine the initial moisture content and water absorption and the obtained results were 4.91% and 1.81%, respectively. The blue metal rock with the maximum aggregate size of 20 mm was used as a coarse aggregate. The aggregates were tested for specific gravity and were found to be 2.47 and 2.67 for fine and coarse aggregates, respectively. Nano-Fe2O3 with particle size 16 nm was used in this study to improve the strength of the concrete. The nano-Fe2O3 used in this study is shown in Figure 1. The physical properties of the nano-Fe2O3 are summarized in Table 3. To obtain the surface texture and chemical properties of nano-Fe2O3, scanning electron microscopic (SEM) analysis and powder X-ray diffraction (XRD) analysis were performed and the obtained results are shown in Figure 2. All the peaks obtained from the XRD analysis were compared and confirmed the presence of nano-Fe2O3. The PVA fibre available in the local market was used in this study (see Figure 1). The length and the diameter of the fibre were 20 µm and 12 mm, respectively. The specific gravity of the fibre was about 1.32 and the tensile strength of the fibre was 1421 N/mm2.

(a) Nano composite (nano-Fe2O3) and (b) PVA fibre. PVA: polyvinyl alcohol.
Physical properties of nanoparticles.


(a) XRD results and (b to e) SEM images of nano-Fe2O3. XRD: X-ray diffraction; SEM: scanning electron microscopy.
Mixture proportions, preparation and testing
According to the procedure described in IS 10262, 33 mix design was performed to achieve a characteristic compressive strength 40 N/mm2 (M40). The water–cement ratio of 0.40 was adopted and the value was kept constant for all mixture. Cellulose-based superplasticizer (SP) was used to adjust the workability of the concrete mixture. For all concrete mixture, the binding materials, aggregates, PVA fibre and nano-Fe2O3 were weighed in a dry condition and the ingredients were mixed in a mixer to evade the water loss. Slump cone test was performed to determine the fresh state properties of the concrete and the test was performed according to IS 456-2000. 31 To measure the influence of PVA fibre on the plastic stage of concrete, test was performed to measure the air content according to IS-1199. 34 The concrete cubes and cylinders with the dimension of 150 × 150 × 150 mm3 and 150 × 300 mm2, respectively, were fabricated to determine the compressive and tensile strength of all mixture. All the moulds were filled with concrete in layers and each layer of the concrete was effectively vibrated using portable table vibrator. Followed by, the moulds were demoulded after 24 h, cured in water having a stable temperature of 24°C and then the specimens were dried for 5 h, before 7 days and 28 days testing. Compression testing machine with the capacity of 2000 kN was used to test the cubes and cylinders at the ages of 7 and 28 days. SEM was used to acquire the phase composition in concrete samples, and the sample specimen obtained at the age of 28 days was used for microstructural examination.
Experimental observations and discussion
Fresh concrete properties – Slump and air content
The slump values for all mixture are presented in Figure 3. From Figure 3, it can be understood that the inclusion of fibre and nano-Fe2O3 reduced the workability of the concrete and the increase in the content of PVA and nano-Fe2O3 reduced the workability of the concrete further. In addition, the increase in PVA and nano-Fe2O3 content could yield higher amount of SP as well. The inclusion of fibre developed a strong fibre–matrix bond in concrete, increased the viscosity of concrete and restricted the distribution of the cement matrix. Hence, the workability of the concrete mixture reduced with the increase in the fibre rate. The test results of Zollo 35 exhibited the same that the volumetric increase in the fibre content significantly reduced the workability of the concrete due to the interfacial actions between the fibre and the cement matrix. For instance, the slump height of mixture PVA-0.4%-Fe-1% was 65 mm, whereas the mixture PVA-0.8%-Fe-1% exhibited a slump height of 50 mm, which is 23.07% lower than PVA-0.4%-Fe-1%. It has been well documented that the replacement of nanoparticles in cement-based binding materials modifies the rheological properties 18 of the cement matrix; in addition, the high fineness of the nanoparticles may escalate the water demand in the concrete mixture due to their higher surface area. 14 Similarly, all the mixture made with higher content of nano-Fe2O3 exhibited low slump values (see Figure 3). The higher surface area of the nano-Fe2O3 created a water demand in the concrete by water absorption, which led to the strong fibre–matrix bond in concrete, increased the viscosity of concrete and restricted the distribution of the cement matrix. Furthermore, the surface energy excreted by the nanoparticles accelerated the hydration process, consequently, the C-S-H gel and calcium hydroxide (Ca(OH)2) were generated more rapidly, which in turn increased the viscosity of the mortar and reduced the slump value. Compared to PVA-0.4%-Fe-1%, the mixture to PVA-0.4%-Fe-3% showed 27.69% decrease in workability. It is well documented that the introduction of plastic fibres creates larger interstitial voids between cement matrix, fibre and aggregates. 36,37 As expected, the inclusion of fibre and nano-Fe2O3 in concrete mixture increased the air content, which was due to the the increase in the incorporation rate. As discussed earlier, since the incorporation of PVA and nano-Fe2O3 increased the viscosity of the fresh concrete mixture, at the fresh stage, more entrapped air bubbles remained inside rather than escaping outside of the concrete mixture.

Influence of PVA and nano-Fe2O3 on workability (slump height). PVA: polyvinyl alcohol.
Compressive strength
The compressive strength properties of concrete mixture at the age of 7 and 28 days are shown in Figure 4. It was expected that the inclusion of PVA fibre may reduce the strength properties of the concrete, because the fibre inclusion decreased the slump and air content of the concrete. In contrast, the fibre inclusion moderately improved the strength of the concrete, however, beyond certain volume fraction, the strength of the concrete mixture was reduced with increase in the fibre inclusion. Amin Noushini et al. 38 also documented the same that the compressive strength of concrete may increase first, and beyond a certain level of inclusion, the strength may drop. Further, from the literature, it has been observed that the influence of fibre inclusion on the compressive strength of concrete is not significant, conversely, the fibre inclusion may enhance the tensile strength of the concrete substantially. 39 The finding of the present study also revealed the same. From Figure 4, it can be understood that the concrete mixture with lower fibre fraction achieved higher strength when compared to the concrete mixture with a higher volume fraction. Since the increase in the fibre volume may create the mortar demand to develop the fibre–cement matrix network, there was an unpronounced effect on the compressive strength. The other reason may be poor compaction of concrete due to the higher volume of fibre. The above similar observations have been reported in the literature. 40 The inclusion of nano-Fe2O3 improved the compressive strength of the concrete significantly, and the increase in the weight fraction of nano-Fe2O3 improved the compressive strength further. For instance, at the age of 28 days, compared to PVA-0.6%-Fe-0.59%, the mixture PVA-0.6%-Fe-2% improved the compressive strength of the concrete to a maximum of 7.44%. The improvement in the compressive strength may be due to high reactive capacity of nano-Fe2O3 particles. The high reactive capacity of nano-Fe2O3 particles consumed the crystalline Ca(OH)2 (which was produced during the hydration process) rapidly; consequently, the hydration process has been accelerated, leading to the formation of more volume of reaction products. In addition, the nano-Fe2O3 particles enhanced the particle packing density of the concrete by filling the micropores, which led to an increase in the compressive strength. To verify the filling ability of the nanoparticles, mortar portions available in the concrete (age of 28 days concrete) were extracted and subjected to microstructure analysis through SEM. Figure 5 shows the SEM images of the mortar portions with and without nanoparticles. The morphological analysis indicated that the texture of pastes in concrete with nanoparticles was considerably different from that in conventional concrete. Figure 5((a) – c1 and d1) reveals that the pore size of the mixture without nanoparticles was considerably large; however, the pore size of the mixture with nanoparticles was substantially small due to the filling effect of nanoparticles (Figure 5((b) – d2). Nanoparticles present in the mixture behaved as fine fillers and retrieved pores due to the filling effect. Thus, the density of the mortar particles present in the concrete increased. The high free energy of nanoparticles not only accelerated cement hydration but also helped nanoparticles to behave as kernels in the cement paste, which reduced the Ca(OH)2 crystal size and made the tropism more stochastic. 39 The high free energy of nanoparticles reduced the Ca(OH)2 crystal size and content (Figure 5((b) – d2)). The high packing capacity of the mixture with nanoparticles indicated the rapid development of the C–S–H gel in the presence of different nanoparticles and a decrease in the Ca(OH)2 crystal size due to the consumption of crystalline Ca(OH)2. In conventional concrete, C–S–H gel was enclosed by some needle hydrates, and the crystal size was higher than that in concrete with nanoparticles (Figure 5((a – c1 and d1)). As shown in Figure 4, it can be understood that the higher replacement of nano-Fe2O3 did not show improvement in the compressive strength. Since the quantity of nano-Fe2O3 available in the mixture is higher than the quantity required to combine with the progressive lime during the hydration process, the surplus silica was leached out from the mixture, leading to the reduction in the strength enhancement. 2,37
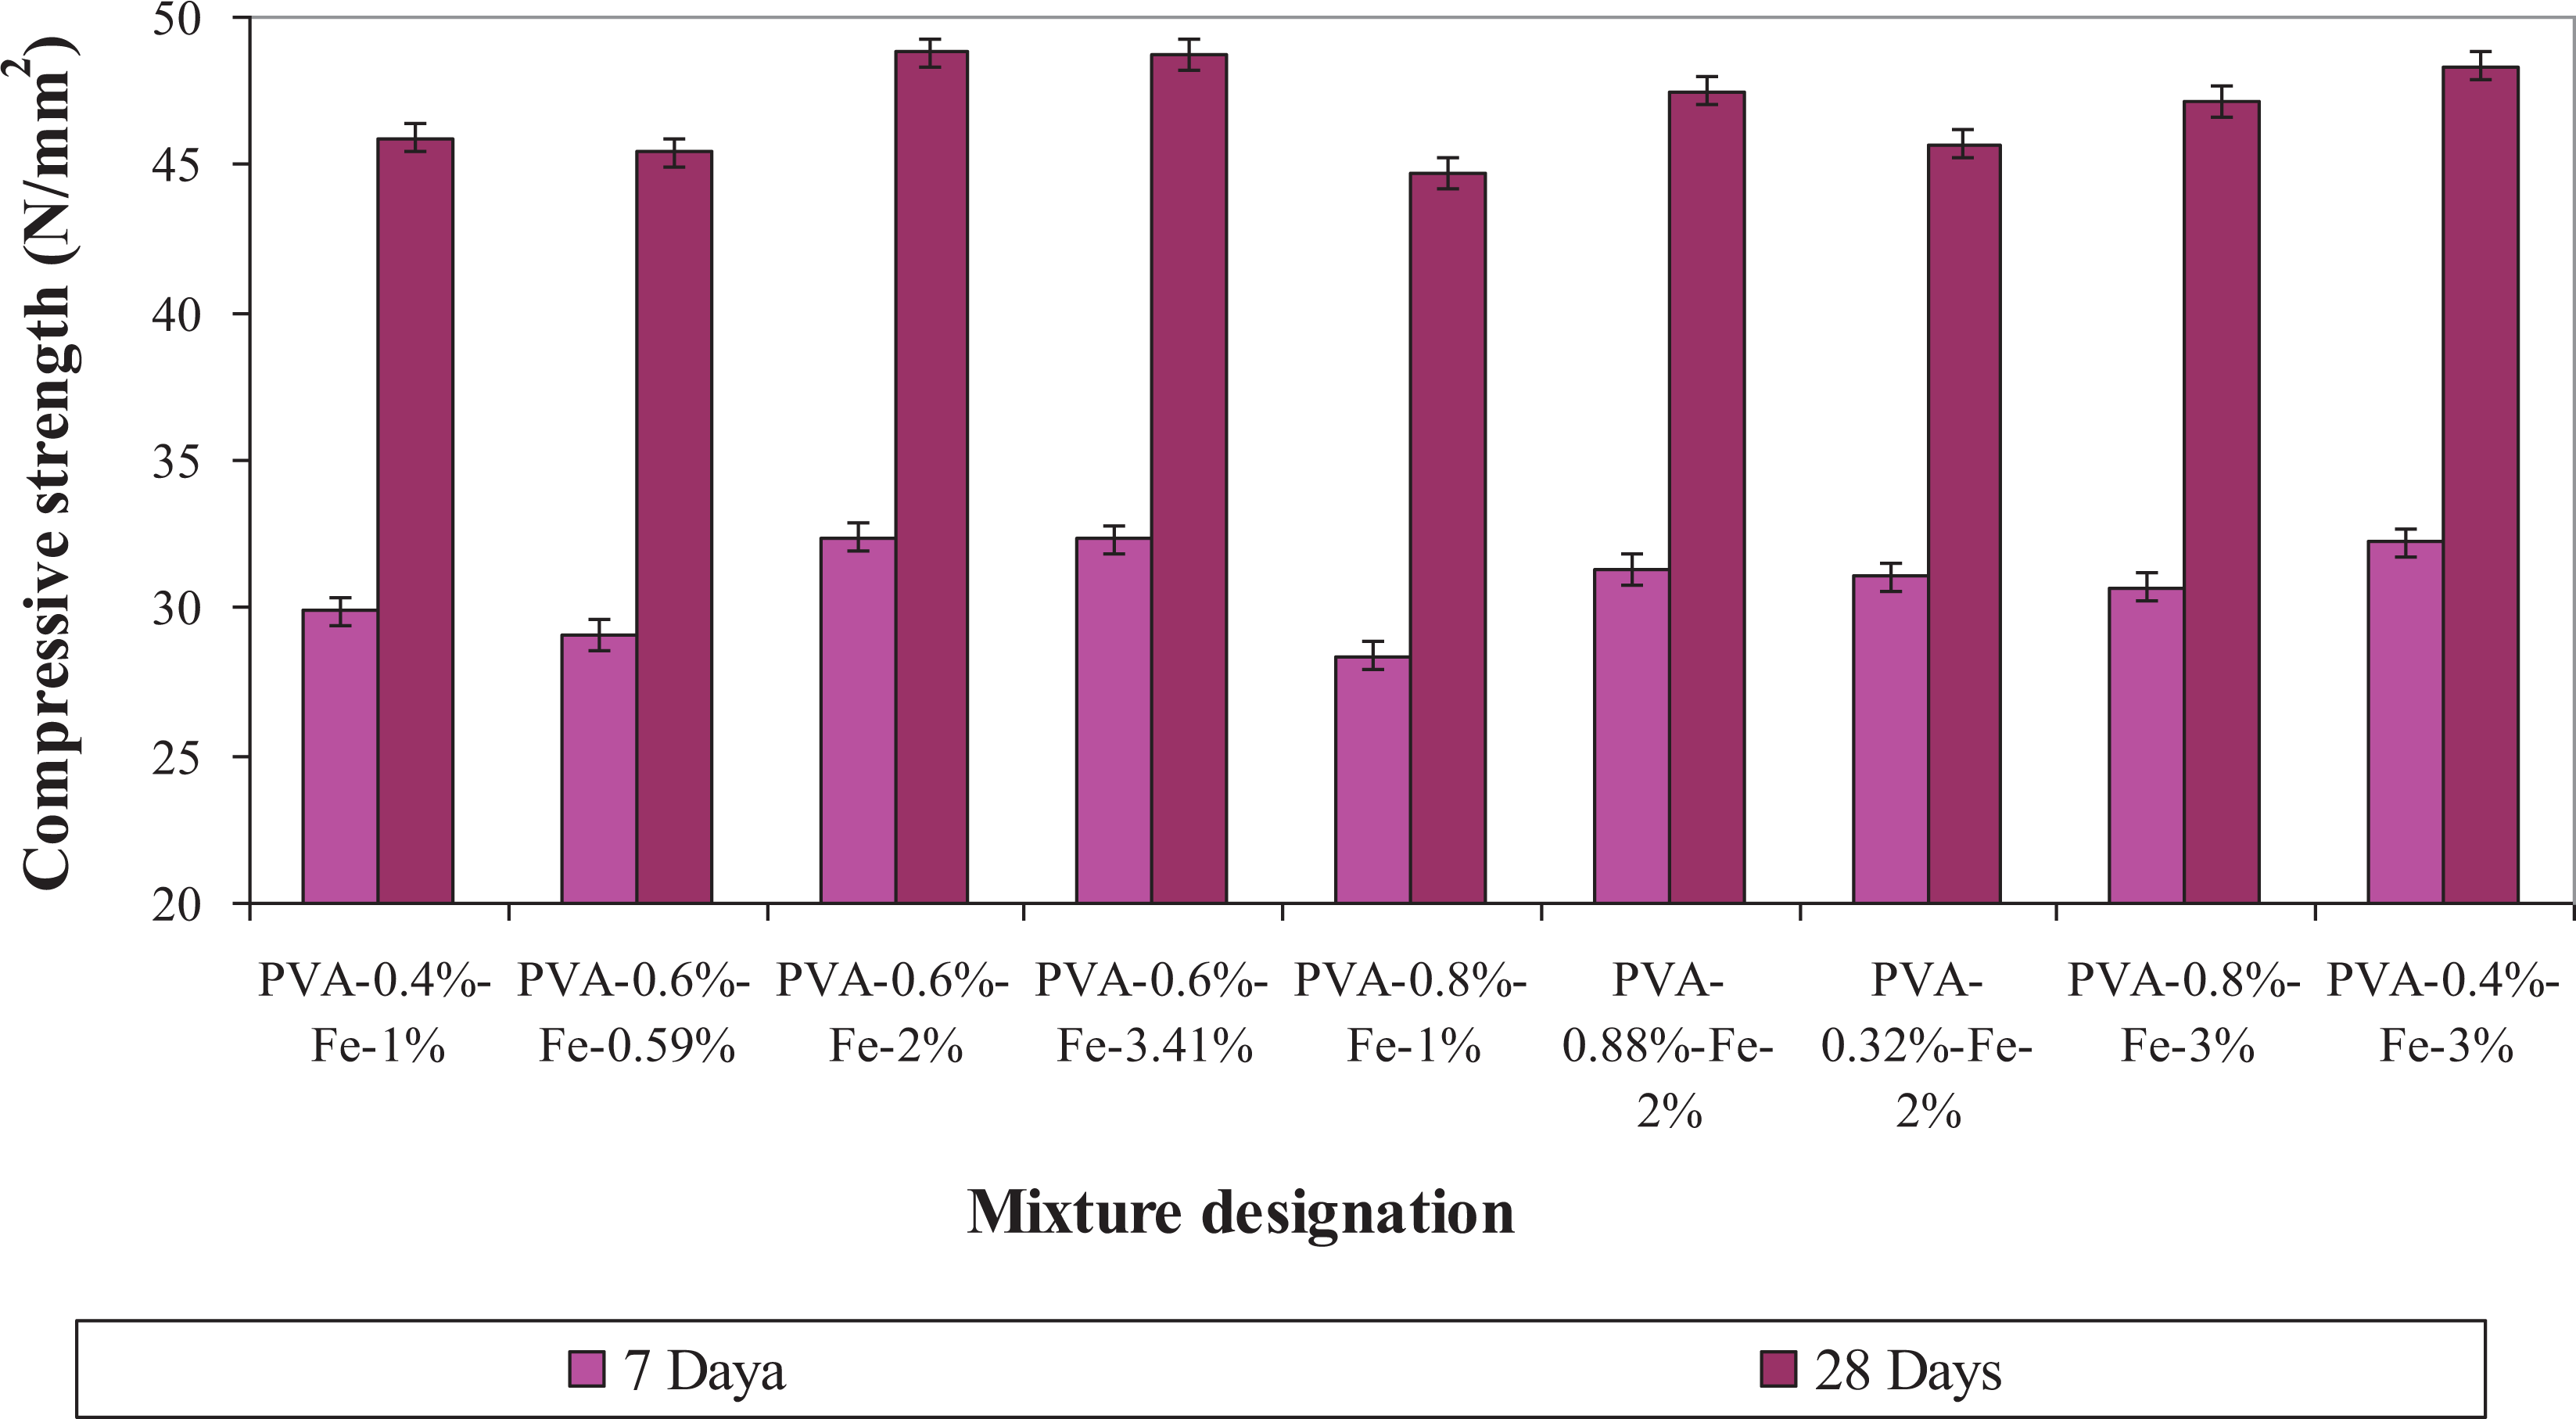
Influence of PVA and nano-Fe2O3 compressive strength – comparison. PVA: polyvinyl alcohol.
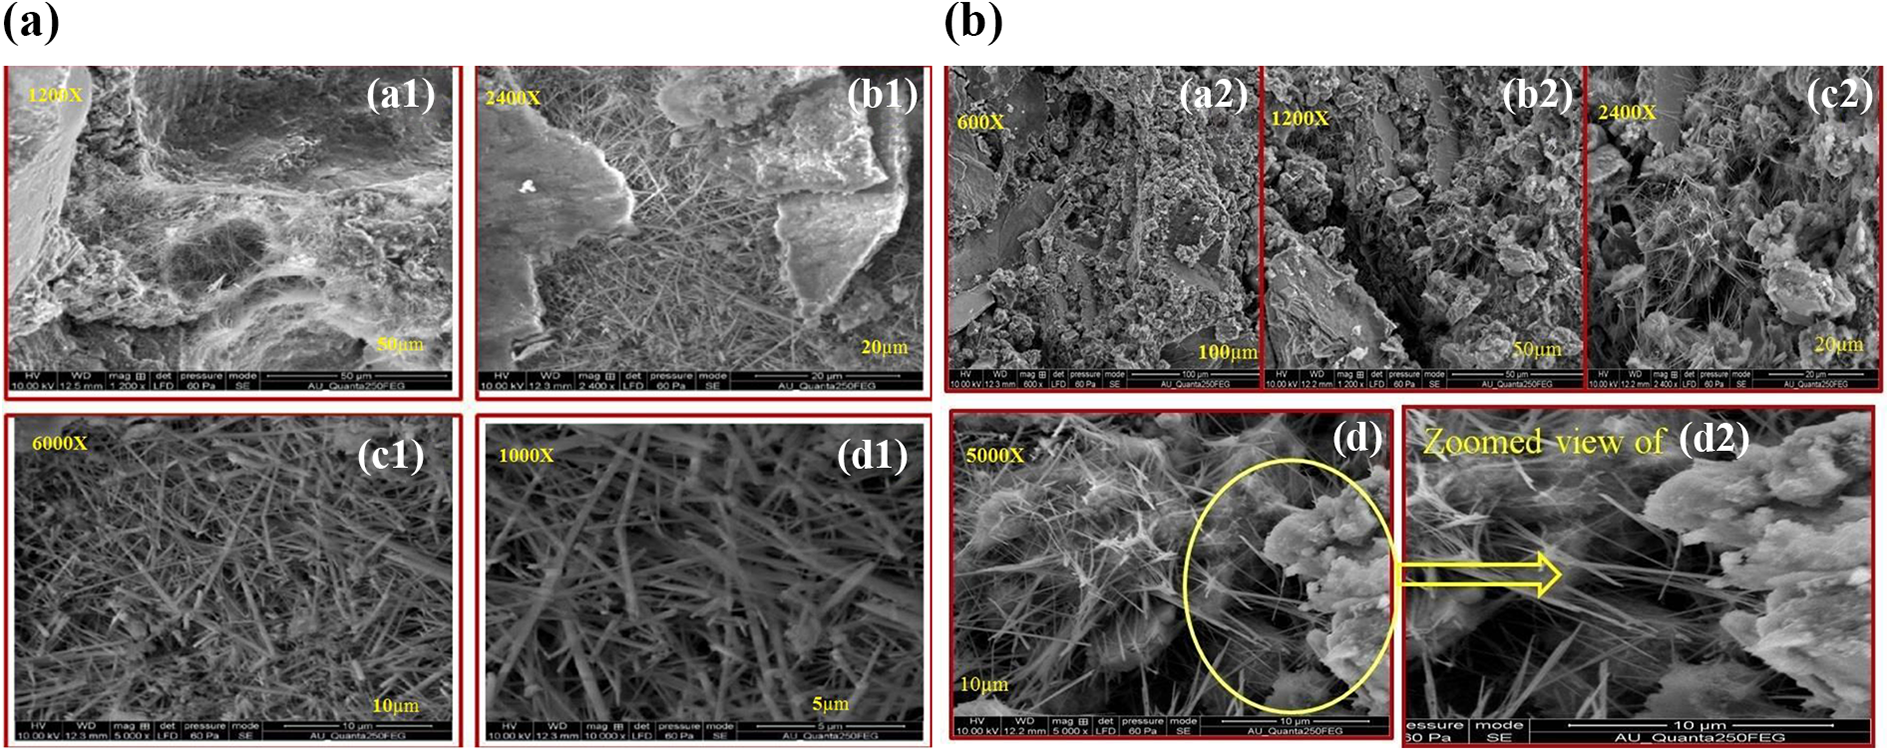
SEM images of (a) control mixture at the age of 28 days and (b) PVA-Fe-2.25% at the age of 28 days. PVA: polyvinyl alcohol; SEM: scanning electron microscopy.
Split tensile strength
Since the split tensile strength is the key parameter of the FRC, the tensile strength of all mixture with various volume fractions of PVA and nano-Fe2O3 was determined at the age of 7 and 28 days and are depicted in Figure 6. As shown in Figure 6, the inclusion of PVA fibre and nano-Fe2O3 significantly enhanced the tensile strength of concrete. The enhancement in the tensile strength with the inclusion of PVA fibre may due to the bridging effect/anchorage of the fibres. The dispersed fibre in the concrete developed a bridging effect between the fibre and concrete, thus enhanced the tensile strength of the hardened concrete. The outcome of the work by Noushini et al. 38 also revealed that the influence of fibre inclusion to the concrete is more significant in crack control, energy absorption capacity and tensile strength, rather than improving the compressive strength of the concrete. It is worthy to note that from Figure 6, like compressive strength, for a higher level of inclusion rate (0.6%), the increase in the tensile strength of the concrete mixture was not significant. As shown in Figure 6, the incorporation of nano-Fe2O3 enhanced the strength of the cement composite matrix, consequently, the bridging effect between the fibre and the cement composite matrix enhanced. So the increase in the tensile strength of concrete was observed with the increase in the nanoparticles.

Influence of PVA and nano-Fe2O3 tensile strength – comparison. PVA: polyvinyl alcohol.
RSM modelling – Observations and discussions
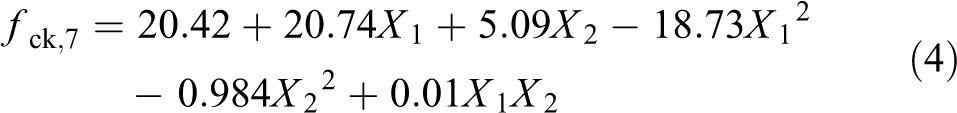
To understand the influence of process variables includes PVA and nano-Fe2O3 on the fresh, compressive and tensile strength properties of concrete mixture and to predict the fresh and strength properties of concrete mixture for different process variables, CCD process was considered in this present study. To achieve this, 13 experiments were considered in each response and the mix proportions are listed in Table 2. The obtained CCD responses were expressed in the form of second-order polynomial equation (equations (3) to (7)), and the results are summarized in Table 4, along with mean, standard deviation and coefficient of variance.
Comparison of experimental and predicted strength using RSM.

PVA: polyvinyl alcohol; SD: standard deviation; RSM: response surface methodology.

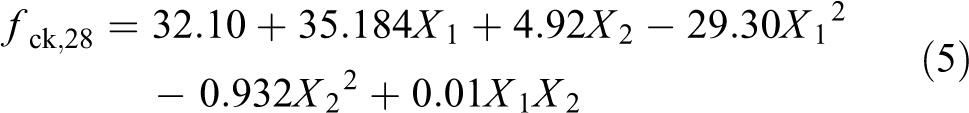

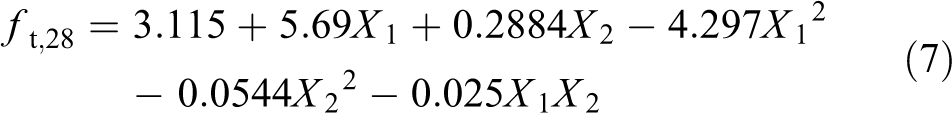
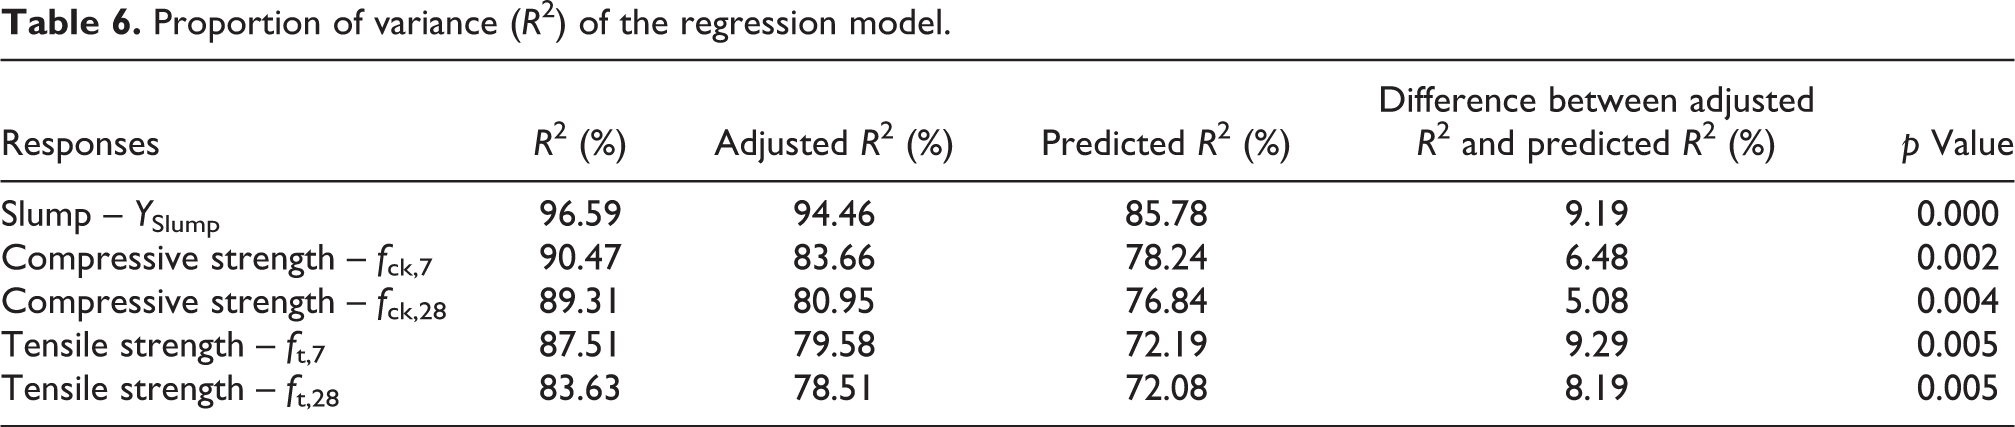
The normal probability plots of the residual fit for each response are presented in Figure 7. As we can see from Figure 7, the residual of all the responses was presented as a straight line and falling very close to the straight line, demonstrating that the errors were evenly distributed. Furthermore, Figure 7 supports the appropriateness of the least-squares fit. Analysis of variance (ANOVA) is a group of statistical models and its associated estimation procedures can be used to analyse the difference/relationship between the process variables and responses. The ANOVA of all responses are summarized in Table 5. As we can see from Table 5, the lack of fit (p value) for all the responses were less than 0.005, revealing that the models were highly appropriate. The appropriateness and the fitting degree of the regression models can be substantiated through proportions of variance (R 2) and the difference between the adjustable R 2 and the predicted R 2 should not be more than 20%. 19 Table 6 presents the difference between the adjustable R 2 and the predicted R 2. As we can see from Table 6, the difference between the predicted R 2 and the adjustable R 2 of all responses (Y Slump, f ck,7, f ck,28, f t,7 and f t,28) were lesser than 20%, revealing that the model of all the responses were very realistic. In addition, the R 2 value of the responses Y Slump, f ck,7, f ck,28, f t,7 and f t,28 were 96.59%, 90.47%, 89.31%, 87.51% and 83.63%, respectively, which indicate that 3.41%, 9.53%, 10.69%, 12.49% and 16.37% of variation only cannot be revealed by the quadratic model. The comparison between the predicted values and the experimental values are shown in Figures 8 and 9. From Figures 8 and 9, it can be seen that the predicted values using second-order polynomial equation fairly agreed with the experimental results (mean of the models Y Slump, f ck,7, f ck,28, f t,7 and f t,28 were 0.9996, 0.9998, 1.0001, 0.9993 and 0.9999, respectively), revealing that the model developed using regression analysis can be used to predict Y Slump, f ck,7, f ck,28, f t,7 and f t,28, within the limits of the factors studied. ‘F’ value is the ratio of mean square of factors and the mean square of errors, the appropriateness of the model can be justified through F value of the models. In general, the model can be defined as significant, if the F value is higher. 41 As we can see from Table 5, the F values of 39.69, 13.29, 10.57, 19.81, and 16.22 in the responses of Y Slump, f ck,7, f ck,28, f t,7 and f t,28, respectively, indicating that the models are more significant.
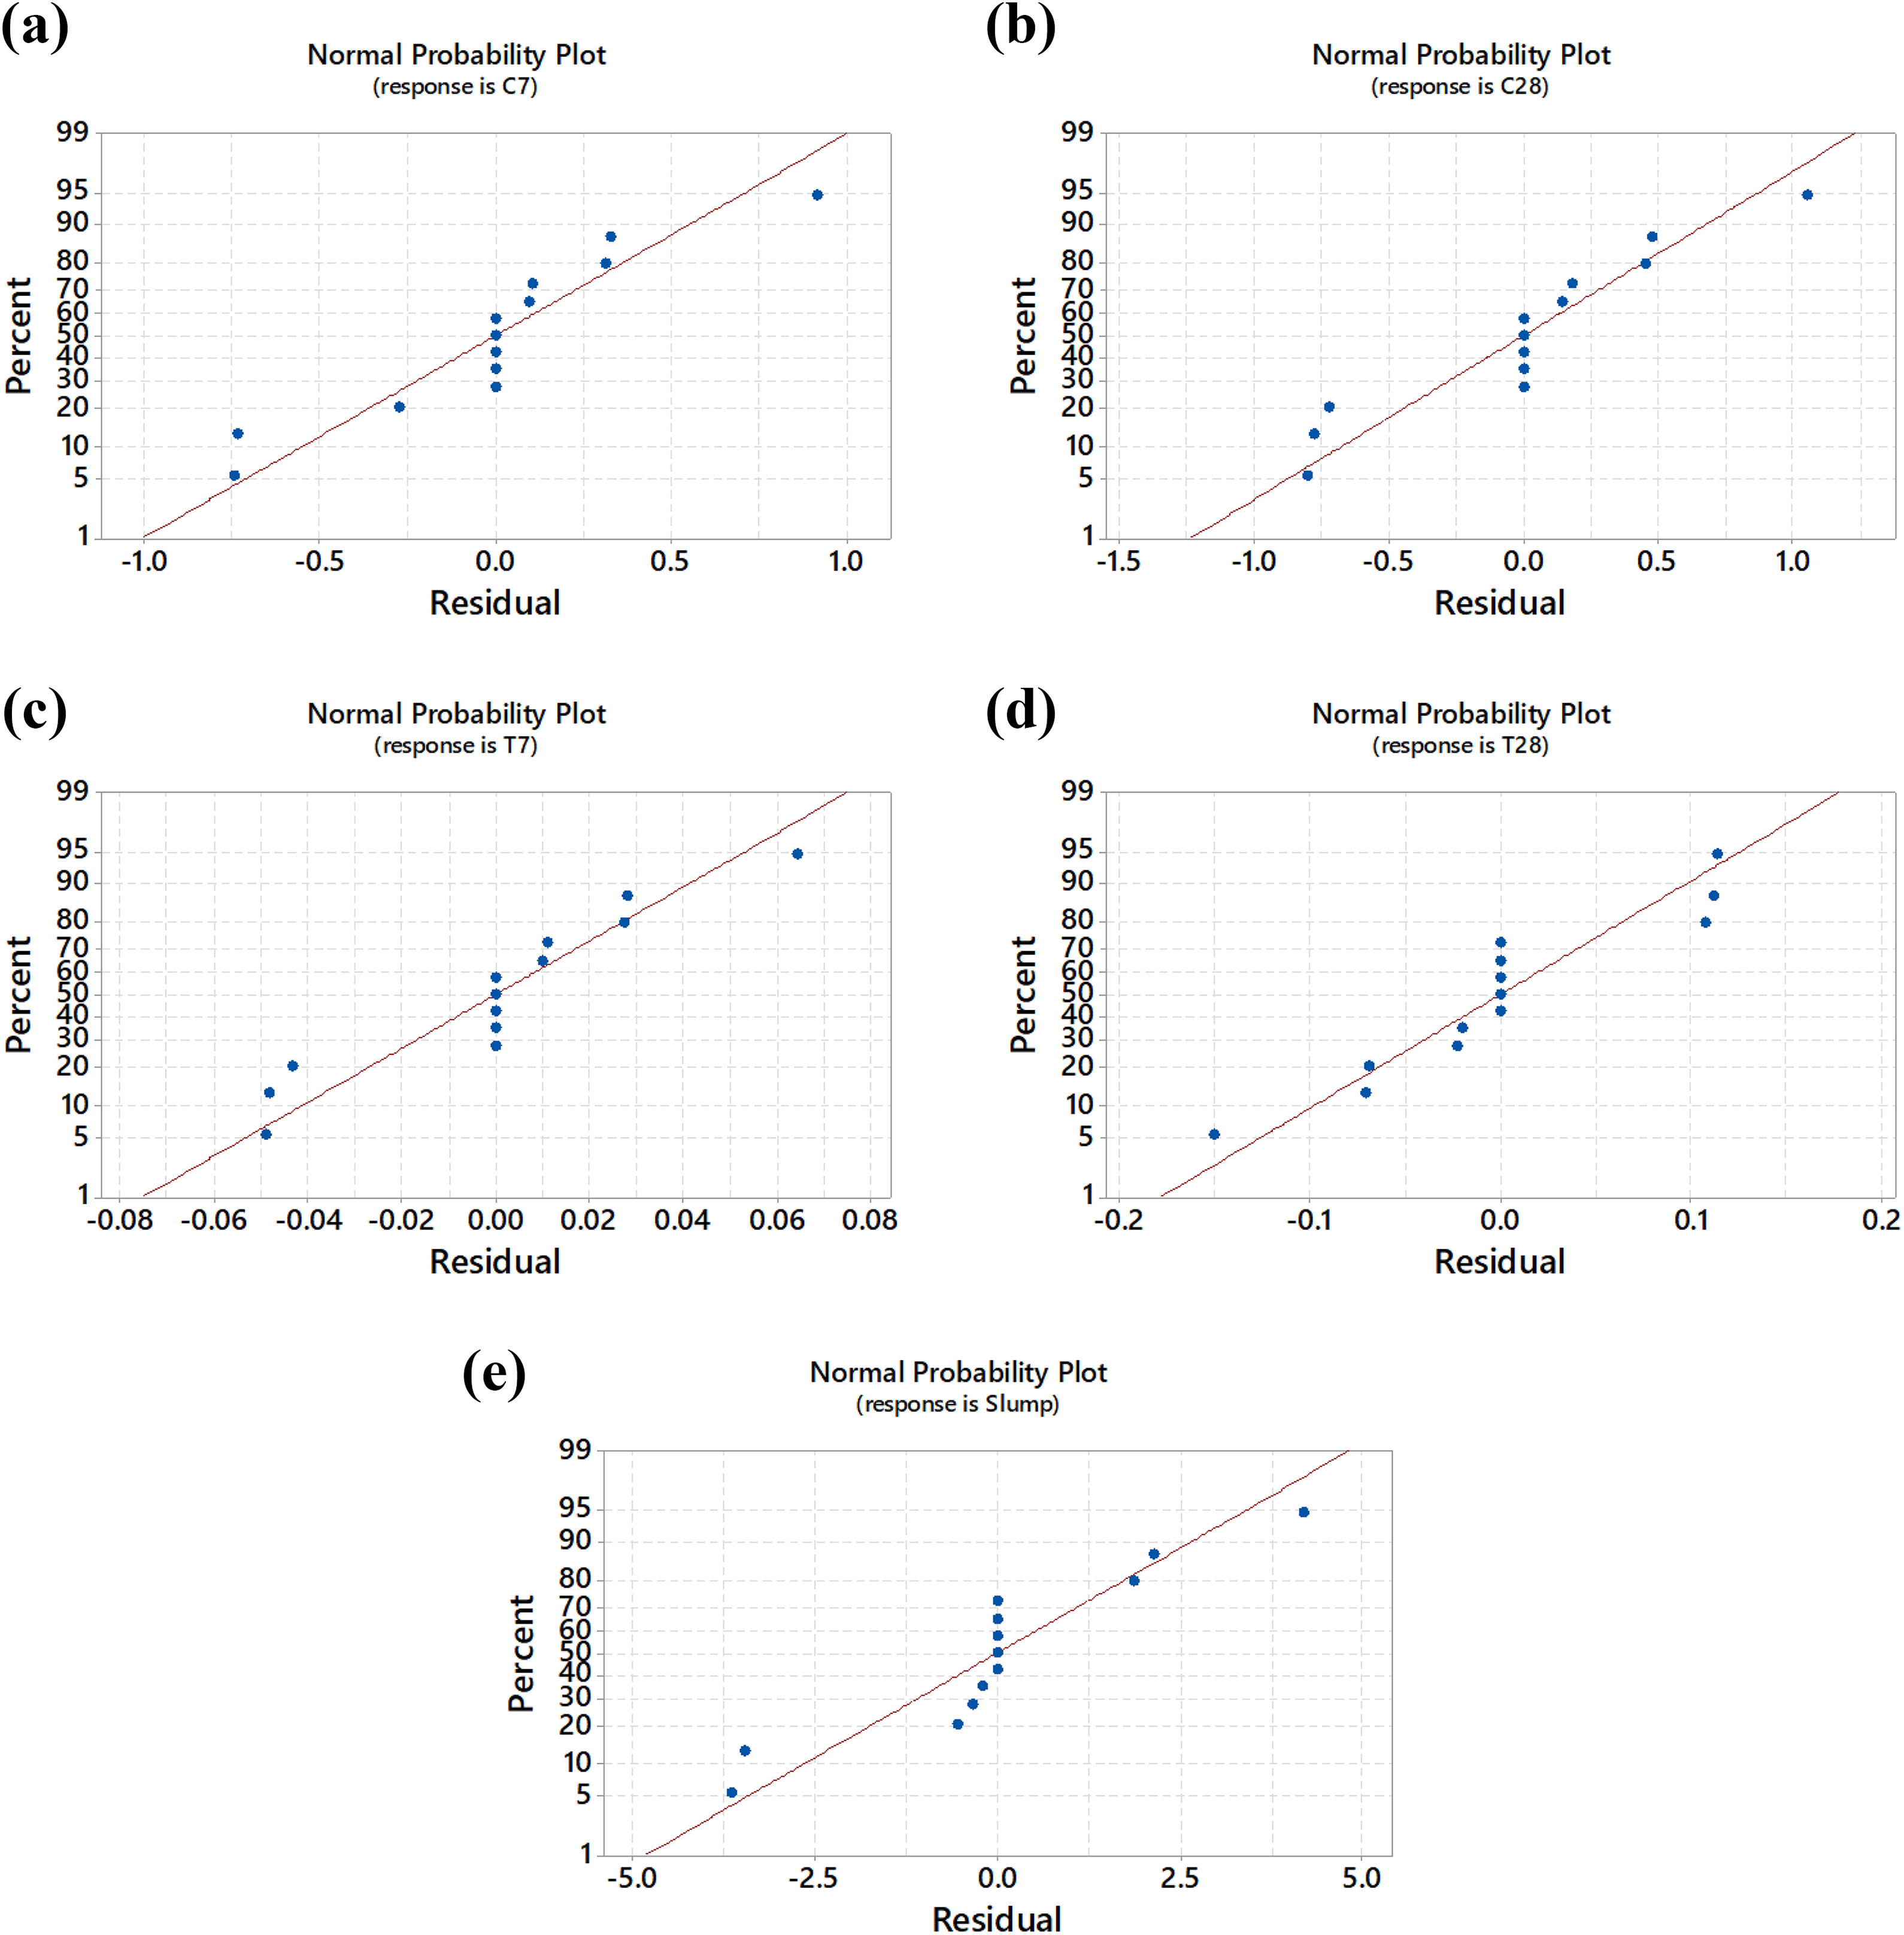
Normal probability residual plot for (a) Y fck,7, (b) Y fck,28, (c) Y ft,7, (d) Y ft,28 and (e) Y Slump.
ANOVA of the regression model for experimental results.

ANOVA: analysis of variance.
Proportion of variance (R 2) of the regression model.

Comparison between experimental and predicted compressive strength.

Comparison between experimental and predicted tensile strength.
Significance of process variables influencing response – Lack of fit (p value) and Pareto analysis
The significances of the process variables can be established by p value. The p value of the model is the probability value of the F test. Generally, the significant model should have minimum p value. If the p value of the model or the process variable are <0.005 and <0.001, then the model or the process variable can be considered as significant and highly significant, respectively. The p value of the model or the process variable is more than 0.005, then it will be considered as insignificant and it will be removed. As listed in Table 5, the linear (X
1, X
2) term of PVA and nano-Fe2O3 were significant for slump (Y
Slump) and the p value was 0.000. But the quadratic

Pareto chart for (a) Y fck,7, (b) Y fck,28, (c) Y ft,7, (d) Y ft,28 and (e) Y Slump.
Considering the tensile strength properties of the concrete mixture at the age of 7 and 28 days, the linear (X
1) and the quadratic
Surface plot analysis and optimization of process variables
To understand the influence trend of process variables on the responses, 3D surface plots were prepared and are presented in Figure 11. In the surface plot, the response was plotted in ‘z’ axis and the process variables PVA and nano-Fe2O3 were plotted in ‘x’ and ‘y’ direction, respectively. From Figure 11, it can be understood that the increase in the weight fraction of nano-Fe2O3 from 1% to 2% improved the compressive strength of the concrete mixture at the age of 7 and 28 days, and beyond 2%, the strength of the concrete was reduced. As shown in Figure 11, even though the inclusion of PVA moderately improved the compressive strength of concrete, the influence of nano-Fe2O3 was very significant than the PVA. In addition, the volume fraction of PVA beyond 0.6% reduced the compressive strength of concrete mixture. According to the 3D surface plot, the maximum 28 days compressive strength (f ck,28) corresponding to the smallest fraction of PVA and nano-Fe2O3 were 0.6% and 2%, respectively. The optimized compressive strength of the concrete at the age of 7 and 28 days are presented in Figure 12. The notation ‘y’ and ‘d’ plotted in Figure 12 indicates the maximum strength value and desirability of the process variables ranging from 0 to 1, where ‘1’ represent the desirable combination or ideal mode and ‘0’ indicates the undesirable combination. 19 To validate the RSM results, confirmation tests were performed and the test results along with the percentage of error are summarized in Table 1. From Figure 12, it can be seen that the optimum value of PVA and nano-Fe2O3 to achieve the maximum compressive strength at the age of 28 days were 0.5571% and 2.5857%, respectively. The confirmation test was performed to validate the results (Table 7), and the percentage of error for 28 days compressive strength was 1.88%.

Surface plot for (a) Y fck,7, (b) Y fck,28, (c) Y ft,7, (d) Y ft,28 and (e) Y Slump.
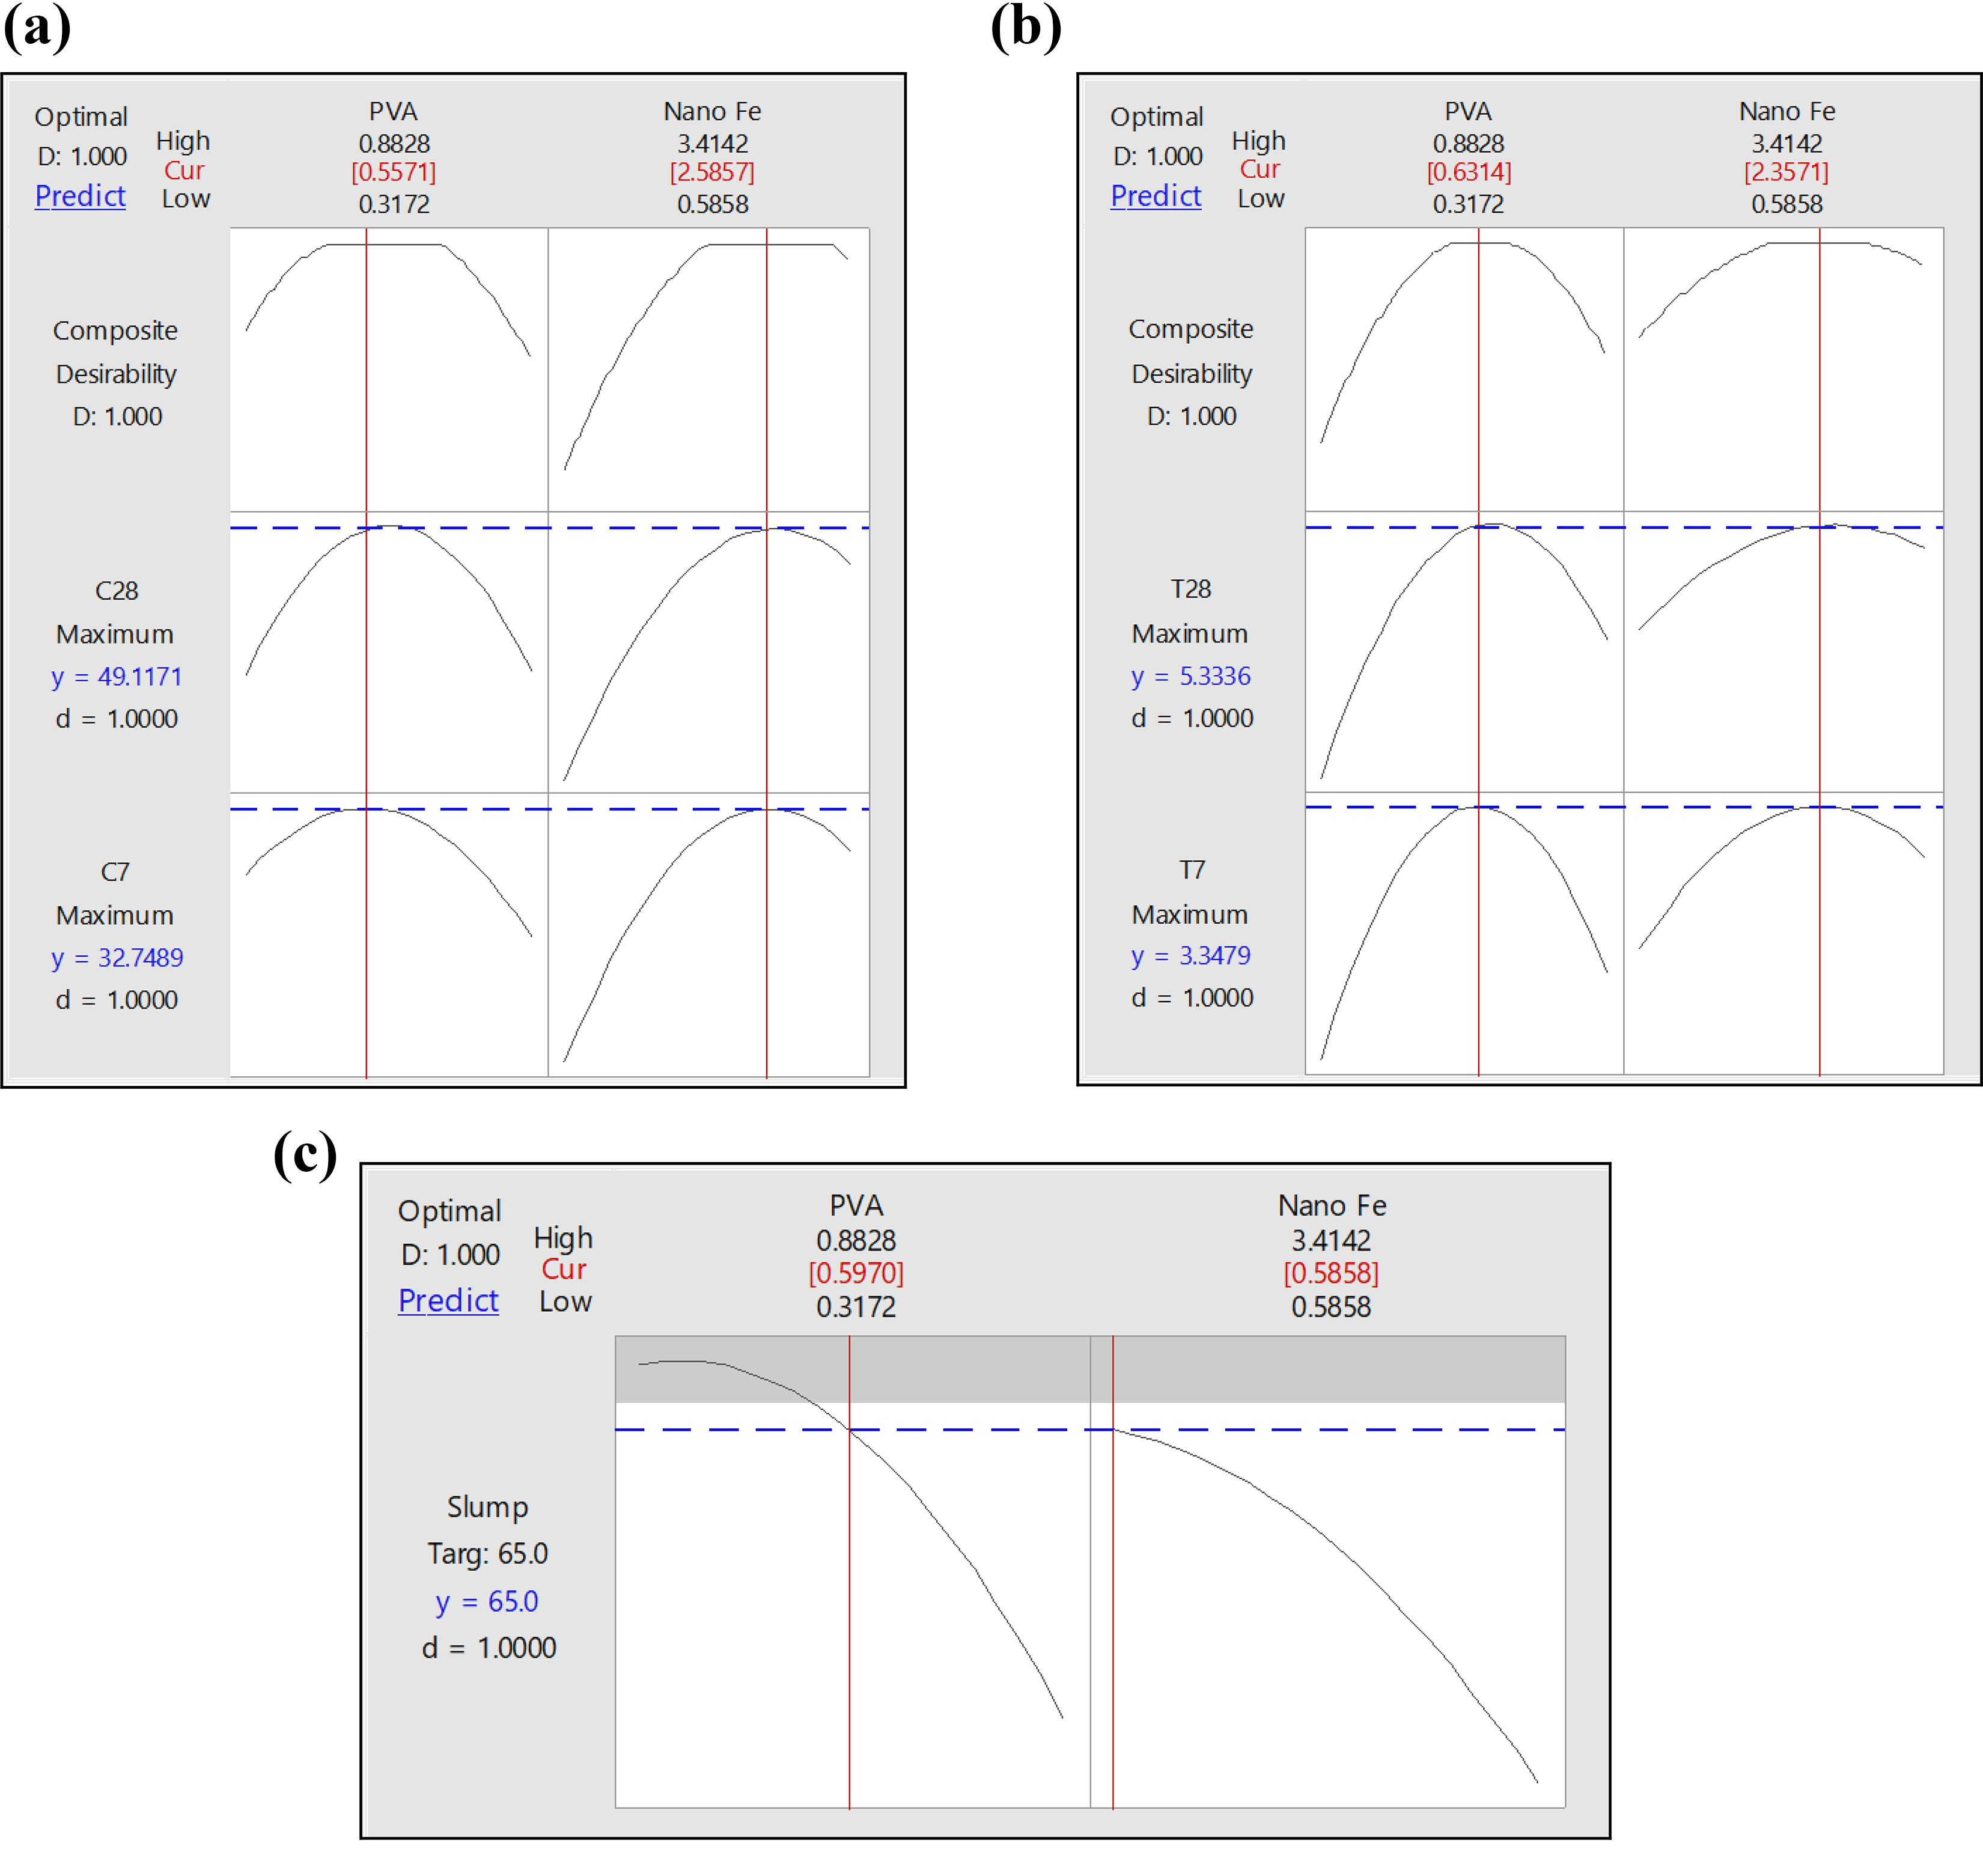
Response optimization plots for (a) Y fck,7 and Y fck,28, (b) Y t,7 and Y t,28 and (c) Y Slump.
Confirmation test results and error percentage.

PVA: polyvinyl alcohol; RSM: response surface methodology.HueD_Ref31
From Figure 11, it can be seen that the increase in the fraction of PVA and nano-Fe2O3 were increased the tensile strength of the concrete mixture at the age of 7 and 28 days; however, the influence of PVA was predominant in increasing the tensile strength when compared to the nano-Fe2O3. In addition, beyond the 0.6 volume fraction of PVA and 2% of nano-Fe2O3, the tensile strength of the concrete was reduced. The optimized tensile strength of concrete mixture is shown in Figure 12. Since the confirmation test revealed 2.92% and 2.50% percentage error for 7 and 28 days tensile strength, respectively, the maximum 28 days tensile strength of the concrete can be obtained at 0.6314% fraction of PVA and 2.3571% fraction of nano-Fe2O3. As we can see from Figure 11, the increase in PVA and nano-Fe2O3 equally influenced the workability of the concrete mixture. Since the slump height of 65 mm was considered as a desirable and acceptable workability for structural concrete, the same value was considered as a target value to optimize the slump. The optimized slump is shown in Figure 12, and it can be seen from Figure 12 that the target slump height of 65 mm can be achieved at 0.5971% and 0.5858% fraction of PVA and nano-Fe2O3, respectively.
Conclusion
An attempt was made to optimize the slump and strength properties of the concrete containing PVA fibre and nano-Fe2O3 using CCD of RSM modelling. From the statistical analysis, the following conclusions were made. The incorporation of PVA fibre and nano-Fe2O3 developed a strong fibre–matrix bond in concrete, increased the viscosity of concrete and restricted the distribution of the cement matrix, thus reducing the workability and increasing the air content of the concrete mixture. Compared to mixture PVA-0.4%-Fe-1%, mixture PVA-0.8%-Fe-1% showed 23.07 lesser workability. The incorporation of 3% nano-Fe2O3 in a PFRC reduced the workability of 27.69% when compared to mixture incorporated with 1%. The inclusion of PVA fibre in concrete significantly improved the tensile strength of the concrete, whereas moderately improved the compressive strength of the concrete. However, the higher level of fibre inclusion increased the possibility of pores connections in the matrix, leading to a decrease in the tensile strength of concrete. The high reactive nano-Fe2O3 present in the concrete accelerated the hydration process of concrete and enhanced the particle packing density of the concrete by filling the micropores. Consequently, increased the compressive and tensile strength of the concrete. At the age of 28 days, compared to PVA-0.6%-Fe-0.59%, the mixture PVA-0.6%-Fe-2% improved the compressive of the concrete to a maximum of 7.44%. The higher level incorporation of nano-Fe2O3 leached out the surplus silica from the concrete and reduced the strength enhancement of the cement composite matrix, consequently obstructed the compressive strength enhancement of the concrete. A total of five responses (Y
Slump, f
ck,7, f
ck,28, f
t,7 and f
t,28) were considered in CCD-RSM analysis and the factors and the level of each response was 2 and 3, respectively. The ANOVA and Pareto chart analysis were revealed that the regression models for Y
Slump, f
ck,7, f
ck,28, f
t,7 and f
t,28 are highly significant. Since the p value and R
2 values of the models were less than 0.005 and nearly equal to 1, respectively, indicating that the numerical results of the models are high accuracy. The ANOVA results revealed that the most contributing factor for compressive strength was nano-Fe2O3 (99.81%) and the most significant factor for the tensile strength was PVA fibre (75.75%). The results of regression analysis, Pareto chart and surface plot analysis also revealed that the most significant factor for f
ck,7 and f
ck,28 is the linear term nano-Fe2O3 (X
2) and the linear term of PVA (X
1) is the most significant factor for f
t,7 and f
t,28. The optimal proportion of design variables against f
ck,7, f
ck,28, f
t,7 and f
t,28 were obtained, which retains highly significant to design the concrete mixture.
Footnotes
Declaration of conflicting interests
The author(s) declared no potential conflicts of interest with respect to the research, authorship, and/or publication of this article.
Funding
The author(s) received no financial support for the research, authorship, and/or publication of this article.