
Abstract
Currently, 3.6 V 700 mAh NiCd/NiMH battery is the most popular one used in emergency lights or other devices. It is well known that the state of health is related to the battery internal resistance and charging/discharging characteristics. However, the information needed may not be unveiled sufficiently from the manufactory although some certain specifications are provided. To provide users more accurate information, this system proposes an online battery quality measurement system based on two-pulse approach for internal resistance estimation along with long-term charging/discharging life cycle test. The measurement tasks are carried out using the microprocessor that connects with the computer via universal serial bus. Through the data acquisition system, every measured data from the microprocessor can be immediately transmitted to the data server via transmission control protocol/internet protocol. Accordingly, all testing results can be viewed online from the website, and their history record can be also tracked in the database. The experimental results verify that the proposed scheme can perform the quality measurement effectively and accurately.
Introduction
The rechargeable batteries such as NiCd and NiMH batteries are increasingly applied in many areas. An NiMH battery can provide two to three times capacity of an equivalent size NiCd, and its energy density is close to that of a lithium-ion battery. One limitation resides in the battery ageing that affects its performance, occurring throughout its whole life. Furthermore, degradations take place due to different conditions, depending on proportions as usage and external interaction. 1 The battery life and performance factors can be summarized to four main factors such as cyclic life, depth of discharge, temperature and recharge rate. For the customers, it should ensure the battery quality before its installation in the assembly line. Therefore, the study for detecting deteriorated devices, long cyclic life and optimal charging process are requested. 2 –5 Besides, the information for capacity loss and accelerated battery ageing or even possible battery damage are needed for the users. 6 –9 Normally, the above information may be provided by the manufactory. However, it may be not sufficient or certified before installation. Accordingly, the research for battery quality measurement is an indispensable topic for both industry and academia.
The internal resistance is one of the key parameters for determining energy efficiency and lost heat of a cell. The battery modules performance efficiency and the degradation rate are closely associated with battery internal resistance. For example, the power capability of a lithium-ion battery is governed using the resistance, which varies with the battery state temperature, state of charge and state of health. 10 –12 Consequently, many measurement methods such as AC methods, electrochemical impedance spectroscopy and thermal loss methods were reported. 13 –15 With rapid development of Internet of Things (IOT) techniques, the integration with IOT may provide a better solution for measurement issue. 16 –22 For this reason, the proposed battery quality measurement system aims to combine internal resistance detection with long-term cycle test. Also, PHP package is designed for easily tracking online/historical measurement status/record.
This paper is organized as follows. The second section describes the system structure, mainly including an internal resistance measurement circuit, charging/discharging circuit, data acquisition system, user interface and data server. In the third section, the design of charging/discharging circuit is illustrated and discussed in details. The concept of two-pulse measurement method for determining the internal resistance is introduced in the fourth section. The simplified internal resistance measurement circuit is also presented for further illustration. In the fifth section, the data acquisition interface using VB programming is designed for users to easily handle the system performance situation on line. The sixth section presents a variety of experimental results displayed in the web, for example, battery charging/discharging voltage and current curves and internal resistance curve. The conclusions are presented in the ‘Conclusions’ section.
System structure
The proposed system architecture is shown in Figure 1(a). It mainly consists of (1) Charging/discharging circuit: It can carry out a battery charging/discharging process for cycle test. The internal resistance can be also measured at the initial stage of the discharging process. (2) Microprocessor-based controller: It is to control the performance of the charging/discharging circuit and internal resistance measurement circuit. It can receive the commands and transmit the measured data from/to the data acquisition system. (3) Data acquisition system: It is to communicate with the controller and data server. Accordingly, the commands can be sent to the controller for measurement action, and the measured data can be received and then transmitted to the data server. (4) Data server: It uses the MySQL database as the server to collect all measured data from the data acquisition system. (5) Website: It is to provide the user interface based on PHP. The uploading data to the web includes test cycle number, battery charging/discharging statuses like voltage, current and internal resistance.

System architecture: (a) Profile of the proposed system and (b) block diagram.
Charging/discharging circuit
The charging/discharging circuit is shown in Figure 2. The voltage (V
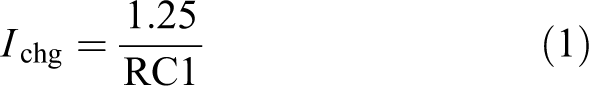
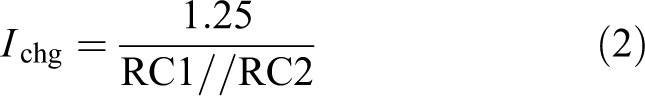
bat) obtained from the battery voltage using the voltage divider principle is fed back to the bq2002 (NiCD/NiMH Fast-Charge Management IC, Texas Instruments, USA) for the charging management. Based on LM317 (3-Terminal Adjustable Regulator, Texas Instruments, USA), the constant charging current (

Charging/discharging circuit.
(a) Sc switch opened:
(b) Sc switch closed:
The discharge current (

Internal resistance measurement circuit
The principle of the proposed internal resistance measurement is based on the direct current discharge method, as shown in Figure 3. Note that
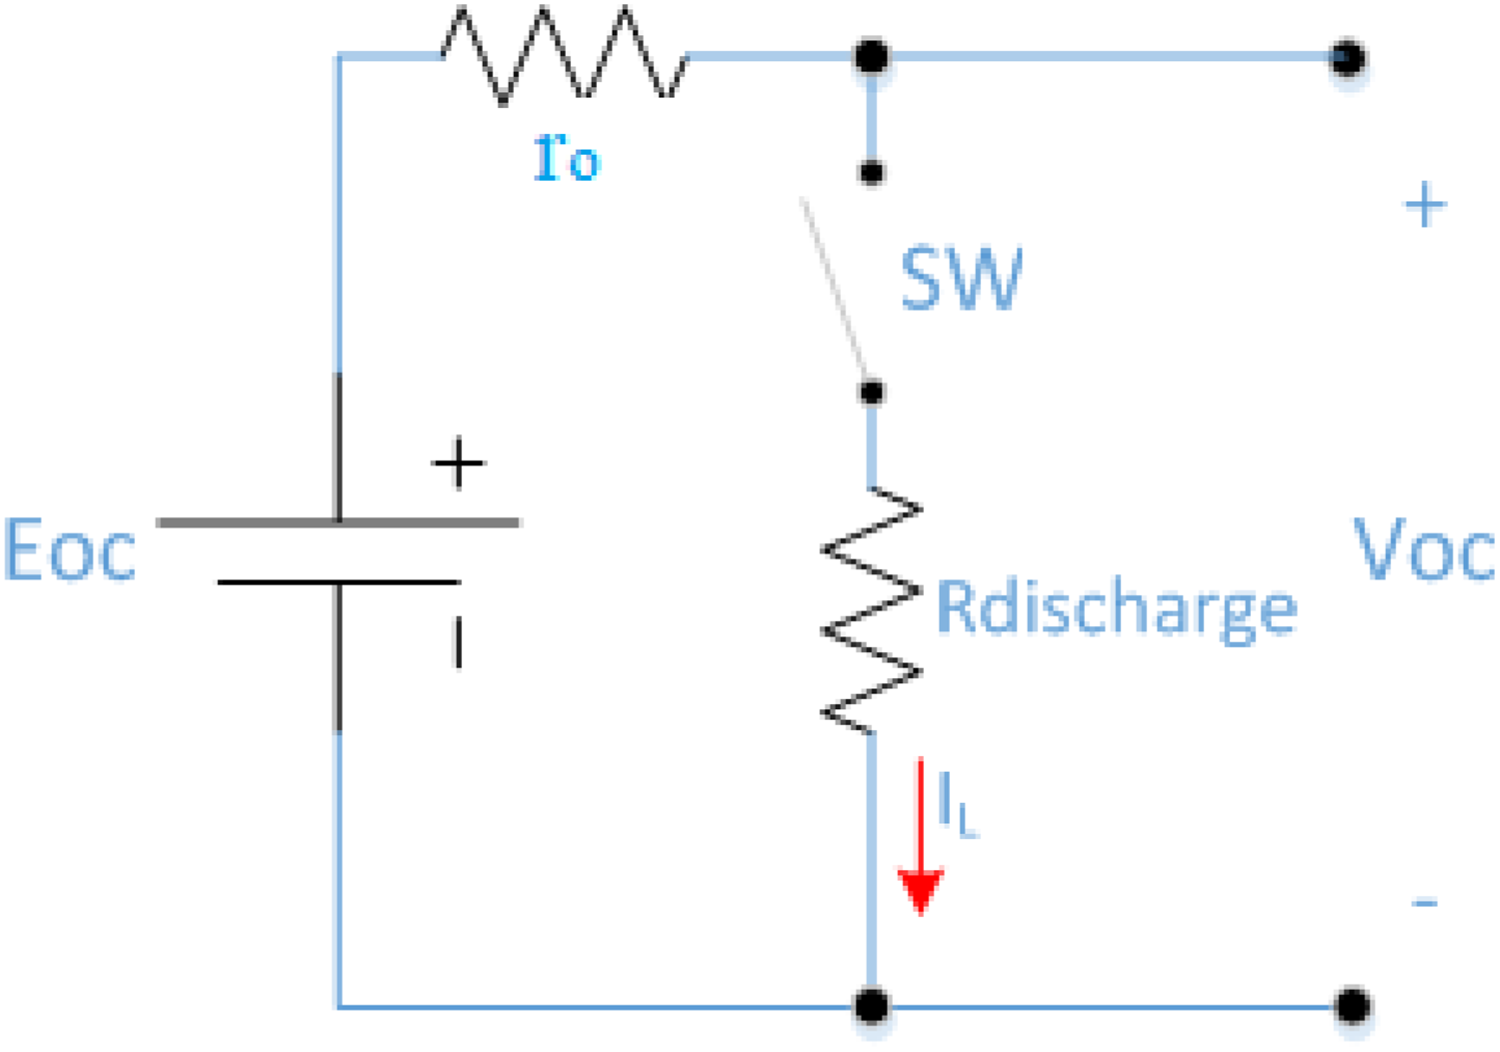
Simplified circuit of the direct current discharge measurement method.
For the measurement process, initially, the SW is opened, and thus E can be detected. Next, SW is closed, and then the detected voltage by DVC meter is obtained as

where
According to Figure 3, the two-pulse measurement method is proposed to measure the internal resistance (

where

Two-pulse measurement method.
The simplified internal resistance measurement circuit is shown in Figure 5. The SW2 is used to control the two-pulse discharging process, and SWd is used for choosing different types of batteries, where the

Simplified internal resistance measurement circuit.
Data acquisition interface
The data acquisition interface using the VB package, shown in Figure 6, is designed as a communication interface that allows users to setup and monitor the system working status, for example, selection of test cycles, real-time battery charging/discharging status and so on. It also works as a bridge between the microprocessor and database for data receiving and transmitting. The major functions are listed as follows.

Front panel of data acquisition interface.
Start/stop the system performance.
Set the number of cycle test.
Select communication port, data uploading interval, query, save and so on.
Show system status such as battery charging/discharging voltage, current, resistance, present cycle and so on.
Query the measurement historical record.
The data format for communication between the microprocessor and data acquisition interface is defined as Figure 6. 23 As shown in Figure 7, the measured data that is uploaded to the database occupies 14 bytes, where check flag: 1 byte, battery no.: 1 byte, battery type: 1 byte, battery status: 1 byte, battery voltage: 1 byte, battery current: 1 byte, charging/discharging identification flag: 1 byte, internal resistance transmission flag: 1 byte, internal resistance data (H&L): 4 bytes and present cycle num. (H&L): 2 bytes. On the other hand, the start signal contains start, check and detection cycles with 4 bytes, and stop signal has only 1 byte.

Format of communication. 23
Experimental results
The online testing status from data acquisition interface using is shown in Figure 8. The battery voltage, charging current, internal resistance, battery type, testing cycle and so on can be viewed instantly.

Information from data acquisition interface.
Discharging and charging curves
In Figure 9, the discharging process begins from the fully charged status so that the initial battery voltage to discharge is 4.34 V. The constant discharging current is set as 0.43 A. The discharge period takes 112 min to complete once the battery voltage is dropped down to 2.97 V. The small voltage variation during the discharging process indicates that the battery voltage still remains similar level to an initial one before its power is depleted, where it keeps a constant discharging current.

Online first-time battery discharging curve.
After the 50-times cycle test, the first-time discharging curves of the battery including voltage and current are compared with the 50th-time ones, as shown in Figure 10. Among them, the green and orange lines are the 50th-time discharging battery voltage and current, respectively. On the other hand, the blue and dark lines represent the discharging battery voltage and current at the first-time test, respectively. From the results, it is found that the discharging curves in either voltage or current are very close to each other between first-time and 50th-time. However, the 50th-time curves are a relatively shorter than the first-time ones. It implies that the battery life is reduced after a long-term cycle use.

The battery first-time and 50th-time discharging curves.
The first-time charging curves including voltage and current are shown in Figure 11. The charging process begins from 4.39 V and stops at 5.13 V, where its charging current remains at 0.71 A. The charging time takes about 65 min to complete. The small variation in voltage during the charging process reveals that the fully charged battery does not significantly increase the voltage level. Moreover, the battery capacity is confirmed very close to the size – 700 mAh provided by the manufactory.
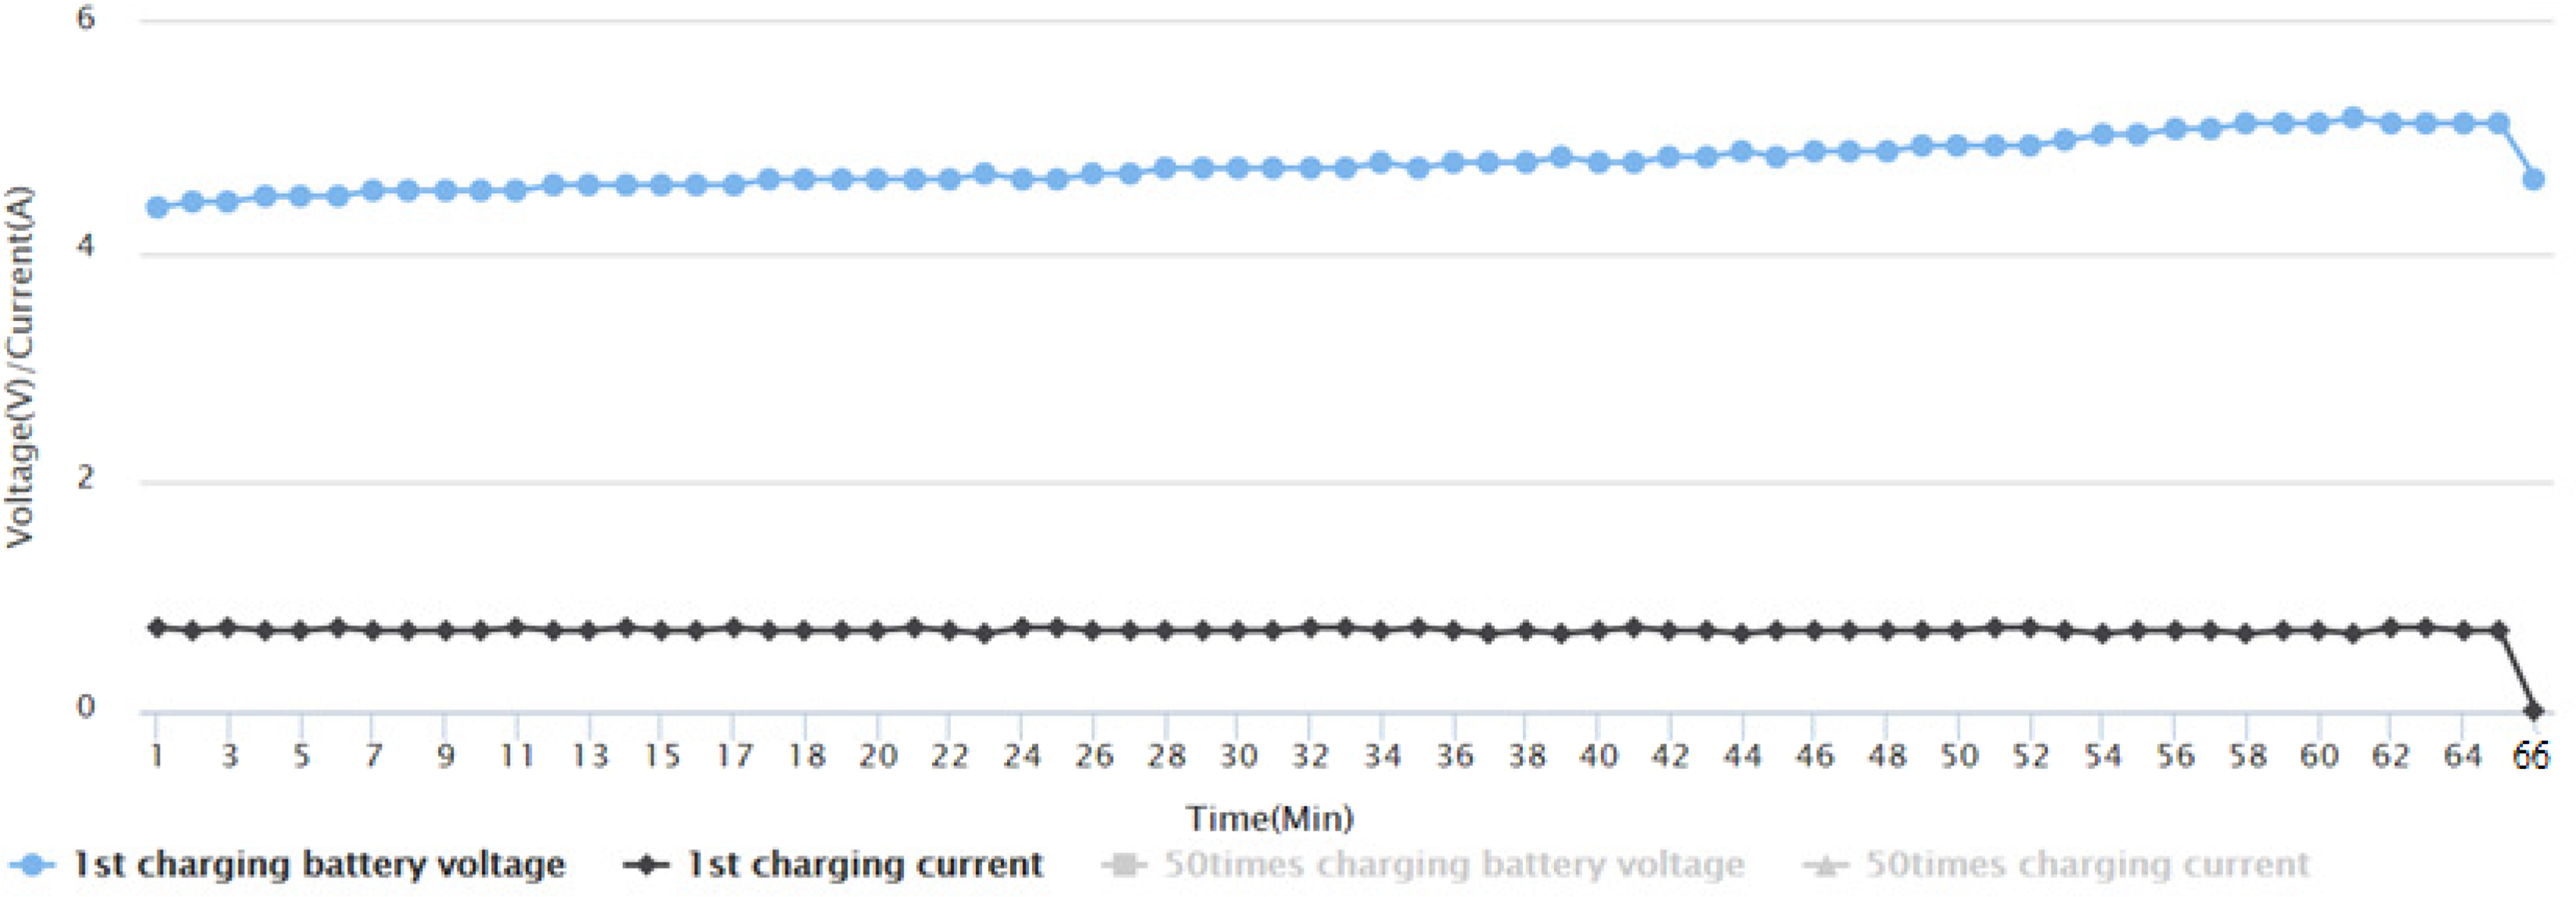
The battery first-time charging curve.
The comparison between the first-time and 50th-time charging curves of the battery is shown in Figure 12. Clearly, the 50th-time charging time is slightly reduced to 62 min. This result points out that the battery quality will get worse for long cycle use.

The battery first-time and 50th-time charging curves.
Internal resistance measurement
The internal resistance curve for a continuous 10-time cycle test is shown in Figure 13, and the results are presented in Table 1. It is found that the resistance value has a slight increase from 151.3

The internal resistance curve during 10-time cycle test.
Internal resistance test results.

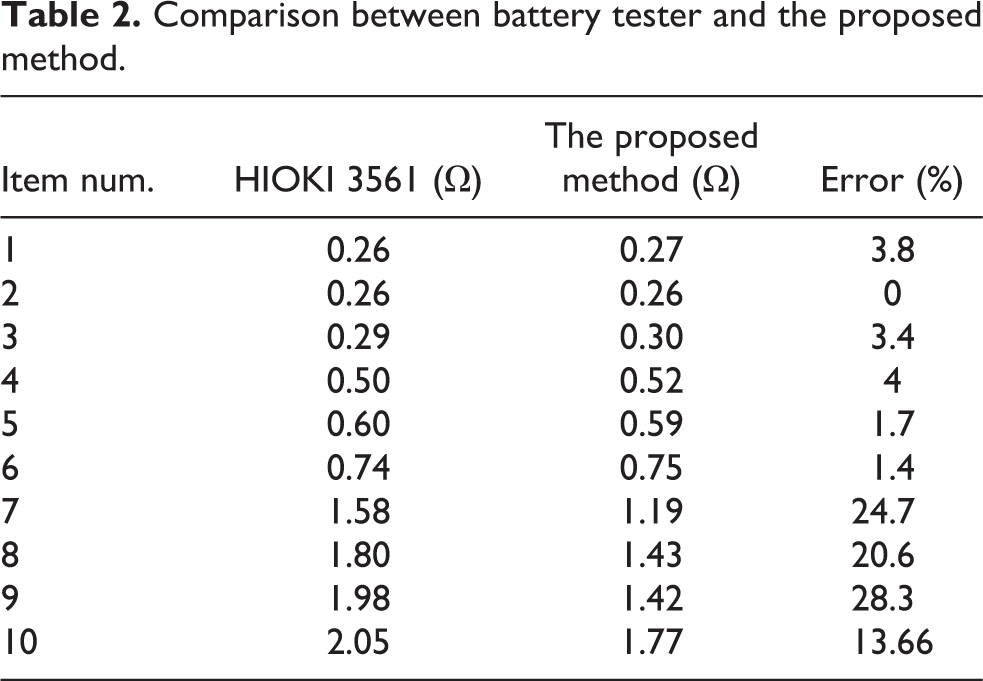
There are 10 batteries chosen with different health conditions for test. The battery tester (HIOKI 3561, HIOKI E.E. CORPORATION, Japan) was used to compare the results from the proposed two-pulse measurement method. The comparison is shown in Table 2. It can be seen that the error is very low within 5% when the internal resistance is below 1
Comparison between battery tester and the proposed method.
Conclusions
The measurement of battery quality is an important issue in the industry. Although commercial instruments are now available in the industry, there are still some essential limitations arising in such as online life cycle test and internal resistance measurement. For the proposed system, the microprocessor that connects with the cloud via the computer is used to implement the hardware circuits, including the charging/discharging and two-pulse resistance measurements. Therefore, all measured data can be transmitted to the database online when the measurement is on the process. On the other hand, the data acquisition interface combined with PHP web paves the way to control and monitor the system performance for real-time/historical battery quality tracking. The key contributions of this study can be concluded as (1) real-time battery life cycle and internal resistance tests. (2) The two-pulse measurement method for the internal resistance measurement presents a simple but accurate computational process. (3) Data acquisition interface can allow users to setup and monitor the system working status and transmit the measured data to the cloud (database) directly. (4) PHP web connected with the cloud provides a friendly interface to easily track online/historical measurement status/record. For potential applications, the proposed scheme can be applied to other types of batteries.
Footnotes
Declaration of conflicting interests
The author(s) declared no potential conflicts of interest with respect to the research, authorship, and/or publication of this article.
Funding
The author(s) received no financial support for the research, authorship, and/or publication of this article.