
Abstract
The aim of this work concentrates on utilizing powerful MATLAB programming (software version R2016a) to evaluate the impact of environmental variations of water case in the Mosul Dam reservoir and observed its receding impact on human life activities based on composite image processing applications. Furthermore, composite materials of different temporal remote sensing data increase powerfully the estimation of environmental variables of relevance to human health. Thus, temporal remote sensing data trends to enhance the efficiency of detecting receding water resources effect of human life impacts over different years. Two steps were implemented, which focuses on the estimation of changes in the water surface of the lake over 31 years. Preprocessing step concentrates on composite data materials from different Landsats to be more suitable for next step by utilizing color composite image processing and postprocessing step implemented the coastline detection of the reservoir and recognition of the quality of clear water in the lake due to the variation of water spectral reflectivity by hybrid classification method. The performance of this study is based on statistics measurements on the surface area of water level and overall accuracy, which indicated that hybrid classification method improves the capacity of integrating two classification methods, which gained highly identification water lake classes regarding its quality and more. The obtained results achieved the desired purpose of this study to investigate the high power application through implementing composite different image processing techniques with temporal satellite data to conversance the amount of water level changes in Mosul Dam reservoir and its impact on storage quantity over years.
Keywords
Introduction
The remote sensing technique is an indispensable principal resource, which plays a significant role in water resource studies that determine changes in the water surface over a period of time for different applications. 1 –4 Furthermore, the extraction and observation of the water body from the remote sensing data lead to easily and correctly determine various water resources monitoring, management, wetland classification, water/land cover segmentation, and coastline of lake detection. 5 –8 This work aims to determine the Mosul Dam reservoir water case and monitor the quality of water and its impact on human health due to environmental and climatic changes that had occurred in recent years, which caused decline of water quantity and increase in pollution and sedimentation, which has been tested over a 31-year period. Thus, using temporal remote sensing data is the best choice for this work to observe the changing over the mentioned period. 9 –13 Therefore, with this study, it can determine whether the water level in the Mosul Dam reservoir has markedly decreased through the time period specifically regarding to temporal changes, which planned by an appraisal of remote sensing data using digital image processing algorithms that gave essential steps for converting the remote sensing data into a functional concept. 14 This led to extracting the water body information accurately. 15 –19
Different water surface delineating methods were implemented to extract the water body information from remote sensing data. 20 –24 Thus, the thresholding method was performed using ENVI v. 4.8 and GIS software (V.10.7) to distinguish water bodies from other surrounding features, which depended on a single-band intensity that related to land/water. Furthermore, the authors 25 –29 mentioned that a single-band threshold is considered the easiest way to isolate a water body. However, it has difficulty in recognizing small water body areas, which is a disadvantage. 30
The current work examined that temporal changes in the reservoir were applied using various Landsat’s satellite data. 31 Consequently, successive image processing methods had applied to detect the level changes of water in the reservoir and extract the quality of water lake, which was impacted by climate change and accumulation of sediment allocation within the lake. 32 This is considered a significant factor for most studies interested in reservoirs flow and its water quality. 33 –39 In addition, through image processing techniques, it can distinguish the amount of clear water that benefits human life from the unclear, which is not suitable for human consumption. The objective was to set the case of whether the water surface area for Mosul Dam reservoir has decreased in its level and changed in its quality over the 31-year period since its establishment. 40 –42 The current study improves the efficiency of MATLAB software out of processing remote sensing data and gains the objective of this work with high accuracy regarding detecting the level quality of water reservoir over time. 43
Description of the study area
Mosul Dam reservoir is one of the biggest manmade lakes on the Tigris River in the north of Iraq around 60 km northwest of Mosul city from the borders of Syria and Turkey (Figure 1). The majority of its water comes from Turkey. Furthermore, it is located between latitude (36°36′N–36°50′N) and longitude (42°27′E–42°58′E). The surface area of the lake is approximately 385 km2. It has a storage capacity of about 11.11 km3 and is located 330 m above sea level, which is considered the maximum operational level for the water in Mosul Dam reservoir. 4,14

Location map for the study area.
The geology in the area of the lake consists of marls, gypsum, and alternating beds of limestone. Furthermore, the estimated watershed area which located on top of Mosul Dam is almost about 54,900 km2 and shared by Turkey, Syria, and Iraq.45 There were 10 seasonal valleys that take part water and sediment through rainfall seasons about less than 2%. These valleys are supplying the reservoir with seven from the eastern side and with three from the western side. 2 –46
Data and materials
The remote sensing data represented by satellite images are the most significant resource used for testing various land cover features. In this work, different remote sensing data for satellite Landsat images were chosen for various dates for the two seasons through the 31 years, specifically from 1986 to 2017, to locate changes, which occurred in the water surface of Mosul dam reservoir. Input satellite images were captured from the US Geological Survey website (USGS), 3 as mentioned in Table 1. It is worth noting the thermal bands’ spatial resolution used in Landsat was 120 × 120 m2, 60 × 60 m2, and 100 × 100 m2, respectively. However, their product resembled to 30 × 30 m2, thus obtaining an accurate estimation of the water area, according to the following site: https://landsat.usgs.gov/what-are-band-designations-landsat-satellites.
Description of satellites that used in the study.

Methodology
Data preprocessing
In this work, Landsat images taken on various dates were applied the temporal changes in the Mosul Dam lake water from the years (1986–2017), which were implemented on the MATLAB program as input data. A geometric correction was required as a first significant step for all the data due to instability of the platform that leads to the geometric distortion of the remote sensing data. To achieve the goals of the study quickly and efficiency, the lake’s water surface area and features located around it were cropped from the original satellite pictures to be a more stable input image. Appropriate band combinations were applied, then the color image enhancement method was implemented to enable a satisfactory conversion of the relief features in the RGB in clearly combined images, 4 as shown in Figure 2, that chose (7, 5, and 4) bands to represent bands combinations which converted into an RGB composite image. Using near-infrared (NIR), short-wave infrared (SWIR) 1, and SWIR2 bands, this showed a very distinct difference across aquatic and terrestrial land cover types and produced an accurate image of the lake.
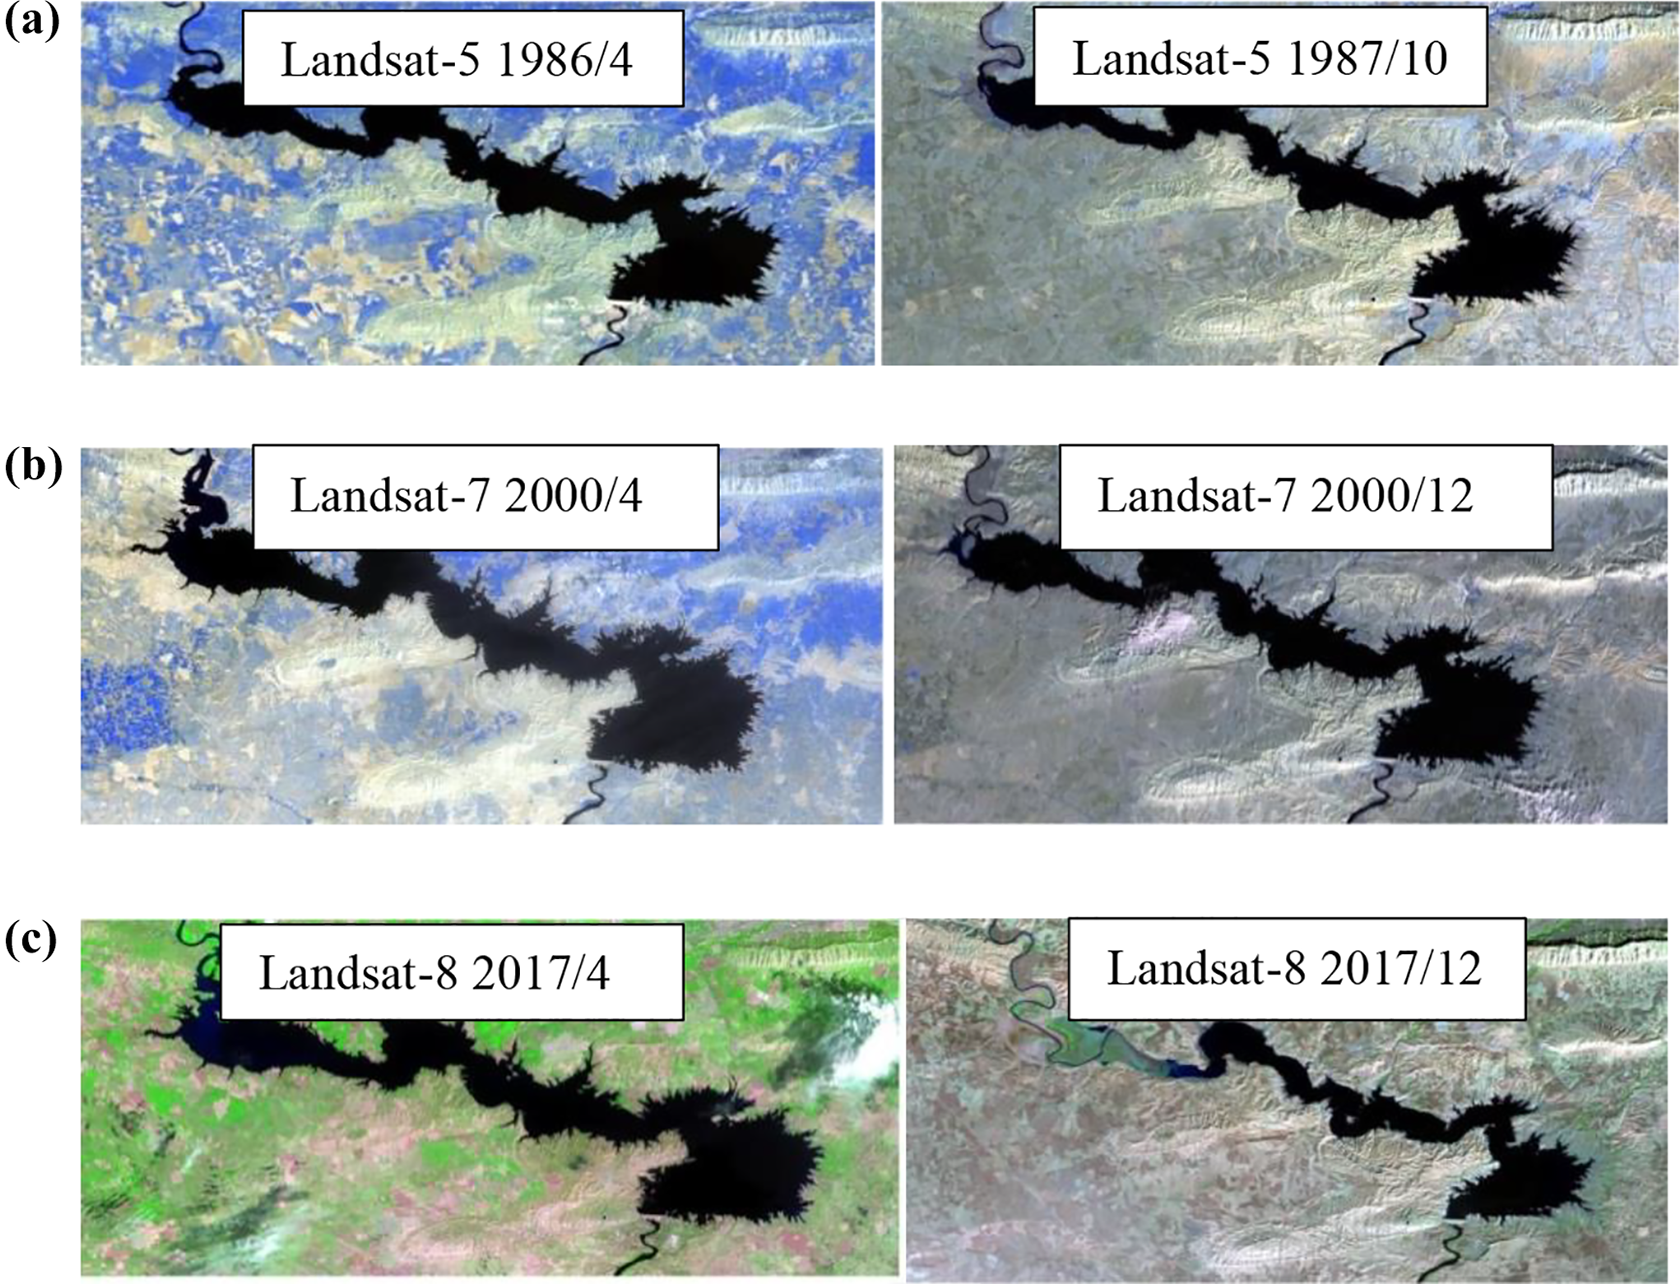
Enhancement of the composite color images from band combinations (7, 5, 4) for all input data in preprocessing step. (a) Landsat-5 April 1986 and Landsat-5 October 1987, (b) Landsat-7 April 2000 and Landsat-7 December 2000, and (c) Landsat-8 April 2017 and Landsat-8 December 2017.
Reservoir area extraction
A significant approach to coastline detection is to differentiate between water areas and land features. Most of the previous research followed either the normalized difference water method or digitization to extract the coastline. In this work, hybrid band combinations were performed to obtain the region body of the lake area. As shown in Figure 3, the hybrid band combinations were applied to isolate and segmented the region area (ROI) of the reservoir. The hybrid method is based on bands 7, 5, and 4 that already combined in the preprocessing step with the bands 1, 2, and 3 that utilized for the input data of October 1987, December 2000, and December 2017, sequentially. The bands 1, 6, and 3 are picked from input data in April of the years 1986, 2000, and 2017. Those band combinations had chosen separately due to variations in terms of capturing years, months, and the variation in characteristics of Landsat’s Thematic Mapper (TM), Enhanced Thematic Mapper (ETM), and Operational Land Imager (OLI). Furthermore, using thermal bands from both Landsat-5 and Landsat-7 via hybrid band combinations reinforced the accuracy of the results for extracting the water area (https://landsat.gsfc.nasa.gov/precious-resources-water-landsats-thermal-band/), because of their limitations detecting water compared with Landsat-8, which has a 12-bit radiometric resolution to achieve better detection.
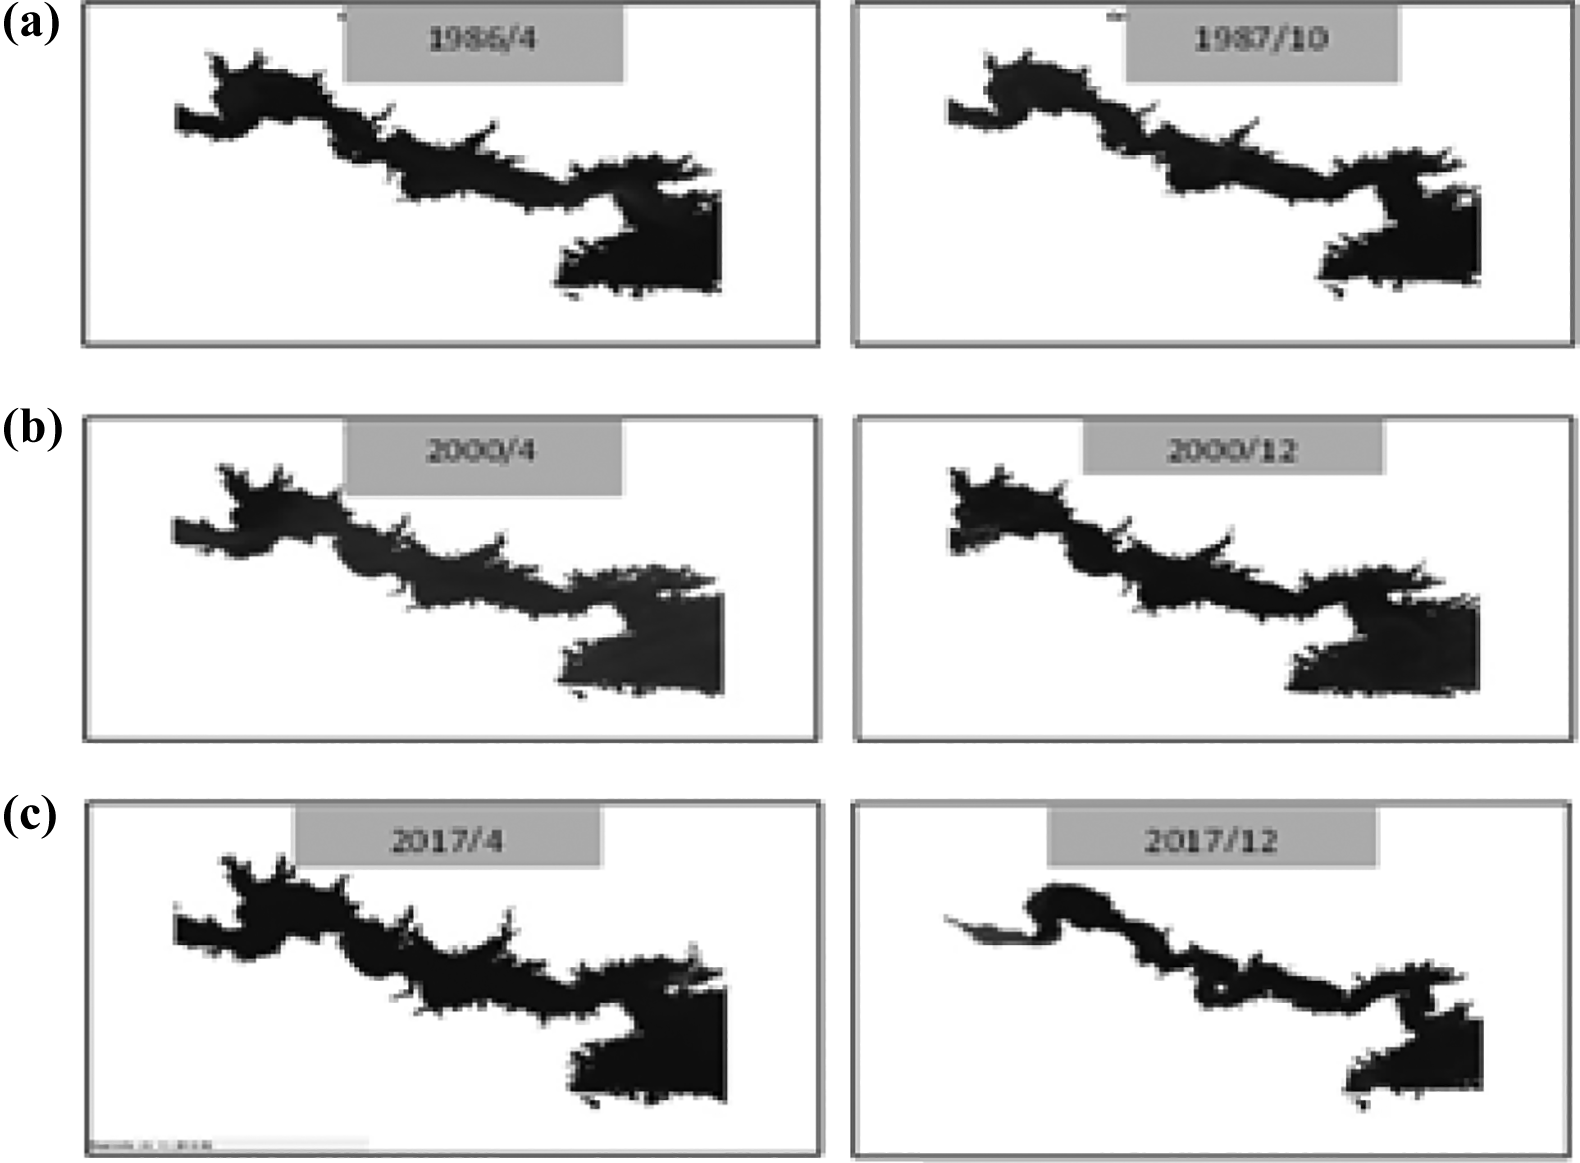
Water reservoir region area extraction for RGB color composite images after converting to gray. (a) April 1986 and October 1987, (b) April 2000 and December 2000, and (c) April 2017 and December 2017.
Water reservoir classification
The water reflectance changed over the years due to its composition and elevation level. Generally, clear water appears black or dark blue in the band combinations of the composite images. Moreover, variations in the color of the water, as shown in Figure 3 (dark black, light black, or near to gray and green color), caused different water reflectance due to sediment accumulation from the Tigris River’s water flow as it pours into the lake and also from climate change during rainy seasons. 5 Consequently, the purpose of this study was to detect the variation in the lake water quality, which has been associated with its water level elevation over the years. Note that the differences in constituent pixels of water reservoir were distinguished according to their reflectance, where there was a variation in the chromatic gradient of the water’s base color over the years, as observed in this work, black.
Hybrid classification
A hybrid clustering algorithm is proposed by Bekkerman and McCallum in 2005, which maximizes the common information between the clusters of multiple data types based on the representation of the interaction between each pair of data types. Combined classification algorithms were used in most land cover studies to improve the advantages of each selected algorithm. The combined algorithms were selected in this study to perform pixels variety from extracted lake area images, 6 as displayed in Figure 3, which contributed to classifying the lake’s water quality. This section clarified the integration of unsupervised and supervised algorithms that represented by k-means and support vector machine (SVM) sequentially to implement hybrid K-SVM process. Unsupervised classification or clustering process pixels were identified and gathered with regard to their same spectral reflectance and then collected into groups that labeled classes. Moreover, the algorithm in this study noticed that the identification of prior information about the variation of the pixels intensity in the lake water area can be recognized, despite the classification algorithm including collection features that have the same spectral characteristics groups of classes. The unsupervised k-means algorithm in this article used to identify the differences in pixels intensity in the lake water that consider as one class with regard to the land cover classification and separate that difference into categories of classes according to their centroid, which are represented by calculating the mean of each pixel in cluster, as shown in equation (1), and then collect each cluster regarding to measuring the closeness to the center by applying the Euclidean distance between pixels (equation (2)).
Consequently, three clusters were selected randomly (k = 3) in the implemented program trying to detect three labeling clusters due to lake water pixels intensity reflectivity.
7
However, some pixels were gathered into the cluster with misclassification problems. Thus, giving initial set of k mean by k = 3 data categories, x
1, x
2,…, xk
, where 
According to that each cluster, πi has the centroid Ci, which clarified as equation (2) 8,9 :

To assign the features to their own clusters, it should maximize the similarity between them. To do so, the objective function is needed between clusters that defined as in equation (3) 8 :

Notice that the k-means algorithm was integrated with the prior view of features in the field of study area and input image data, 10 which utilized in this section to candidate eight clusters to identify water quality categories.
Based on that, SVM is needed here for controlling the complexity of k-means clustering results to gain accurate classifying data due to its attractively processing RS data through finding the optimal hyperplane to distinguish between classes. 11 Consequently, the K-SVM hybrid process clarified in this section through combining the out clusters from unsupervised k-means to be a trained data for supervised SVM classifier process regarded to its ability to deal with high dimensional data that are suitable for classification process and its efficiency to correct the out results of k-means by applying the regularization process. 12 To do so, the out (3) classes from k-means are considered as input training data for SVM, which concentrated for finding the optimal hyperplane to separate between classes through considering binary classification case by (xi, yi), i = 1, 2,…, N and yi ∈ (−1, +1), where N is the number of training samples, yi = +1 for class ω1, and yi = −1 for class ω2 in case of which we have two classes and linearly separable, as expressed in the following equation (4) 8,13 :

According to that expression, finding the optimal hyperplane for two classes (ω1, ω2), respectively, will be when both values w and w
0 are evaluated in such a way that expressed the margin

In our methodology, we have more than two classes, so we need to classify SVM multiclass approach. Thus, the three classes had been extracted from k-means that are being the training samples S in SVM space. Based on that, one against all processes had implemented to separate the classes.
One against all, all the training input data are x1, y1,…, xk , yk , where xi € Rn , i = 1,…, k, and yi € (1,…, N), which is the class of xi , where the i’th class in SVM trained samples will be positive (+1) and all other samples will be negative(−1). 14 Through this approach, the classes had not been linearly separable, which are needed to maximize the margin between the classes and minimize the error for most classes that had similar signature. To do so, set of values added to equation (4) as the following equations (5) and (6) 13 :


Consequently, with this approach, we can control and extract all features that identified as bad classes through k-means and consider them as classes in SVM training data 15 ; this is indicated as an essential impact about the hybrid approach with multi-SVM related to reduce the dimension of the considering training data into binary processing. 13
In other words, classes were not completely isolated during statistical iterations.
16
Therefore, a supervised SVM has hybridized with k-means to correct the misleading information and implemented the regularization of the pixels in each class.
10
Furthermore, SVM has nonparametric properties, which maximizes the margin between classes,
11
all these properties draw the attention for applying SVM in remote sensing applications for classification through extracting an appropriate hyperplane between classes
17
through a basic binary classification approach to multi-SVM classes classifier form.
10
Thus, in this study, nonlinearly separable classes through multi-SVM classifier has applied due to rectifying the confusing information that obtained from three classes (K = 3) in k-means, which means dealing with more than two classes, to improve its property of dealing with separable data by testing a combination of some of the binary classifications, where remarked one in the current class, for instance, and other classes were zero.
10
According to that, the hyperplane forms for training the input data which called support vector, as described in equation (7),
17
have extended in such a manner that makes it effective in separating the boundaries of classes linearly by adding the parameters (C and 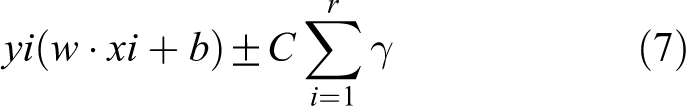

Hybrid classification results which obtained three classes had recognized in the water of lake and the covered area of classes in each year has measured by km2 and recorded different values over years. (a) April 1986 and October 1987, (b) April 2000 and December 2000, and (c) April 2017 and December 2017.
where
Performance functions
The fidelity criteria for this work were performed to assess the performance of the method. The statistical results, as presented in Table 3, are based on measuring the extracted area of the water reservoir for each year using equation (5),
18
regarding a number of pixels which segmented the water lake region areas for input years, whereas each pixel on the ground truth represented by a square of 30 × 30 m2, which is the spatial resolution on the Landsat.
19
In addition, another statistical calculation based on assessment is the overall accuracy, which was measured by considering the main diagonal of the confusion matrix that consists of pixels, which classified correctly using equation (7). In addition, two parameters were calculated with overall accuracy based on user’s accuracy, as mentioned in equation (11) and producer’s accuracy in equation (12)
20,21
:
Performance of evaluating the area for lake water classes (km2) over years.
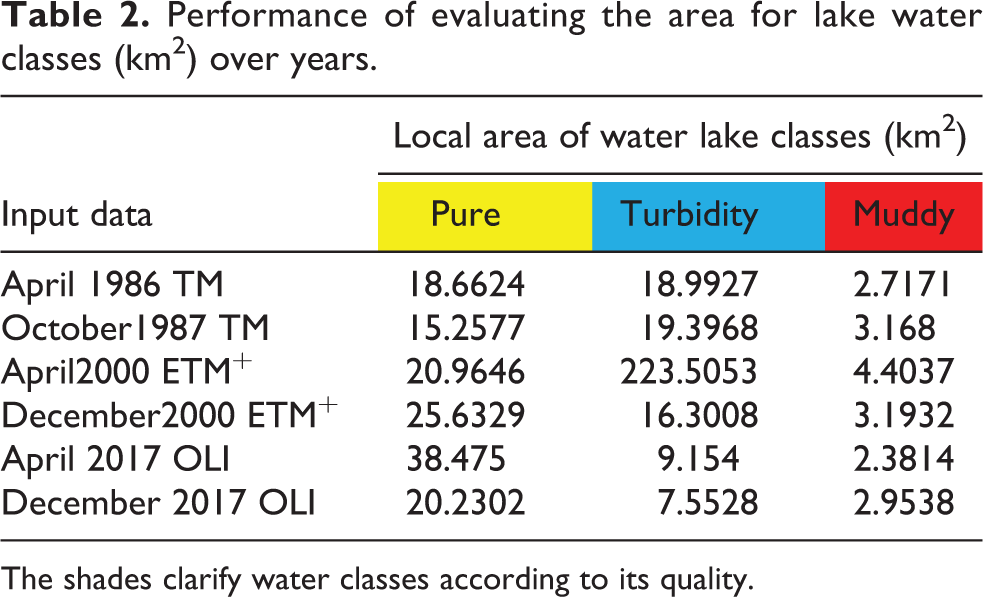
The shades clarify water classes according to its quality.
Assessment accuracy for classification process.

where RA represents pixels of the extracted region, TA represents pixels not related to water, and A represents scale factor of the squared area.


where
where Ua is the sum of classified pixels in each row and Di is the total number in the row.

where Pa is the sum of classified pixels in the column and
Discussion results and analysis
The current study utilized MATLAB2015 version software under operating system with an (Intel) 8 GB Ram, 2.40 GHz, and Windows 10 to implement the processing for desired temporal satellite data that acquired from Landsat-5 (TM), Landsat-7 (ETM+), and Landsat-8 (OLI) for the period of years between 1986 and 2017, which were used as input data listed in Table 1 to estimate the environmental changes that occurred in the water case of Mosul Dam reservoir as significant water resource for human life in Mosul city that depended on it. The output results improve the capacity of MATLAB coding compatible with remote sensing data and image processing applications.
We utilized different Landsat’s data to apply the methodology of this work, as shown in Figure 2, so they needed geometric correction as the first step for preprocessing, to collect more information that reflected from more wavelength ranges 22 and successive steps, which assist the input data more suitable in further processing. Then, Figure 3 shows the out results of the segmented region of water lake by utilizing hybrid multiband combination method that improved the capacity of the thermal band, 23 which based on processing the variation of the characteristics for input data due to their capturing date. Thus, for input data that captured in April, we utilized bands 1, 6, and 3, while for data that had been captured in October and December, we implemented the bands 1, 2, and 3. It is worth mentioning that we had used NIR and SWIR channels for the basic combined bands 7, 5, and 4 due to their ability to distinguish between lands and water 24 when they integrated and hybrid with the above combined bands.According to reflected water characteristics obtained through the remote sensing data, both the quality of the lake water and the changes over time can be observed by classifying the extracted lake water itself. 25 Therefore, we can notice from Figure 3 that dark black represented pure water and light black or near to green colors represented dirty water (turbidity and muddy). 24 Due to these differentiations in water state, color leads to implement hybrid classification technique and gained a high level of performance for mapping Mosul Lake into three classes.
Consequently, Figure 4 shows the results of a postprocessing step that are represented by applying a hybrid classification process, which implements k-means unsupervised and SVM supervised methods by detecting three classes according to K = 3 value, as shown in equations (1) and (2) to extract the actual. After we utilized three classes in k-means approach that considered as input training data for SVM process training through the hyperplane, as described in equation (3), therefore, multi-SVM classifier needed for this methodology, which explored the concept of binary SVM process to compose a multiclass classifier, as utilized in equation (4), where C and γ are the values that controlled of the multi-SVM training samples that regarded to k-means classes, in reverse C low value and large value of γ.
From Figure 5, we can clarify the graphical evaluation of out results. Thus, the rate of turbidity water was largest in the years 1986, 1987, and 2004. The amount of sediment was accumulated where the Tigris River flowed into the reservoir, while the average of the sedimentation decreased across the body of the Mosul Dam representing pure water, which appeared to be the greatest in April 2017. Furthermore, the areas around the lake reflected the water has high turbidity, named Muddy water class. Figure 5 shows the water classes and their area changes over the suggested years for input data. Comparing with the total region area of the lake of all, Figure 5 implemented in Excel software (version 10).

Evaluation graph for processing results.
Table 2 clarify the performance for the extracted area that occupied by water lake by calculating the number of pixels for segmented water object based on a spatial resolution of input satellite images for each pixel was equalized to 30 m (30 × 30), which means each pixel on satellite images represented by the square of 30 m2 in the field ground. 19,26 Accordingly, the segmented area of water surface lake has calibrated in km2 unit to calibrate the exact area in the ground.
From Table 3, we estimate the performance of classified images by obtaining the classification assessment accuracy based on calculating the overall accuracy, as utilized in equation (7), by dividing the sum of pixels that classified correctly and located in the main diagonal of confusion matrix by the total number of pixels. To be more accurate about the evaluation performance, the accuracy of the individual classes has been calculated as well, as shown in equation (8), which declares the extent of the classified images from the real ground. Also, equation (9) illustrates another calibration accuracy, which clarifies how well the extracted region has been classified correctly. 20
Conclusions
Temporal remote sensing data have a significant impact to evaluate the changes in the water state through a spectral and spatial resolution for various satellite data. In addition to, taking into consideration the environmental and climate changes that in turn negatively affect the quality of water through period of years, this in turn has a major impact on human health, as water is one of main sources of human life.
Different Landsat images were examined in this study in cooperation with digital image processing techniques that had been implemented to evaluate and analyzed the lake’s water state over years due to climate changes and decreasing the average of rainfall in its seasons. Furthermore, increase in the ambient temperature resulted in an increased evaporation rate of the water, specifically through the last 10 years of the chosen study period of the Mosul Dam water reservoir, the reservoir is considered an important resource for tourism, ecology, and electrical energy conservation for all Mosul city. Consequently, the current study depicts a dangerous current state for the Mosul Dam reservoir, which threatens the dryness of the lake, especially after the limited water flows from the Tigris River to the Iraqi territory. As a result, it is crucial to continue monitoring this region in additional studies to protect the water surface level in this area using efficient remote sensing data and image processing techniques for evaluating and monitoring changes, which leads to create a negative impact on all areas of human life from the irrigation of land located around the lake in addition to increasing moisture due to lack of water and thus increasing the erosion of water as a result of sediment leads to the lack of validity for reservoir to be a good resource for all human living water use and this has been observed in recent years.
In future work, it is necessary to extract the impact of variations in water level receding state and water quality over years for different features that surrounded Mosul Dam reservoir over the same period of 31 years as well.
Footnotes
Acknowledgments
The authors are grateful to the USGS for providing the input satellite data. In addition, the authors appreciate the assistance of the instructors in the remote sensing center of Mosul University, who are experts in this field for their helpful suggestions and cooperation. In addition, our gratitude to the members at Mosul Dam reservoir location field, who gave their advice and suggestions about the out results comparing with their data recorded through our visit to the ground location of the study area.
Data availability
The input data that we had used in this work were uploaded from the Geology survey website (USGS). Thus, all satellite type data were available free on this website. For this work, we uploaded the complete ZIP files that include all the bands and other characteristics for Landsat that we utilized considering Mosul city and Mosul Dam reservior as the study area. Regarding our study requirements, we utilized the bands that are suitable for water surface extraction process.
Declaration of conflicting interests
The author(s) declared no potential conflicts of interest with respect to the research, authorship, and/or publication of this article.
Funding
The author(s) received no financial support for the research, authorship, and/or publication of this article.