
Abstract
This study seeks to show how disaggregate profiles of welfare dimension of ‘inclusive growth’ could provide useful public policy insights in formulating development strategies. The disaggregate profile is defined with respect to regions and social groups. The study proposes concepts and illustrates with empirical estimates of measures of inclusion/exclusion and mainstreaming/marginalization for the six National Sample Survey (NSS) regions, and four social groups in rural and urban Maharashtra. The information base is the NSS estimates of household per capita consumer expenditure distribution for the two periods 2004–2005 and 2011–2012, respectively. The findings on outcomes show that the development experience of Maharashtra does not hold much promise on the inclusive growth front.
Introduction
The development experience of Maharashtra is a tale of diversity, regional imbalances and lopsided development strategies. The state is quite rich and diverse in terms of resource endowments, institutional features and income generation. It is well known for the Employment Guarantee Scheme (EGS) and similar welfare initiatives to promote the livelihood security of the rural poor. Despite such commendable performance in economic growth and welfare programmes, the state’s record in restricting the marginalization of the poor and facilitating their mainstreaming seems unsatisfactory. It is virtually the richest state in terms of per capita state domestic product (SDP) and one of the poorest in terms of incidence of poverty. It is one of the fastest growing states, experiencing slowest reduction in incidence of poverty. The districtwise profile of poverty is quite diverse, ranging from an estimate of less than 10 percent in Mumbai to more than 60 percent in Dhule (Government of Maharashtra, 2002, p. 51).
Most of the studies on Maharashtra, the human development reports, in particular, have focused on state- and, at best, district-level profiles of economic growth and human development dimensions. Possibly for the first time, an attempt has been made to provide a block-level profile by conducting National Sample Survey (NSS) of household consumer expenditure and other human development dimensions for the 356 blocks of Maharashtra during the 2014–2015 period. This particular survey would have proved critical in the identification of crucial issues and formulation of inclusive development strategies for Maharashtra. However, even after 6 years, the bock-level estimates of the human development parameters are not yet authenticated and published by the government, which makes a sad commentary on public policy pursuits and their appreciation of seriousness of the situation.
Hence, this study proposes methodological options to examine the welfare dimension of inclusive growth in terms of (a) the extent of inclusion/exclusion and (b) the extent of mainstreaming/marginalization. The dual narrative pertains to the regions and social groups in Maharashtra. The information base consists of unit record estimates, based on the central sample, of household consumption expenditure distribution for the years between 2004–2005 and 2011–2012. The objective is to examine the regional and social group profiles of consumption disparities to formulate a strategy for inclusion of the most deprived regions/social groups into the mainstream, which has been an avowed goal of successive development policy pursuits in Maharashtra. In order to obtain robust perspectives, this study defines order-based measures of inclusion/exclusion and mainstreaming/marginalization, and their estimates.
The article is organized as follows: the next section defines the concept and measures of inclusive growth for a homogeneous society, followed by concepts and measures of inclusion/exclusion and mainstreaming/marginalization for a plural society consisting of heterogeneous regions / social groups. The subsequent sections provide empirical illustrations for (a) six NSS regions by rural/urban sectors in Maharashtra and (b) four social groups in rural and urban Maharashtra. The final section concludes the article.
Concepts and Measures
Inclusive Growth: A Homogeneous Society
For a long time, ‘Inclusive Growth’ has been a policy agenda much advocated by international institutions like the United Nations Development Programme (UNDP) and the World Bank. National governments in most of the developing countries have accepted the agenda though even the advocates did not have any clarity in understanding and rigour in policy prescription. 1 The UNDP, which originally advocated a strategy for ‘Inclusive Growth’, could not define it; instead, it called it a ‘Million Dollar Question’ (UNDP, 2008). The World Bank (2013) defined it in terms of improved ability, opportunity and dignity, measured with reference to three domains, viz. markets, services and spaces. The Asian Development Bank (2014) too defined with a similar focus but had an enlarged list of 35 indicators. These latter two approaches have a secular perspective and hence involve both short-term and long-term dimensions.
However, from a policy formulation and monitoring perspective, there is a need for some comprehensive short-term conceptualization. Hence, we visualize inclusive growth as one which benefits the deprived in terms of both physical and human asset endowments and, hence, incapable of participating in/benefiting from the growth process. Such a process to be sustainable should encompass the following three dimensions of the economy: employment (participation in production), productivity (earning income) and welfare realization (consumption). Three summary measures that could capture the three dimensions are as follows: (a) elasticity of mean consumption with respect to mean income (η); (b) elasticity of median consumption with respect to mean consumption (ε); and (c) the ‘Inclusive Coefficient (ψ)’ (Suryanarayana, 2008). The first two measures provide a macro profile, while the third, a micro profile. Inclusive coefficient based on estimates of consumption distribution (ψ) would measure the proportion of bottom half of the population in the mainstream, where mainstream is measured as consumption interval exceeding 60 percent of the median. 2 This inclusive measure could be used for a homogeneous social group.
Inclusive Growth: A Heterogeneous Society
For a heterogeneous society, inclusive growth profiles would vary across population subgroups or social groups like the Scheduled Tribes (STs), the Scheduled Castes (SCs), the Other Backward Castes (OBCs) and the residual group ‘Others’ (Other Social Groups [OSGs]) as in India. 3 The elasticity measures could be defined for each of the subgroups to examine the macro profile of the inclusive growth process. As regards the micro profile, one may capture disparities in outcomes in terms of the extent of average inclusion/exclusion across social groups. For this purpose, one may distinguish between mainstream (all subgroups inclusive) median and subgroup-specific median. Consistent with this distinction, one could distinguish distributional inclusion with reference to (a) the mainstream (Inclusive Coefficient-Mainstream [IC-M]) and (b) the sub-stream (Inclusive Coefficient-Subgroup [IC-S]) inclusiveness (Suryanarayana, 2019). These two measures together will measure the extent of inclusion of the poorest of any given social group in the mainstream progress vis-à-vis its inherent potential.
Mainstreaming/Marginalization: Conceptual Outline 4
How do we define and measure inclusive growth outcomes of targeted policy interventions in a plural society characterized by regional/social stratification? When there are different regions/social groups, and welfare schemes exclusively meant for some select regions/social groups are pursued for their inclusion in the mainstream, inclusive growth for these beneficiary groups would involve two dimensions: (a) the extent of average inclusion, that is, the average progress realized by each region/social group vis-à-vis that of the country/society as a whole and (b) the extent of mainstreaming, that is, the extent to which the deprived in each of these regions/subgroups catch up with the better-off in the total (all regions/subgroups inclusive) population relative to their inherent potential as displayed in sub-streaming, that is, catching up with the better-off in their own region/subgroup.
Let us consider the case of social groups only. To address these dual objectives, we examine (a) average progress, absolute as well as relative, made by each social group and (b) mainstreaming and sub-streaming of the deprived in each of the social groups. This would call for defining measures of social group-specific as well as overall (total population) progress; this may be carried out in terms of order-based estimates of social-group-specific as well as overall (total population)-specific average, that is, median. In a similar way, one may measure inclusion of the poorest in each social group in its own progress as well as that of the mainstream by estimating the inclusion coefficients proposed in Equation (1) in endnote (2) with reference to sub-stream and mainstream medians, respectively. The measures corresponding to these two concepts and their implications are as follows.
Inclusion Versus Exclusion
Methodologically, verification of absolute progress would involve review of status/improvement in median income/consumption of the specific social group only. Assessment of inclusion or improvement relative to the mainstream would involve estimates of intergroup median disparities. For the latter, one may define the following measures:
Let μm denote mainstream (overall) median and μs social-group median. Disparity between the social group and the mainstream could be examined by comparing the median estimates. The following results would follow:
μs < αμm implies exclusion of the subgroup μs > αμm would imply inclusion
Let us define a measure of inclusion (δinter) as follows:

where 0 < α < 1; (α = 1.0 in this study)
δinter> 0 implies intergroup inclusion and δinter < 0 implies intergroup exclusion.
Mainstreaming Versus Marginalization
One may examine income/consumption of the bottom rungs of a given social group relative to (a) its own median (an aspect of the intra-group inclusive dimension, that is, inclusion in the subgroup progress [IC-subgroup]) as well as (b) the overall median (an aspect of the intergroup inclusive dimension, that is, inclusion in the mainstream progress [IC-mainstream]). These estimates may be worked out by defining the inclusive measure (ψ) with respect to sub-stream and mainstream medians, respectively. The former would give us a measure of participation of the bottom rungs of the social group concerned in its own (group-specific) progress (sub-streaming), while the latter, with respect to overall progress (mainstreaming).
It could so happen that there is some progress in terms of inclusion of the deprived section of a given social group in its own progress (median), but the progress is quite unsatisfactory when measured with reference to the community as a whole. Such differences in progress could be measured by taking the ratio (ω) of IC—mainstream to IC-Subgroup, which may be called Inclusive Coefficient in a Plural society (ICP). ICP would take the value ‘1’ when the extent of inclusion is the same with respect to both social group and overall median; a value less than 1 would imply that the extent of inclusion in the mainstream is less than the extent of inclusion in the social group’s own progress; it would be an indication of marginalization. If one could consider the extent of sub-streaming (IC-subgroup) as a measure of inherent inclusive potential of the social group under review, the extent of its mainstreaming/marginalization in the economy could be defined with reference to ICP (ω). A given social group is mainstreamed if ω > 1 and (ω − 1) would be >0, which would indicate the extent of mainstreaming of the social group in the economy. It is marginalized if its ω < 1 and the extent of marginalization is given by (ω − 1).
The estimators would be as follows:
Define inclusion coefficient (ψ) with respect to both mainstream median (ψm) and sub-stream median (ψs); their ratio ω would provide a measure of subgroup inclusion from its distributional perspective.
We have δintra > 0 implies mainstreaming and δintra< 0 implies marginalization.
Marginalization: First, Second and Third Degree
Marginalization: First Degree
When the distribution for a certain social group, say SGr, lies entirely to the left of the distribution corresponding to the rest of the population (RoP) such that the following conditions hold:
P99(SGr) < P1(SGrop) where P99(SGr) = 99th income/consumption percentile of the social group under review (SGr) and P1(SGrop) = 1st income/consumption percentile of the rest of the population (SGrop). δintra = (−)1
Marginalization: Second Degree
η < 0
ε < 0
δinter< 0
δintra< 0
That is, exclusion + marginalization.
Marginalization: Third Degree
η > 0
ε > 0
δinter > 0
δintra < 0
That is, inclusion + marginalization.
Empirical Illustration: Regional Profile
For lack of empirical information on NSS region-wise break-up of SDP estimates, this illustration is confined to verifying the extent of inclusion/exclusion and mainstreaming/marginalization. We would not make any attempt to classify regions by degree of marginalization.
Using the preceding framework, this section presents an empirical illustration for the NSS regions in rural and urban Maharashtra. The NSS regions are as follows:
Coastal region (Greater Mumbai, Suburban Mumbai, Thane, Raigad, Ratnagiri and Sindhudurg); Inland Western (Ahmednagar, Pune, Satara, Sangli, Solapur and Kolhapur); Inland Northern: (Nandurbar, Nashik, Dhule, Jalgaon); Inland Central (Aurangabad, Parbhani, Beed, Latur, Nanded, Osmanabad, Jalna and Hingoli); Inland Eastern (Buldhana, Akola, Washim, Amravati, Yavatmal, Wardha, Nagpur); and Eastern (Bhandara, Gadchiroli, Chandrapur and Gondia).
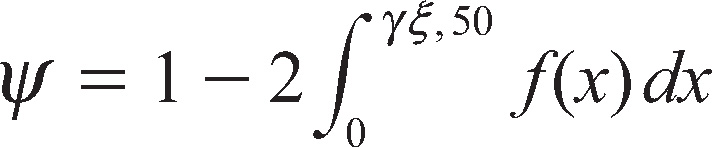
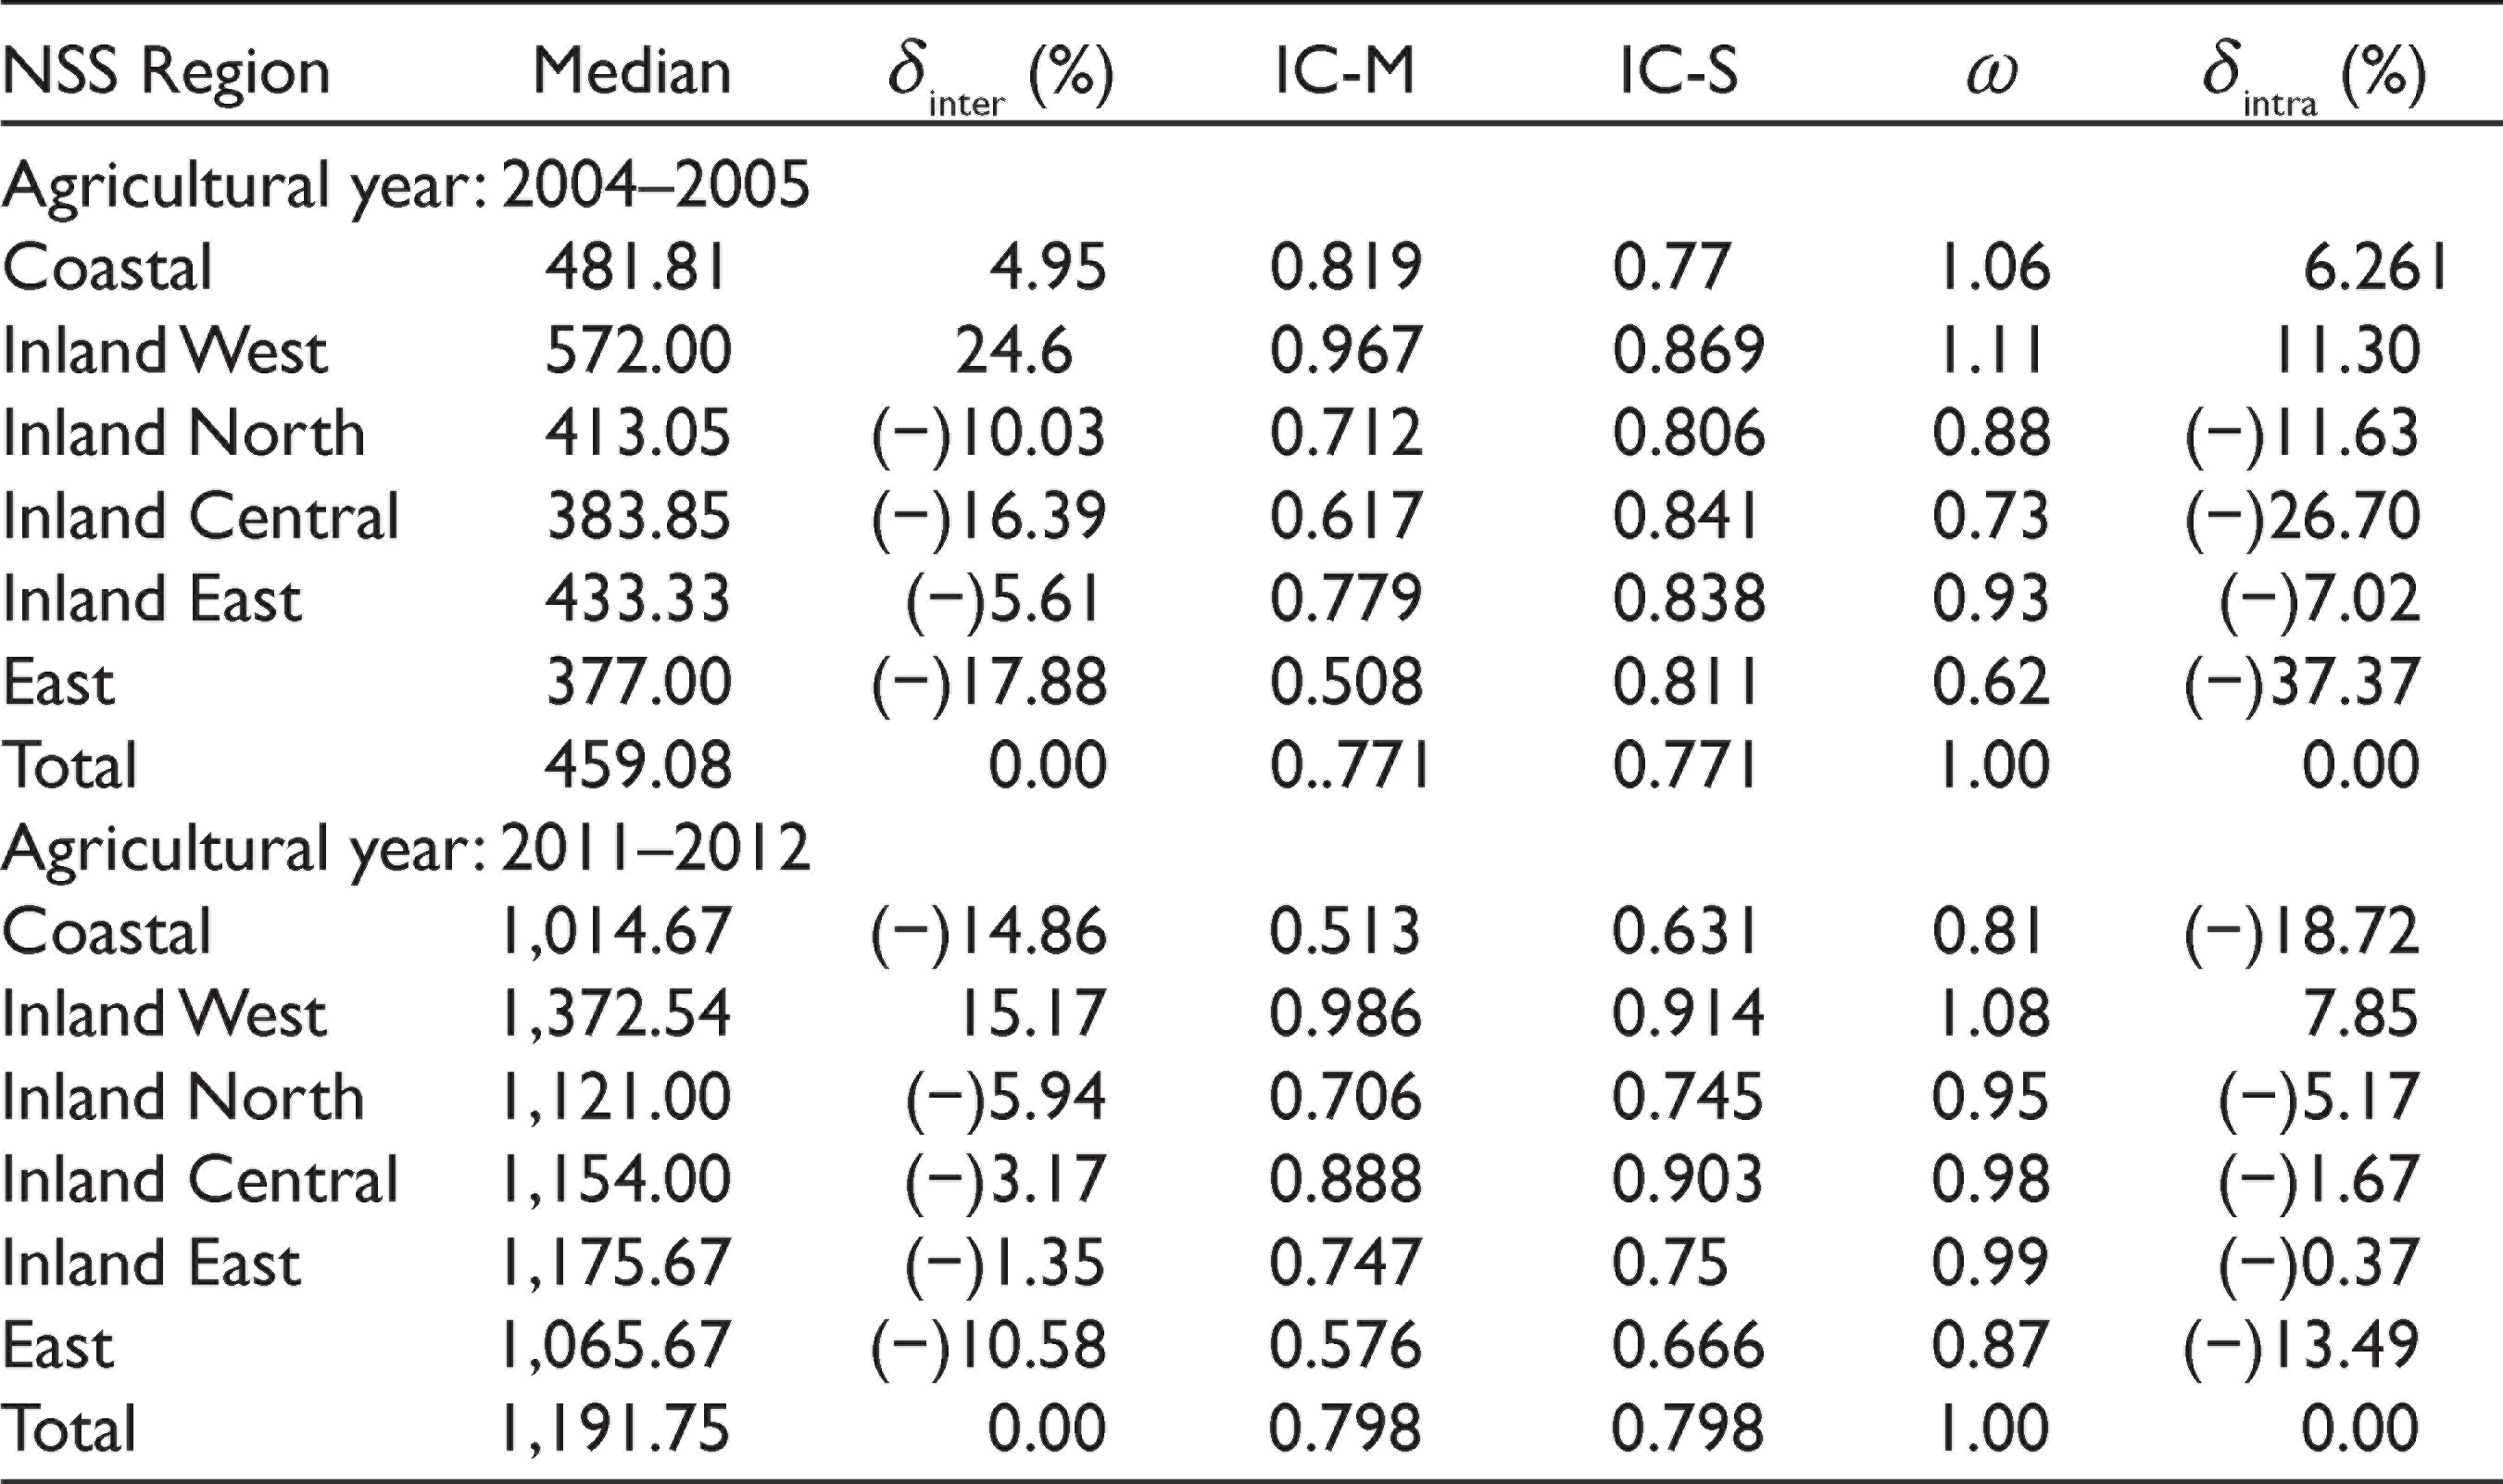
The profiles of the inclusion/exclusion and mainstreaming/marginalization of regions in rural/urban Maharashtra are as follows (Tables 1 and 2).
Regional Marginalization: Rural Maharashtra (2004–2005 and 2011–2012)
Regional Inclusion/Exclusion
Rural Maharashtra: Going by the estimates of median per capita consumption, only the Inland West stands out as the region included in the mainstream, though its extent had declined between the 2 years (Table 1). The profile of extent of inclusion/exclusion has changed between the 2 years. Coastal region was included in 2004–2005 but got excluded in 2011–2012. Remaining regions were excluded but experienced a reduction in the extent of exclusion between the 2 years under review.
Urban Maharashtra: The coastal region stood included in the mainstream for both the years though the extent of inclusion declined perceptibly from 26 percent to 15 percent (Table 2). The East experienced a worsening of its relative status with an increase in the extent of exclusion from 14 percent to 17 percent. All the remaining regions experienced some reduction in the extent of exclusion, which was substantial only for the Inland central (from 43 percent to 19 percent).
Regional Mainstreaming/Marginalization
Rural Maharashtra: The Inland West was mainstreamed in both the years; its extent declined between the 2 years (Table 1). The Coastal region was mainstreamed in 2004–2005 but got marginalized in 2011–2012. All the remaining regions were marginalized in both the years. Among them, the Inland Central and the East regions experienced substantial reduction, while the Inland North and the Inland East too experienced perceptible reduction in extent of marginalization.
Urban Maharashtra: The Coastal region was the only mainstreamed region in both the years but experienced a reduction in the extent in 2011–2012 (Table 2). The Inland West was marginalized without any perceptible change in status between the 2 years. The Inland North, the Inland Central and the Inland East experienced perceptible reduction in the extent of marginalization, while the East’s status got worsened substantially.
Regional Marginalization: Urban Maharashtra (2004–2005 and 2011–2012)
Empirical Illustration: Social Profile
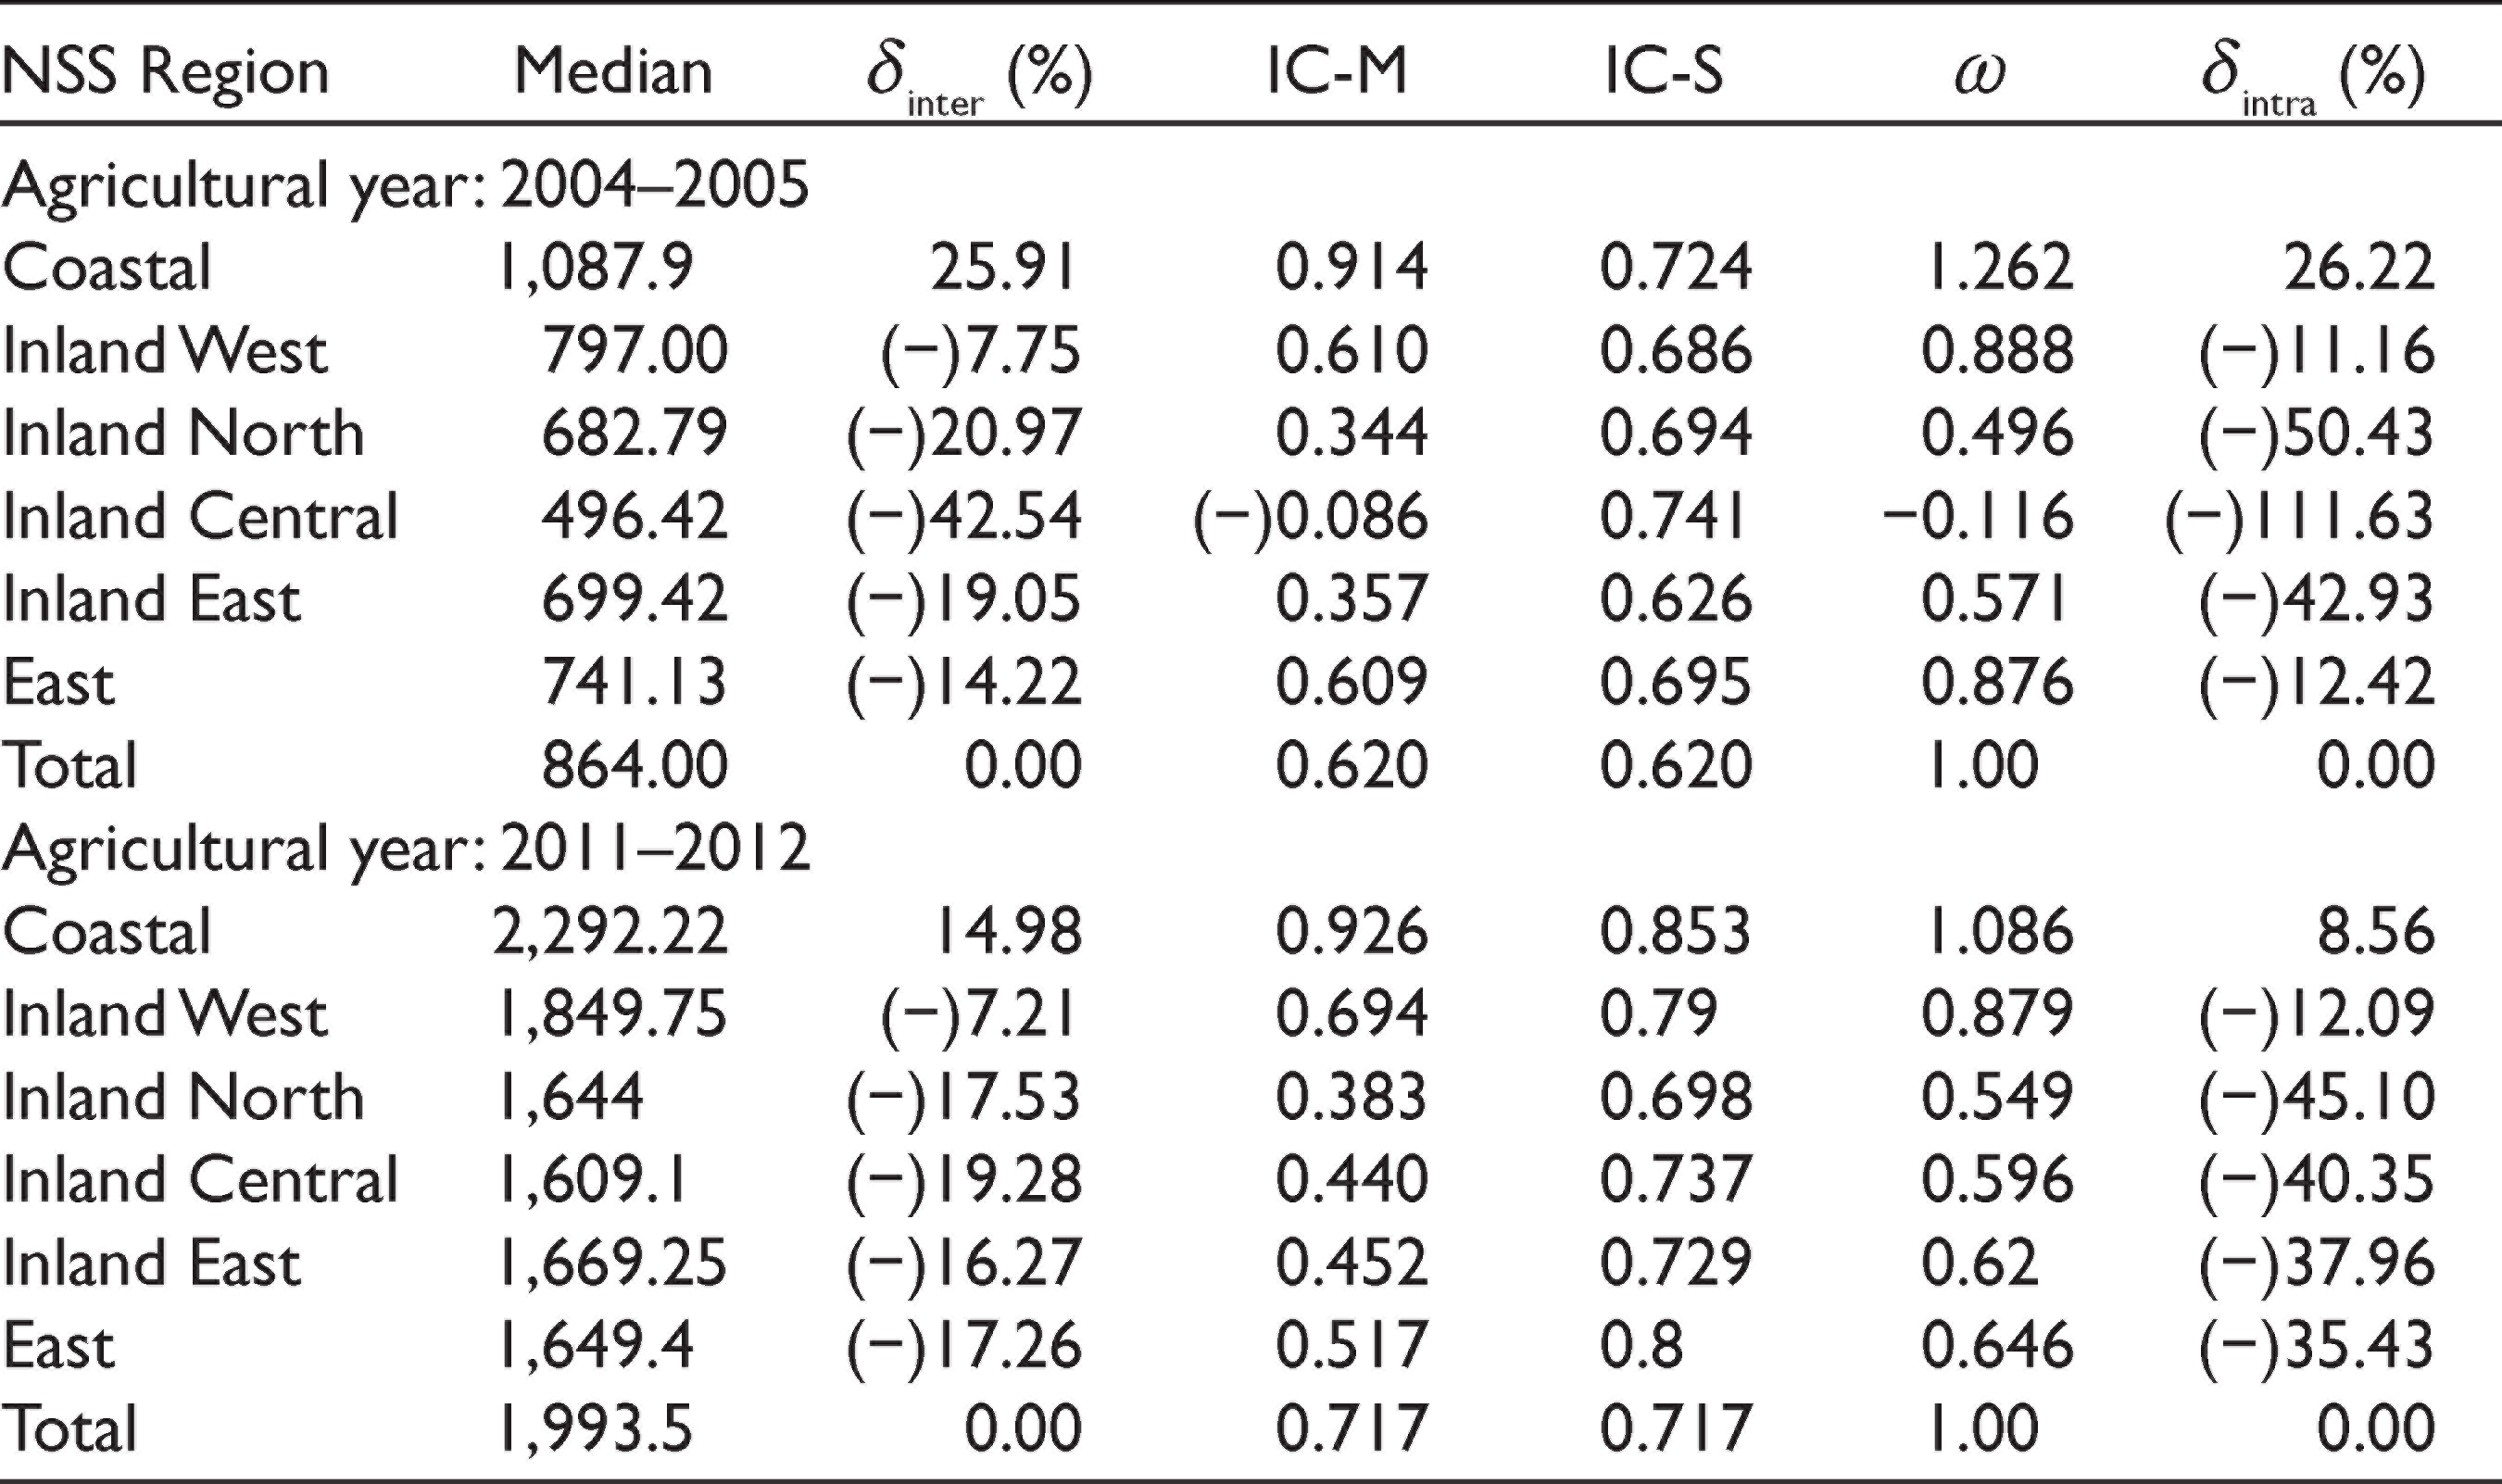
The profiles of the inclusion/exclusion and mainstreaming/marginalization of social groups in rural/urban Maharashtra are as follows (Tables 3 and 4).
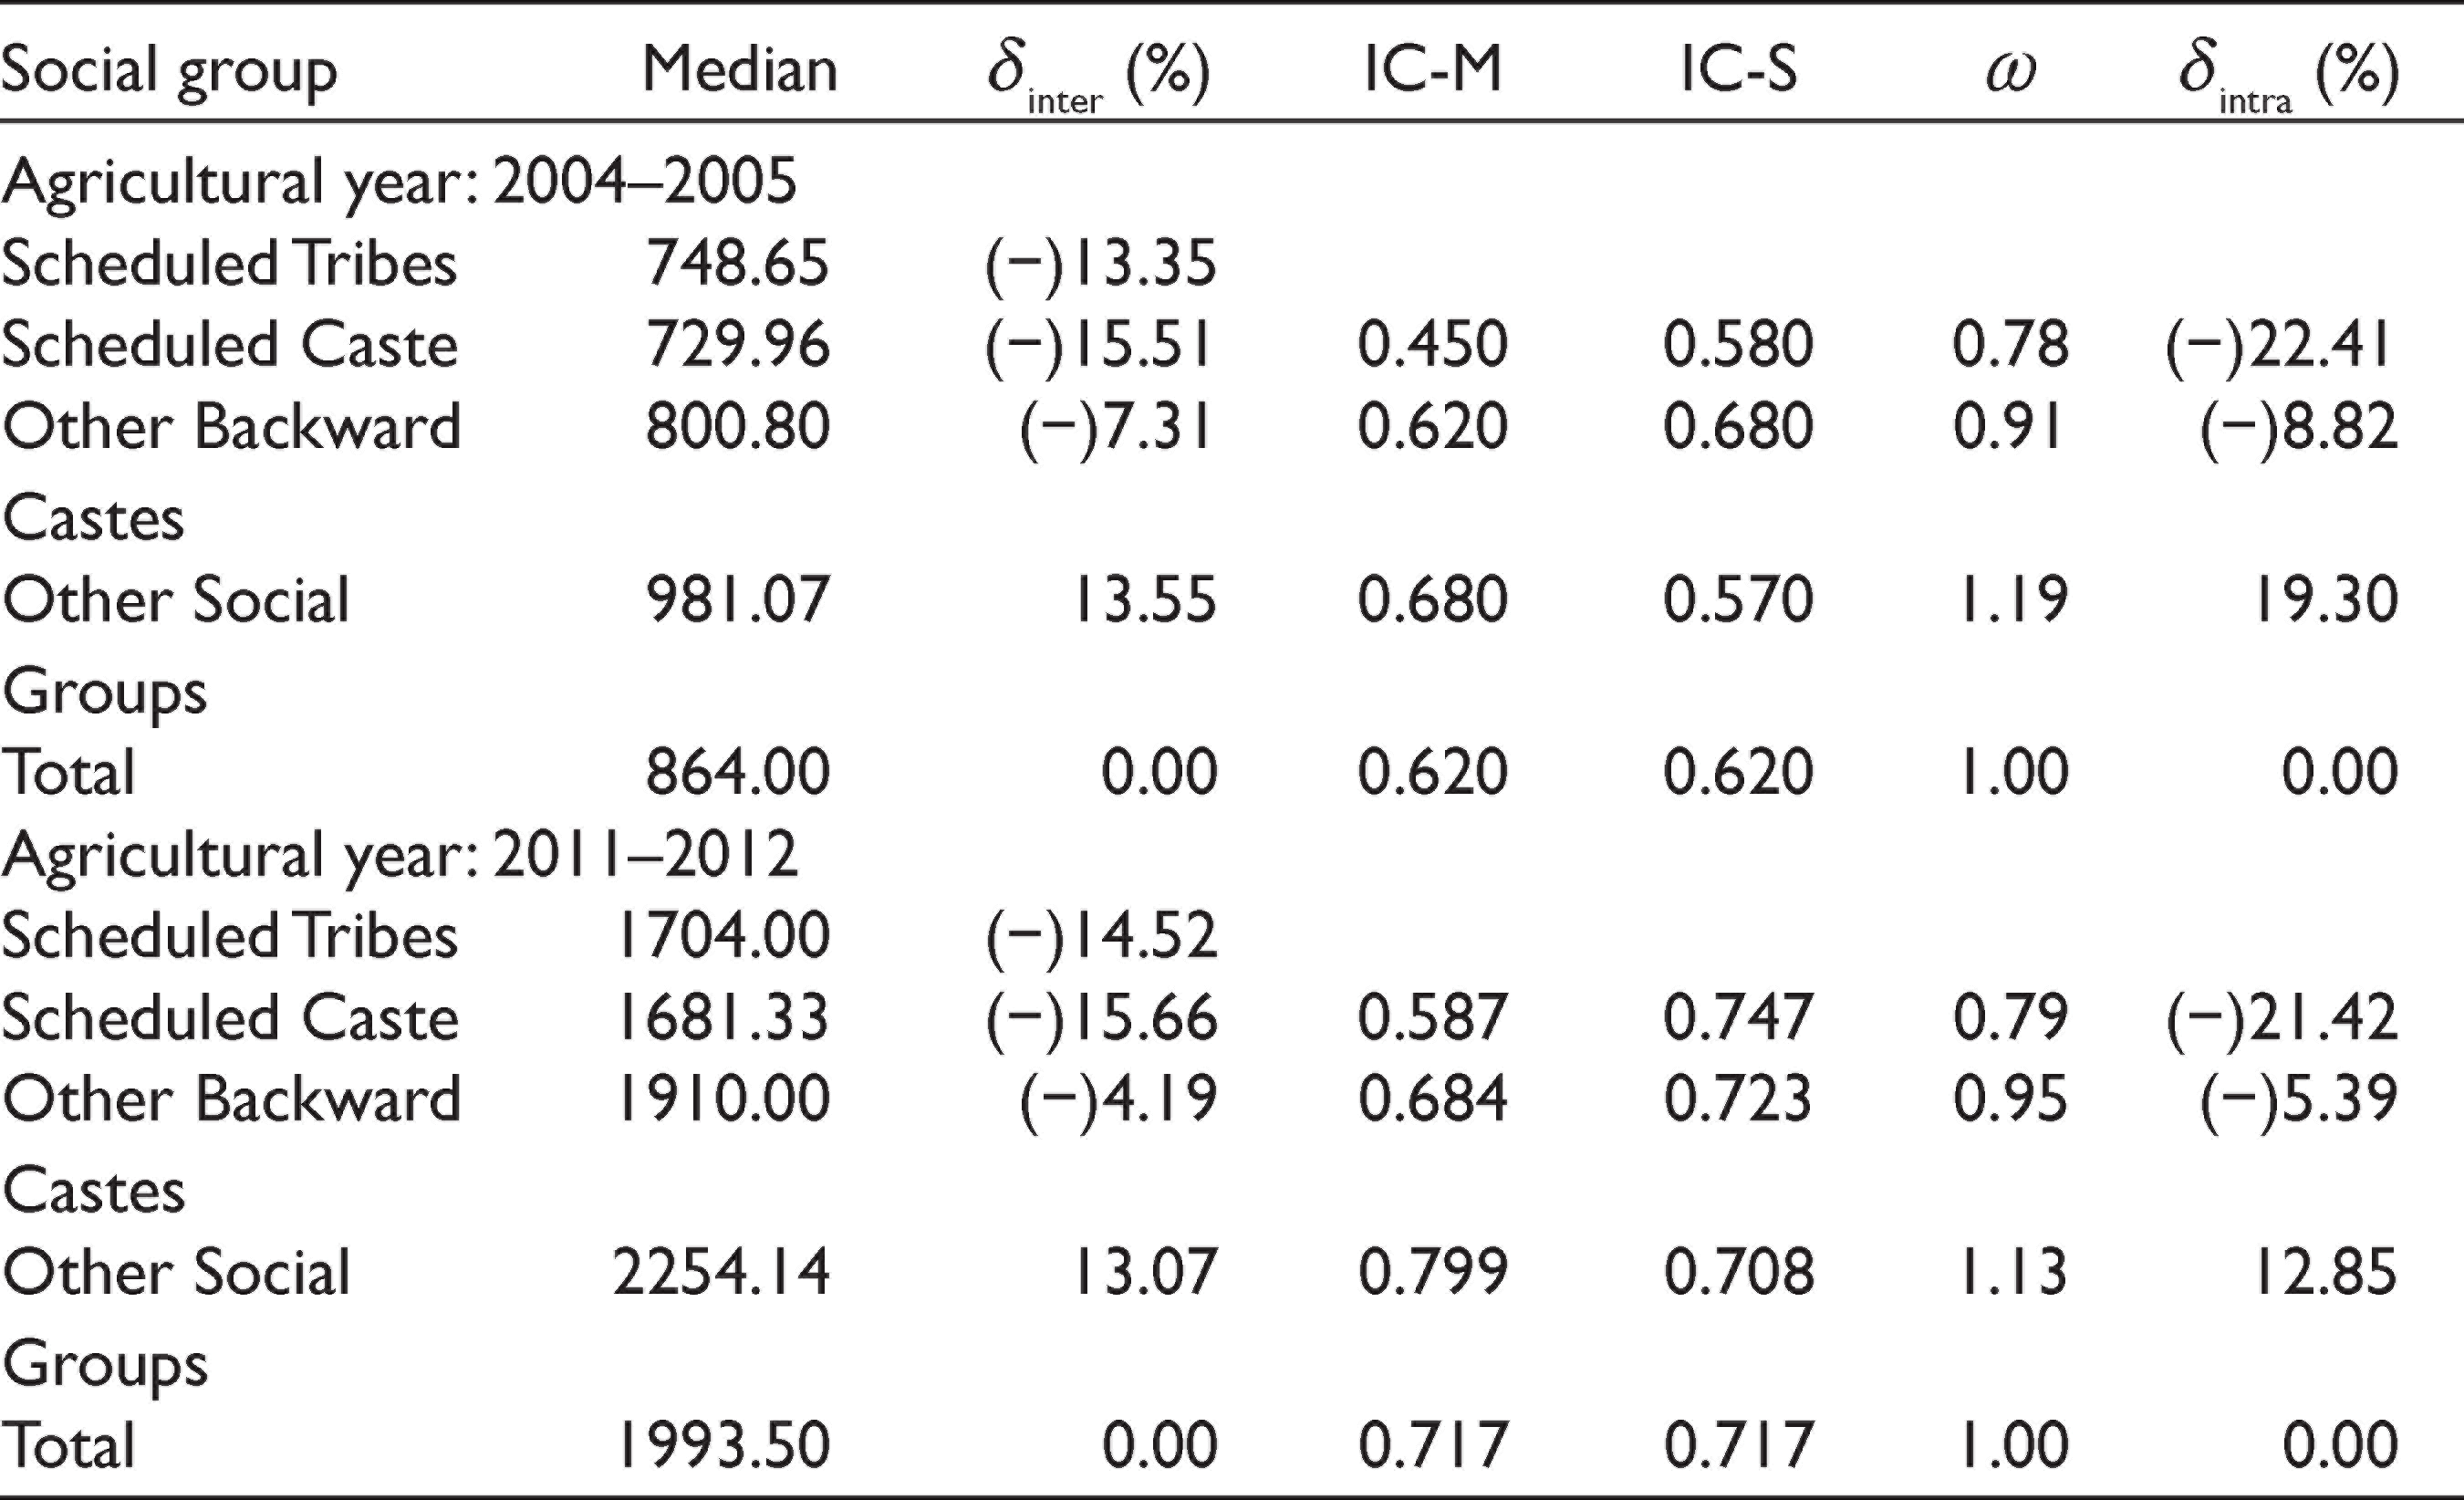
Social Marginalization: Rural Maharashtra (2004–2005 and 2011–2012)
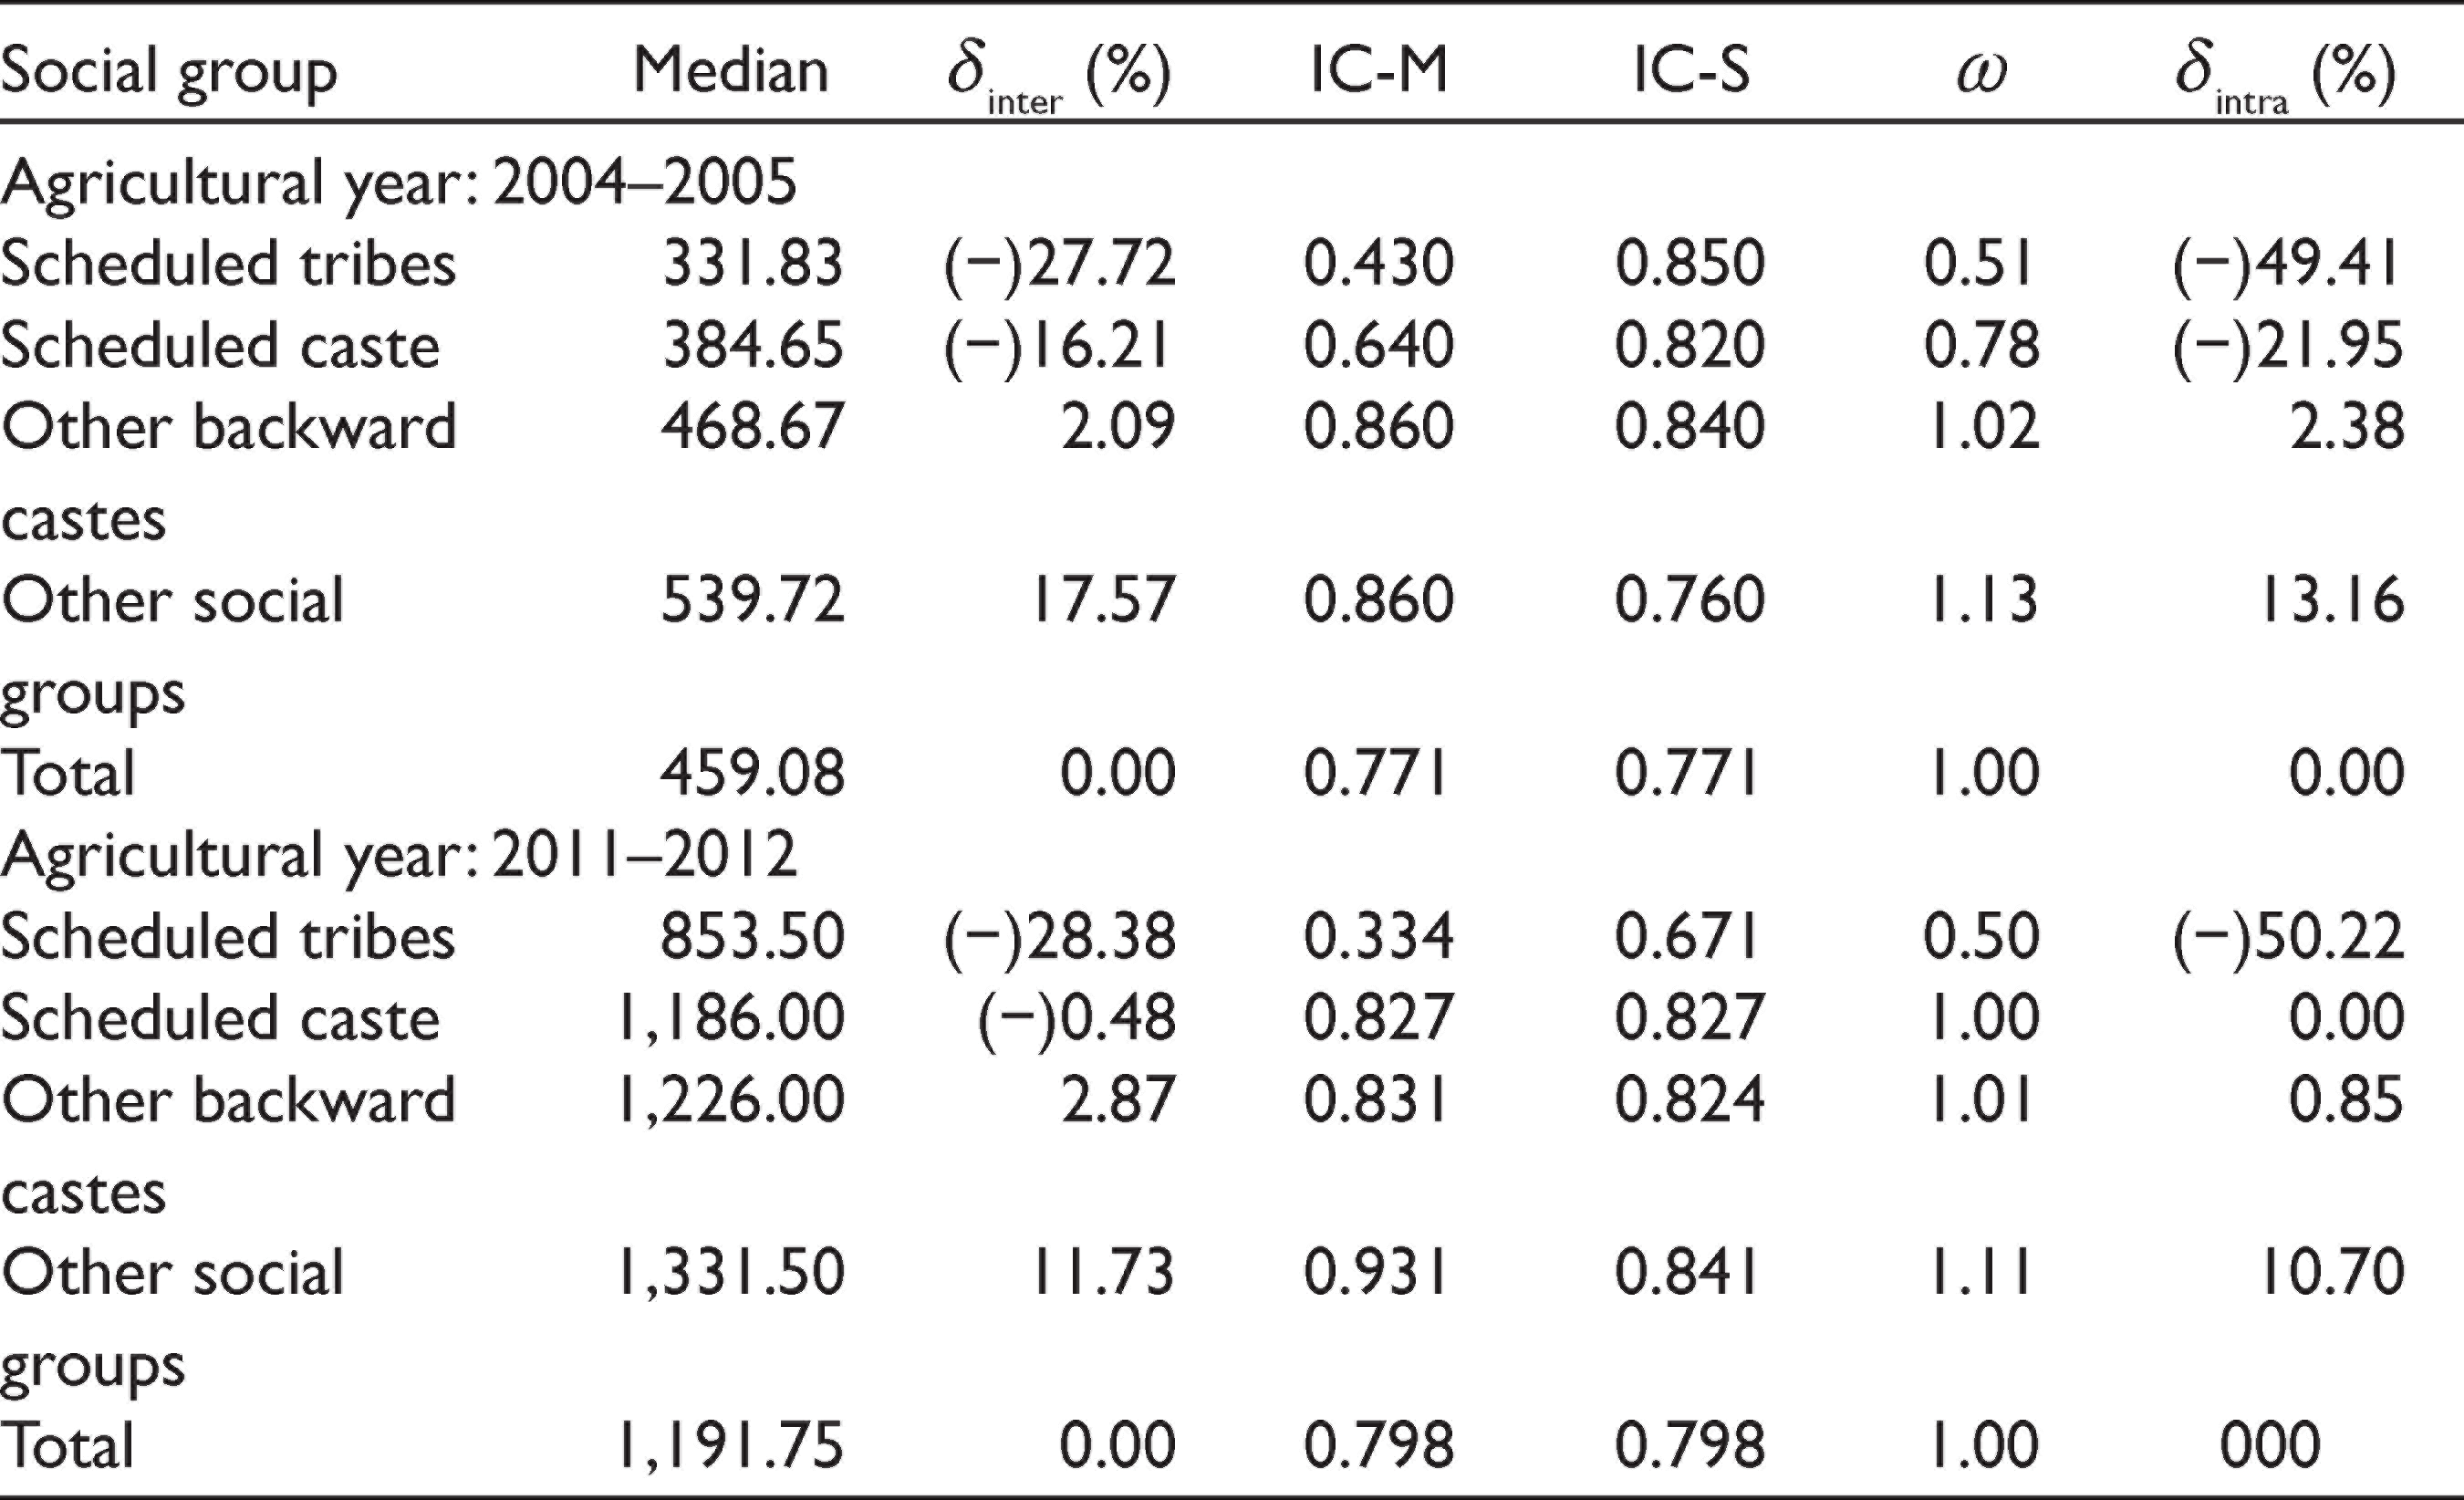
Social Marginalization: Urban Maharashtra (2004/2005 and 2011/2012)
Social Inclusion/Exclusion
Rural Maharashtra: The extent of social group inclusion in terms of median per capita consumer expenditure is the maximum for the OSGs; it was 18 percent in 2004–2005. The estimates for the STs, SCs and the OBCs for the same year are (−)28, (−)16 and 2 percent, respectively (Table 3). In other words, the STs and the SCs were excluded in the 2004–2005 period. The relative status improved only for the SCs in the 2011–2012 period. There was a perceptible reduction in the extent of inclusion of the OSGs from 18 percent to 12 percent between 2004–2005 and 2011–2012.
Urban Maharashtra: The extent of inclusion (14 percent) of the OSGs in the mainstream was the highest in 2004–2005; this was lower in urban Maharashtra than that in rural Maharashtra (Table 4). In comparison with the rural profile, the extent of exclusion experienced by the STs was much less (13 percent) and that by the OBCs perceptibly more (7 percent) in the same year. The profile of inclusion/exclusion across social groups in urban Maharashtra virtually remained the same between the 2 years.
Social Group Marginalization
Rural Maharashtra: The STs are the only one marginalized social group in the years under review, that too without any improvement in its extent (Table 3). The SCs were marginalized in 2004–2005 but managed to lose this status by 2011–2012. The OBCs were marginally mainstreamed, while the OSGs experienced a marginal reduction in the extent of mainstreaming.
Urban Maharashtra: The STs do not constitute a significant subset. Both the SCs and the OBCs were marginalized with only the OBCs experiencing perceptible reduction in its extent between the 2 years (Table 4). The OSGs, though mainstreamed one, experienced a reduction in its extent.
Summing Up
The preceding discussion provides a dual narrative on the outcomes of the pursuit of inclusive growth in Maharashtra. It proposes a concept and measure of ‘inclusive growth’ for a homogeneous society. As regards a plural society, it explores concepts and measures of inclusion/exclusion and mainstreaming/marginalization for a plural society. It illustrates with estimates of regional and social profiles of one important dimension of inclusive growth, that is, consumption status in rural and urban Maharashtra. It highlights their usefulness in designing strategies for inclusive growth. To begin with, profiles of disparities based on estimates of household per capita consumer expenditure across NSS regions in Maharashtra bring out that (a) with the exception of Inland West, all the other regions were marginalized in rural Maharashtra, and (b) barring the coastal region, all other regions were marginalized in urban Maharashtra. In other words, barring a single region in the rural/urban sector, the entire state is marginalized. This is a sad commentary on public policy pursuit of inclusive growth in Maharashtra. From a policy formulation perspective, such an aggregate profile would be of little help for targeted interventions for inclusive growth. Identification of towns/villages/blocks for targeted intervention to realize economic growth would call for profiles of mainstreaming/marginalization at a greater level of disaggregation. Thus, the level and extent of disaggregation required for specification of the problem of disparities in development would depend upon policy perspective under review. In a similar vein, the development profile of social groups appears complex. The critical vulnerable groups like the STs and the SCs have much to realize in improving their welfare status relative to the mainstream. Even the OBCs need policy attention with respect to mainstreaming on the welfare front. In sum, the growth profile of Maharashtra has a long way to go in terms of spread of development across regions and percolation of benefits to the vulnerable groups of the society for their mainstreaming.
Footnotes
Declaration of Conflicting Interests
The author declared no potential conflicts of interest with respect to the research, authorship and/or publication of this article.
Funding
The author received no financial support for the research, authorship and/or publication of this article.