
Abstract
The auditory brainstem response (ABR) is important for both clinical and basic auditory research. It is a non-invasive measure of hearing function with millisecond-level precision. The ABR can not only measure the synchrony, speed, and efficacy of auditory physiology but also detect different modalities of hearing pathology and hearing loss. ABRs are easily acquired in vertebrate animal models like reptiles, birds, and mammals, and complement existing molecular, developmental, and systems-level research. One such model system is the chicken; an excellent animal for studying auditory development, structure, and function. However, the ABR for chickens was last reported nearly 4 decades ago. The current study examines how decades of ABR characterization in other animal species support findings from the chicken ABR. We replicated and expanded on previous research using 43 chicken hatchlings 1- and 2-day post-hatch. We report that click-evoked chicken ABRs presented with a peak waveform morphology, amplitude, and latency like previous avian studies. Tone-evoked ABRs were found for frequencies from 250 to 4000 Hertz (Hz) and exhibited a range of best sensitivity between 750 and 2000 Hz. Objective click-evoked and tone-evoked ABR thresholds were comparable to subjective thresholds. With these revisited measurements, the chicken ABR still proves to be an excellent example of precocious avian development that complements decades of molecular, neuronal, and systems-level research in the same model organism.
Significance Statement
The auditory brainstem response (ABR) is a valuable assay for evaluating hearing function in clinical and research settings. This study replicates previous findings published over 4 decades ago for the chicken ABR. Additional characterizations include novel findings regarding frequency specificity, threshold sensitivity, and comparisons of data from other species, highlighting the utility of the ABR for examining vertebrate auditory function.
Introduction
The auditory brainstem response (ABR) is an evoked neural potential that has been used as a measure of sub-cortical auditory function in vertebrates for decades. 1 In humans, the ABR yields up to 7 identifiable waveforms conventionally labeled by Roman numerals I-VII. The waveform structure of the ABR (ie, morphology) represents the synchronized electrical activity of auditory structures in response to sound across numerous species: including mammals, birds, reptiles, and aquatic vertebrates.2,3
ABR morphology analysis provides valuable information about the functional status of the lower auditory pathway. The latency (time of occurrence in milliseconds) and amplitude (peak-to-trough size in microvolts) of evoked electrical activity indicate important aspects of neural function, including auditory nerve/brainstem integrity and hearing sensitivity. Deficits in the auditory system result in absent, reduced, prolonged, or abnormal ABR latencies and amplitudes.4-6 The ABR for human and animal models can be evaluated with similar stimuli, permitting consistent evaluation of auditory function across vertebrates. 2 For example, a short-duration click stimulus evokes activity in neurons with broad frequency (ie, tonotopic) tuning in the lower auditory pathway and recruits robust neural synchrony. Whereas tone-burst stimuli of varying frequencies evaluate hearing sensitivity at discrete tonotopic regions of the auditory system.
Despite the abundance of knowledge of ABR properties in vertebrates, the previous characterization of the chicken ABR was last reported 4 decades ago. 7 Since then, ABR measurements have been made in numerous avian species, including the budgerigar, 8 woodpecker, 9 diving birds, 3 screech owl, 10 saw-whet owl, 11 barn owl,12,13 bald eagle, and red-tailed hawk. 14 While these examples cover a wide range of avian species, the chicken, specifically, is a powerful research model for sensory development and hearing function such that a revisit of the ABR is warranted.
Avian auditory development can be classified from altricial to precocious traits. Altricial birds hatch with many senses still emerging but develop specialized skills like vocal learning and/or high cognitive ability. 15 Precocious birds, like chickens, have near-mature sensory perception at late embryonic stages.16-18 The chicken’s ABR can be detected the same day as it hatches, forgoing potential influences from environmental factors.19,20 In contrast, an altricial bird—like the barn owl—does not show a consistent and reliable ABR until 4 days post hatch. 12 As such, the chicken’s precocious development allows for comparison of hatchling hearing sensitivity to the known audiogram and sound localization abilities of the adult chicken.21,22
In this study, we replicated click-evoked ABRs in chicken hatchlings. We further characterized: (1) suprathreshold tone-burst ABRs, (2) threshold determination for click and frequency-specific stimuli, (3) objective threshold determination, and (4) ABR comparisons to 6 other animal models. Revisiting the chicken ABR in the current study, much of the discussion and proposed future studies made by Katayama 7 are addressed, owing to new insights into molecular, neuronal, and system-levels auditory development.
Materials and Methods
Animals
All animal procedures were approved by Northwestern University’s Institutional Animal Care and Use Committees (Protocol IS00008863) and conducted following the National Institutes of Health Guide for the Care and Use of Laboratory Animals. In addition, the use of animals and all experiments outlined here are per ARRIVE guidelines. Eggs were obtained from Sunnyside Farms, Inc. (Beaver Dam, WI, United States), and incubated at 38°C, 50% humidity (Hova-Bator incubator model 1602N). Incubation lasted 20 days with physical rocking 2 to 3 times a day. At embryonic day 20, eggs were transferred to a plastic incubator (LYON automatic incubator) at the same temperature and humidity, but without physical motion. Hatchlings emerged from the eggs 1 day later (E21) and remained in the incubator for up to 30 hours. All recordings reported here were from post-hatch days 1 and 2 (P1 and P2) chicken hatchlings.
Animal preparation
Details of animal husbandry, as well as experimental methods and set-up, have been previously described in detail. 4 Briefly, 45 chicken hatchlings of both sexes (23 = female, 22 = male) were weighed and given an anesthetic cocktail of 50 mg/kg ketamine and 16.68 mg/kg xylazine. Two animals (1 male and 1 female) were not included due to premature death. Therefore, data from 43 animals were used for analysis. Once unconscious, feathers on the head were removed with a depilatory cream. Stainless steel silver chloride needle electrodes and a rectal temperature probe (YSI model 73A) were cleaned with 70% isopropyl alcohol wipes. The probe was inserted into the cloaca for temperature monitoring. Temperature was maintained between 37°C and 41°C using a heating pad (CSI/Speco PSV-5 power supply). While adult chicken body temperature is 41.5°C, the body temperature of hatchlings varies. 23 Recording ABRs near the animal’s body temperature is important for functional, relevant, and optimal peak waveform latencies and amplitudes.5,6 The needle electrodes were subdermally placed at a shallow depth of ~2 millimeters (mm). Electrode impedances were below 5.0 kiloohms (kΩ) and interelectrode impedances were less than 3.0 kΩ. ABRs were recorded in a custom-built, double-walled, electrically shielded, sound isolation chamber (GK Sound Booth Inc). The experimenter, ABR hardware, and computer were situated outside the sound booth.
Single-channel recordings were collected using a 3-electrode array (Figure 1). Methodologies referring to electrode montage, configuration, or paradigm are considered synonymous to electrode array as defined here. For 2-channel ABR recording, a 4-electrode array can be used. 4 The 3 recording electrodes included a positive (inverting) electrode, a reference (non-inverting) electrode, and a ground electrode. The positive electrode was placed above the brainstem of the hatchling, slightly caudal from the eyes, corresponding to a Cz placement in humans according to the international 10 to 20 electrode array system. The reference electrode was placed behind the right ear (M6 placement in humans). The ground electrode was placed further behind the left ear, close to the neck muscle (Oz placement in humans). In all experiments, stimuli were presented via an ER3 (Intelligent Hearing Systems) insert transducer to the right ear of the hatchling. All experiments were performed within 1 hour of initial anesthetic injection. After experiments, the animal was euthanized and later decapitated as a secondary assurance of animal expiration.

Schematic of the electrode positioning on a chicken hatchling. The positive electrode above the brainstem and the negative electrode behind the ear canal are referred to as a vertical montage. 4
Data acquisition and analysis
Since all animals were unmanipulated hatchlings, and the data reported here are characterization results, there were no specific groups assigned. The following ABR parameters were assessed: peak-to-trough waveform amplitudes (one-way ANOVA with post-hoc corrected Tukey multi-comparisons test), peak waveform latency, and Wave I threshold. A repeated measures ANOVA (with post-hoc corrected Tukey multi-comparisons test) was used for comparison of mean threshold values. Data and statistics for all experiments conducted are reported and visualized in Tables 1 and 2 and Figures 1 to 8, respectively.
Mean threshold and standard deviation (S.D.) for tone- and click-evoked ABRs.

Recording conditions for the cross-species comparisons reported in Figure 7.


The click-evoked ABR in chicken hatchlings. (a) Grand average ABR for 43 animals (black lines). Red lines denote the standard error of the mean (SEM). Waves I, II, and III, are labeled. (b) Example of a representative hatchling ABR. Every animal presented with at least 3 waves, but Wave II may have 2 components (labeled (a) and (b)). Wave IV is potentially present, but only in approximately half of the animals tested (17/43). (c) Example of a hatchling ABR where Waves IIa and IIb were more prominent. The potential for Wave IV is still minimal. (d) Example of a hatchling ABR where Waves IIa, IIb, and IV are clearly visible. The stimulus originates at time = 0 ms.
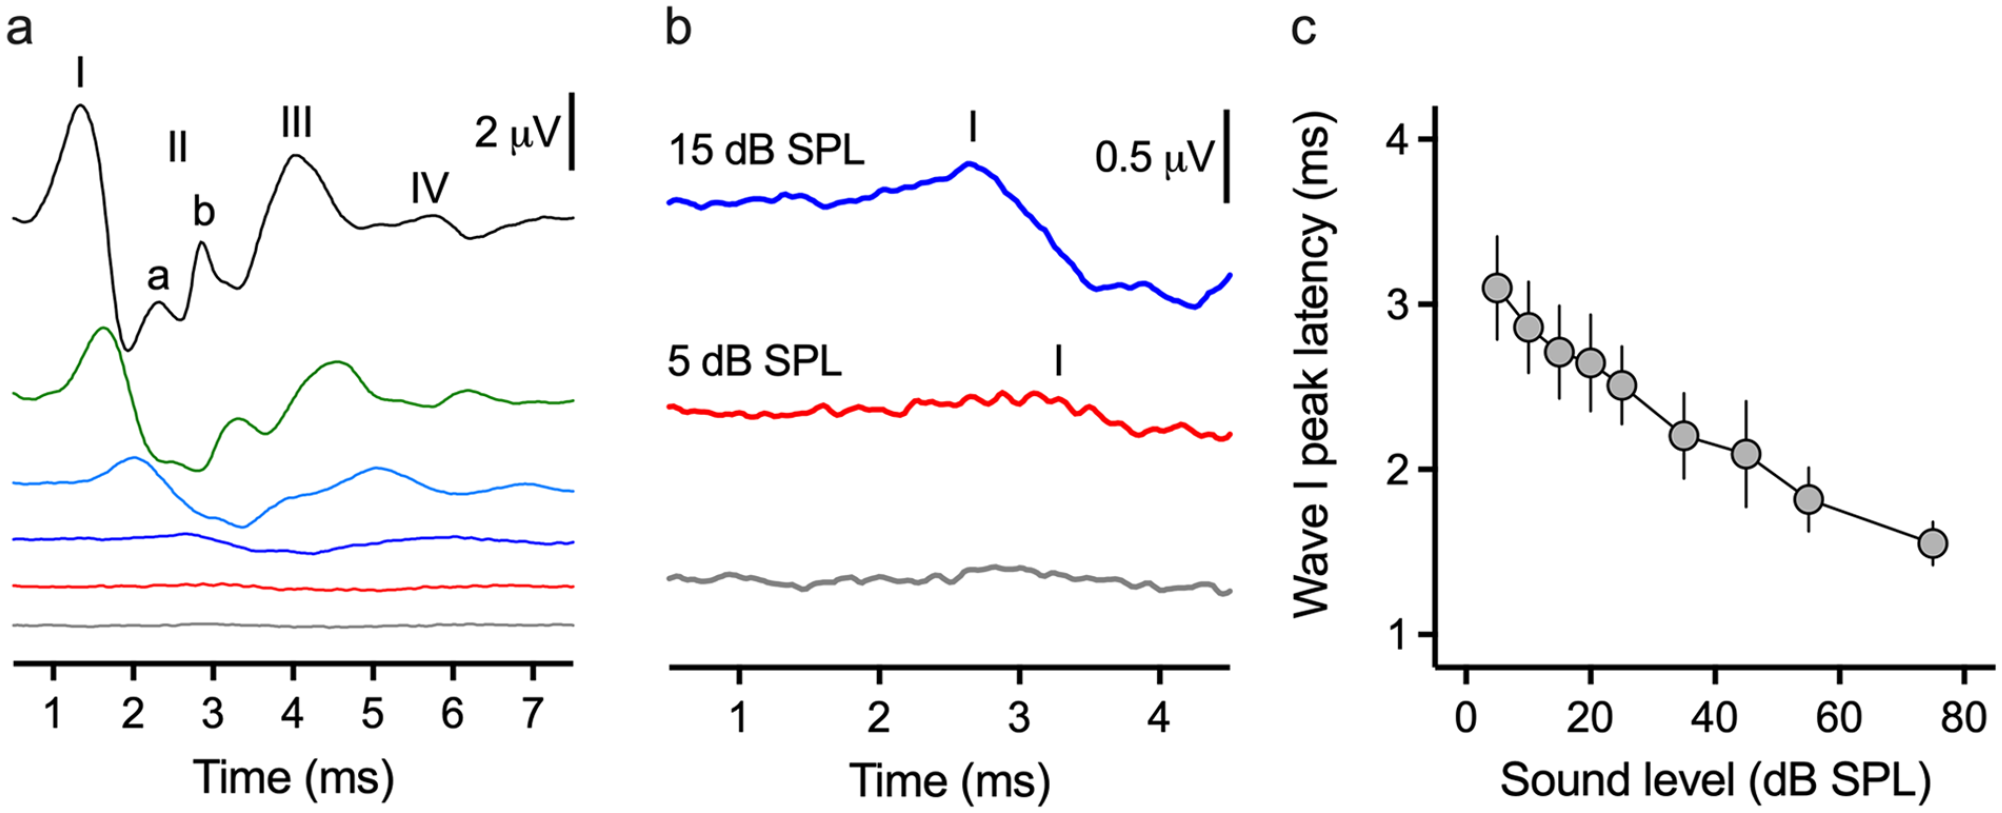
Click-evoked ABR threshold determination and latency/dB SPL function. (a) The same click trace as Figure 2d but at decreasing stimulus intensities (75, 55, 35, 15, 5, and 0 dB SPL). (b) Magnification of the 15, 5, and 0 dB SPL traces. Threshold is 5 dB SPL, the lowest sound level where wave I is still visible and repeatable. (c) Latency/dB SPL function for Wave I. N = 19 animals, error bars denote standard error of the mean (SEM). The stimulus originates at time = 0 ms.

Tone-evoked ABR characterization. Suprathreshold tone-evoked ABRs (75 dB SPL) for N = 8 animals across 6 frequencies (black traces). Red lines denote the standard error of the mean (SEM). The stimulus originates at time = 0 ms.
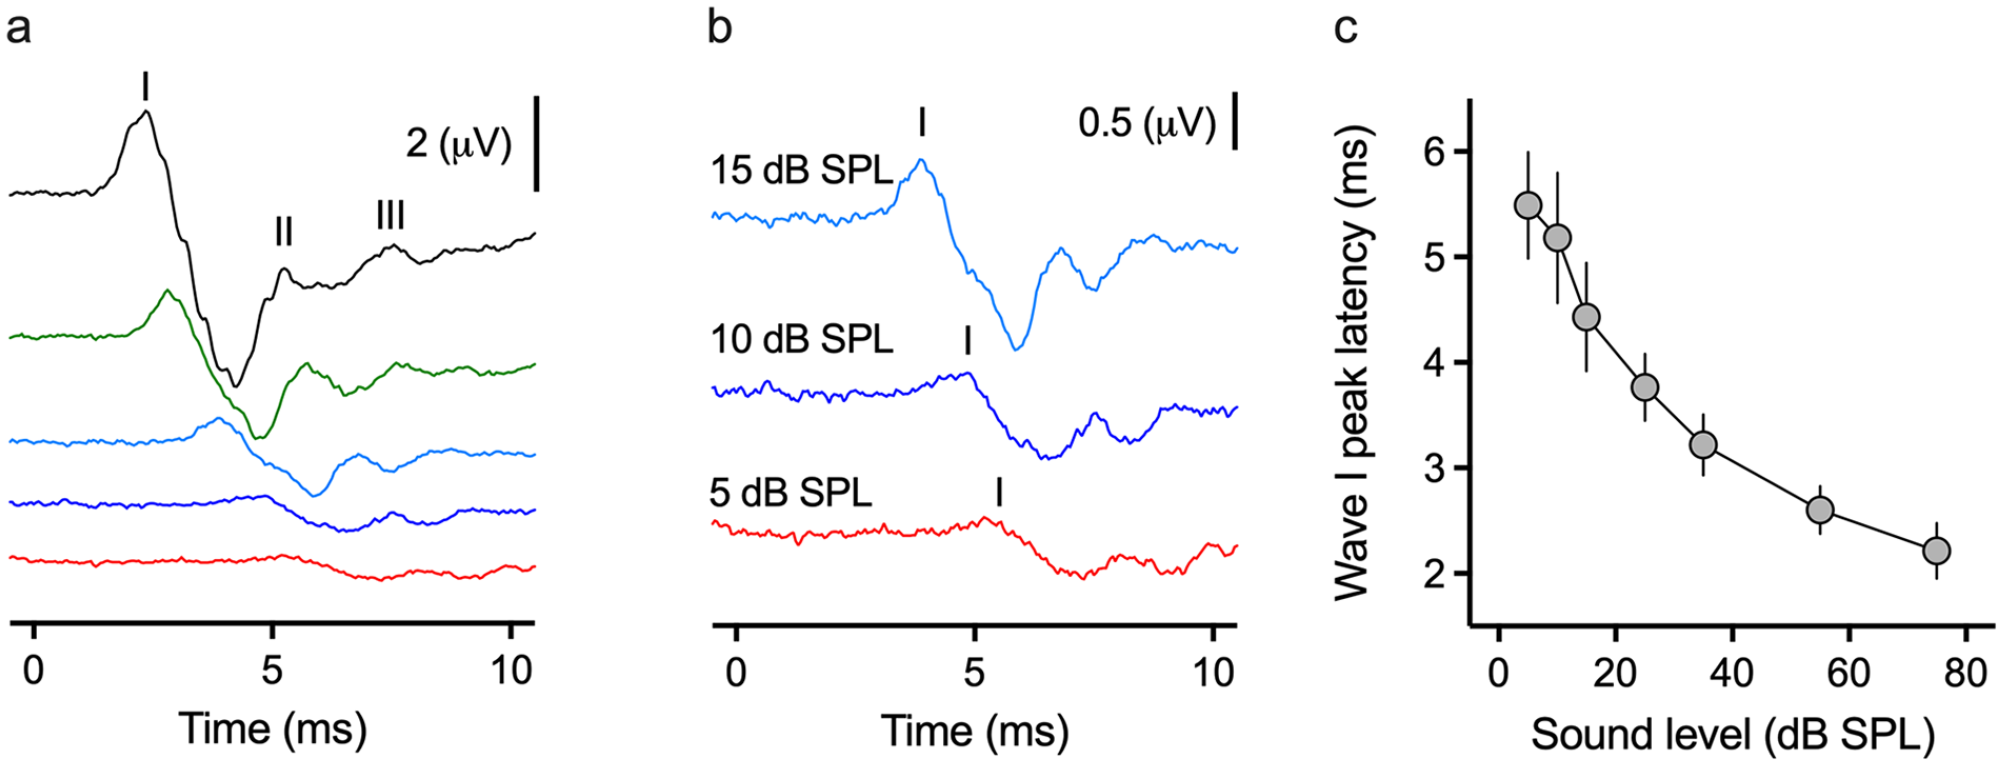
Tone-evoked ABR threshold determination and latency/dB SPL function. (a) Representative ABR trace for a 1000 Hz tone burst. (b) Magnification of the 15, 10, and 5 dB SPL traces. Threshold is 5 dB SPL, the lowest sound level where Wave I is still visible and repeatable. (c) Latency/dB SPL function for Wave I of the 1000 Hz tone burst ABR. N = 20 animals, error bars denote the standard error of the mean (SEM). The stimulus originates at time = 0 ms.

Thresholds for click-evoked and tone-evoked ABRs. (a) ABR audiogram for the click and 8 frequencies. Error bars denote 95% confidence interval (CI). (b) ABR audiogram (gray) compared to the behavioral audiogram of an adult chicken (red). Adult behavioral data derived from Hill et al. 21

Objective thresholds for click- and 1000 Hz-evoked ABRs. (a) Example of click-evoked ABR traces at decreasing sound levels. The covariance coefficient on the right y-axis lowers and the last value above 0.35 matches the subjective threshold in bold. (b) Sigmoid function of click covariance coefficient values. The dashed line represents the criterion value of 0.35. (c) Example of 1000 Hz-evoked ABR traces at decreasing sound levels. The bolded trace represents the subjective threshold. The covariance coefficient on the right y-axis lowers and the last value above 0.35 matches the subjective threshold in bold. (d) Sigmoid function of covariance coefficient values for the 1000 Hz-evoked ABR. Dashed line represents the criterion value of 0.35. Gray shaded regions in both (a and c) represent the time windows (4 and 6 ms) to derive covariate coefficients shown in (b and d) respectively.

An Intelligent Hearing Systems SmartEP USB research platform (IHS: M011110) was used to collect, mark, and label ABRs. Signals were amplified with a gain of 100 000 and band-pass filtered between 100 and 3000 Hz. Data were collected over a 12.8 ms epoch at a 50 kHz sample rate and averaged for 512 repetitions. A minimum of 2 repeatable waveforms were recorded for repeatability and reliability of the biological response and then added to obtain a standard grand averaged response (1024 sweeps) for analysis.
A 100 µs suprathreshold click stimulus (75 dB SPL) was used to elicit the click-evoked ABR. The click was a 100 µs duration square pulse, and the rise/fall time was instantaneous. The stimulus polarity was alternating and delivered at a repetition rate of 19.1 stimuli per second for all recordings. Short-duration tone-burst stimuli were 6 ms or less consisting of at least 1 cycle of the frequencies specified. 25 Tone-burst stimuli and the duration periods were 250 Hz (6 ms), 500 to 1500 Hz (5 ms), 2000 to 3000 Hz (2.5 ms), and 4000 Hz (1.25 ms). Tone-burst stimuli were filtered following the recommendation of the American Academy of Audiology Clinical Guidance Document. 26 Stimuli were ramped on and off using a Blackman window such that the rise/fall times were ½ the total duration of the Blackman window. All stimuli were presented in dB SPL and calibrated in a custom cavity that matched the dimensions of the chicken hatchling ear canal. 4
Threshold determination and analysis
To obtain ABR thresholds, the stimulus level was lowered in steps of 20 dB SPL or smaller (eg, 75, 55, 45, 35, 25, 15, 10, 5, 0 dB SPL), which increases the latency and reduces the amplitude of the ABR. Subjective thresholds were defined as the lowest sound level where a repeatable biological response was visually observed. For all stimuli, the peak of Wave I was used to determine the threshold. Subjective thresholds were identified by the experimenter and confirmed by another experimenter and a clinically trained audiologist. To determine the objective threshold, the MATLAB cross-covariation algorithm described by Suthakar and Liberman 27 was used for a subset of 20 hatchlings. Using the same threshold criterion of 0.35, a sigmoid curve was fit to the data and analyzed in Prism (GraphPad versions 7.0b, La Jolla, CA, United States RRID: SCR_002798). ABR traces were imported into Microsoft Excel (RRID: SCR_016137) and visualized in Prism. For all figures, the stimulus was presented at time = 0 ms.
Results
The click-evoked ABR of chicken hatchlings
The click-evoked ABR of P1 and P2 chicken hatchlings were similar among the 43 animals tested. Across the population, the grand average ABR recorded at 75 dB SPL always presented with 3 positive-going waveform peaks that occurred within the first 6 ms post-stimulus onset (Figure 2a stimulus onset = 0 ms). The 3 peaks were labeled as Waves I, II, and III, following the labeling established and routinely used in clinical audiology settings. 1 On average, the waveform peak latencies occurred at 1.55 (S.D. ± 0.13), 2.98 (S.D. ± 0.42), and 4.04 (S.D. ± 0.57) ms after stimulus onset for Waves I, II, and III, respectively. Average peak-to-trough amplitudes for Waves I, II, and III were 8.21 (S.D. ± 3.16), 1.82 (S.D. ± 1.53), and 2.26 (S.D. ± 1.05) μV, respectively. A one-way ANOVA showed these amplitudes to be significantly different (Figure 2a inset, F (2,126) = 118.3, P < .0001 DF = 2). Post-hoc Tukey’s multiple comparisons tests showed that Wave I amplitude was significantly larger than Wave II and III (P < .0001, effect sizes 2.57 and 3.50 respectively), while Wave II and Wave III amplitudes were similar (P = .62, effect size 0.16).
Individual animal ABRs varied such that occasional microstructures and additional peaks were observed. The highest variability was seen in Wave II, which had peak microstructure that differed among hatchlings and may correspond to the 2 divisions of the avian cochlear nucleus (see discussion). Figure 2b shows the averaged ABR of an individual hatchling that exhibited a possible double-peak Wave II and the emergence of a fourth wave (Wave IV). This waveform pattern was observed in 44% (19/43) of hatchlings. Figure 2c shows the ABR of an individual hatchling that presented with a clear double-peaked Wave II and a potential Wave IV. This waveform pattern was observed in 40% (17/43) of hatchlings. Figure 2d shows a waveform pattern seen in 16% (7/43) of hatchlings: click-evoked ABRs with 4 clearly defined positive-going peaks, and a double-peaked Wave II. Across the 24 hatchlings with a clear Wave IV, the average latency was 5.41 ms (S.D. ± 0.84) and the average amplitude was 1.24 μV (S.D. ± 1.12).
Since Wave I was consistently the largest peak waveform across the population of animals tested, we used it to detect the lowest decibel sound pressure level (dB SPL) that elicited a biological change in the voltage response (ie, threshold). Figure 3 shows the well-established relationship between peak latency and sound level (ie, latency/dB SPL functions). For the click-evoked ABR, all waveform peak latencies increased when the sound level was reduced. A representative response is shown in Figure 3a and b (the same animal shown in Figure 2d). Figure 3c shows the average Wave I peak latency for all hatchlings—that had identifiable 4 peak ABR waveforms—as a function of dB SPL. Across the total population, Wave II was not detectable at sound levels below 20 dB SPL. The same observation was true for Wave IV, as well as microstructures within the click-evoked ABR waveform.
Tone-evoked ABRs of chicken hatchlings
To reliably estimate the threshold of hearing across a broad frequency range, we first established the “characteristic” waveform morphology of tone-evoked ABRs in chicken hatchlings. In 8/43 animals, 75 dB SPL tone burst stimuli were presented over a range of 8 frequencies. Figure 4 shows grand averaged traces for tone-burst frequencies. The suprathreshold tone-burst waveforms resembled the click-evoked ABR with 2 to 3 positive-going peaks. This was most noticeable in the 1000 Hz waveform. Additionally, the waveform amplitude was the largest for this frequency, and smallest in the 500 and 3000 Hz waveforms. Despite these differences, tone burst ABR waveforms always presented with a single, broad peak that occurred 2 to 3 ms after stimulus onset, followed by at least one additional peak between 5 and 8 ms. The grand average Wave I latencies for the 6 frequencies tested were 2.8, 2.7, 2.4, 2.5, 2.3, and 2.4 ms respectively. Waveform oscillations seen in the 500, 750, and 1000 Hz waveforms may represent incomplete cancellation of the cochlear microphonic (see discussion). Extending the duration of the tone burst stimulus in future studies would confirm this.
Given the large peak-to-tough amplitude of Wave I to the 1000 Hz stimulus shown in Figure 4, we used this stimulus frequency to illustrate the latency/dB SPL relationship shown in Figure 5. Figure 5a shows a representative response from an individual chicken hatchling. A 1000 Hz tone burst was systematically lowered until no biological signal could be observed. (Figure 5b). The tone-evoked ABR Wave I peak latency was longer compared to the click-evoked ABR (Figure 5c), likely a byproduct of the longer rise/fall time in a 5 ms stimulus versus a 100 µs click stimulus.
Tone-evoked ABR thresholds
Having characterized suprathreshold tone-evoked ABR waveform morphologies across a range of stimulus frequencies (see Figure 4), we next determined the lowest sound pressure level needed to detect Wave I. For 29/43 hatchlings, thresholds were determined at 8 frequencies (Table 1). The average subjective threshold at 1000 Hz was 5 dB SPL (S.D. ± 8.61), which was significantly lower than the average click-evoked ABR threshold of 14 dB SPL (S.D. ± 16.11, P = .0005). This improvement of the 1000 Hz tone burst could be due to its increased stimulus duration (see discussion). Using a repeated measures ANOVA and post-hoc Tukey comparisons, we found that the 1000 Hz threshold was significantly lower than that of any other frequency or click stimulus (F (4,113) = 66.5, P < .0001, DF = 8). The only adjacent frequencies where the change in threshold was not significant were between 1500 and 2000 Hz (P > .9999, data not shown).
Averaged ABR thresholds revealed an increase in variability at higher frequencies (Table 1). This may be attributed to high frequency sensitivity not being fully developed.28,29 The higher variability in the 500 Hz tone burst threshold may be related to the oscillations seen in (Figure 4). Nevertheless, the standard error of the mean (SEM) did not exceed ±3 dB SPL. The ABR audiogram exhibited a characteristic “U-shape,” with a range of best sensitivity between 750 and 2000 Hz (Figure 6). The ABR thresholds at best sensitivity are similar to behavioral thresholds found in adult chicken 14 (Figure 6b), but also the sensitivity seen in other avian models (see discussion).
Objective ABR thresholds
In both research and clinical practice, ABR threshold is usually determined visually by an experienced experimenter or audiologist. While threshold can be confirmed by a second individual, there are still issues with inter-rater reliability and the use of a subjective measure. 30 As such, we wanted to use an objective measure of ABR threshold to corroborate subjective findings. Based on the latency of Wave I at the lowest sound levels seen in Figures 3 and 5, we used the algorithm described by Suthakar and Liberman 27 to calculate the cross-covariation for ABR traces. Figure 7a shows an example click-evoked ABR from a P2 chicken hatchling. The gray shaded region represents the time window (4 ms) of the cross-covariation analysis. The subjective threshold determined for this animal was 10 dB SPL (bold trace). This was in excellent agreement with a cross-covariation value of 0.53. Across the population, using a criterion level of 0.35 established by Suthakar and Liberman 27 as objective threshold determination, the average objective threshold value was 9.6 dB SPL, compared to the average subjective threshold value of 14 dB SPL (Figure 7b). Figure 7c shows an example tone-evoked ABR (1000 Hz) from a P2 chicken hatchling. The gray shaded region represents the time window (6 ms) of the cross-covariation analysis. The subjective threshold determined for this animal was 10 dB SPL (bold trace). This was also in agreement with a cross-covariation value of 0.44. Across the population, the average objective threshold was 12 dB SPL, compared to the average subjective threshold value of 5 dB SPL (Figure 7d). This 7 dB SPL difference might be due to the less stereotyped shaped of a tone burst ABR. With subjective methods, a non-biological voltage peak was perhaps seen as Wave I. Despite the slight discrepancies between objective and subjective thresholds, none were outside ±1 standard deviation from the mean.
ABR latency between 7 different species
The chicken hatchling ABR resembled that of other species. Comparisons between previous literature and the current findings were made for the latency of Waves I, II, and III to a suprathreshold click stimulus. The results of this analysis are shown in Figure 8. Data for the mouse, 5 bird species, and the chicken hatchling were combined. Despite considerable variation in animal age, sound presentation level and presentation rate (Table 2), the latencies for all species are similar. The shortest latencies were seen in the mouse and barn owl. Wave II for the barn owl was combined with Wave I in Kuokkanen et al, 13 perhaps because the sound level was only 55 dB SPL. This comparative analysis is promising, but care must be taken when comparing ABR results with different experimental parameters. Even within a single species, the need for standardized and consistent ABR recording is critical. 31
Discussion
Replicating the chicken hatchling ABR
In this study, we sought to replicate findings of the chicken hatchling ABR that were first reported nearly 4 decades ago. 7 In addition, we sought to characterize suprathreshold tone bursts, determine thresholds for click and frequency-specific stimuli, estimate objective thresholds, and compare the click-evoked ABR to 6 other animal models. We found that high sound pressure levels elicited an ABR such that the IHS software often measured a signal-to-noise ratio greater than 3.0 μV (Figure 2). Previous data from Katayama 7 at 83 dB SPL exhibited an average peak latency of 1.52 (SD ± 0.10) for Wave I (referred to as N1), and an average peak amplitude of roughly 10 μV. These values are nearly identical with the 1.55 ms average peak latency and the 8.21 μV average peak amplitude for Wave I of the current study (Figure 2a). The latency of Wave III (referred to as N4) was shorter than our findings (2.76 vs 4.04 ms). This could be due to the electrodes being implanted into the skull above the forebrain and cerebellum, as opposed to our subdermal 3-electrode array.
The tone-evoked ABRs also exhibited large waveform amplitudes (Figure 4) but also unintended oscillations. These may be due to an incomplete cancellation of the cochlear microphonic, despite using alternating stimulus polarity. Similar oscillations were observed in adult chicken compound action potentials (cAPs) at 500 and 1000 Hz. 32 The cAP is an evoked potential that represents Wave I of the ABR, but it requires electrode placement at the tympanic membrane and/or round window. This electrode placement usually requires surgery,8,33 and was outside the scope of the current study.
Click- and tone-evoked ABR sensitivity
For all frequencies tested, the average threshold of hearing sensitivity was unexpectedly low. The subjective thresholds in Table 1 and Figure 6 are roughly 20 dB SPL lower than cAP thresholds reported by Salvi et al 32 but similar to sensitivity of adult barn owls. 12 One explanation may be an unintentional bias in determining threshold. However, we did determine the objective threshold for the 1000 Hz-evoked ABR and found only a 6 dB increase (Figure 7b). With this change, there is no frequency where the hatchling ABR threshold is better than the adult behavioral threshold. 21 While there is a chance this suggests all subjective thresholds should be higher, the objective threshold for the click-evoked ABR was lower than our subjective measurement (Figure 7a). The transducer speaker used in the current study was an insert earphone, which we were able to place inside the ear canal at a shallow depth. While this would improve thresholds compared to a far-field speaker placed further away from the animal’s ears, we also used subcutaneous electrodes versus more invasive ones closer to auditory structures. Manipulating stimulus parameters like duration, rise/fall time, stimulus rate, and number of sweeps would also result in slightly different thresholds. Spectral width, high and low pass filters, as well as phase filters 34 can be modified or added to alter ABR waveform and perhaps microstructures like that observed in Wave II of the click-evoked ABR (Figures 2c and 3a).
The ABR thresholds in Figure 6 and Table 1 exhibited the highest variability at high frequencies. This may suggest that auditory function in the chicken hatchling (P1-P2) is still developing. Could this be the case for all auditory structures? One important finding from Katayama 7 was the change in ABR latency between hatchlings and adult animals. The latency of Wave I changed very little from hatchlings to adults, from 1.36 to 1.31 ms at 103 dB SPL. This is supported by the chicken basilar papilla undergoing little if any change post-hatch. 35 However, the inter-wave latencies observed by Katayama 7 differed between hatchlings and adult chickens. The derived latency of Wave III shortened from 2.76 to 2.26 ms. This post-hatch development is supported by not only a threshold shift, 29 but also a large increase in Kv1 type potassium channel expression in the chicken cochlear nucleus. 36 These changes were reported in high-frequency regions, where we report the biggest discrepancy between hatchling and adult frequency sensitivity (Figure 6). Other animal models also develop high-frequency sensitivity after low and mid frequencies.12,28,29,37 It is important to note that frequency-specific development post-hatch does not suggest that the tonotopic map is shifting. Tonotopic organization and characteristic frequencies are established in embryonic stages during hearing onset.29,35,38
Hatchling and adult auditory sensitivity
The chicken hatchling ABR complements findings in adult chicken auditory perception as shown in Figure 6b. The behavioral audiogram of an adult chicken also exhibits a “U-shape,” with the best threshold at 2.6 dB SPL for 2000 Hz stimuli. 21 This range of sensitive hearing is confirmed by sound localization experiments determining the minimum audible angle (MAA) in adult chickens. MAAs at 500, 1000, 2000, and 4000 Hz were 12.3°, 9.3°, 8.9°, and 14.5°, respectively. 22 The adult chicken also perceives frequencies below 64 Hz, including infrasonic frequencies below 20 Hz that lie outside the range of hearing for humans. It may be possible to record the ABR to infrasonic frequencies, as we were able to elicit a biological response to a 100 Hz tone (data not shown). However, given the wavelength of 100 Hz, the stimulus must be at least 10 ms in duration. We chose instead to keep stimulus duration between 1.25 and 6 ms such that all tone bursts included at least one wavelength. While there exist examples of infrasound in avian models,39-43 the mechanisms for perception of sound below 100 Hz represent a current gap in research. Such findings would help support in vitro studies of ultra-low frequency neurons found in the chicken and barn owl auditory brainstem.44-46
Comparative ABRs
The similarity of the chicken ABR to other birds and mammals is promising. ABR similarities between 6 different avian species highlight the evolutionary conservation of sub-cortical auditory processing. One consideration is precocious versus altricial development. Only the chicken data shown in Figure 8 is an example from a precocious stage, the other animal models are altricial in that their sensory and motor development extends days or weeks post hatch.12,15 These developmental categories are not binary. Instead, a spectrum of development can be seen across class Aves. 15 A second consideration is evolution and taxonomy. While the classification of birds is complex, within Aves, there are 3 major divisions: Palaeognathae (ostriches and tinamou), Galloanseres (landfowl and waterfowl), and Neoaves (all other extant avian species). 47 Based on this classification, chickens and ducks are related and represent an evolutionary split from all songbirds, raptors, and owls. Similar hearing sensitivity can be seen in duck and chicken hatchlings, 48 and the Wave I latency to a 2860 Hz tone in several duck species 3 resembles the 3000 Hz chicken ABR shown in Figure 4.
Avian central auditory structures
The peaks and troughs of the ABR waveform are generated by auditory nuclei. However, there are few direct comparisons between the voltage responses of the ABR and the voltage changes in brainstem nuclei. 49 In avian models, the auditory nerve bifurcates to synapse with 2 cochlear nuclei structures, nucleus angularis (NA) and nucleus magnocellularis (NM). NM is analogous to the anteroventral cochlear nucleus in mammals, while NA is thought to play a role in sound level encoding but lacks a clear analog.17,50,51 NM projects to nucleus laminaris (NL), a structure resembling the medial superior olive in mammals, that encodes interaural time differences (ITDs) to localize sound.52-54
The pathway from the auditory nerve to NM/NA to NL may define Waves I, II, and III of the chicken hatchling ABR, respectively. This could also explain the microstructure of Wave II (Figure 2). If Wave II is generated by activity in both NM and NA, the timing of those neural responses could overlap with slightly different latencies. We propose that Waves IIa and IIb correspond to the activity of NM and NA, respectively. NM encodes temporal information via large endbulb of Held synapses, and the speed and synchrony required at this synapse would likely have a shorter latency of response compared to NA, which contains small dendritic bouton synapses.50,55,56 Additionally, myelination in NM axons is highly regulated.55,57 This could be tested in an avian model of demyelination, which has been shown to affect Waves II and III in the Long Evans shaker rat. 58 Similar pathologies affecting action potential transmission speed could be seen via aberrant ABR latency and waveform properties. Wave IV of the chicken hatchling ABR might represent the inferior colliculus structure (also called nucleus mesencephalicus lateralis pars dorsalis or MLd). 59 Indeed, Katayama 7 suggested that Wave III (N4) is generated by NL and Wave IV (N5) may be generated by MLd. This prediction is now supported by a barn owl study that correlated NL extracellular field potentials with Wave III of the click-evoked ABR. 13
Comparing avian and mammalian ABRs
Although the similarity of avian and mammalian ABRs is supported by comparative studies at molecular, cellular, and system levels,60-65 auditory brainstem nuclei do differ between vertebrates. The mammalian dorsal cochlear nucleus, medial nucleus of the trapezoid body, and lateral superior olive do not have avian correlates like the NL to MSO comparison. Further study is needed to connect each ABR waveform with a mechanism within the brainstem or midbrain, for both avian and mammalian models. Doing so would add more clinical and translational relevance to the manipulations and experiments that affect or impair auditory function, localization, sensitivity, and categorization.
As many as 5 to 7 peaks have been characterized in human and other mammalian ABRs,1,2 whereas only the bald eagle and red-tailed hawk ABR presented with 5 peaks, 14 and some chicken hatchlings presented with a 4 peak ABR and Wave II microstructure (Figure 2c and d). There are also evolutionary differences; avian models are thought to better utilize ITDs, while mammalian models used both ITDs and interaural level differences (ILDs) to localize sound.60,63,66 These sound localization strategies could be correlated with ABR latency and amplitude differences across species.
By revisiting the chicken ABR, we have both replicated and added to this in vivo model of precocious auditory development. Perhaps most exciting are the recent genetic tools like in ovo electroporation and CRISPR/Cas9 that can precisely manipulate auditory development.67-71 In the case of in ovo electroporation, plasmid DNA containing proteins of interest are typically injected unilaterally. This permits the contralateral ear and auditory brainstem pathway to serve as a robust internal control. As such, the chicken ABR could provide insight into deficiencies in auditory structure and function during such experimental manipulation.
Footnotes
Acknowledgements
Funding:
The author(s) disclosed receipt of the following financial support for the research, authorship, and/or publication of this article: This work is supported by the National Institutes of Health, National Institute on Deafness and Other Communication Disorders NIH/NIDCD R01 DC017167.
Declaration of conflicting interests:
The author(s) declared no potential conflicts of interest with respect to the research, authorship, and/or publication of this article.
Abbreviations
ABR Auditory Brainstem Response
dB SPL Decibels Sound Pressure Level
EEG Electroencephalography
ILD Inter-aural Level Difference
ITD Inter-aural Time Difference
MAA Minimum Audible Angle
MLd Nucleus Mesencephalicus Lateralis pars Dorsalis
MSO Medial Superior Olive
NA Nucleus Angularis
NL Nucleus Laminaris
NM Nucleus Magnocellularis
P1 Post Hatch Day 1
P2 Post Hatch Day 2
Author Contributions
G. O., M. M., and J. T. S. designed the study. G. O. and M. M. performed the ABR experiments at Northwestern University. G. O., M. M., and J. T. S. analyzed and interpreted the data. G. O. and J. T. S. wrote the manuscript.
Data Availability
The raw datasets used and analyzed for the current study are available from the corresponding author upon request.