
Abstract
Background
In the pathophysiology of acute coronary syndrome (ACS), platelets play a key role. The immature platelet fraction (IPF) is thought to be a possible indicator of activation of platelets and turnover processes. Younger platelets have a higher thrombotic potential and combine with collagen faster, which might compromise their ability to maintain hemostasis and lead to the development of thrombus. MPV measurements show platelet activation. IL-6 plasma levels seem to indicate the degree of latent plaque inflammation and, thus, may indicate susceptibility to plaque rupture.
Aims and Objectives
To estimate the levels of IPF, MPV and IL-6 in ACS and to find out the association and correlation of IPF, MPV and IL-6 with ACS.
Material and Method
Seventy patients of ACS fitting the Universal criteria of Myocardial infarction as cases and 70 healthy controls were included in the study. MPV, IPF, and IL6 were analyzed in all the cases and controls using various statistical tools.
Result
MPV (fl) was the best predictor among all parameters at a cutoff point of >4.2, with an AUC of 0.855 for correctly predicting STEMI. IPF came out to be a reasonably good marker for predicting STEMI, with a mean of 8.71 ± 5.39. IL-6 in NSTEMI was significantly higher than in controls (P = .004) and was comparable with UA (P = .09).
Conclusion
The current study’s findings seem to confirm that elevated MPV and IPF are important ancillary indicators in the assessment of ACS.
Introduction
Acute coronary syndrome (ACS), the initial manifestation of coronary artery disease, is a blanket term for the clinical presentation of myocardial ischemia. 1 A broader term that is being used is ischemic heart disease (IHD).
IHD patients are divided into two categories: those with CAD, who typically present with stable angina, and those with ACS, which includes acute myocardial infarction (AMI) with ST-segment elevation (STEMI) on their presenting electrocardiogram (ECG), and those with non-ST-segment elevation acute coronary syndrome (NSTE-ACS). The latter includes patients with non-ST-segment elevation myocardial infarction (NSTEMI), who have evidence of myocyte necrosis, and those with unstable angina (UA), who do not. The clinical manifestations of CAD are determined by the characteristics of atherosclerosis. Vulnerable or unstable plaques cause atherothrombosis, the hallmark of ACS; whereas, stable plaques have a poor-lipid core and a thick fibrous cap and result in stable coronary artery disease (SCAD).2–4
Immature platelet fraction (IPF) is thought to be a possible indicator of platelet turnover and the activation process. The prothrombotic potential of immature platelets is higher, and they aggregate with collagen more quickly. As a result, IPF has been linked to the development of ACS. Platelets play an important role in the course of the development of ACS, where rupture of plaque is followed by activation of platelets and thrombus formation, eventually leading to coronary artery occlusion.5, 6
When platelets undergo activation, they enlarge in size, which can be estimated by MPV. Platelets of greater size are more adhesive and aggregate more than platelets of smaller size. This increase in platelet volume increases the risk of coronary thrombus development in ACS patients. 7
Inflammatory mediators play a key role in the pathophysiology of ACS. These include white blood cell count (WBC), C-reactive protein (CRP), and cytokines like interleukin-6 (IL-6) and tumor necrosis factor (TNF). IL-6 is one of the essential cytokines and is thought to be a key player in cardiometabolic signaling. It is produced by a variety of cells that govern the acute-phase response. 8 IL-6 binds to the membrane-bound IL-6 receptor and the soluble form of the IL-6 receptor and helps in atherosclerotic plaque development and destabilization. 9
These indices have sparked considerable interest in recent years, owing to their potential to provide independent information on pathophysiology, risk stratification, and optimal management. Henceforth, there is a need to study the impact of these three important parameters, that is, IPF, MPV, and IL-6, in patients with ACS.
Material and Methods
This is a cross-sectional observational study conducted in the Departments of Medicine, Pathology, and Biochemistry at a tertiary care hospital from January 1 2021 to May 31 2022. The study included 70 patients with ACS who met the universal criteria for myocardial infarction as cases and 70 healthy controls to determine the normal reference range of various tests. From the institutional ethics committee, ethical clearance was obtained.
The patients were allocated into: Group I: STEMI; Group II: NSTEMI; Group III: unstable angina (UA); and Group IV: control.
Methodology
Patients who fulfilled the inclusion criteria underwent a thorough history and clinical examination. The following tests were done in all included patients: ECG, Trop T, complete blood count (CBC), and IL-6.
Statistical Analysis
The variables that were categorical were presented as numbers and percentages (%). The continuous variables, on the other hand, were presented as mean SD and median values. To determine the normality of the data, the Kolmogorov-Smirnov test was used. Non-parametric tests were used in cases where the data was not normal. ANOVA, Chi-Square test, Fisher’s exact test, receiver operating characteristic curve, and Spearman rank correlation coefficient were among the statistical tests used. The data was entered into a Microsoft Excel spreadsheet, and the final analysis was carried out using IBM’s Statistical Package for Social Sciences (SPSS) software, version 25.0, Chicago, USA. A P value of <.05 was considered statistically significant.
Results
The study included 70 patients with ACS who met the universal criteria for myocardial infarction. Of these 70 cases, 55.8% (39/70), 37.1% (26/70), and 7.1% (5/70) belonged to STEMI, NSTEMI, and unstable angina. The mean age of STEMI, NSTEMI, and unstable angina was 54 years, 52 years, and 55 years, respectively. The proportion of males was significantly higher in unstable angina, NSTEMI, and STEMI as compared to controls (males: 100%, 69.23%, 84.62% vs. 42.86%, respectively). The most common clinical features of ACS were chest pain, retrosternal pain, and diaphoresis.
Blood was collected in an EDTA vial, and a complete blood count was analyzed on an automated hematology analyzer (SYSMEX XN-1000). The median (25th–75th percentile) of MPV (fl) in STEMI (10(7.2–11.9)) was comparable with NSTEMI (5.5(4.35–10.15), P = .096), and was significantly higher than control (3.2(3–5.2), P value .0001) and unstable angina (2.6(2.4–8.9), P = .004). MPV (fl) in NSTEMI was significantly higher than control (P = .0001). MPV (fl) was comparable between NSTEMI and unstable angina (P = .051) and between unstable angina and control (P = .874) (Table 1).
Comparison of MPV (fl) Between STEMI, NSTEMI, Unstable Angina and Control.
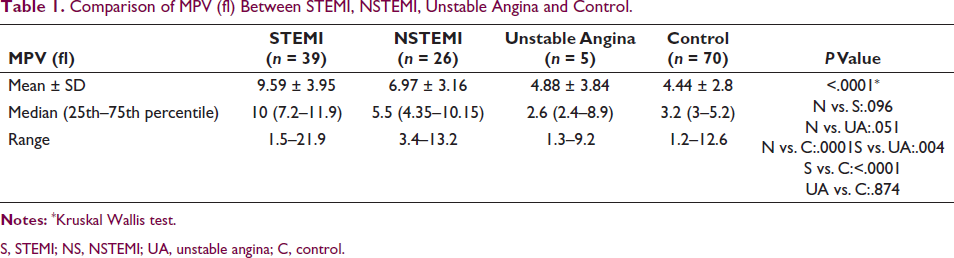
S, STEMI; NS, NSTEMI; UA, unstable angina; C, control.
The median (25th–75th percentile) of IPF (%) in STEMI (8.7 (3.5–12.15)) was comparable with unstable angina (3.4 (3.2–6.2), P = .122) and significantly higher than NSTEMI (3.65 (1.9–6.4), P = .002) and control (3.8 (2.3–5), P < .0001). IPF (%) was comparable between NSTEMI and unstable angina (P = .907), between NSTEMI and control (P = .861), and between unstable angina and control (P = .834) (Table 2).
Comparison of IPF (%) Between STEMI, NSTEMI, Unstable Angina and Control.
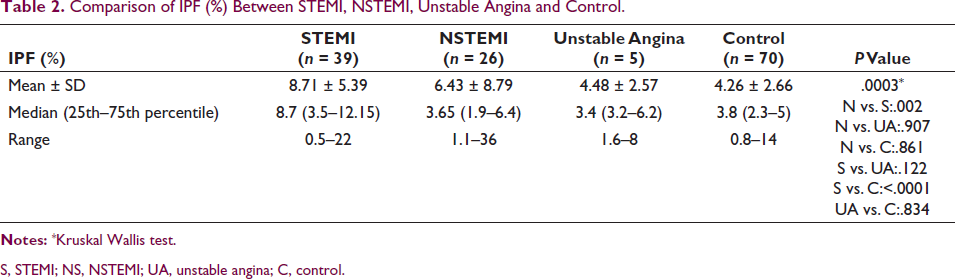
S, STEMI; NS, NSTEMI; UA, unstable angina; C, control.
Interleukin-6 was analyzed on an ELISA machine. The median (25th–75th percentile) of IL-6 (pg/mL) in STEMI (9.9 (8.8–25.56)) was significantly higher than in NSTEMI (9.85 (5.445–14.138), P = .038), control (6 (4–8), P < .0001), and unstable angina (5.38 (4.68–5.86), P = .004). IL-6 (pg/mL) in NSTEMI was significantly higher than control (P = .0004) and was comparable with unstable angina (P = .09). IL-6 (pg/mL) was comparable between unstable angina and control (P = .965) (Table 3).
Comparison of IL-6 (pg/mL) between STEMI, NSTEMI, Unstable Angina and Control.
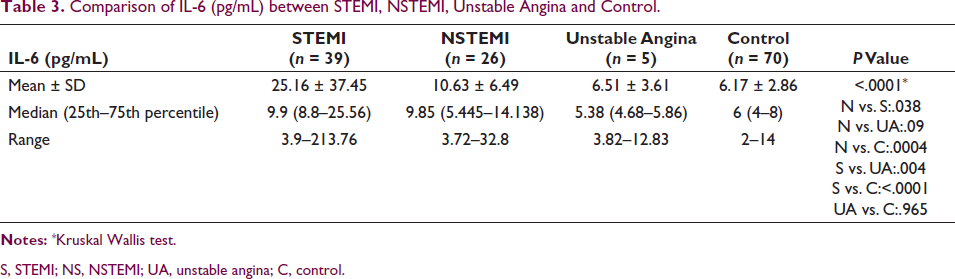
S, STEMI; NS, NSTEMI; UA, unstable angina; C, control.
The correlation of MPV (fl), IL-6 (pg/mL), and IPF (%) with each other in STEMI, NSTEMI, and unstable angina was performed using the Spearman rank correlation coefficient. In STEMI, a non-significant moderate positive correlation was seen between MPV (fl) and IPF (%), with a correlation coefficient of 0.297. A non-significant mild negative correlation was seen between MPV (fl) and IL-6 (pg/mL), with a correlation coefficient of –0.145. No correlation was seen between IPF (%) and IL-6 (pg/mL), with a correlation coefficient of 0.015 (Figure 1a–c).
(a–c): Correlation of MPV(fl), IL-6(pg/mL) and IPF(%) with each other in STEMI. (d–f): Correlation of MPV(fl), IL-6(pg/mL) and IPF(%) with each other in NSTEMI. (g–i): Correlation of MPV(fl), IL-6(pg/mL) and IPF(%) with each other in Unstable Angina.
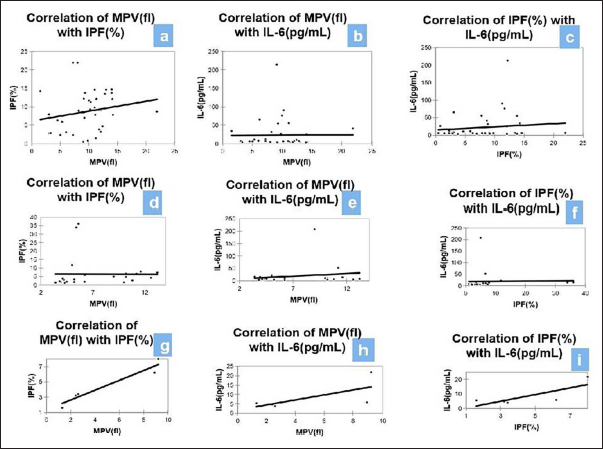
In NSTEMI, a significant positive correlation was seen between MPV (fl) and IPF (%), with a correlation coefficient of 0.531. No correlation was seen between MPV (fl) and IL-6 (pg/mL), with a correlation coefficient of 0.02. A non-significant moderate positive correlation was seen between IPF (%) and IL-6 (pg/mL), with a correlation coefficient of 0.244 (Figure 1d–f).
In unstable angina, a significant positive correlation was seen between MPV (fl) and IPF (%), with a correlation coefficient of 1. A non-significant moderate positive correlation was seen between MPV (fl) and IL-6 (pg/mL), with a correlation coefficient of 0.6. A non-significant moderate positive correlation was seen between IPF (%) and IL-6 (pg/mL), with a correlation coefficient of 0.6 (Figure 1g–i).
ROC Curve of MPV, IPF, and IL-6 for Predicting STEMI
ROC curves above the diagonal line are considered to have a reasonable discriminating ability to predict STEMI. All the parameters had significant discriminatory power to predict STEMI. The discriminatory power of MPV (fl) (AUC 0.855; 95% CI: 0.774–0.915) was excellent, and the discriminatory power of IPF (%) (AUC 0.746; 95% CI: 0.654–0.825) and IL-6 (pg/mL) (AUC 0.626; 95% CI: 0.528–0.716) was acceptable. Among all the parameters, MPV (fl) was the best predictor of STEMI at a cutoff point of >4.2 with an AUC of 0.855 for correctly predicting STEMI.
MPV (fl) had a sensitivity of 89.74%, followed by IPF (%) (64.10%), and IL-6 (pg/mL) (34.90%). On the other hand, IL-6 (pg/mL) had a specificity of 94.29%, followed by IPF (%) (88.57%) and MPV (fl) (72.86%). The highest positive predictive value was found in IL-6 (pg/mL) (77.80%), and the highest negative predictive value was found in MPV (fl) (92.70%). Overall, MPV (FL) showed the best association in STEMI (Figure 2a–c).
(a–c): Receiver Operating Characteristic Curve of MPV(fl), IPF(%), and IL 6(pg/mL) in STEMI. (d–f): Receiver Operating Characteristic Curve of MPV(fl), IPF(%), and IL-6(pg/mL) in NSTEMI.
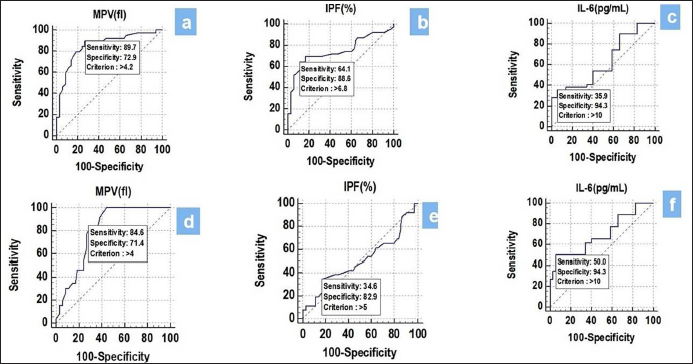
ROC Curve of MPV, IPF, and IL-6 for Predicting NSTEMI
The discriminatory power of MPV (fl) (AUC 0.798; 95% CI: 0.704–0.873) and IL-6 (pg/mL) (AUC 0.695; 95% CI: 0.593–0.785) was acceptable. On the other hand, the discriminatory power of IPF (%) (AUC 0.503; 95% CI: 0.399–0.607) was non-significant. Among all the parameters, MPV (fl) was the best predictor of NSTEMI at a cutoff point of >4 with an AUC of 0.798 for correctly predicting NSTEMI. MPV (fl) had a sensitivity of 84.62%, followed by IL-6 (pg/mL) (50.00%) and IPF (%) (34.62%). On the other hand, IL-6 (pg/mL) had a specificity of 94.29%, followed by IPF (%) (82.86%) and MPV (fl) (71.43%). The highest positive predictive value was found in IL-6 (pg/mL) (76.50%), and the highest negative predictive value was found in MPV (fl) (92.60%). Overall, MPV (FL) showed the best association in NSTEMI (Figure 2d–f).
The area under the curve of IPF (%) was comparable with MPV (fl) (P = .086) and IL-6 (pg/mL) (P = .138) for predicting STEMI. The area under the curve of MPV (fl) was significantly higher than IL-6 (pg/mL) (P = .001) for predicting STEMI (Figure 3a).
(a): Comparison of Area Under Curve of MPV(fl), IPF(%) and IL-6(pg/mL) in STEMI. (b): Comparison of Area Under Curve of MPV(fl), IPF(%) and IL-6(pg/mL) in NSTEMI.
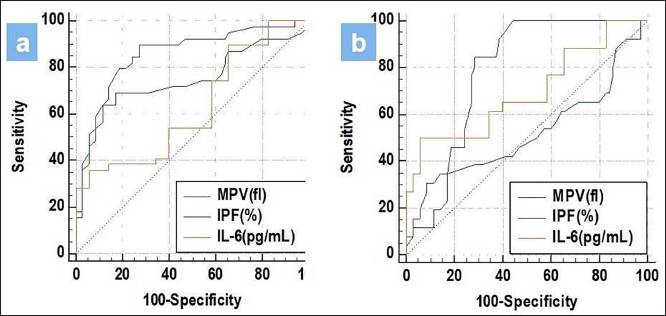
The area under the curve of IL-6 (pg/mL) was comparable with MPV (fl) (P = .19) for predicting NSTEMI. The area under the curve of IPF (%) was significantly lower than MPV (fl) (P value.0001) and IL-6 (pg/mL) (P = .026) for predicting NSTEMI (Figure 3b).
Due to limited number of unstable angina cases, ROC curve analysis could not be performed in UA.
Discussion
The purpose of the study was to investigate the roles of inflammatory biomarkers (IL-6) and platelets (MPV and IPF) in ACS. The majority of our patients had chest pain for 1–3 days, which was 92.31% in STEMI, 92.31% in NSTEMI, and 100% in UA. However, diaphoresis (15%) and retrosternal pain (7%) were seen in fewer subjects. Malik MA et al. found similar results in their study. 10
Among the ACS group, STEMI constituted 55% of the cases, NSTEMI were 37%, and only 7% belonged to UA. The majority of cases belonged to the STEMI subgroup. This finding is comparable with the study done by Orak et al. 11 ; in which 36.6% of patients belonged to the STEMI subgroup while 35.3% and 28.1% belonged to NSTEMI and UA, respectively.
In our study, IPF showed good association in STEMI with a mean of 8.71 ± 5.39, whereas it was not much significant in differentiating NSTEMI (mean: 6.4 ± 8.79) from UA (4.4 ± 2.5) and controls (4.26 ± 2.6). This could be due to the fact that the severity of STEMI is greater than that of NSTEMI and UA, as the occlusions in STEMI are more severe than those in the latter two subtypes. Our study was in concordance with Grove et al., 12 who found significantly higher values of IPF in STEMI compared to NSTEMI and UA.
IL-6 promotes the formation and destabilization of atherosclerotic plaques and is linked to ischemic-reperfusion myocardial damage and death. 13 In our study, the median of IL-6 in STEMI 9.9 (8.8–25.56 P = .03) was higher than in NSTEMI 9.8 (5.44–4.13 P = .03), U.A. 5.38 (4.68–5.86 P = .00), and controls (6–8). A study done by Tan et al., 14 on 263 patients with STEMI showed increased IL-6 concentrations in patients. Their findings suggest that increased IL-6 levels at admission may indicate the beginning of STEMI and may have prognostic significance for future cardiovascular mortality in STEMI patients. Another study done by Zhang et al., 15 found increased IL-6 in NSTEMI cases.
Platelet size and its activity are indicated by the MPV. Platelets that are larger in size are known to be more active because they express adhesive receptors (glycoprotein IIb and IIIa) and have higher concentrations of active substances in micro granules (such as thromboxane A2 and B2, platelet factor 4, P-selectin, and platelet-derived growth factor). MPV in STEMI 10 (7.2–11.9) was significantly elevated compared to NSTEMI patients 5.5 (4.3–10.15), UA 2.6 (2.4–8.9), and controls 3.2 (3–5.2). Our findings were supported by various other studies in the literature.16–18
For the three subtypes—STEMI, NSTEMI, and UA—there was a strong positive correlation between IPF and MPV, with correlation coefficients of 0.297, 0.531, and 1, respectively. This is understandable given that platelet activation happens prior to ACS and that during ACS, rapid platelet consumption will activate megakaryocytes, which will cause the bone marrow to release fresh platelets. The IPF will rise due to the release of new platelets, which will raise MPV.
The ROC curve of MPV (fl), IPF (%), and IL-6 (pg/mL) for predicting STEMI and NSTEMI was analyzed. To predict STEMI, MPV (fl) was the best predictor among all parameters at a cutoff point of >4.2, with an AUC of 0.855 for correctly predicting STEMI. Khode et al., 18 in a study of 128 subjects: 39 patients with AMI, 24 patients with SCAD, and 65 controls, found that the mean platelet volume was significantly higher in patients with AMI. They concluded that patients at higher risk for AMI and CAD had a strong correlation with MPV measurements.
In regards to NSTEMI, the discriminatory power of MPV (fl) (AUC 0.798; 95% CI: 0.704–0.873) and IL-6 (pg/mL) (AUC 0.695; 95% CI: 0.593–0.785) was acceptable. Out of all the parameters, MPV (fl) at a cutoff point of >4, with an AUC of 0.798, showed a good association in NSTEMI.
In a study by Huang HL et al. 19 on 63 ACS patients, they found that patients with ACS had higher MPV and IPF levels than patients without ACS. Using both initial TnI and MPV to diagnose ACS raised the positive predictive value from 84.2% to 86.7%. They also demonstrated that MPV can be used as a reliable indicator to aid in the early diagnosis of low-risk ACS patients with acute chest pain. While some studies suggested that MPV might be a biomarker for differentiation, other systemic analyses showed that MPV was unable to discriminate between AMI and UA. Therefore, it is still up for debate whether MPV is useful in differentiating between patients with UA and AMI.20–23
Overall, in our study, MPV was found to be the best marker for screening for STEMI and NSTEMI. However, the diagnostic accuracy and specificity of IL-6 were better than MPV and IPF in STEMI and NSTEMI.
Conclusion
The current study’s findings seem to support the importance of IPF and elevated MPV as ancillary biomarkers for ACS diagnosis. Additionally, it has been discovered that IL-6 is a significant biomarker for the evaluation of ACS patients (STEMI and NSTEMI). Hence, it has been suggested that incorporating markers that indicate various pathophysiologies is clinically helpful. However, further studies with a larger sample size are required to evaluate these biomarkers in ACS patients, especially with a larger number of UA patients.
Footnotes
Acknowledgement
We would like to thank our patient.
Declaration of Conflicting Interests
The authors declared no potential conflicts of interest with respect to the research, authorship and/or publication of this article.
Ethical Approva
Ethical clearance was obtained from the Institutional Ethics Committee.
Funding
The authors received no financial support for the research, authorship and/or publication of this article.
Patient Consent
Patient consent was obtained for the study.