
Abstract
Metabolic syndrome is a clinical entity characterized by abdominal obesity, atherogenic dyslipidemia, impaired glucose tolerance, and hypertension (HT). Despite various attempts at definition, the syndrome has remained mired in controversy over its components and utility. Insulin resistance and its association with risk of cardiovascular disease are discussed at length in this article.
This review also discusses the controversies in the definition of this syndrome, the unique role of insulin resistance in its development, and the causes and implications of this clustering of risk factors characteristic to it, along with suggestions for a more comprehensive approach to this common problem.
Introduction
Metabolic syndrome (MetS) is a constellation of abnormalities including abdominal obesity, atherogenic dyslipidemia, prediabetes, and hypertension (HT), with its own classification code and at least 7 sets of guidelines to define it.1, 3-9 Despite this, there continue to be controversies regarding its definition, and its founder and other groups have published negative reviews repeatedly, vehemently questioning its validity. Why is MetS so exciting and yet so controversial?
This review attempts to summarize the concept and evolution of MetS, the controversies and challenges that surround it, its association with cardiovascular disease (CVD) risk and suggests future actions.
What Is the Controversy Regarding the Definition of MetS?
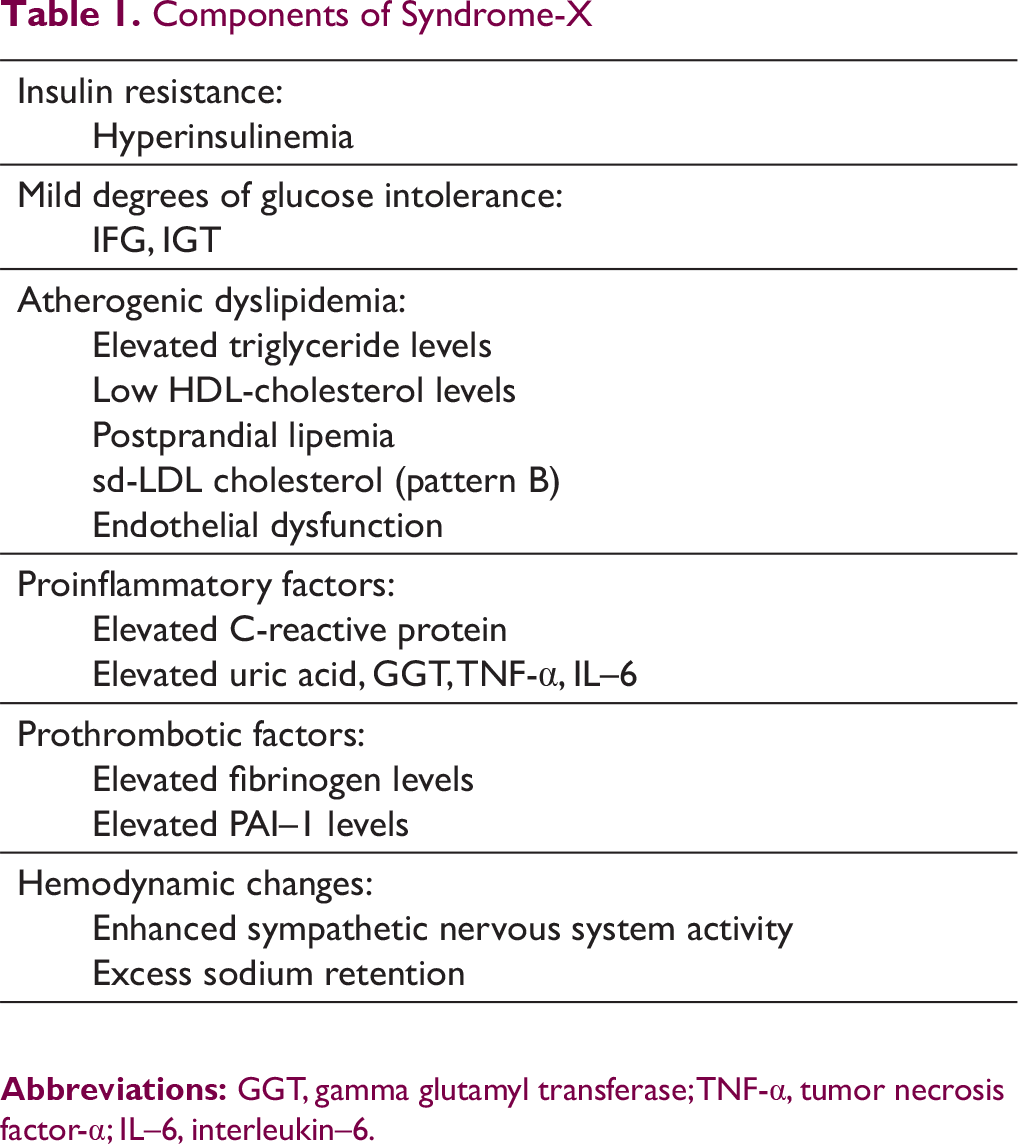
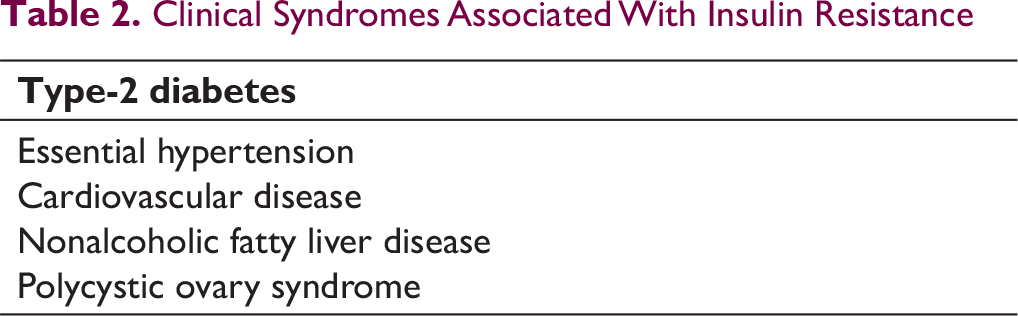
The concept was first formalized by Professor Gerald Reaven at the 1988 Banting Lecture where he presented data suggesting that insulin resistance (IR) was the underlying common factor behind several related clinical and biochemical abnormalities that predisposed to diabetes, hypertension, and coronary heart disease (CHD). 1 He suggested the moniker Syndrome X or Insulin Resistance Syndrome (IRS) for this condition (Table 1), which was characterized by minor degrees of glucose intolerance (on oral glucose tolerance test [OGTT] in healthy nondiabetic subjects), dyslipidemia, endothelial dysfunction, a procoagulant and pro-inflammatory state, hemodynamic changes, and abnormal uric acid metabolism, thus predisposing individuals to type 2 diabetes (T2D), CVD, essential hypertension, polycystic ovary syndrome (PCOS), and nonalcoholic fatty liver disease. 2
The first attempt at definition of a clinical syndrome was made by the World Health Organization in 1998 to identify these high-risk individuals and intervene early in order to reduce the associated morbidity and mortality. 3 Several other associations came out with modifications within the next decade, the aim being a definition that was simple, yet comprehensive; a consensus statement was issued in 2009. 4
Components of Syndrome-X
Clinical Syndromes Associated With Insulin Resistance
The diagnosis of MetS does confer higher risk of T2D and CVD upon affected individuals, with population-based studies finding that nearly one-sixth to one-third of adults of various populations globally qualify for this diagnosis.10-13, 14 Its proponents suggest genetic susceptibility to the syndrome with excess body fat as the underlying etiology,4, 7, 8, 15 and lifestyle modification leading to weight reduction as the cure: weight loss of approximately 11 kg brings about nearly 40% improvement in insulin-mediated glucose uptake (IMGU), contributing significantly to reducing IR and the associated biochemical abnormalities. 16
Despite the seeming consensus, there are several refined criticisms of this definition, both by Reaven himself and others.14, 17-20 These question the very need for the syndrome for several reasons:
In summary, the definition is far from resolved, the benefits of labeling the syndrome over individual risk factors are unclear or nonexistent, and there is no approved specific therapy other than the treatment of the individual conditions.
What Is Insulin Resistance?
IMGU is very variable in population, with insulin levels varying up to 6 to 8 times in healthy, nondiabetic subjects, as tested by hyperinsulinemic, euglycemic clamp studies.1, 2, 17, 19 Another technique that is validated is the insulin suppression test (IST) performed using continuous infusions of octreotide, insulin, and glucose to establish stable plasma insulin and glucose levels; the steady-state plasma glucose (SSPG) concentration provides an estimate of glucose disposal related to the specified level of insulin infused: the higher the SSPG, the more IR the subject. These 2 techniques have excellent correlation in both normal subjects and in diabetics, both obese and nonobese (r > 0.9).1, 2
IR is complicated: studies using the IST have established that most subjects with T2D are IR; surprisingly, nearly one-fourth to one-third of the healthy, nondiabetic population also has an equivalent level of IR. The EGIR defines IR as the ninetieth percentile of insulin levels in nondiabetic, lean subjects, making 10% of the lean healthy population IR. This is obviously an arbitrary cutoff, though supported by clinical studies demonstrating an increased risk of CVD in as much as the upper tertile of fasting insulin levels.2, 18, 26
Multiple studies have demonstrated the association of IR with prediabetes, atherogenic dyslipidemia (low HDL-cholesterol and/or elevated triglycerides), and hypertension.27-29 Many healthy individuals with apparently normal blood glucose levels also have IR and insulin levels that are similar to diabetic subjects.1, 2 In these healthy individuals, the excess insulin secreted by the pancreas keeps blood glucose in check, but at the cost of elevated daylong insulin levels. It is when the pancreas fails to compensate for IR that clinical diabetes ensues. However, the persistently elevated insulin levels are not benign and result in the clinical and biochemical abnormalities mentioned earlier.1, 2, 17, 18
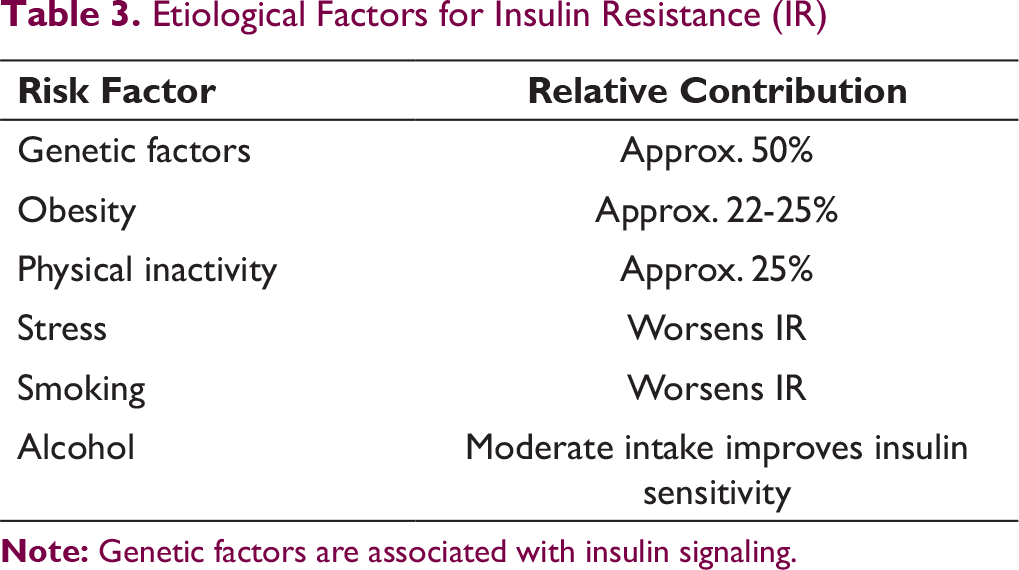
IR has multifactorial etiology (Table 3): nearly half is attributable to genetic factors, while the remaining half is related to lifestyle factors (nearly half of this is related to adiposity, about the same degree to physical activity, and variable degrees to stress, smoking, and alcohol).2, 18, 27, 28
Obesity is strongly correlated with IR, with increasing BMI predisposing to IR; however, there is no direct correlation between body weight (or visceral adiposity) and IR.2, 18, 27 As about 10% of lean individuals and one-third of obese individuals are IR; the total number of lean and overweight individuals with IR in population is nearly twice as much as obese individuals with IR, making the logic behind including obesity as a defining characteristic suspect.2, 18, 26 To complicate matters further, several populations are more IR than Europids, including South Asians and African-Americans even at normal BMI7, 30: the concept of lean MetS has also been proposed. 31 Of note, studies have established that obesity predisposes to IR and is not caused by it. 32
What Are the Metabolic and Vascular Consequences of IR and Obesity That Link Them With CVD?
Etiological Factors for Insulin Resistance (IR)
Like diabetes, MetS apparently eliminates the gender benefit with regard to CVD in females: the greater central adiposity, greater changes in lipids post menopause, stronger association of TGs with CVD risk, oral contraceptive use, gestational diabetes, and PCOS could be some of the factors responsible. 34
The cellular actions of insulin suggest putative mechanisms for enhancing the risk of CVD and acute coronary syndromes. Insulin acts by binding to its receptors, which leads to the activation of 2 parallel pathways: the phosphoinositide 3-kinase (PI3K) pathway and the mitogen-activated protein (MAP) kinase pathway. The PI3K pathway mediates most of its metabolic actions like glucose uptake in skeletal muscle and adipose tissue (through glucose transporter GLUT4) and activation of endothelial nitric oxide synthase. The MAP kinase pathway mediates endothelin–1 (ET–1) production, vascular cell adhesion molecules (VCAM–1), and E-selectin, leading to its other effects on vascular endothelium including vasoconstriction, leucocyte-endothelial interactions, and mitogenic effects on vascular smooth muscle cells. Acting through these pathways, insulin has contrasting effects on vascular tone, with the balance being neutral or vasodilatation in normal individuals.35, 36
In IR individuals, the PI3K kinase pathway is affected, while the MAP-kinase pathway is not: this change in the balance between the 2 leads to impaired glucose uptake by skeletal muscles and adipose tissue along with endothelial dysfunction due to reduction in endothelial nitric oxide synthase activity with continued ET–1 generation. 35
Obesity predisposes to IR and vascular dysfunction probably through adipokines such as tumor necrosis factor alpha (TNF-α) and interleukin–6 (IL–6), which are proinflammatory, excess-free fatty acids (FFA), and through the activation of renin angiotensin system (RAS) that is expressed in adipose tissue (which may be predisposing to hypertension). Furthermore, adiponectin, a protective adipokine, is reduced in obesity, T2D, and MetS. These changes in the adipokines and excess FFAs that are released from visceral fat act together to impair the PI3K-Akt pathway, and increase the reactive oxygen species production as well as ET–1 release. 36 Obesity (especially BMI) has been demonstrated to have direct correlation with blood pressure (BP) and the risk of hypertension,18, 19, 37, 38 probably through RAS; blocking RAS with angiotensin converting enzyme inhibitors or angiotensin receptor blockers improves insulin sensitivity and reduces the risk of new-onset diabetes in hypertensive individuals by about 25%, as does weight loss. These drugs can also block the FFA-induced impairment of endothelial function discussed above, suggesting that they act through the RAS. 36
Obesity and IR are strongly correlated: obese individuals (whether defined by waist circumference or BMI) had significantly higher SSPG (P < .001), glucose (P < .001), and triglycerides (TG) levels (P = .01) than nonobese subjects, whereas the total cholesterol, LDL-C or HDL-C, levels were similar. BMI showed a linear correlation with rising values of these parameters (BMI < 25, 25-29.9, and > 30). 37
Despite this, data from NHANES-III suggests that obesity is not an independent predictor of CHD or total mortality. 39 Another large meta-analysis of prospective studies in nearly a quarter million individuals from 17 countries also concluded that BMI, waist-to-hip ratio or waist circumference do not improve CVD risk prediction after accounting for systolic BP, diabetes, and lipids. 41 Contrarily, fasting plasma insulin levels (as a surrogate marker of IR) have been repeatedly demonstrated to be an independent predictor of CVD risk in middle-aged males in different countries.2, 28, 29, 33, 40 These findings suggest that the elusive link between obesity and CVD could be IR, and studies support the view that one-fourth to one-third of an apparently healthy population maybe IR enough to be at higher risk of CVD.2, 18
In order to evaluate the metabolic profile of obese individuals, Reaven et al divided 211 obese nondiabetic subjects into 3 groups based on their SSPG levels on the IST. The values of all established CV risk factors (except LDL-C) increased linearly depending upon the degree of IR. Thus, systolic and diastolic BP (P < .001), TGs (P < .001), HDL-C (P < .001), fasting and 2-hour plasma glucose during OGTT (P < .001), all had values that were significantly worse in the highest (most IR group) compared to the lowest SSPG tertile (most insulin sensitive group), and also compared to the intermediate group in most parameters. This emphasizes that the levels of all risk factors for CVD are much lesser in the insulin-sensitive obese subjects than in the IR obese group. Of note, nearly half the subjects in the most IR tertile had IFG, compared to only 1% of the most insulin-sensitive group, suggesting that these one-third obese subjects were at low risk of diabetes, and possibly CVD as well. This also suggests that performing an OGTT (at least a plasma glucose level 2 hours after a 75 g oral glucose load) in all overweight or obese individuals while evaluating their risk status may be particularly useful, as two-thirds of the individuals in the uppermost SSPG tertile had IGT. 42
Persistent IR with hyperinsulinemia increases the risk of prediabetes and T2D (though nearly one-fourth of the subjects with high insulin levels are insulin sensitive, while one-fourth of IR individuals have insulin levels in the normal range). 18 Studies suggest that IGT is a better marker of prediabetes than IFG for diagnostic purposes; however, the consensus definition of MetS uses a fasting glucose cutoff of > 100 mg/dL, which has much lower sensitivity compared to postmeal glucose > 140 mg/dL (2 hours after 75 g glucose load) due to the ease of diagnosis and comparison.4, 20
Hyperinsulinemia and IR variably contribute to the other consequences that are subsumed under MetS: differential insulin sensitivity of tissues apparently contributes to atherogenic dyslipidemia, hypertension, nonalcoholic fatty liver disease, and PCOS.2, 17, 43 Multiple studies also implicate prothrombotic (increased levels of fibrinogen, plasminogen activation inhibitor–1, and other coagulation factors) and proinflammatory factors (raised hs-CRP, gamma glutamyl transferase, uric acid, elevated cytokines TNF-α and IL–6, and low adiponectin) in the etiology of acute coronary syndromes.10, 20, 35 Of these, the easiest to measure is hs-CRP, which has independent correlations with IR, adipose-derived cytokines IL–6 and TNF-α, as well as CVD: levels > 3.0 mg/dL should stimulate a search for other risk factors and evaluation for specific therapies, especially statins.20, 44, 45
In summary, IR facilitates a clustering of abnormalities that contribute to CVD including prediabetes, hypertension, dyslipidemia, a procoagulant and proinflammatory state, endothelial dysfunction, and sympathetic overactivity.
2
The above features have been shown to coexist (or cluster) in genetically predisposed individuals, especially as they gain weight and/or become sedentary.2, 10 IR and BMI have good correlation, but studies demonstrate that whereas TG, HDL-C, glucose intolerance, and insulin levels expectedly correlate best with IR, other parameters such as total cholesterol, LDL-C, and BP correlate better with BMI: when IR and high BMI combine, the stage is set for a potent mix of risk factors that predispose to CVD.2, 10, 15 The correlation of IR with some specific risk factors is discussed below.
The higher the fasting TG levels, the higher the postprandial levels of other TG-rich lipoproteins (very low-density lipoprotein [VLDL], chylomicrons, and their remnants). However, postprandial lipemia is greater in IR individuals, even when they are matched for TG levels in insulin-sensitive subjects.
48
LDL particle size has been investigated but largely ignored in guidelines: individuals characterized as pattern B (smaller LDL particles < 255 A°) are apparently at higher risk of CVD compared to pattern A (larger LDL particles > 255 A°). Pattern B has been demonstrated to be closely linked to fasting TG levels over 150 mg/dL; furthermore, these individuals are also more likely to be IR, and have lower HDL-C levels.
49
The major reason for restricting saturated fats (saturated fatty acids) has been the elevation of LDL-C levels: recent studies have established that sd-LDL is lowered by their consumption, while HDL-C is elevated. This may account for the neutral effects of saturated fatty acids on CVD or total mortality in various meta-analyses.
50
A low level of HDL-C is a well-established risk factor for CVD and frequently coexists with elevated TG levels. Evidently, the higher the VLDL secretion, the greater the transfer of cholesterol from HDL to VLDL (catalyzed by cholesterol ester transfer protein) in exchange for TGs, resulting in lower HDL-C levels. In addition, the fractional catabolic rate of apoprotein A–1 is increased by hyperinsulinemia in IR individuals, leading to a further reduction in HDL-C levels.
43
This pattern of high TG and low HDL-C levels with IR/hyperinsulinemia is so predictable that a TG/HDL-C ratio > 3 is the simplest surrogate marker of IR (r = 0.6), next only to plasma insulin response to a 75 g oral glucose load (r = 0.8), when compared to the IST.
22
There are multiple population-based studies confirming and some refuting the association of hypertension with IR.51-53 The EGIR demonstrated that BP was directly related to plasma insulin levels and IR, but there was no evidence to suggest the converse (that IR may be secondary to hypertension).27, 38 The main contention against this has been the failure to demonstrate hypertension to be related to IR by the technique of factor analysis (BP appears to correlate best with BMI in these studies, possibly due to enhanced RAS activity in obesity), a finding that is probably influenced by the fact that only half of hypertensive individuals are IR.19, 20, 21, 36, 38 The major reason to look harder at this association is the weak benefit that good BP control offers in reducing CHD risk in comparison to stroke or heart failure.
38
In this regard, another study by Reaven’s group appears particularly instructive. They compared the plasma glucose and insulin responses to a 75 g oral glucose load in healthy volunteers, untreated patients with hypertension without CHD, and patients with hypertension and electrocardiographic evidence of CHD. The patients in the CHD group showed minor degrees of glucose intolerance but had significantly higher insulin and TG levels and lower HDL-C levels than the other 2 groups. Treating just the BP in these individuals did not return these metabolic abnormalities to normal values, however.
54
Data from Copenhagen Male study also suggest that individuals with dyslipidemia had CHD independent of the baseline BP levels, while systolic and diastolic BP levels correlate with CVD risk only in individuals whose lipids were normal.
55
Thus, while the entire burden of essential hypertension cannot be explained by IR, the individuals who do have IR with hypertension are at greater risk of dyslipidemia, type 2 diabetes and CVD, and need more aggressive management of risk factors. The above discussion highlights the multiple clinical and biochemical correlates of IR, and the wide variability in clinical picture of a proposed single entity. All the individual components of MetS have other causes apart from IR, but this typical clustering of risk factors (dyslipidemia, prediabetes, and hypertension) usually associated with excess adiposity occurs only in the setting of IR. Furthermore, it is individuals who are obese and IR, or hypertensive and IR, who are at the highest risk of diabetes and CVD.2, 18, 43
Is a Diagnosis of MetS or IRS Useful?
MetS appears to be an attractive clinical diagnosis, signifying risk factor clustering with excess adiposity, inviting a full workup for other risk factors, lifestyle modification involving diet, exercise and weight loss, and drug therapy for specific conditions.7, 4, 15 However, there are few, if any, unique benefits of this diagnosis.
The underlying pathology of clinical MetS as defined by the consensus statement is not single (factor analysis studies).20, 21 The attributable risk of MetS does not cover the entire spectrum of risk factors: FRS is a better predictor of 10-year CVD risk, though MetS adds information about lifetime risk.4, 20 Obesity, prediabetes, dyslipidemia, HT on their own invite a recommendation of lifestyle modification and/or drug therapy, wherever appropriate.18, 20 There is no common drug available that improves MetS or all its components. Hence, it appears futile to diagnose MetS as it is currently defined, and the best option appears to be to follow AHA’s advice to evaluate and treat individuals with any one or more risk factors as per guidelines.
On the other hand, IRS is a totally different concept. Not only does IR explain the wide variability in insulin levels in population, it accounts in large part for the clustering of risk factors that is increasingly seen in urban populations. It has strong correlation with T2D and dyslipidemia, and a lesser but convincing association with hypertension as well.2, 18, 19, 38, 43 Together, this constellation of risk factors accounts for the rising burden of CVD, especially in females. 34
The last decade has seen the focus of primary prevention of CVD shift toward lipids, especially LDL-C, with increasing emphasis on statin use as the most important step. Statins, especially rosuvastatin, are known to increase the likelihood of developing diabetes (especially in women who are at much lesser risk of CVD in the first place), a finding that should evoke concern, knowing that diabetes is one of the most important risk factors for CVD.11, 45 The weaker, still muddled concept of MetS has led to a dilution of IRS as a metabolic risk factor with direct metabolic and vascular effects and a strong association with CVD, which definitely needs greater attention in view of the above discussion.14, 18-20
Future Directions
The utility of further investigation can only lie in increased clarity about IR, its associated biochemical changes, and clinical syndromes. There is no other condition in which so many risk factors cluster together in a single individual, raising the risk for diabetes or CVD. Some of the possible lines for further investigation may include the following:
Conclusions
IR is a complex entity with many associated biochemical and clinical consequences, especially diabetes, hypertension, and CVD. MetS as currently defined is a weak concept and does not add information over and above that available with risk scoring systems like FRS. Efforts need to be made for a clear and clinically applicable definition of IRS, which will be both more applicable for routine screening and for the development of specific drug therapy.
Footnotes
Declaration of Conflicting Interests
The author declared no potential conflicts of interest with respect to the research, authorship, and/or publication of this article.
Funding
The author received no financial support for the research, authorship, and/or publication of this article.