
Abstract
Background
Hierarchical Bayesian modelling using groupings of adverse events (AEs) into system organ classes (SOC) are a set of approaches that have been proposed for analysing safety signals in clinical trials. However AEs may be the expression of more than one clinical pathology and the classification of an AE into a single SOC may not always be clear. Further, medical dictionaries may assign AEs which are difficult to classify into a generic disorders SOC. When modelling AE data using SOCs, the misclassification of an AE may lead to either a potential safety signal being missed, or a safety signal being incorrectly flagged.
Methods
We investigate the use of mixed membership models as one approach to handling this issue.
Conclusions
Results indicate that this type of approach does have a real effect on model results, and the implications are discussed.
Introduction
There is a growing body of evidence that hierarchical modelling is increasingly being used, or advocated for use, in the analysis of adverse events (AEs). 1 The classification of AEs into related groupings or System Organ Classes (SOCs) by medical dictionaries, for example MedDRA, 1 provides a hierarchical structure which lends itself naturally to (Bayesian) hierarchical modelling. Hierarchical models based around a SOC/AE relationship are typically implemented using a common group or SOC mean which allows related AEs to borrow strength in order to flag potentially rare AEs as being significant (associated with a treatment), or alternatively to shrink non-significant effects. This use of a common SOC mean has a number of implications. In particular a common group mean tacitly assumes a positive relationship between AEs within a SOC. For the case of more complicated relationships, it is hoped that the models have enough structure to capture these accurately. 2 The role of SOC membership is also crucial to the modelling process. The SOCs are pre-determined by the classification system, usually through a biological relationship, rather than through the discovery of clusters or groups of AEs by an exploratory analysis, as might be the case if the data was to be analysed with no preconceptions. Further, not all AEs have a specific single clinical pathway or pathology. 3 In these cases there may be no single SOC into which the AE naturally fits. This raises the question of how is it possible to account for this type of uncertainty within the analysis? MedDRA, for example, provides a SOC, General disorders and administration site conditions, which is used for AEs which are nonspecific or that may be related to several body-systems. This type of generic SOC does not provide a suitable grouping as there may be no actual relationship between the AEs within this SOC, defeating one of the of requirements of the hierarchical models. To handle this type of case we look at the effect of introducing mixed membership 4 into hierarchical models by way of an example using the three-level hierarchical model of Berry and Berry (BB), 5 which was an early proponent of using groupings of AEs. Here the posterior probability of an increase in treatment log-odds (θ) is used as a method of assessing whether an AE has increased rate on the treatment arm and an attractive property of the model is that it requires a relatively strong signal in order for an AE to be flagged as associated with treatment.
The aim of the study is not to suggest new models but to investigate the possible effect of mixed membership in existing approaches, and to see if this is a worthwhile addition. We find the use of mixed SOC membership has a real effect on the outcomes of the models with the probability of an AE having an increase in rate on the treatment arm varying greatly depending on the SOC(s) with which it is associated. This is one possible approach which could be implemented relatively simply in many models, and which has the potential to account for some of the issues regarding AE classification where there is uncertainty about the SOC to which an AE should belong.
Study data
Data from a GlaxoSmithKline plc (GSK) sponsored Phase III randomised clinical trial (ClinicalTrials.gov identifier: NCT00078572) is used to demonstrate the approach. AE data is available through the GSK clinical study register 2 and has been discussed previously. 2 In this trial Oedema peripheral is classified by MedDRA to be in the General disorders and administration site conditions SOC. However, Oedema peripheral may have several different causes such as renal failure or liver cirrhosis, 3 and could potentially be associated with a number of different SOCs.
Mixed membership models
We use a minor re-parameterisation of the BB model and look at two adaptations of this model to allow for mixed membership of a SOC. The first is a typical Bayesian approach assigning a prior probability of membership to each possible SOC for the AE (


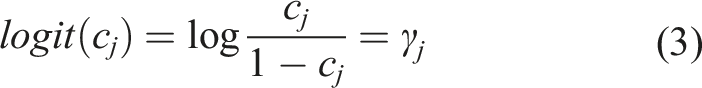
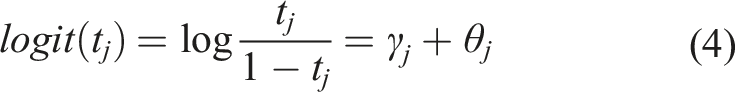
where γ j is the log-odds for AE(j) occurring in the control group, and θ j is the relative increase in the log-odds in the treatment group.
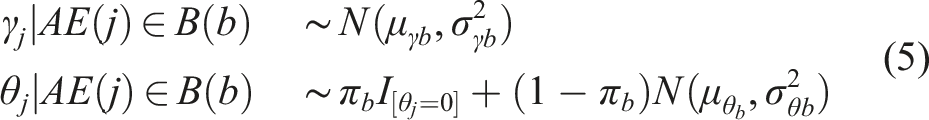
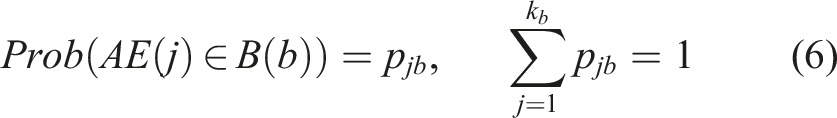
The priors for the model parameters and hyperparameters are given in equations (5)-(6).
This type of analysis leads naturally to the question of how to model an AE which is genuinely believed to be associated with more than one SOC. Hierarchical structures such as those in the Berry and Berry and similar models naturally support borrowing strength between AEs within a SOC, with the SOCs themselves (weakly
2
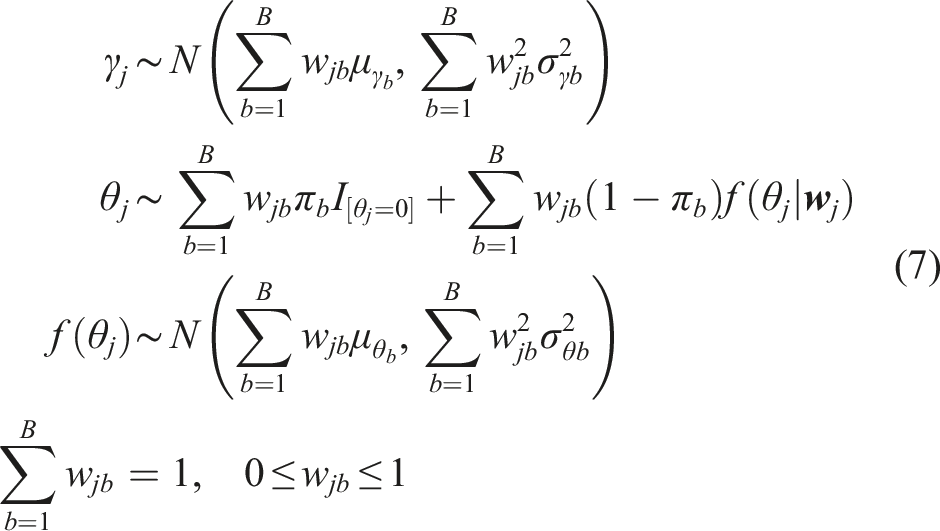
) borrowing strength from each other through a shared overall distribution.5–7 This structure does not lend itself naturally to a shared model of SOC membership for AEs. A second approach is to define a set of SOCs for each AE for which it is expected that the SOC will have some effect on the AE, and then consider how this may be modelled within the hierarchical structure. A relatively simple approach is to consider a mixed membership model as weighted contributions for the effects of different SOCs for AEs for which it is expected that a dependency on multiple SOCs may exist. A typical implementation of this type of model would be to consider γ
j
as a sample from a normal distribution whose mean is a weighted sum of individual SOC means. For θ
j
the situation is complicated by the presence of the point-mass term. Here we must weight each contribution of the mixture in order to keep the BB model property of the point-mass effect. In this case a very simple extension of the BB model is then (
The models may be implemented in the
Results
We investigate the case where the AE Oedema peripheral is considered to be a member of more than on SOC. In the trial EGF100151, Oedema peripheral has an incidence rate of 7 out of 191 on the control arm versus 17 out of 210 on the treatment arm, and a p-value of 0.090 for a two-sided Fisher exact test and 0.047 for a one-sided test (for increased incidence rate on the treatment arm). The SOC General disorders and administration site conditions contains 31 AEs none of which, apart from Oedema peripheral, are significant for a one-sided or two-sided Fisher exact test at the 5% level.
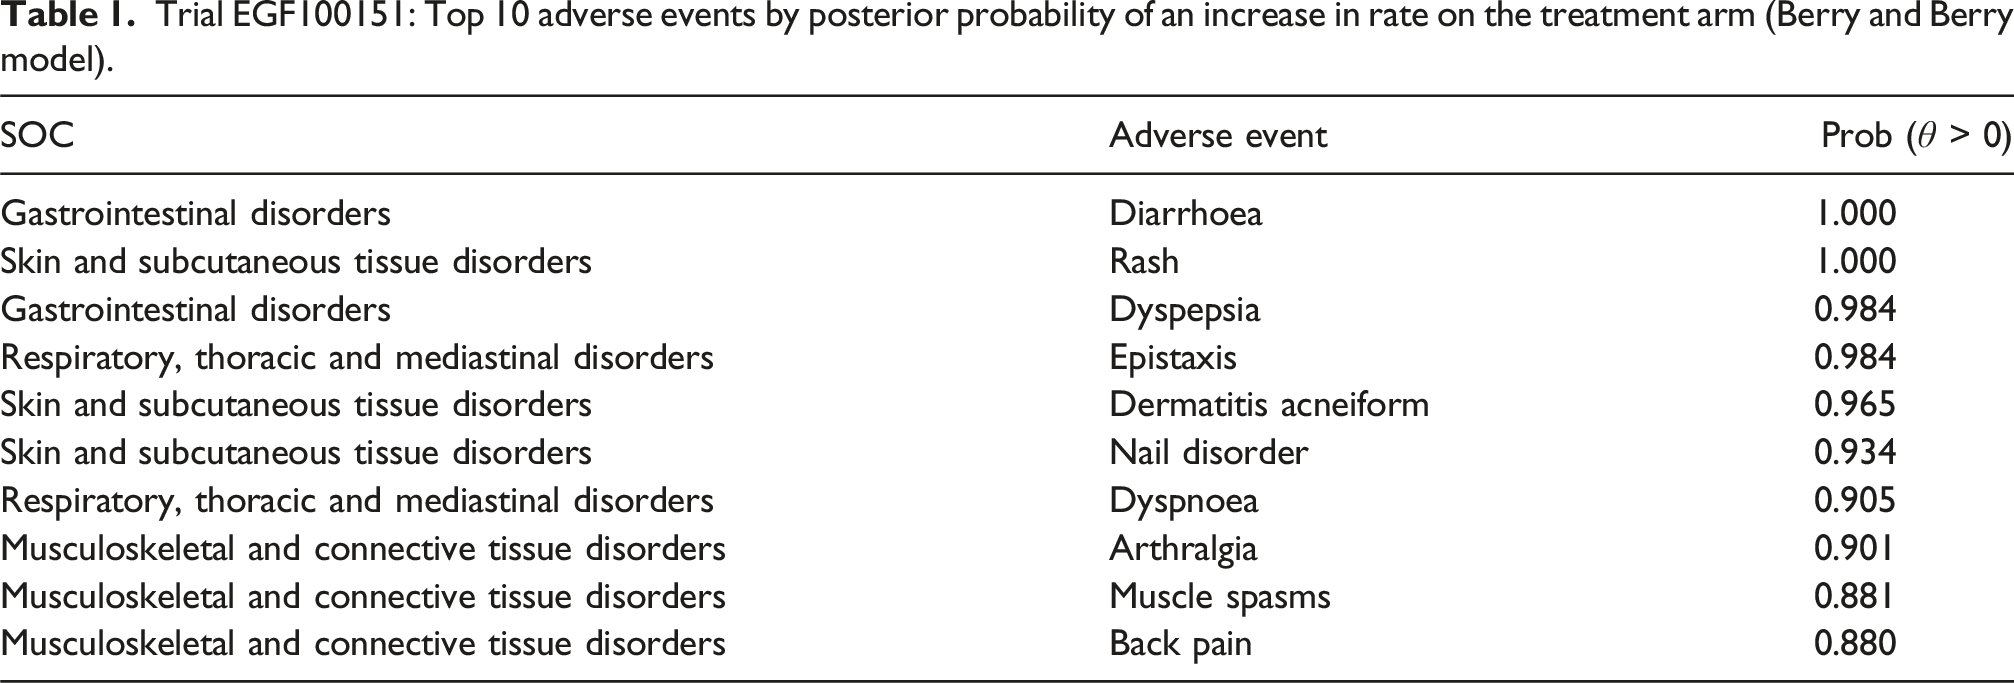
Trial EGF100151: Top 10 adverse events by posterior probability of an increase in rate on the treatment arm (Berry and Berry model).
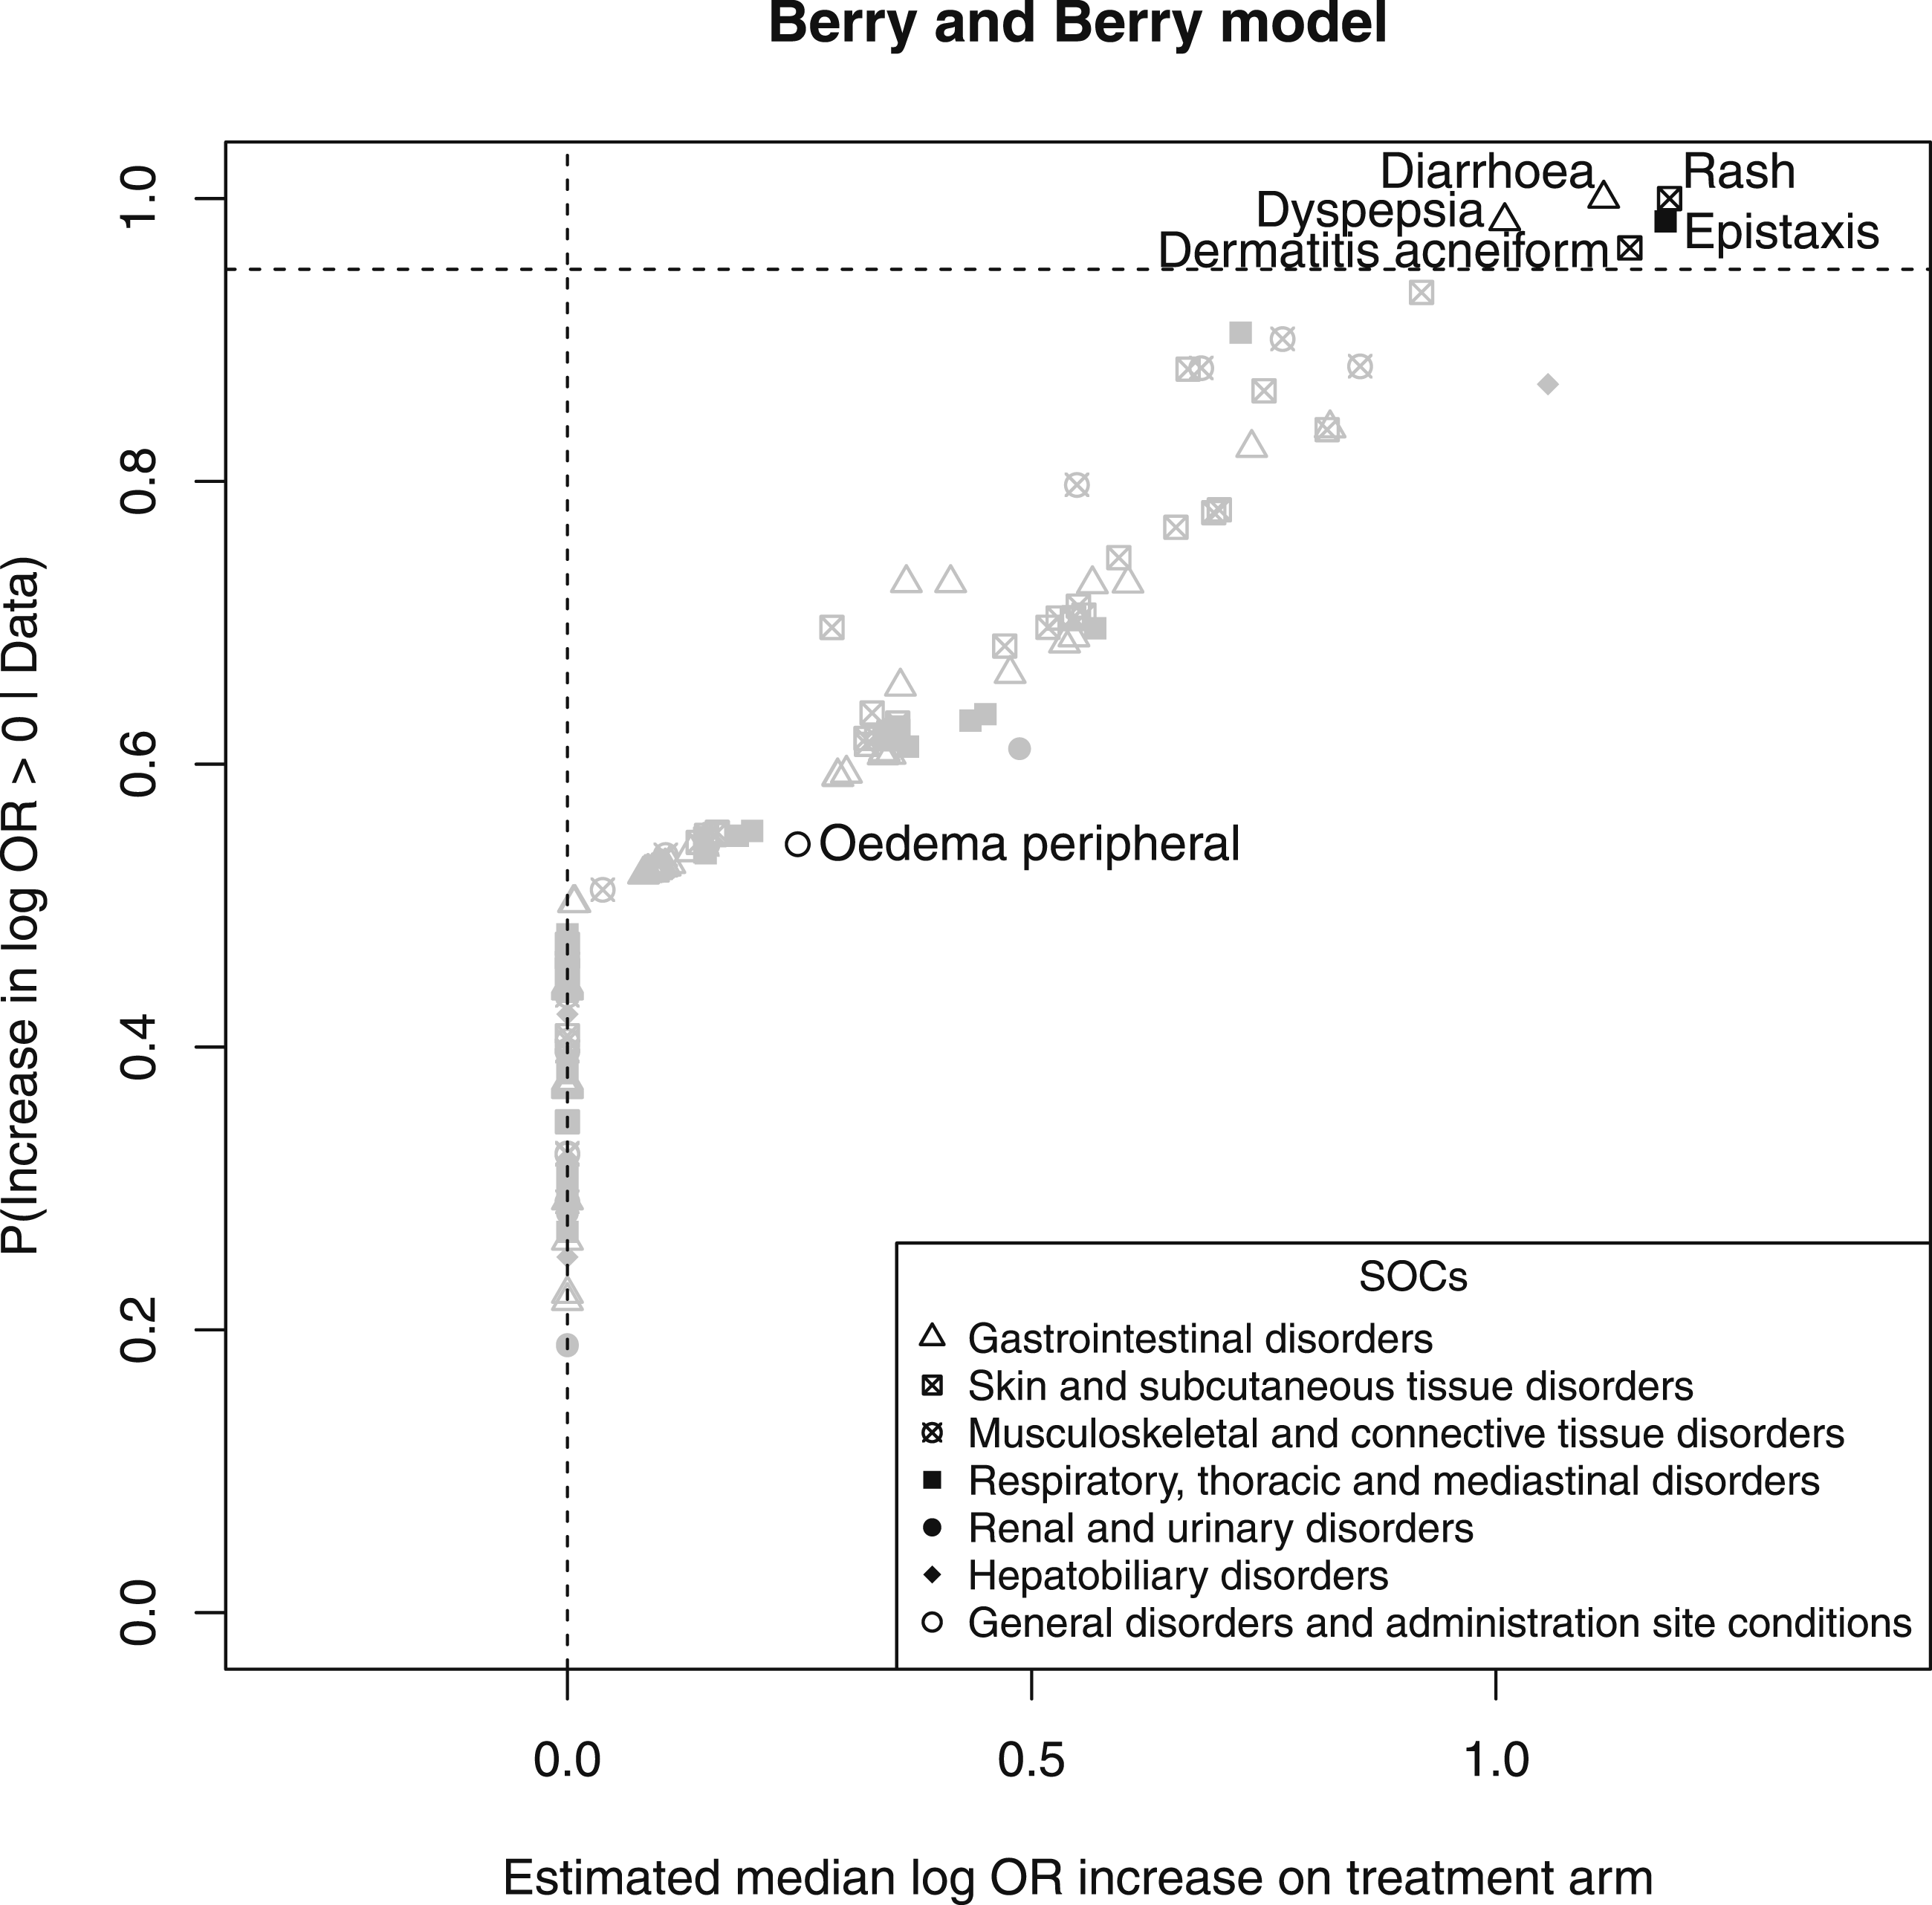
Plot of the posterior median increase in log odds-ratio (OR) versus the posterior probability of an increase for all AEs.
The clinical trial data is reanalysed using model 1 and model 2 above. We look at two cases, one where there is doubt about which SOC Oedema peripheral belongs to (analysed by model 1), and one where it is now considered that Oedema peripheral is affected by more than one SOC (analysed by model 2). Clinical input and subject knowledge is of primary importance when choosing the SOCs, prior probabilities p jb , and weights w jb for the AEs. For our purposes we assume the SOCs are Renal and urinary disorders, Hepatobiliary disorders and Skin and subcutaneous tissue disorders.
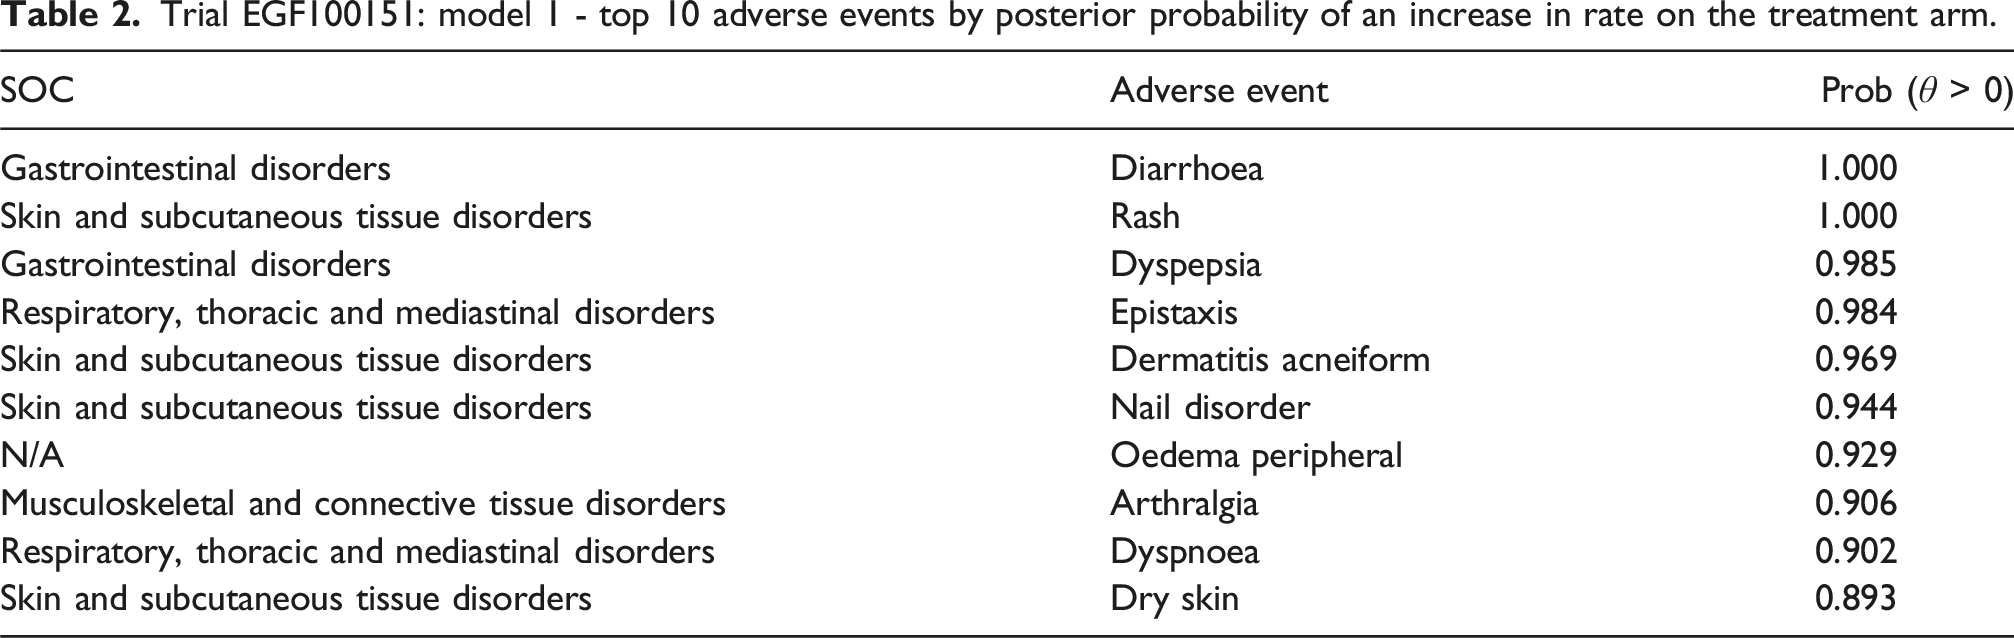
Trial EGF100151: model 1 - top 10 adverse events by posterior probability of an increase in rate on the treatment arm.
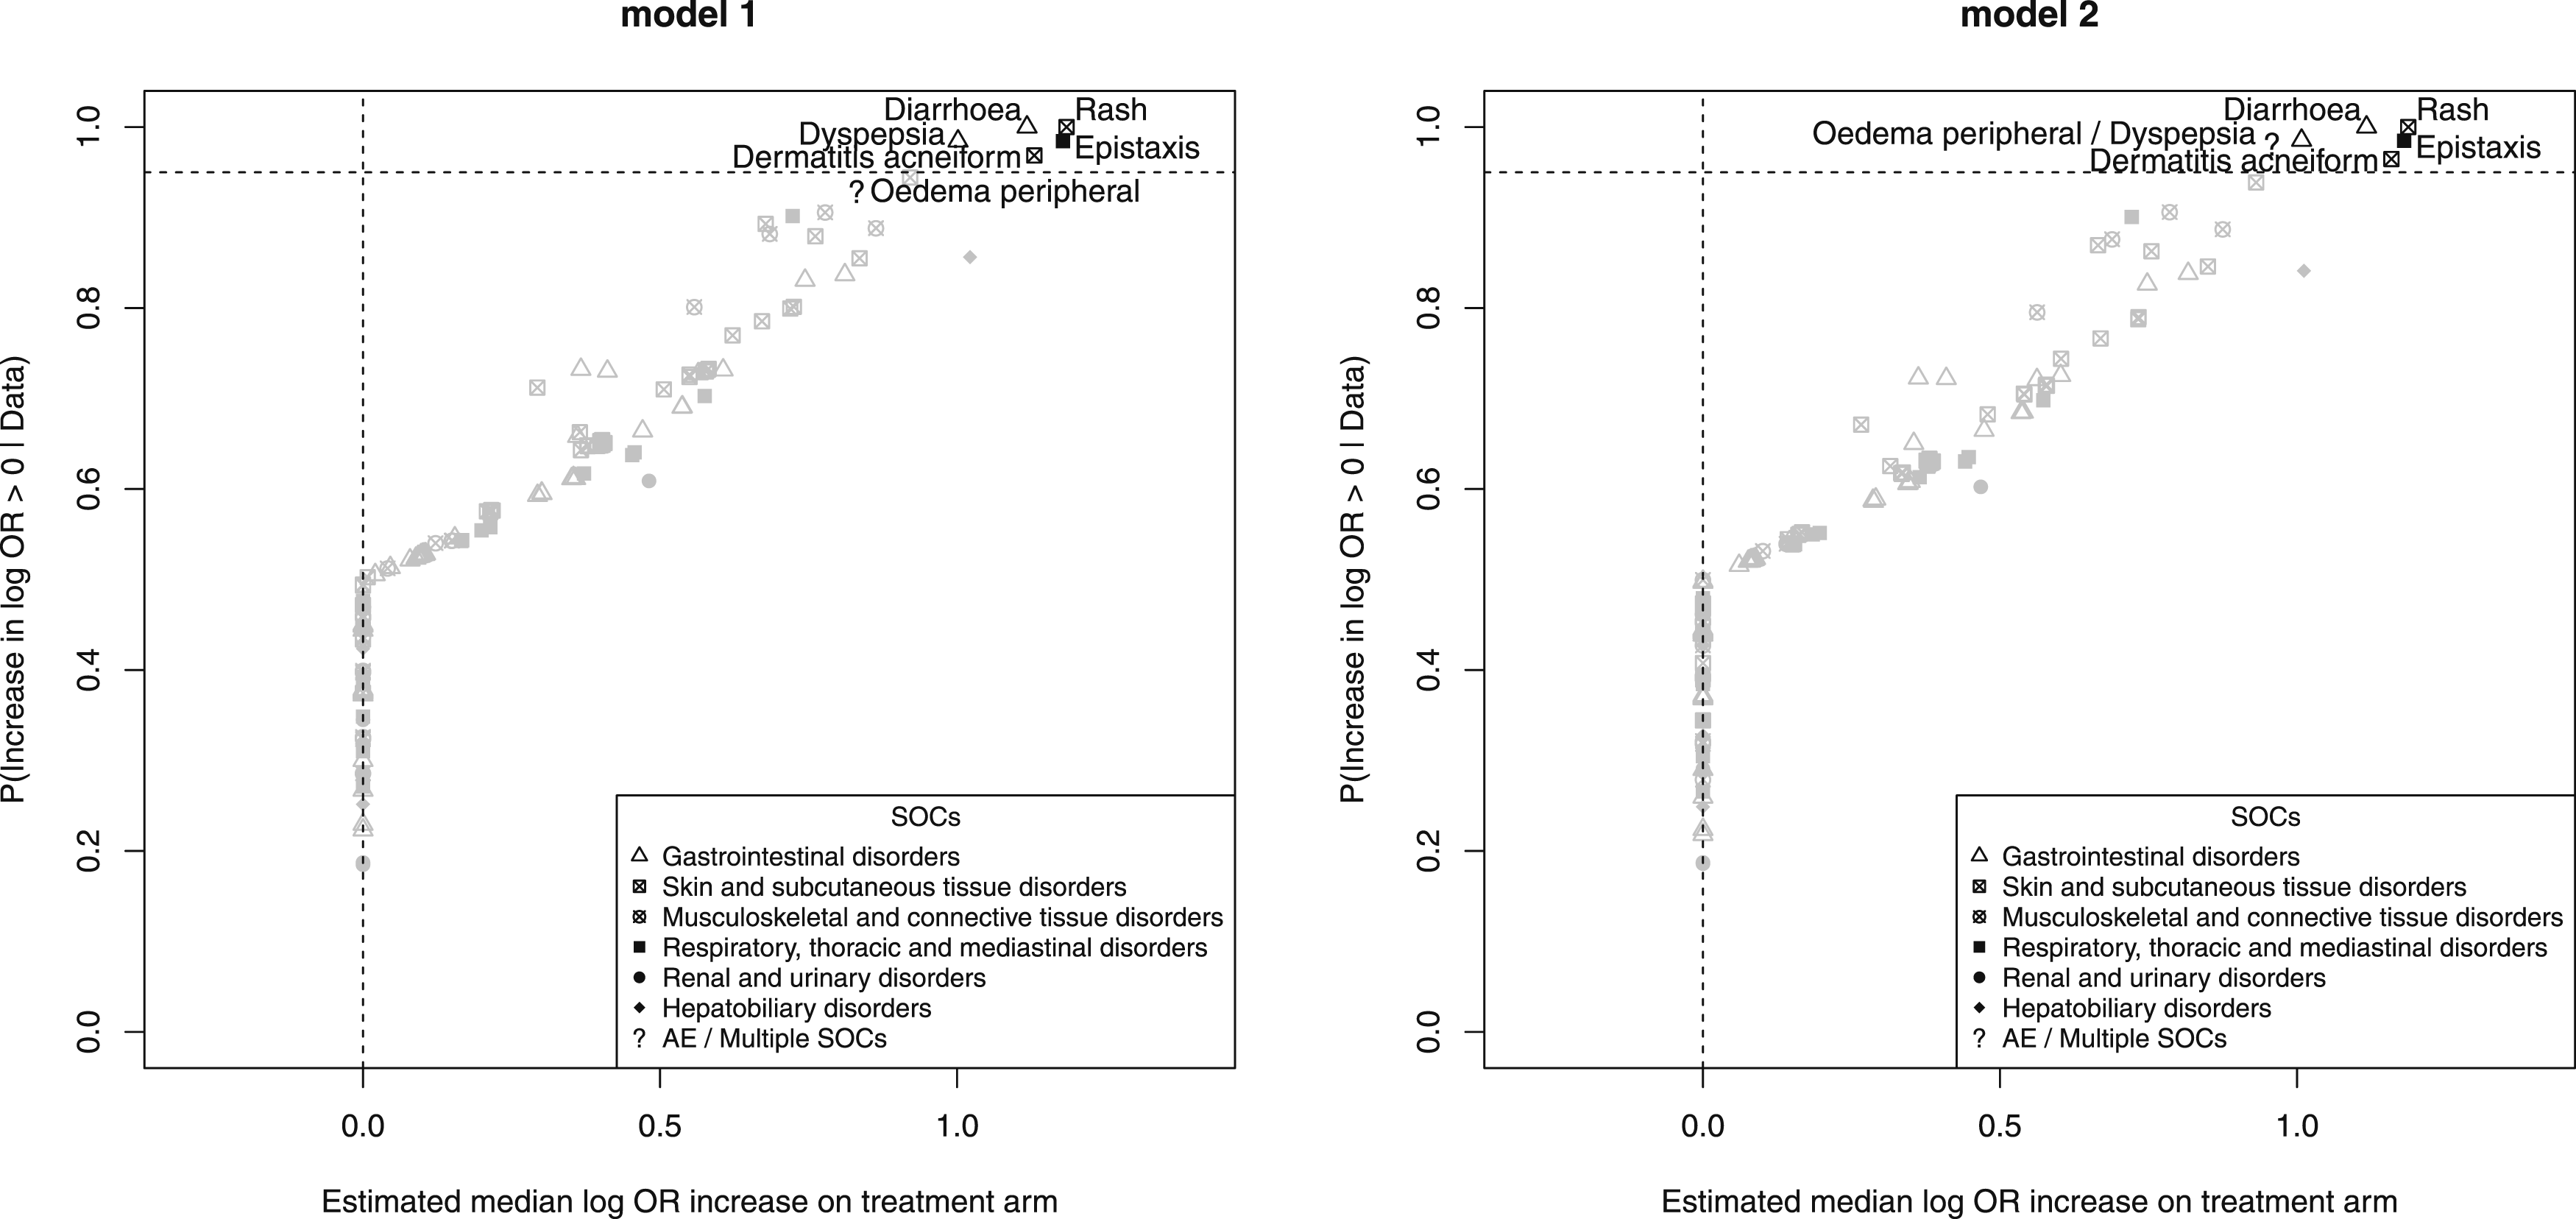
Plot of the posterior median increase in log odds-ratio (OR) versus the posterior probability of an increase for all AEs.
Comparing Table 2 to Table 1 there are changes in the top 10 AEs. Muscle spasms and Back pain have dropped out of the top 10 for model 1, although their posterior probabilities are 0.888 and 0.882 respectively, and been replaced by Dry skin, posterior probability 0.893, and Oedema peripheral which now has a posterior probability of 0.929 of a positive increase in rate on the treatment arm, compared to 0.544 for the model where Oedema peripheral was in General disorders and administration site conditions. This is a large increase in posterior probability and shows the importance the choice of SOC can make when deciding to flag an AE as being potentially associated with a treatment.
Trial EGF100151: model 2 - top 10 adverse events by posterior probability of an increase in rate on the treatment arm.
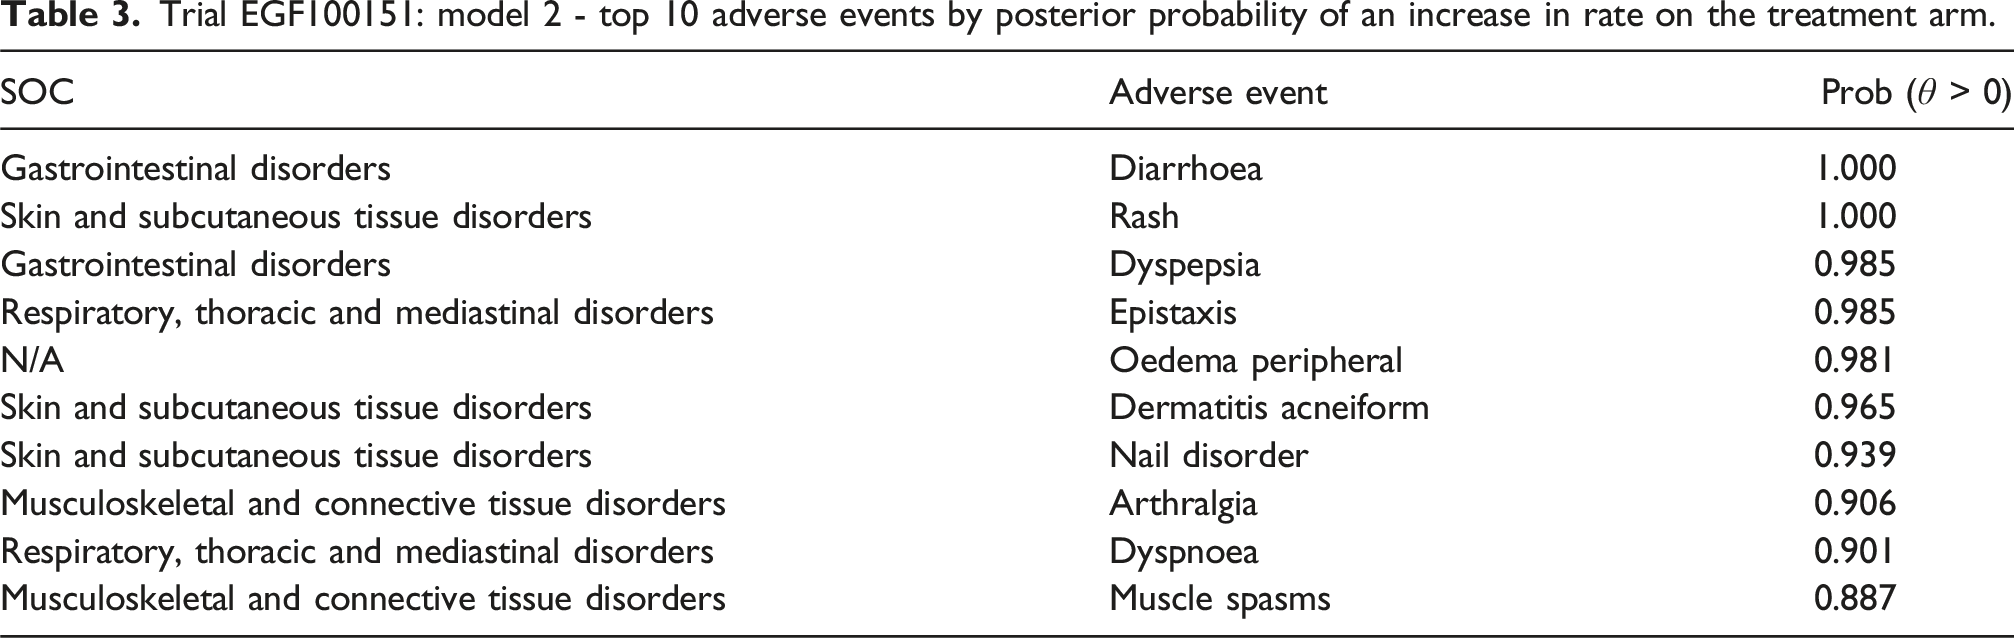
Again the top 10 AEs are very similar to the other models, but Oedema peripheral has an even higher posterior probability than for model 1, indicating the difference between the models with regard to how mixed membership is implemented. Model 2 does not take into account any doubt about the SOCs to which an AE may belong. The effect of varying the weights for model 2 is investigated in a small sensitivity study included in the Supplemental Material.
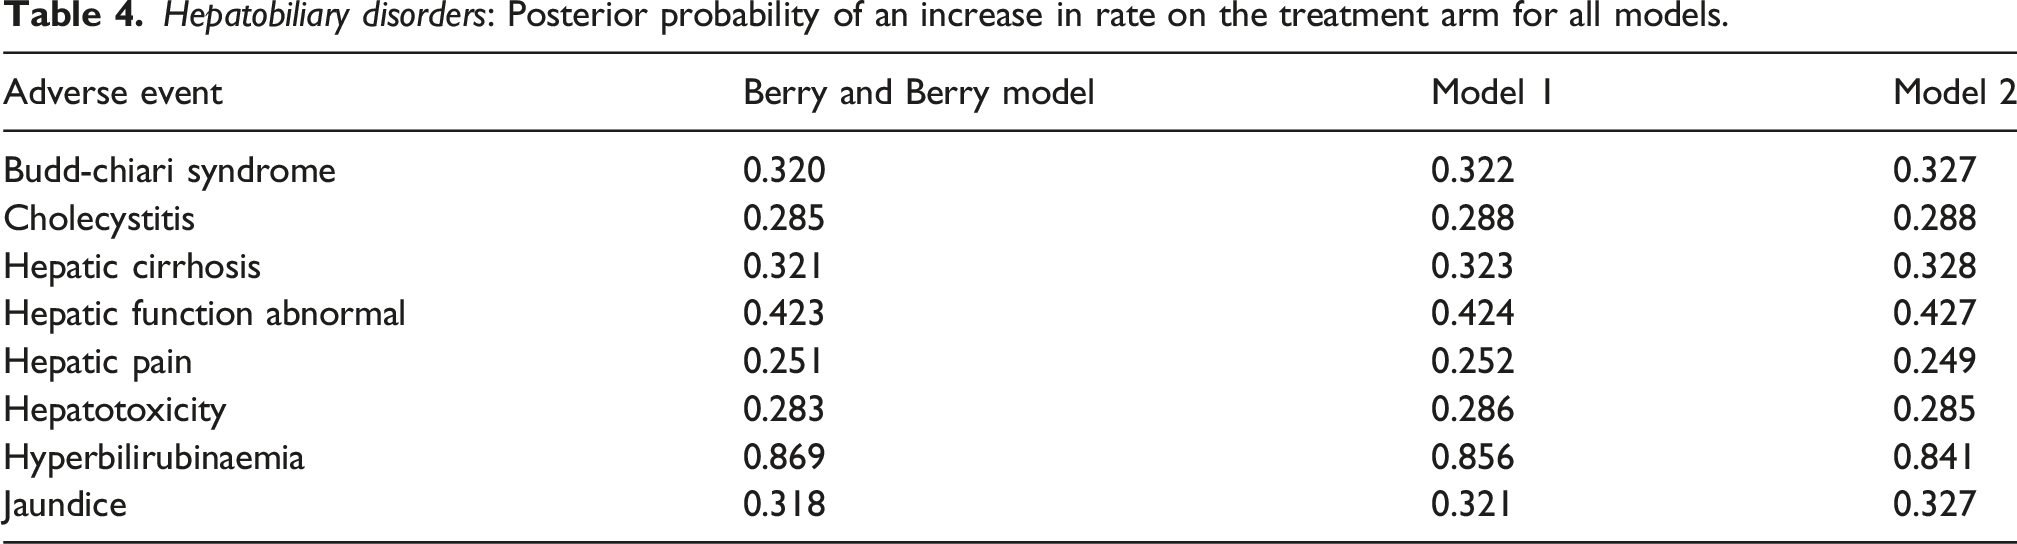
Hepatobiliary disorders: Posterior probability of an increase in rate on the treatment arm for all models.
Discussion
High dimensionality, low event rates, and low power to detect treatment differences are among the challenges of detecting safety signals in clinical trials. Appropriate statistical methods, such as hierarchical Bayesian models, address some of these issues and may be used to help characterise the safety profile of a drug. The availability of software packages such as
The development of methods for the statistical analysis of adverse events continues to be an area of active research,10–12 but regardless of approach, any method which requires a choice of AEs and their assignment to SOCs for the analysis, requires careful consideration. While medical dictionaries provide groupings of AEs into SOCs there may be a number of AEs which do not fit easily into a single SOC. One approach is to assign these AEs to a separate general SOC, such as General disorders and administration site conditions in MedDRA. This highlights our first modelling issue: if the AEs within a SOC have no biological relationship using them in a grouped analysis is counterproductive. In the case of Oedema peripheral we can see that its posterior probability of being associated with treatment is 0.544 while a member of this SOC. This is due in the main to the fact that other AEs in the SOC General disorders and administration site conditions are low incidence. For those AEs for which a clinical pathology exists, and which should be included in the statistical modelling, we need to find a way of meaningfully including them in the analysis.
Our second potential modelling issue is: if it is possible that an AE may be classified in one of two or more SOCs, or influenced by more than one SOC, then unless we use a mixed membership or similar approach, we are left with a choice of deciding which SOC is more suitable, or will have the most influence on the AE. The alternative of mixed membership approaches, as presented here, are to assign prior probabilities to the AE for membership of the SOCs on which the AE may have some dependence (model 1), or to explicitly include these effects in the model (model 2). In either case this allows a number of SOCs to contribute in some way to the modelling of the AE incidence rate. The other AEs in these SOCs will have a shrinkage or strengthening effect depending on whether incidence rates are raised or not raised in these SOCs.
We have seen that classifying Oedema peripheral into the General disorders and administration site conditions SOC does have an effect on the model results and that if we account for the uncertainty about the SOC to which an AE belongs in the model then the results are changed. In our case for the AE Oedema peripheral the posterior probability of an increase in incidence rate goes from 0.544 to 0.929 for model 1, and to 0.981 for model 2, very large increases. These results are demonstrative only and clearly when making an adjustment to the structure of the AE/SOC hierarchy very careful consideration needs to be given to the choice of SOCs with which to associate an AE.
Conclusion
Returning to the issues we considered in the introduction, the use of a generic SOC such as General disorders and administration site conditions is not suitable for modelling and alternatives should be considered. For Bayesian hierarchical models which model AE/SOC membership, alternatives such as mixed membership models may provide a relatively simple extension for some models which is capable of taking multiple SOC membership into account. However, mixed membership requires a number of additional assumptions. In particular, for model 2 above, we have tacitly assumed an additive structure for the multiple SOC membership. This may not always be the case and whether this is a reasonable assumption is dependent on the data and clinical assessment. Further, while model 1 gives similar results to model 2 for our data analysis, the philosophy behind the two models is different. Model 1 is a fully Bayesian extension of the existing model, taking into account the uncertainty around group membership. Model 2 on the other hand is a statement of our membership beliefs. This is reflected in the stronger signal for Oedema peripheral in model 2. Which approach may be more suitable is again a decision which needs to be informed by clinical opinion and, with the appropriate clinical guidance, mixed membership may be a worthwhile addition to modelling AE data.
Supplemental material
Supplemental material - Mixed membership effects in adverse event Bayesian hierarchical modelling
Supplemental Material for Mixed membership effects in adverse event Bayesian hierarchical modelling by Raymond Carragher in Research Methods in Medicine & Health Sciences.
Supplemental material
Supplemental material - Mixed membership effects in adverse event Bayesian hierarchical modelling
Supplemental Material for Mixed membership effects in adverse event Bayesian hierarchical modelling by Raymond Carragher in Research Methods in Medicine & Health Sciences.
Supplemental material
Supplemental material - Mixed membership effects in adverse event Bayesian hierarchical modelling
Supplemental Material for Mixed membership effects in adverse event Bayesian hierarchical modelling by Raymond Carragher in Research Methods in Medicine & Health Sciences.
Supplemental material
Supplemental material - Mixed membership effects in adverse event Bayesian hierarchical modelling
Supplemental Material for Mixed membership effects in adverse event Bayesian hierarchical modelling by Raymond Carragher in Research Methods in Medicine & Health Sciences.
Footnotes
Funding
The authors disclosed receipt of the following financial support for the research, authorship, and/or publication of this article: This work was supported by the Engineering and Physical Sciences Research Council (EPSRC) [award reference 1521741] and Frontier Science (Scotland) Ltd, and by Health Data Research (HDR) (UK) (Medical Research Council (UK) award reference: MR/S003967/1).
Declaration of conflicting interests
The authors declared no potential conflicts of interest with respect to the research, authorship, and/or publication of this article.
Supplemental material
Supplemental material for this article is available online.
The supplementary material for this paper contains the models in the
Notes
References
Supplementary Material
Please find the following supplemental material available below.
For Open Access articles published under a Creative Commons License, all supplemental material carries the same license as the article it is associated with.
For non-Open Access articles published, all supplemental material carries a non-exclusive license, and permission requests for re-use of supplemental material or any part of supplemental material shall be sent directly to the copyright owner as specified in the copyright notice associated with the article.