
Abstract
Understanding long-term patient outcomes (PROs) following surgery requires an efficacious survey methodology. Leveraging a statewide hernia surgery registry to establish a sampling frame, we conducted a 1-year post-operative survey using measures of patient-reported hernia recurrence (the Ventral Hernia Recurrence Inventory), pain (the PROMIS Pain Intensity 3a), and quality of life (the HerQLes scale). Our responsive design approach varied invitation and reminder contact modes and incentive offer across multiple design phases, with the goal of minimizing non-response bias and maximizing cost effectiveness. Outcomes included: contact and response rates (%); item non-response (%); and the association between reminders and incentive offer with response rates, respondent characteristics, and item non-response (%). Differences in demographic and clinical characteristics of respondents and non-respondents were investigated and adjusted using registry data. Of 7062 patients who received hernia surgery between January 2020 and March 2022, 6068 were sampled, 5645 were contacted (contact rate 93.0%), and 1816 responded to the survey (overall response rate 29.9%). Response rates by cohort were 42.3%, 32.5%, 25.2%, and 25.9%, with overall low item non-response. Response rates increased with number of reminders, but with diminishing returns over time; offer of postpaid incentive over no incentive did not significantly improve response rates or influence item non-response. Weighted respondents were comparable to the survey population. We illustrate a strategy to maximize response rate amongst surgical patients and evaluate the representativeness of long-term PROs using a sample-based registry, targeted multi-mode contact methods, and weighting adjustment methods.
Keywords
Background
Collection of long-term patient reported outcomes (PROs) data following ventral hernia repair remains the Achilles heel of hernia repair quality improvement efforts. Long-term patient reported outcomes on recurrence and pain symptoms are integral to improve shared decision making between patients and their surgeons regarding pursuit of operative hernia repair,1,2 yet such data require significant long-term follow-up and integration with claims data to collect quantitative PRO metrics. We are currently failing at this type of measurement. 3 First, outcomes are not being measured for long enough: most outcomes data exist only in the short term (e.g., 30-days complications), despite the importance of the long-term patient experience for shared decision-making in preference-sensitive and quality-of-life surgeries.4–7 Second, there are inherent disadvantages to the outcomes as measured currently: hernia recurrence, for example, is typically measured based on rates of re-repair from claims data,8–10 without input from patients who don’t seek reoperations and who may have different experiences5,10–13; or is measured using survey methodologies unequipped to evaluate the magnitude of nonresponse bias. The lack of long-term data for one of the most common ambulatory surgeries in Michigan, 14 the United States,15,16 and the world 17 leaves surgeons at a disadvantage to deliver care in line with what matters to patients. 1
To meet this gap for long-term outcomes data with proper evaluations, the Core Optimization Hernia Registry (COHR) was founded on January 1, 2020, as a special project of the Michigan Surgical Quality Collaborative (MSQC). 4 COHR builds upon a “culture” of clinical hernia registries globally, 18 yet many other registries suffer from low rates of follow-up, retrospective and/or single institution design,10,19 voluntary reporting requirements,20,21 or a lack of generalizability to a US patient population.1,4,21–23 COHR was established with two objectives: to expand statewide MSQC data to include prospective collection of hernia-specific process and outcome variables, 4 and to introduce validated measures of PROs to study long-term hernia recurrence, pain, and quality of life. To achieve the latter, the MSQC-COHR launched an effort to capture validated and representative long-term PROs in a hernia repair population using responsive survey design and this paper describes these efforts.
The MSQC-COHR was a prime sampling frame within which to run a survey. The MSQC’s network of statewide clinical data collection provided a population-based cohort and the necessary infrastructure to standardize our process for replicability and maximize data quality. Further, the richness of auxiliary data on patients contained within the registry meant that, in analysis of survey results, we did not have to rely on typical techniques to manage blind non-response. As a result, our study enhances the literature of survey non-response amongst surgical patients and contributes to the methodology for long-term collection of PROs from surgical patients. Finally, our use of responsive survey design, where design characteristics were varied across multiple survey phases and key outcomes were constantly analyzed for successive adaptation, 24 was particularly relevant in the post-operative space where predictors of survey response and the effectiveness of various contact modes to achieve representativeness are understudied.25–27
We describe our efforts to launch this survey initiative, conduct iterative refinement over time, and attain meaningful follow-up for patients in a statewide clinical hernia registry. We took particular interest in reducing non-response bias while also minimizing costs and ensuring internal and external validity of our survey.28,29 In this work we present best survey practices for a surgical patient population and open the door for future efforts to study long-term PROs in other preference-sensitive surgeries, such as gynecology, orthopedics, and vascular.
Methods
Target population
Our target population consisted of all patients who underwent operative hernia repair in the State of Michigan. To study this population, we utilized data from the MSQC, a partnership between Blue Cross Blue Shield of Michigan/Blue Care Network, the American College of Surgeons (ACS), and hospitals within the state of Michigan.30,31 MSQC operates a clinical quality improvement registry that utilizes the infrastructure of the ACS National Surgical Quality Improvement Program (NSQIP) to prospectively collect data from a diverse set of (as of 2023) 69 member hospitals in Michigan (https://msqc.org/), representing over 90% of all general and vascular surgical procedures performed across the state. These cases are then sampled using a proprietary algorithm to minimize selection bias while ensuring a population-based representative sample of all surgical cases performed in the state.4,32 Registered nurses are trained as Surgical Clinical Quality Reviewers (SCQRs) to perform data abstraction of entire electronic medical records, including operative notes, which are regularly assessed to ensure validity and reliability. 4 Data captured in the registry includes patient demographic information, perioperative information, and 30 and 90-days clinical and patient reported outcomes. 32 Individual hospital and physician data cannot be identified in the MSQC registry.30,31 Over 23,400 patients who underwent operative hernia repair in the State of Michigan since 2019 have been captured in the MSQC.
Beginning in 2020, COHR expanded statewide MSQC data to prospectively collect operative characteristics, patient comorbidities, and postoperative surgical complications linked to hernia-relevant Current Procedural Terminology (CPT) codes30,31 as well as hernia-specific process and outcome quality variables such as hernia location, size of hernia, mesh use and type, and surgical approach 4 (Appendix). The capture of these data elements provides a more complete picture of hernia repair within the State of Michigan. Since its inception, the COHR has captured nuanced data on over 15,400 hernia repair patients from across the entire MSQC network. Our study population thus consisted of all operative hernia repair patients in the State of Michigan captured in the MSQC-COHR since 2020, when hernia-specific data collection began.
For our study’s sampling frame, we targeted all patients captured in the MSQC-COHR database over 18 years of age and who underwent open, laparoscopic, or robotic ventral and incisional hernia repair as determined by CPT codes (Appendix) between January 2, 2020, and March 31, 2022 (hereafter “COHR patients”). We sequentially defined four operative cohorts in order to target with surveys all eligible MSQC-COHR patients at 1-year post-operation. Through this design, each of our cohorts represented the extant MSQC-COHR population, thus achieving a population-based representative sample of hernia patients in the State of Michigan.29,33
Data quality in the context of measurement of PROs
Strategies for the measurement of PROs has been inconsistent across clinical specialties. In specialties where long-term follow-up is standard (e.g., cardiology, orthopedics, bariatrics), measurement has been integrated into clinical workflow.2,34,35 However, in hernia, follow-up beyond the immediate recovery period is uncommon. Hernia patients who experience operative complications or recurrence may decide not to re-present, 13 potentially due to obstacles to appearing in clinic like financial cost, distance to travel, and time required.35,36 If patients do seek follow-up, they may not present to their initial operating surgeon or institution. 21 In this context, surveys can remotely collect long-term PROs from surgical patients in a more cost-effective manner,25,26,35–38 even into the extended post-operative period when follow up is increasingly less likely despite an increasing risk of hernia recurrence over time. 1 Finally, survey methodology provides us with the means to evaluate the representation and measurement properties of estimates simultaneously under cost constraints.26,35,36,38
Responsive survey design
Following the principles of responsive design described by Groves and Heeringa (2006), we identified pre-hoc multiple design features most likely to influence our key outcomes of non-response bias and cost-effectiveness: survey contact mode, number of reminders, and offer of incentive. Thus, across four operative cohorts drawn sequentially from the MSQC-COHR, we tested specific combinations of design characteristics in successive phases of our responsive survey design. 27 Across phases, we were able to evaluate the trade-offs of each strategy between comparable cohorts and iteratively adapt our survey approach. 24
Our first design feature of interest was survey contact mode. In the context of a large registry, an electronic mode such as email or short message service (SMS) is appealing for being less time and cost-intensive to administer (particularly with regard to full time equivalent (FTE) staffing costs), and for the potential to automatically incorporate results into patient charts. 39 This choice of survey contact mode was also encouraged by literature on the post-operative measurement of PROs, as prior studies have established both the effectiveness25,35,37 and non-inferiority26,39 of electronic modes to paper (“snail mail”) contact modes when distributed at 1-year post-operation to a surgical cohort. However, due to potential differences in contact information available in the registry, the benefits to participation of multimodal strategies, and evidence of the effectiveness of telephone calls for PRO collection amongst surgical patients,25,35,37 we elected to test three modes of contact to maximize sample representativeness and decrease coverage error: email, SMS, and phone call.1,40–42 In addition, individuals were invited to complete surveys by either (a) email, (b) email and SMS, or (c) telephone based on mode of contact available in the patient chart and based on the design features of the survey phase (Appendix). For (b), individuals received concurrent invitations through each modality. Electronic (email, SMS) invitations included an individually customized link to complete the survey via Qualtrics (Qualtrics, Provo, UT). For (c), phone invitations to complete a survey were delivered verbally by callers, and callers then read aloud the Qualtrics survey word-for-word.
Second, we tested across phases the number of maximum contact attempts (i.e., reminders), following prior literature.13,39,43 Every individual who did not respond to the first invitation received at least one reminder, and all individuals with telephone numbers were eligible for phone call reminders in addition to the original mode of contact. 43 For all patients, the number of contact attempts and their cooperation (e.g., refusal) were tracked by team members. 44 Team members varied the time and day of the week at which they conducted phone calls to maximize capture of patients. Over our 26-months survey period, our staff consisted of one survey manager (JY), one lab manager (AH), one data manager (YC), one data analyst (AK), and six total interviewers. We considered cost effectiveness in terms of the FTE (i.e., staffing) cost of telephone contact mode and number of telephone reminders.
Our third survey design feature of interest was incentive provision. Incentive provision is widely understood to increase survey participation, 45 including for surgical patients, 25 and thus reduce nonresponse bias33,46 that might arise when there are differences in survey responses between respondents and non-respondents as multiplied by the non-response rate. 45 We tested the effect of provision of a post-paid incentive on non-response bias and cost effectiveness in two phases.
Survey cohorts and design phases
Detailed information on each cohort and corresponding survey design phase appears in the Appendix. Cases in the
Following responsive design principles, we designed a two-phase sampling approach for non-response.
24
Patients in the P1 cohort who failed to respond by the final contact wave were rolled into a sub-cohort (
Three cohorts were subsequently drawn which captured patients from all MSQC-COHR hospitals. Our second cohort (
Survey questionnaire
The survey used one generic and two hernia-specific validated patient reported outcomes measures (PROMs) 47 : (a) the Ventral Hernia Recurrence Inventory (VHRI)1,36; (b) the Patient-Reported Outcome Measurement Information System (PROMIS) Pain Intensity 3a23,48; and (c) the Hernia-Related Quality-of-Life (HerQLes) scale. 49 These specific instruments measure patient-reported hernia recurrence, pain, and abdominal function and quality of life outcomes to generate a more wholistic view of the patient experience after surgery.1,10 With these three PROMs, the survey included a total of 18 questions (Table A6), of which one was potentially sensitive. The questionnaire included an informed consent statement in the introduction page that participants were required to acknowledge prior to proceeding. The questionnaire was available only in English and individuals with language barriers determined at the time of interview were considered to be non-respondents. More information on the survey questionnaire is available in the Appendix.
Case definitions
We followed case definitions in accordance with the American Association for Public Opinion Research (AAPOR) disposition guidelines. 50 More information can be found in the Appendix. All surveys that were non-deliverable were excluded from all analyses except delivery rate.
Statistical analysis
Across the entire study, we evaluated the following outcomes: (a) contact rate; (b) follow-up time; (c) response rate; and (d) item non-response. Follow-up time was calculated amongst respondents as the difference in months between an individual’s date of hernia operation and their date of survey response and was measured to determine how close to 1-year post-operation we were measuring PROs, in order to better understand the risk of hernia recurrence with time. Item non-response was defined as complete survey response (100% completion) or partial survey response (≥75% completion of all PROMs).
With regard to our responsive design evaluation, our analysis focused on key outcomes (non-response bias and cost effectiveness) that we anticipated would vary depending on three key design characteristics (contact mode, number of reminders, and incentive offer). We investigated the following outcomes related to survey contact mode: (a) contact information availability in the registry; (b) differences in age, sex, race, ethnicity, and hospital locality (urban/rural) by (i) mode of contact available (i.e., sample representativeness by mode) and by (ii) mode of response (amongst respondents who were contacted via both email and SMS); and (c) the presence of mode effects. For (b), by comparing differences in patient characteristics by contact mode available, we evaluated whether our choice of contact mode across phases affected sample composition and noncoverage. For (c), we were additionally interested whether the presence of an interviewer for the telephone mode influenced nonresponse on the potentially sensitive question, compared to self-administered modes (email and SMS).51,52
We next studied the effect of number of reminders on (a) response rates (i.e., did more reminders increase response rate?), (b) characteristics of respondents (i.e., sample representativeness), and (c) item non-response. For (b), we evaluated differences between early and late respondents to investigate whether additional reminders captured individuals who responded later and were thus more similar to non-respondents. 45 Early respondents were defined as those respondents across all cohorts who responded to the initial survey invitation (contact wave 1). Late respondents were defined as those respondents across all cohorts who responded at any point after the first reminder (contact wave 2+). For (c), item non-response was evaluated to determine whether individuals who responded to later reminders submitted lower-quality data than earlier respondents.
Our last design feature was incentive offer. We evaluated the association between incentive offer and (a) response rate, (b) respondent characteristics, and (c) item non-response.45,53 By comparing characteristics of respondents who were and were not offered incentives (i.e., respondents in Phases 1a vs 1b, and in Phases 3 vs 4), we evaluated in (b) whether incentive offer affected non-response bias. Finally, to address our key outcome of cost-effectiveness, we discussed the relative cost and FTE requirements (in terms of survey mode, number of reminders, and incentive offer) of each design phase.
In our evaluation of overall non-response, we compared the characteristics of respondents, non-respondents, the survey sample, and the MSQC-COHR population. 33 To evaluate differences, we used Chi-squared tests for categorical variables and Student’s t-test for continuous variables. The t-test of difference in proportions was also used to determine differences between groups. A p-value <0.05 was considered statistically significant in all analyses. To reduce non-response bias and improve external validity, 29 we developed a two-part weighting scheme. This scheme first consisted of non-response weights that adjusted for differences between survey respondents and the survey sample 54 ; these were constructed using binomial logistic regression in which respondent (vs non-respondent) status was regressed against relevant explanatory patient demographics, hernia characteristics, surgical characteristics, and patient comorbidities. Individuals (respondents and non-respondents) with missing explanatory variables (e.g., age, hernia size) were included in the weighting scheme, which coded for missingness. Our scheme secondly consisted of raking weights, which were calculated using iterative proportional fitting (Stata’s ipfweight) 55 to balance the weighted respondent sample totals across the known distribution of the existing MSQC-COHR population.54,56 A set of covariates for the raking weights was defined pre-hoc based on correlation with nonresponse, noncoverage, and survey outcomes and then adjusted to further minimize differences between the weighted and unweighted samples57,58: sex, age, race, surgical priority, and ASA Class. Major outliers were trimmed using the ipfweight maximum threshold function, 55 with an upper threshold value of 5. 59 For all estimates, we implemented Taylor-linearized variance estimation using Stata’s svy command. 60
This quality improvement study was exempt from regulation by the University of Michigan Institutional Review Board (HUM00091060). All statistical analysis was performed using Stata version 17.0 (StataCorp, Inc., College Station, TX). The STROBE guidelines were used to report this study. 61
Results
Study population
We captured 7062 patients who received hernia repair in Michigan between January 2, 2020, and March 31, 2022. By cohort, the number of patients included were: P1, n = 555; P1b, n = 262 (eligible P1 non-respondents); C1, n = 2472; C2, n = 1768; and C3, n = 2267 (Table 1).
Contact rate
Sample size (n), disposition, and contact rate by survey cohort and overall.
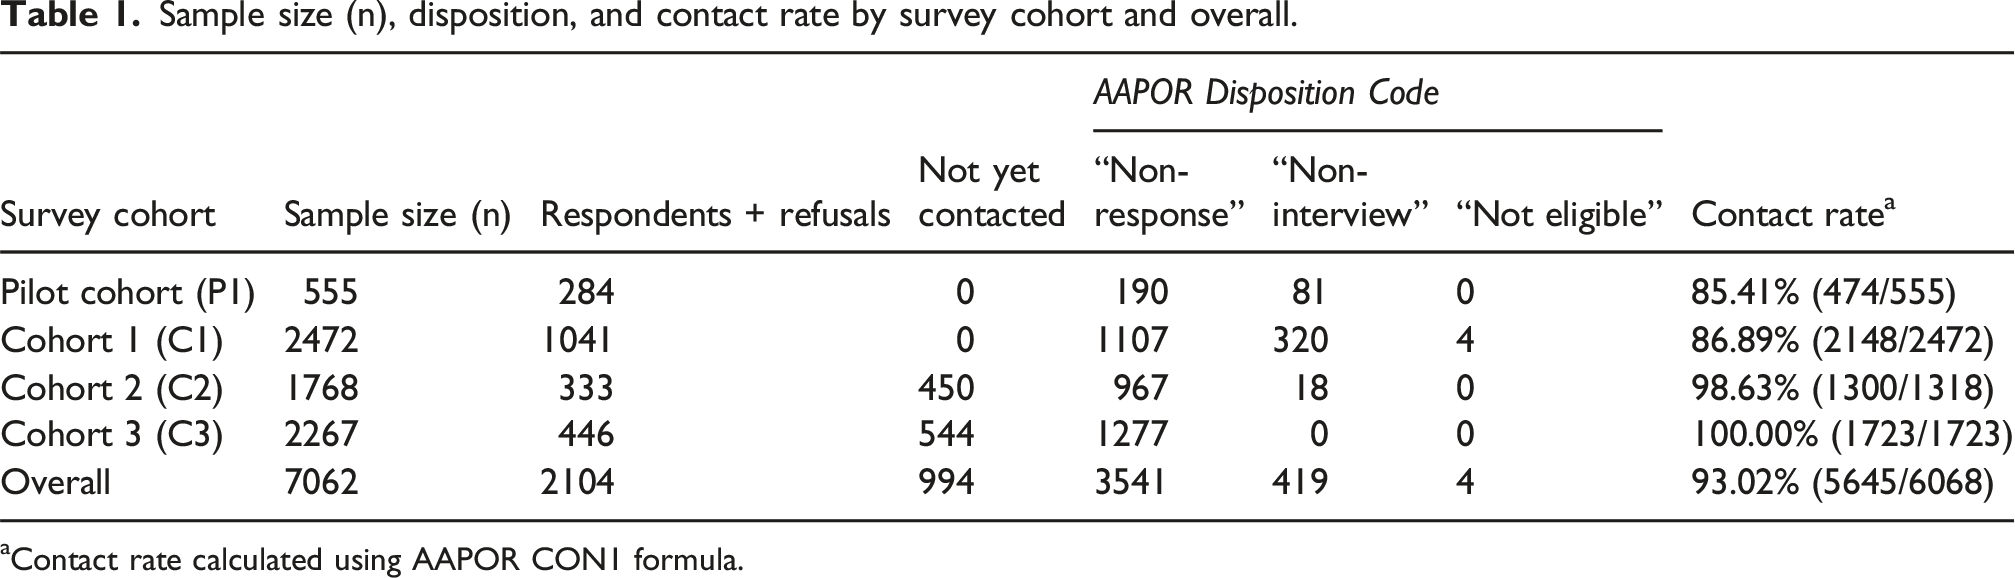
aContact rate calculated using AAPOR CON1 formula.
Follow-up time
Average follow-up time in months by survey cohort and overall.
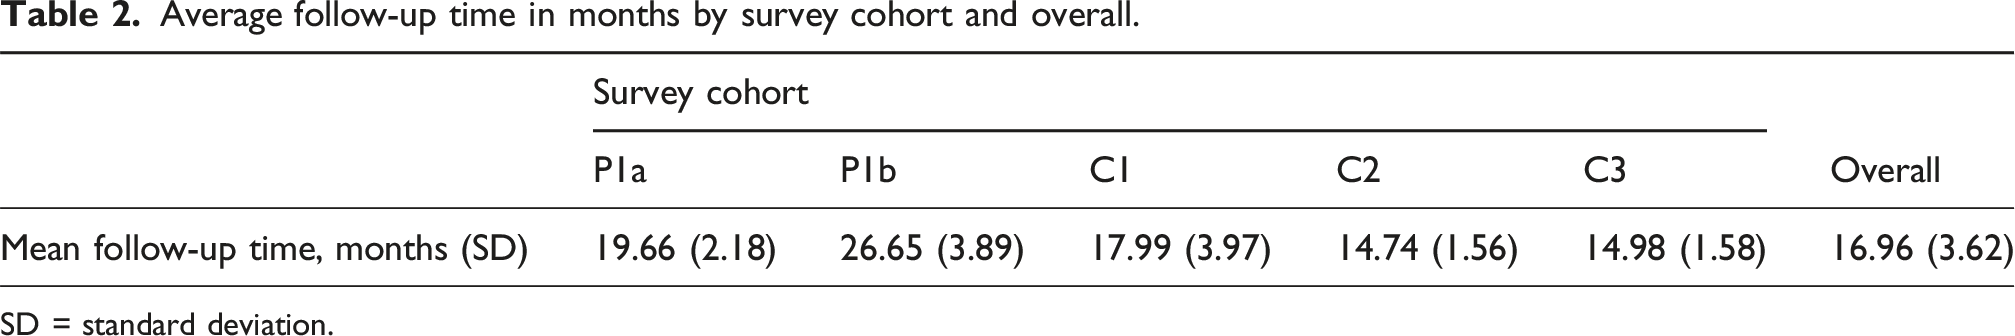
SD = standard deviation.
Survey response rates
Response rate (%) by survey cohort and overall.
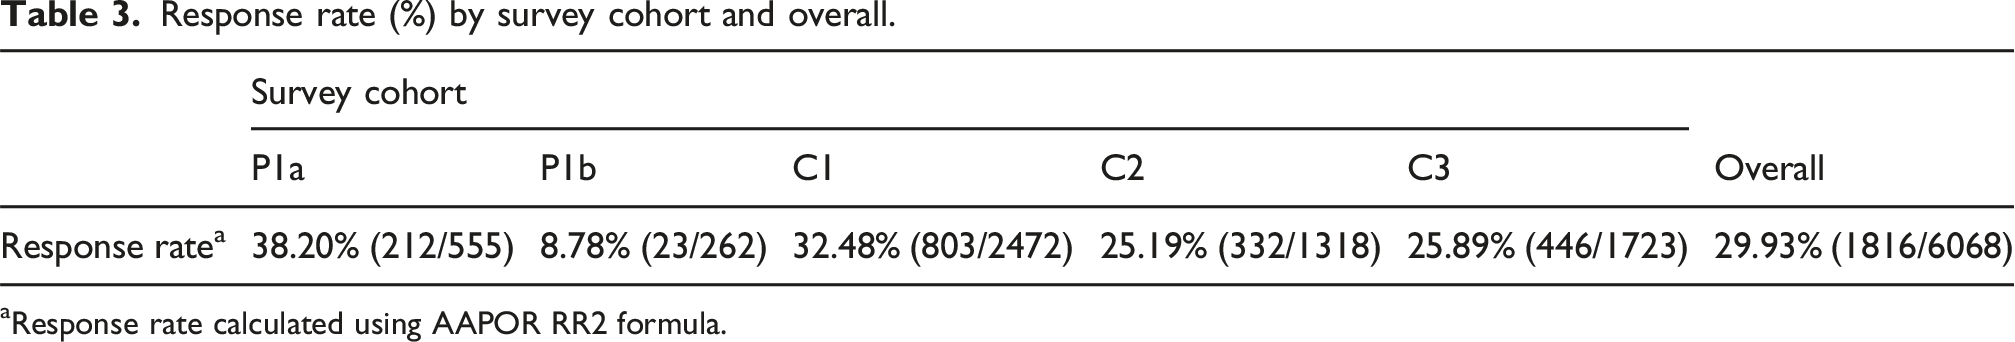
aResponse rate calculated using AAPOR RR2 formula.
Item non-response: Survey completion
Of those individuals who initiated their surveys, 1645 fully completed their surveys (100% completion rate = 90.6%), with another 41 individuals partially completing their surveys (≥75% completion rate = 92.8%). 130 individuals failed to achieve at least 75% completion. Across all cohorts, item response rate dropped with survey progression (Figure 1). Percent of all survey respondents achieving 100% completion of Patient Reported Outcomes Measures by question.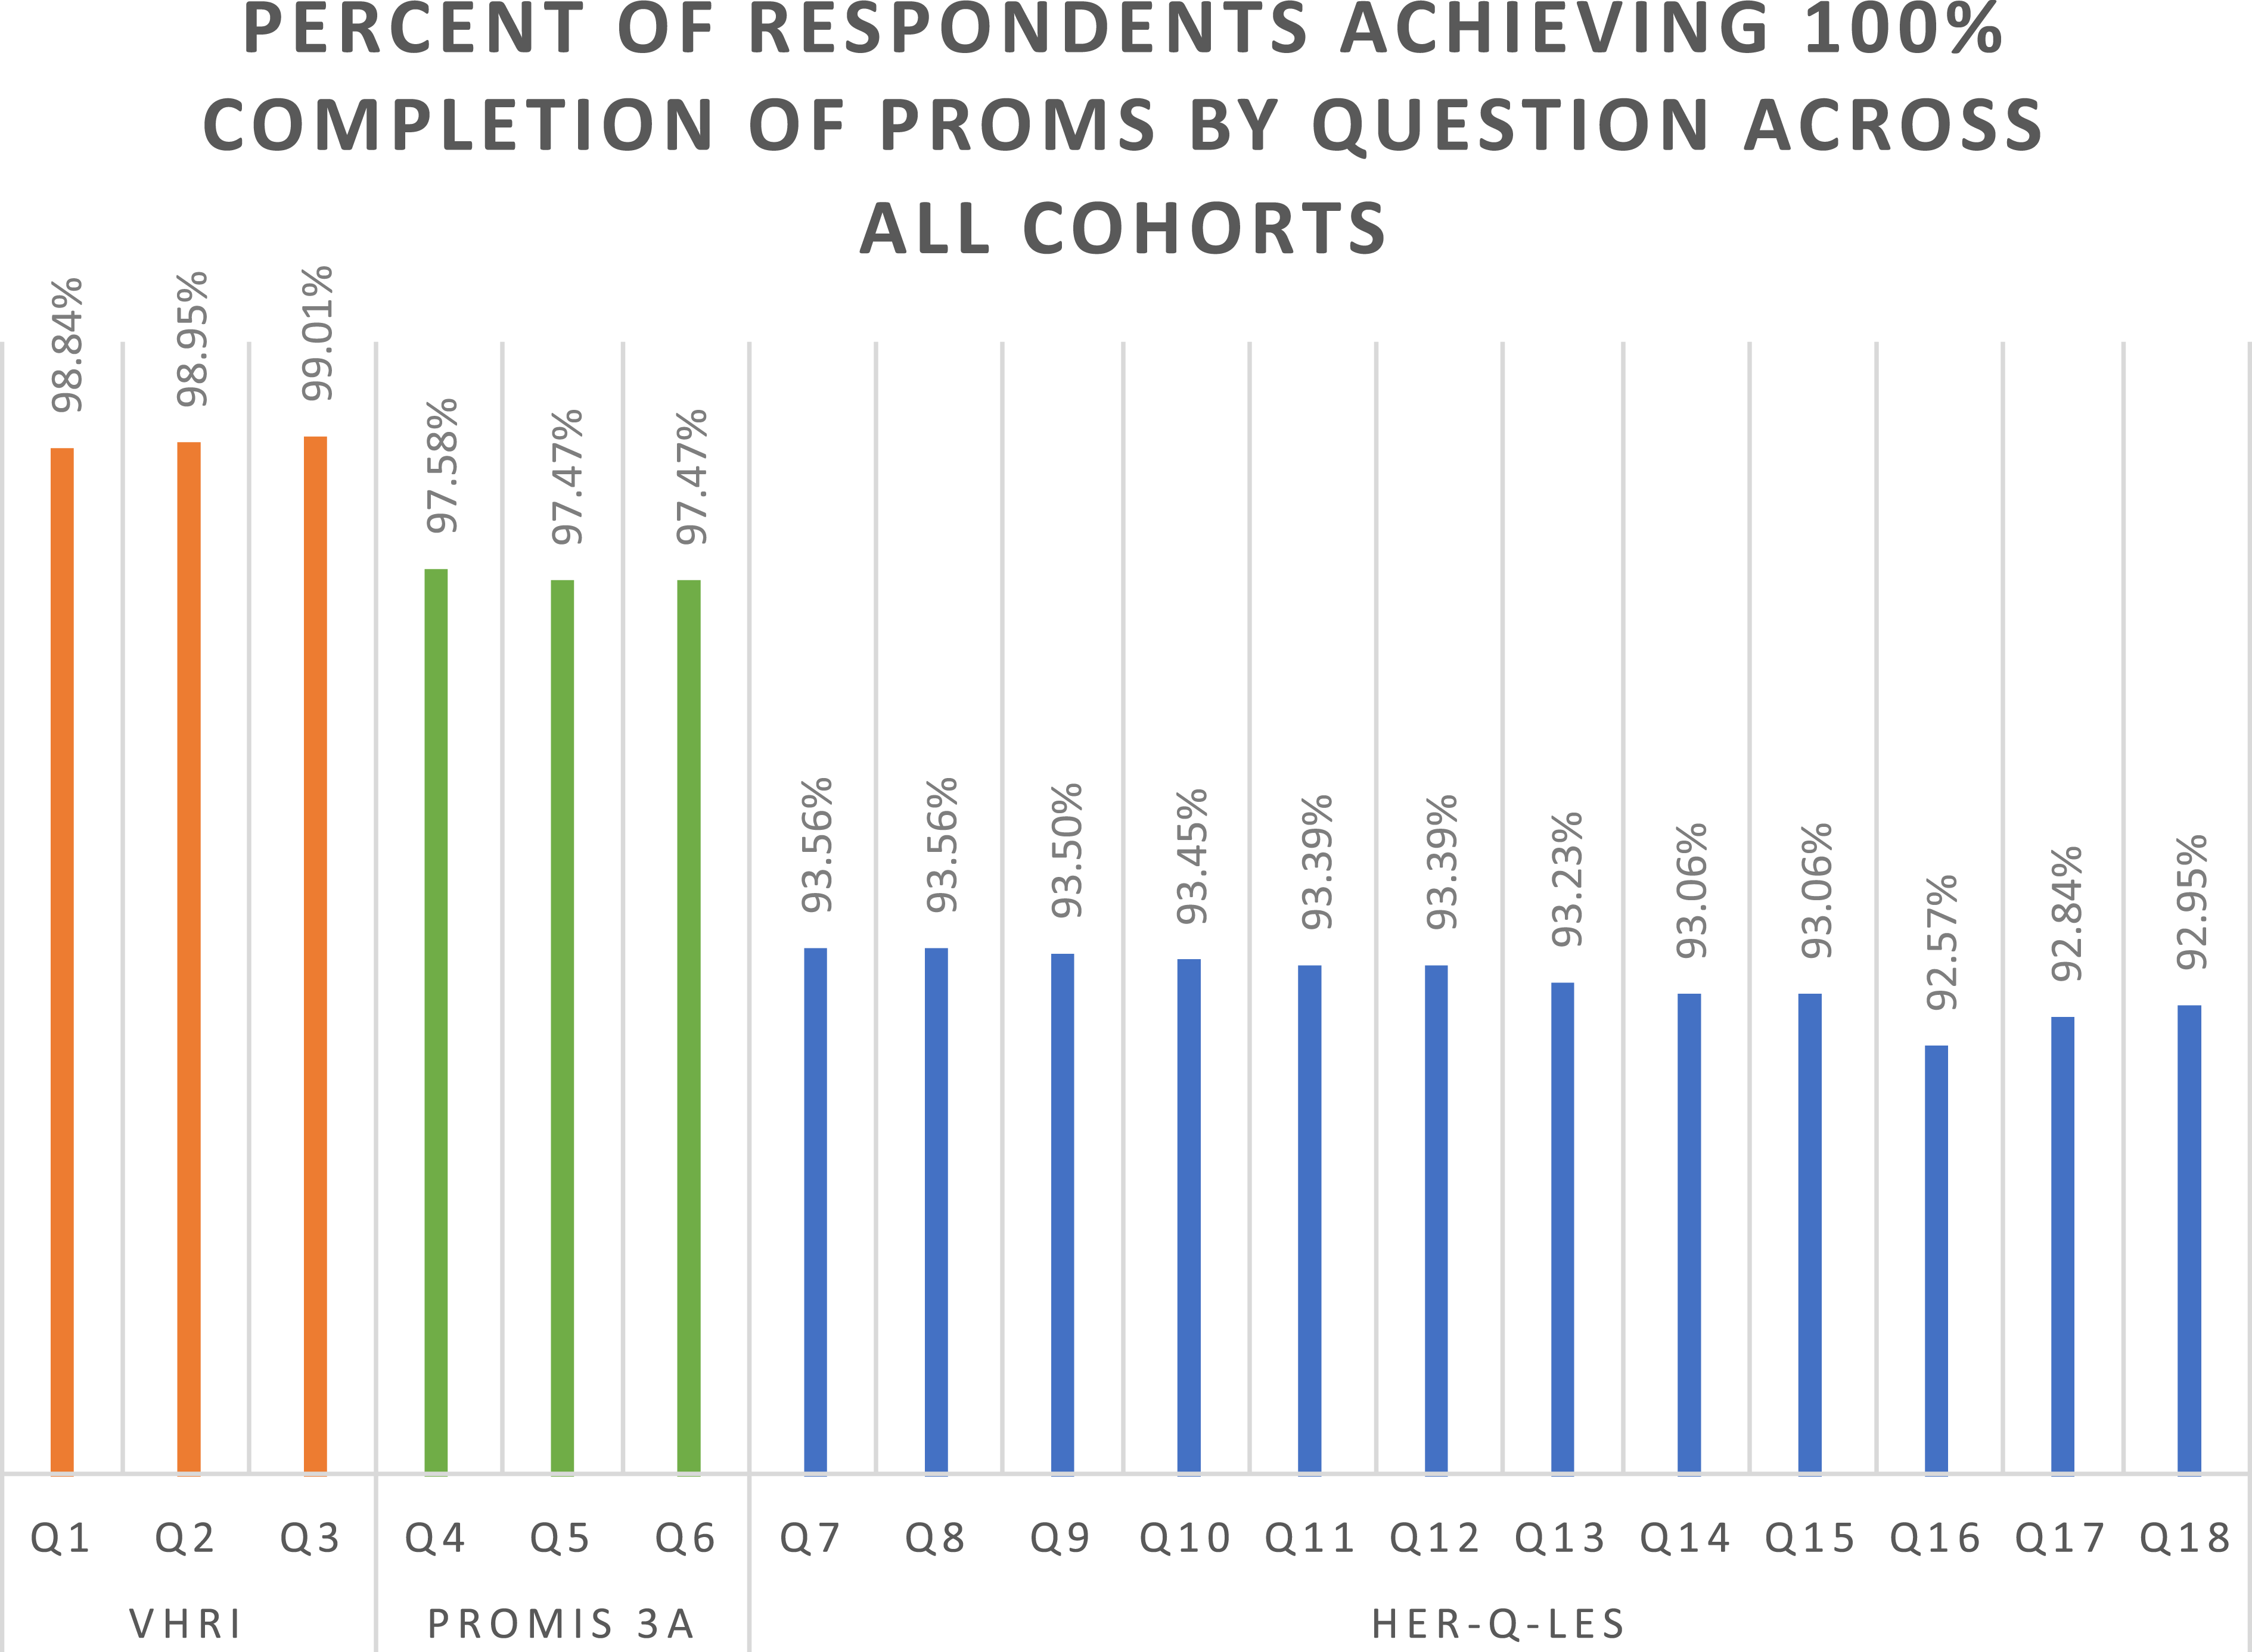
Mode of contact and mode of response
Description of contact method available in sample and corresponding contact and reminder modes.
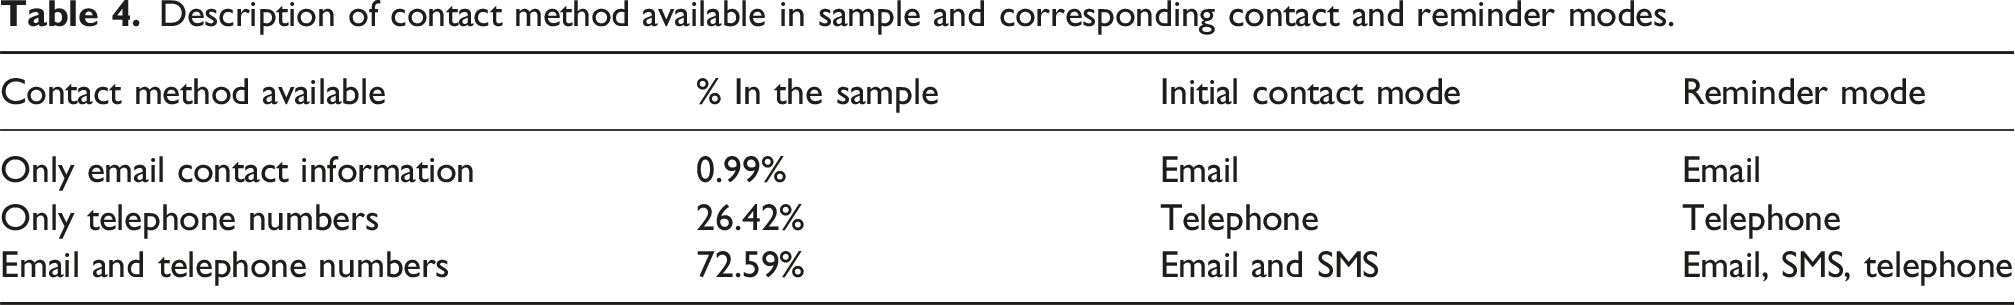
With regard to mode of response, we considered only those individuals who had a primary choice, i.e., received invitations via both email and SMS and chose their method of response. The majority of these respondents (>54%) utilized email (results not shown). Across all cohorts, those who chose to respond via SMS were on average 2.9 years younger than those who chose to respond via email (p < 0.001). Women also demonstrated a stronger preference for SMS than men (p < 0.05). White individuals were more likely to respond via email while Black individuals were more likely to respond via SMS (p < 0.001). No differences were observed by Hispanic ethnicity. Patients who received surgery at rural hospitals demonstrated a stronger preference for email than those who received surgery at urban hospitals (p < 0.05). We did not find evidence of mode effects in patterns of response to potentially sensitive survey question 13 (results not shown).
Reminder effectiveness: Impact of reminders on response rates, respondent characteristics, and item non-response
Number (n) of survey respondents and response rate (%) per contact wave, by survey cohort and overall.
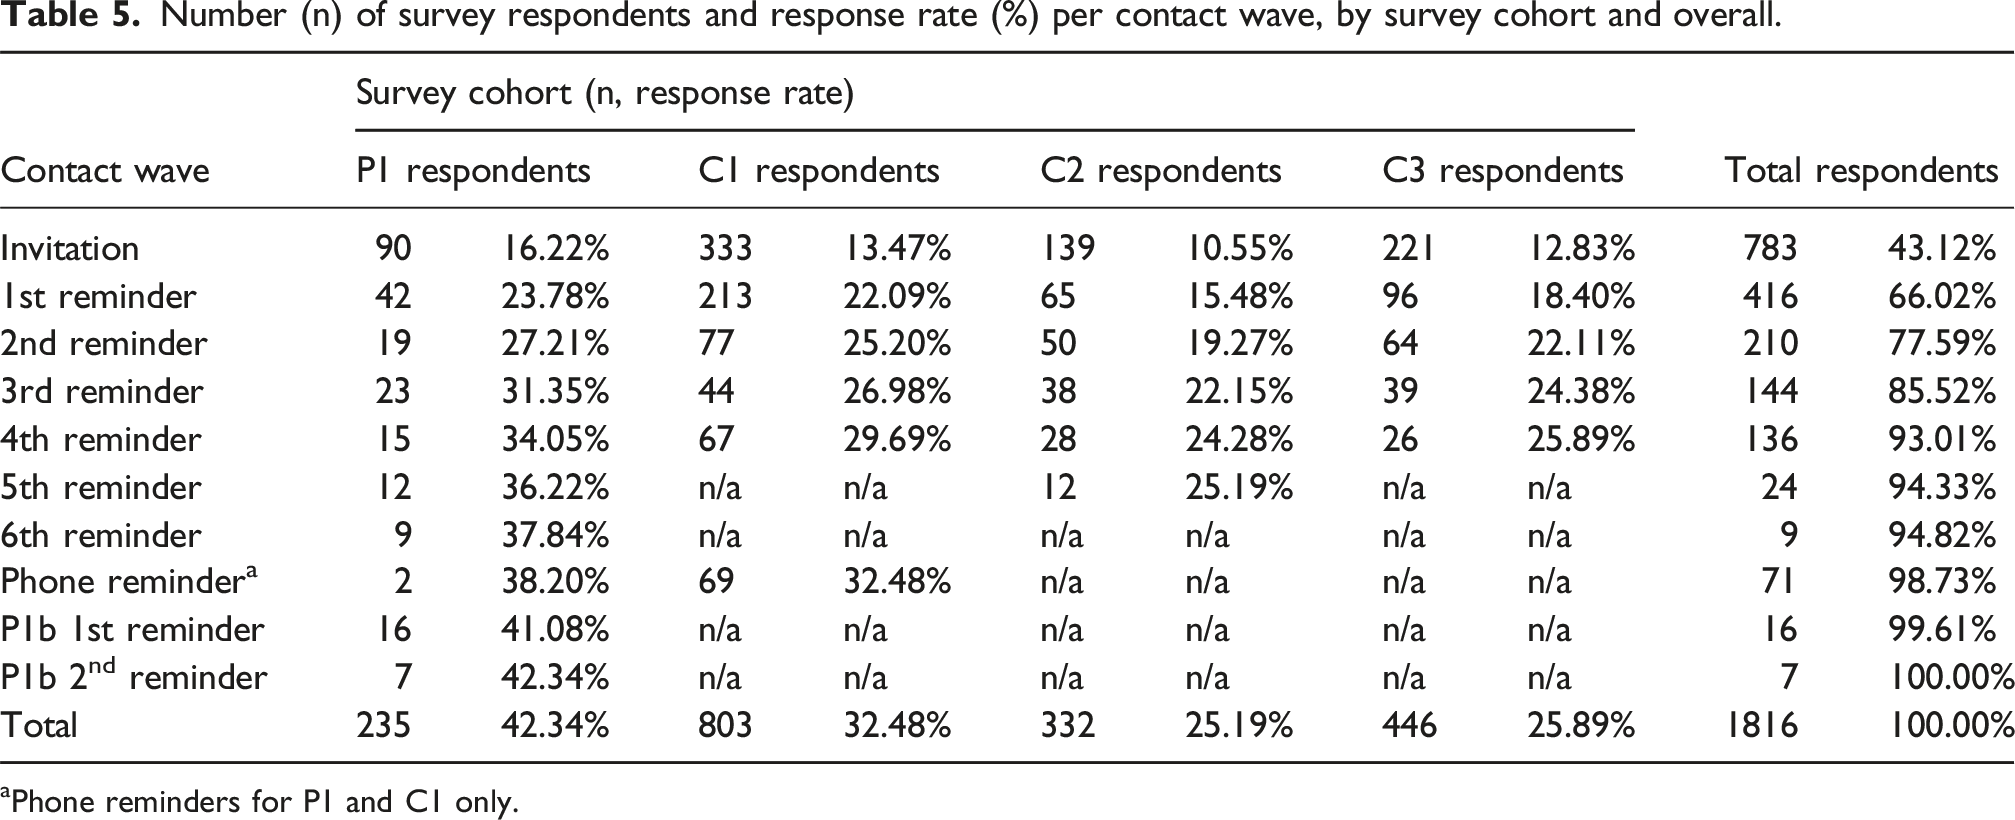
aPhone reminders for P1 and C1 only.
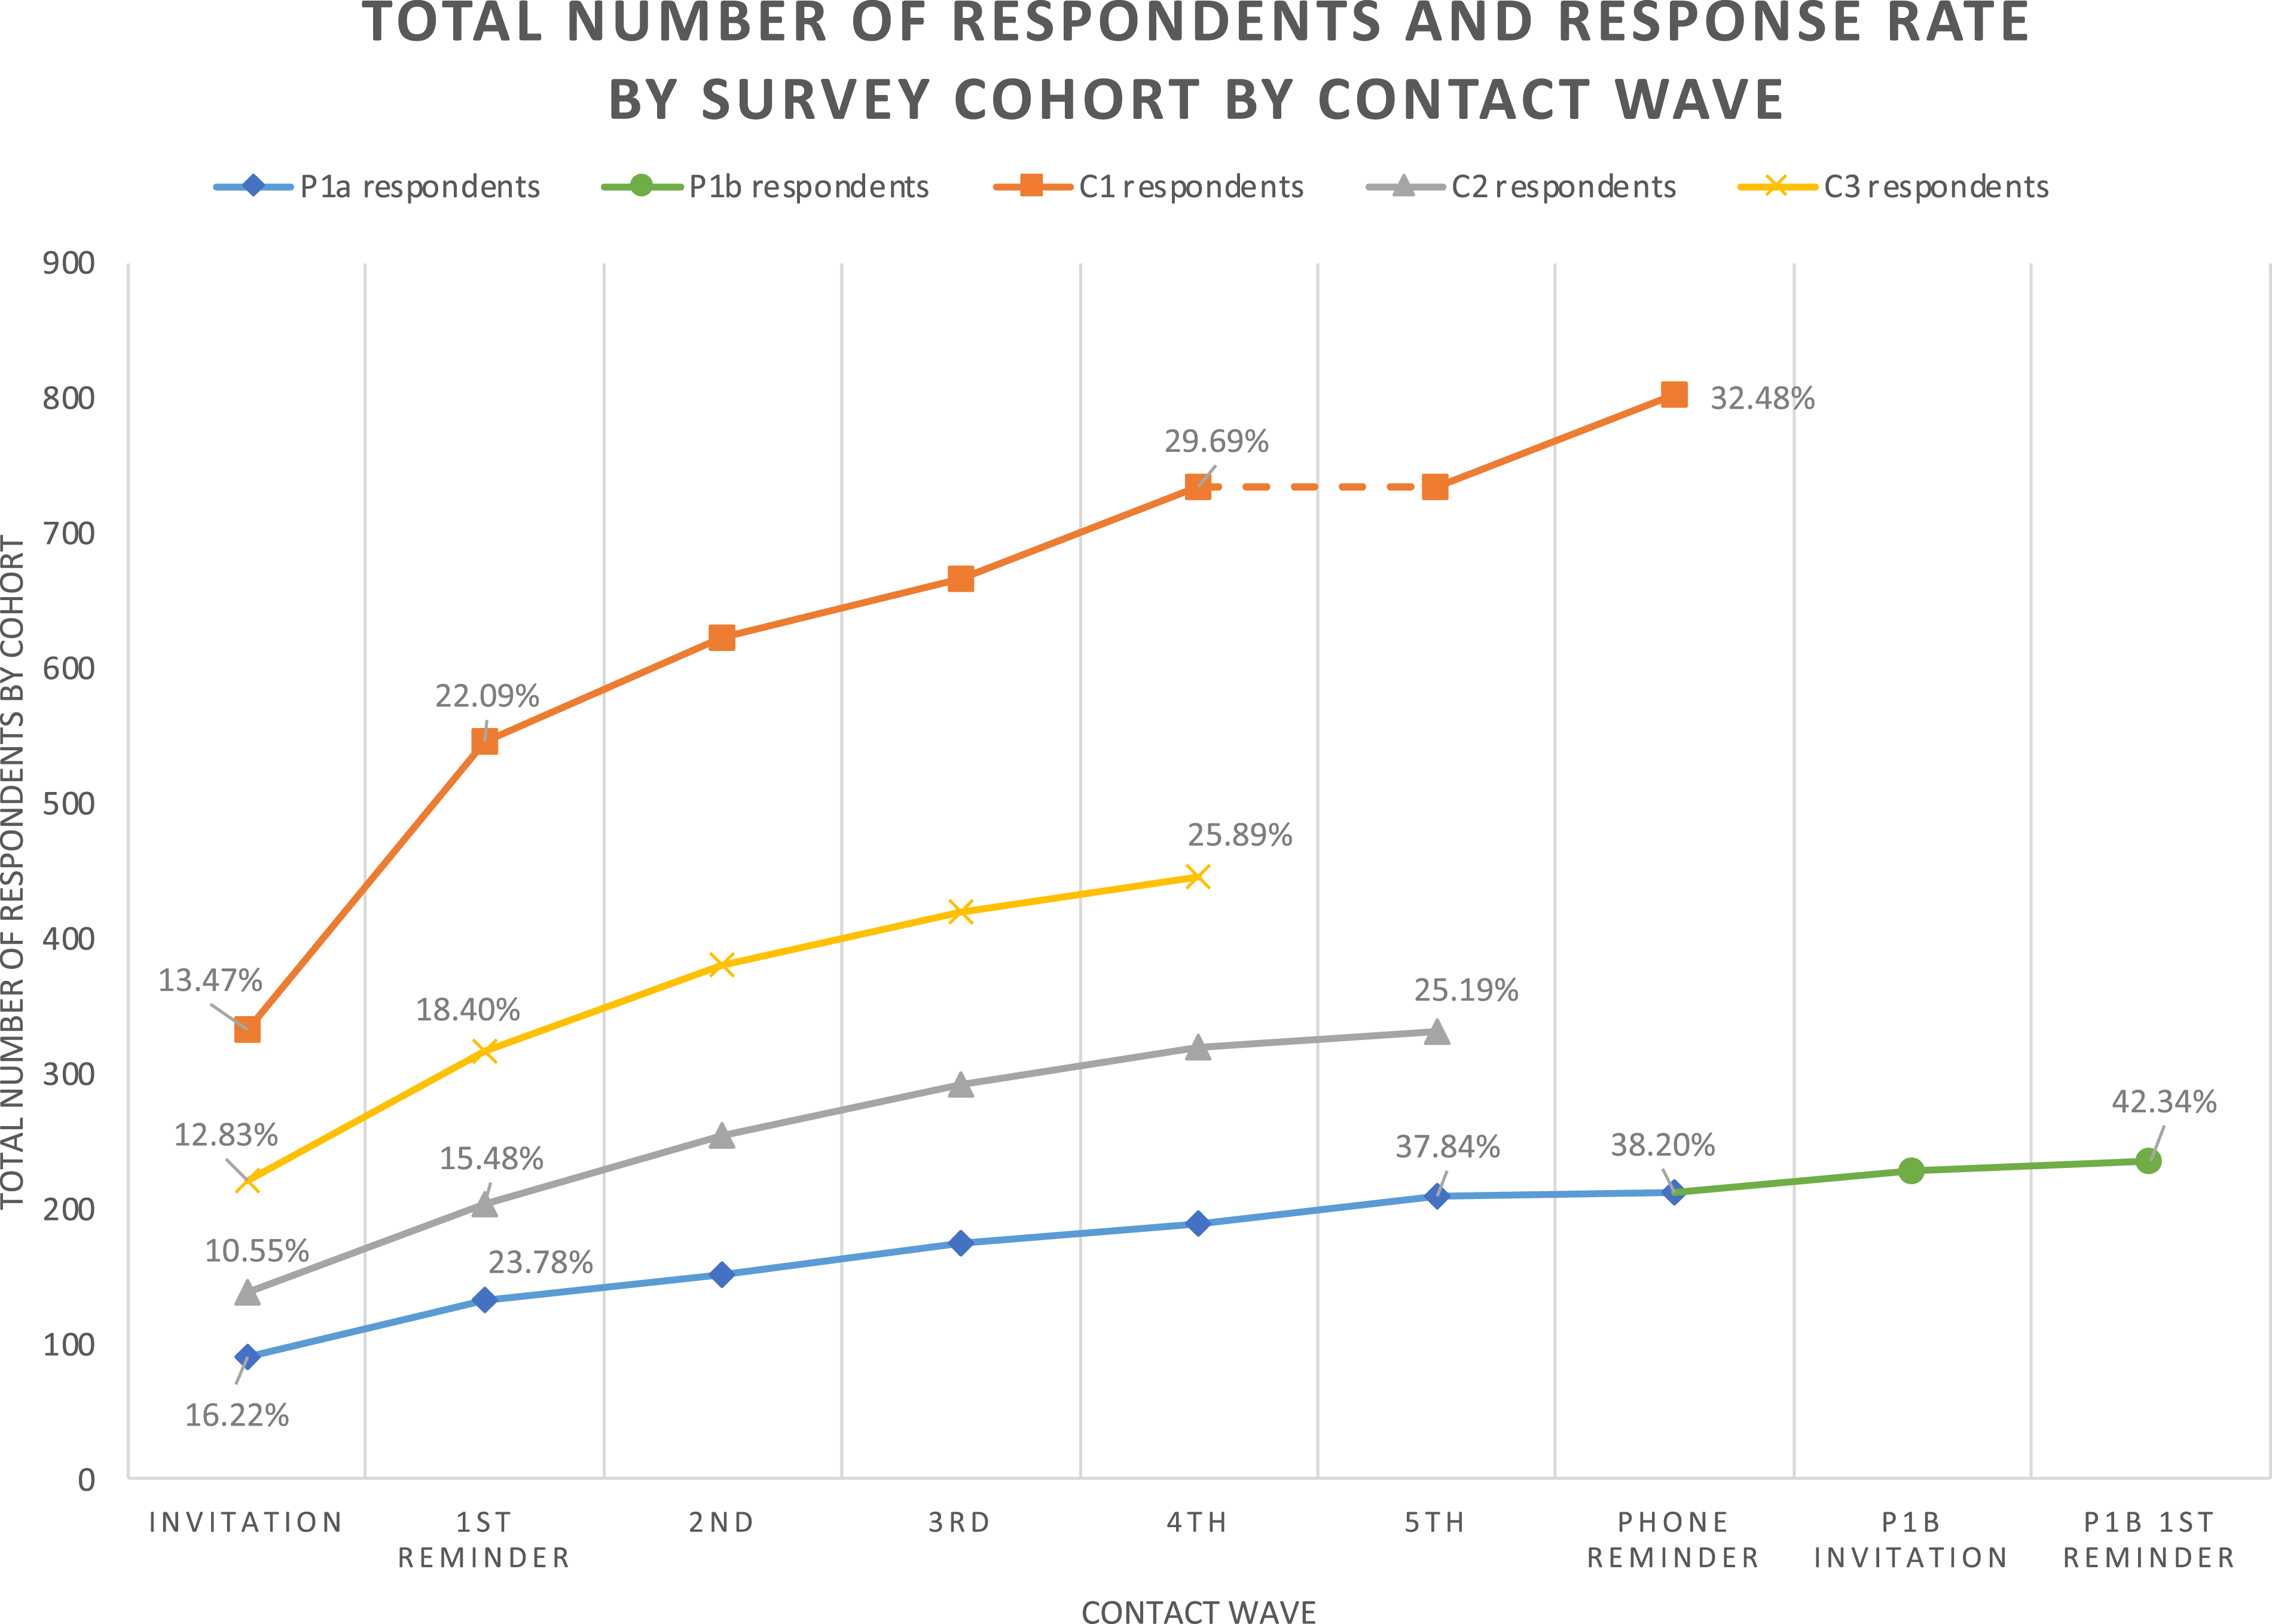
Total number of survey respondents and response rate by survey cohort by contact wave. Respondents to the 6th reminder of P1a group 1 are grouped with 5th reminder respondents from P1a groups 1-5. Respondents to either P1a phone reminder are grouped under “phone reminder”.
Distribution of early and late respondents by survey cohort and overall.
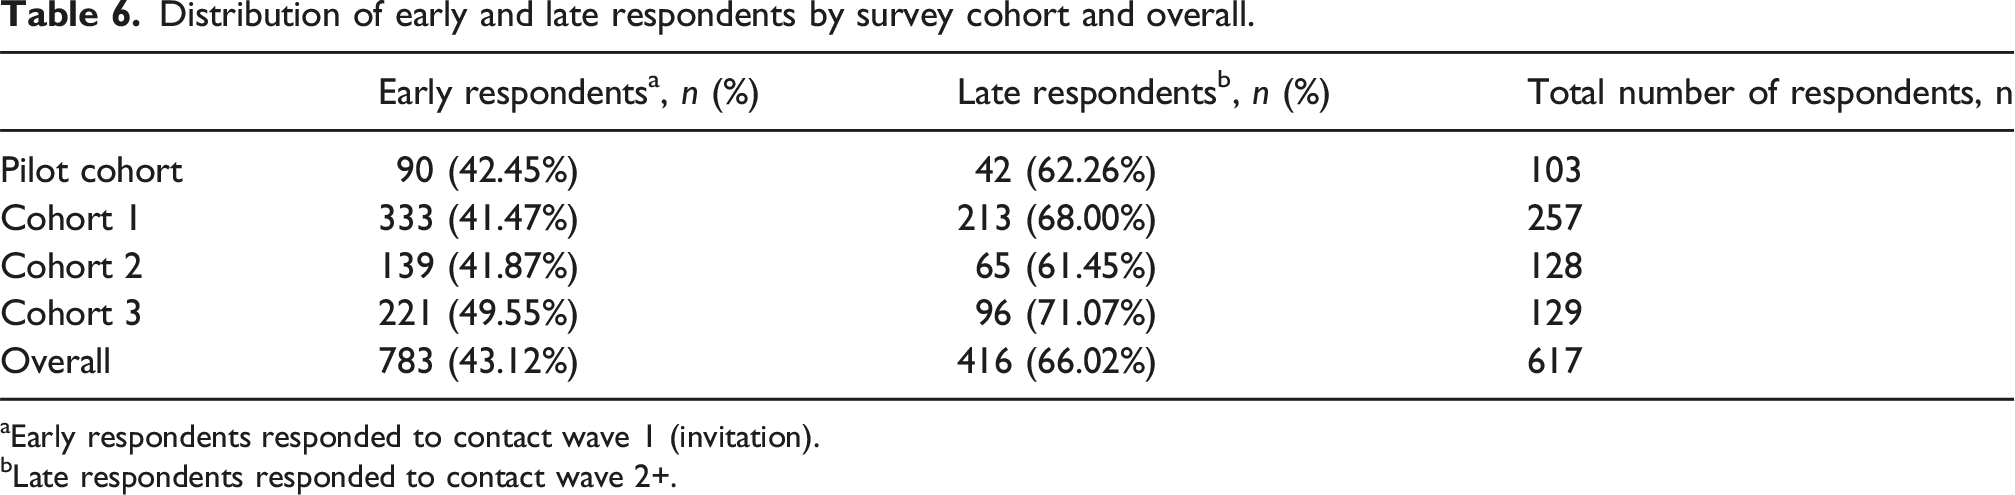
aEarly respondents responded to contact wave 1 (invitation).
bLate respondents responded to contact wave 2+.
Characteristics of early and late respondents (all survey cohorts).
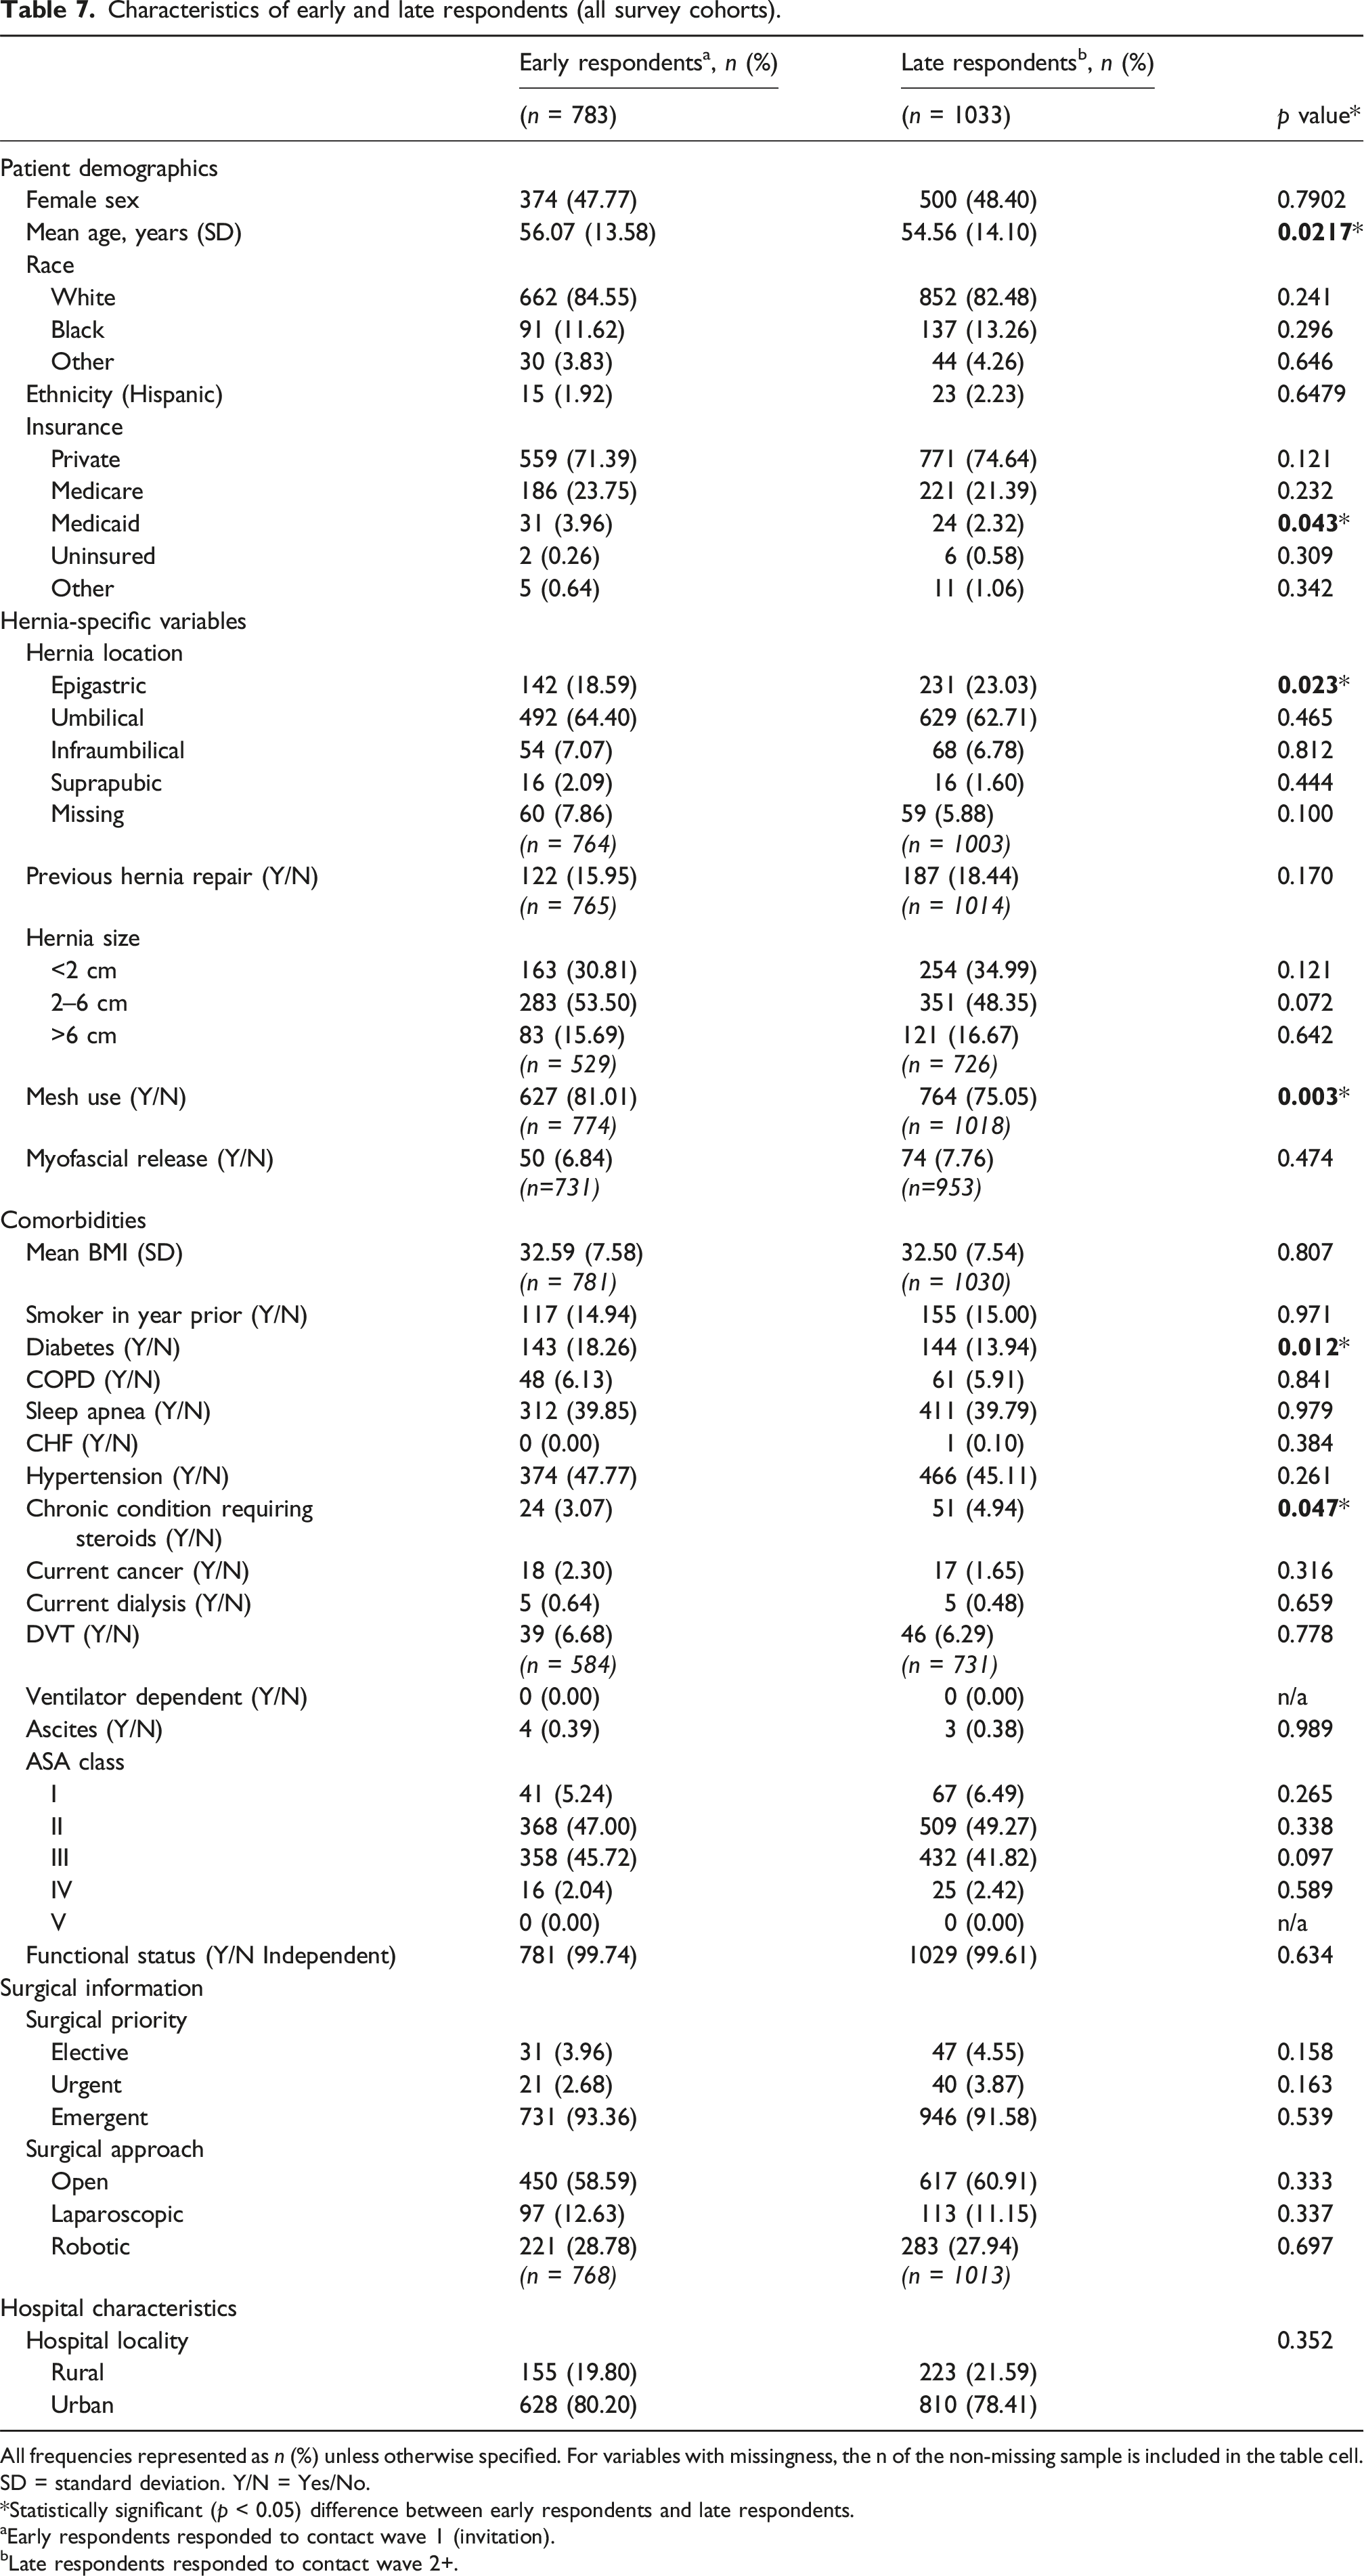
All frequencies represented as n (%) unless otherwise specified. For variables with missingness, the n of the non-missing sample is included in the table cell. SD = standard deviation. Y/N = Yes/No.
*Statistically significant (p < 0.05) difference between early respondents and late respondents.
aEarly respondents responded to contact wave 1 (invitation).
bLate respondents responded to contact wave 2+.
Incentive offer: Impact on response rates, respondent characteristics, and item non-response
We experimented with the incentive offer under two conditions. In the first (sub-phase 1b), incentives were offered to the P1b cohort to minimize nonresponse bias by increasing the participation rate amongst 262 non-respondents from the P1 cohort. 46 This additional contact attempt with incentive offer was associated with 23 additional surveys, increasing the total response rate of the P1 cohort from 38.20% (212 out of 555) to 42.34% (235 out of 555). However, we found no statistical differences in the observed characteristics of P1a and P1b respondents to suggest any reduction in nonresponse bias (Table A8). In our second condition (phase 3), C2 was offered an incentive at the first attempted contact. Survey outcomes from C2 were then compared with outcomes from C3, which was not offered an incentive. We found no statistical difference in response rates between C2 and C3 (Figure 2), despite C2 having been offered an incentive, C3 having received fewer reminders than C2, and the C3 sample size being larger by 31%. There were no statistical differences in the observed characteristics of C2 and C3 respondents (Table A8), leading us to conclude that offer of an incentive again did not influence nonresponse bias. Under neither condition did we find differences in item non-response with incentive offer (results not shown).
Cost effectiveness: Impact of contact mode, reminders, and incentive offer on survey cost
Design phase, characteristics, and response rate (%).
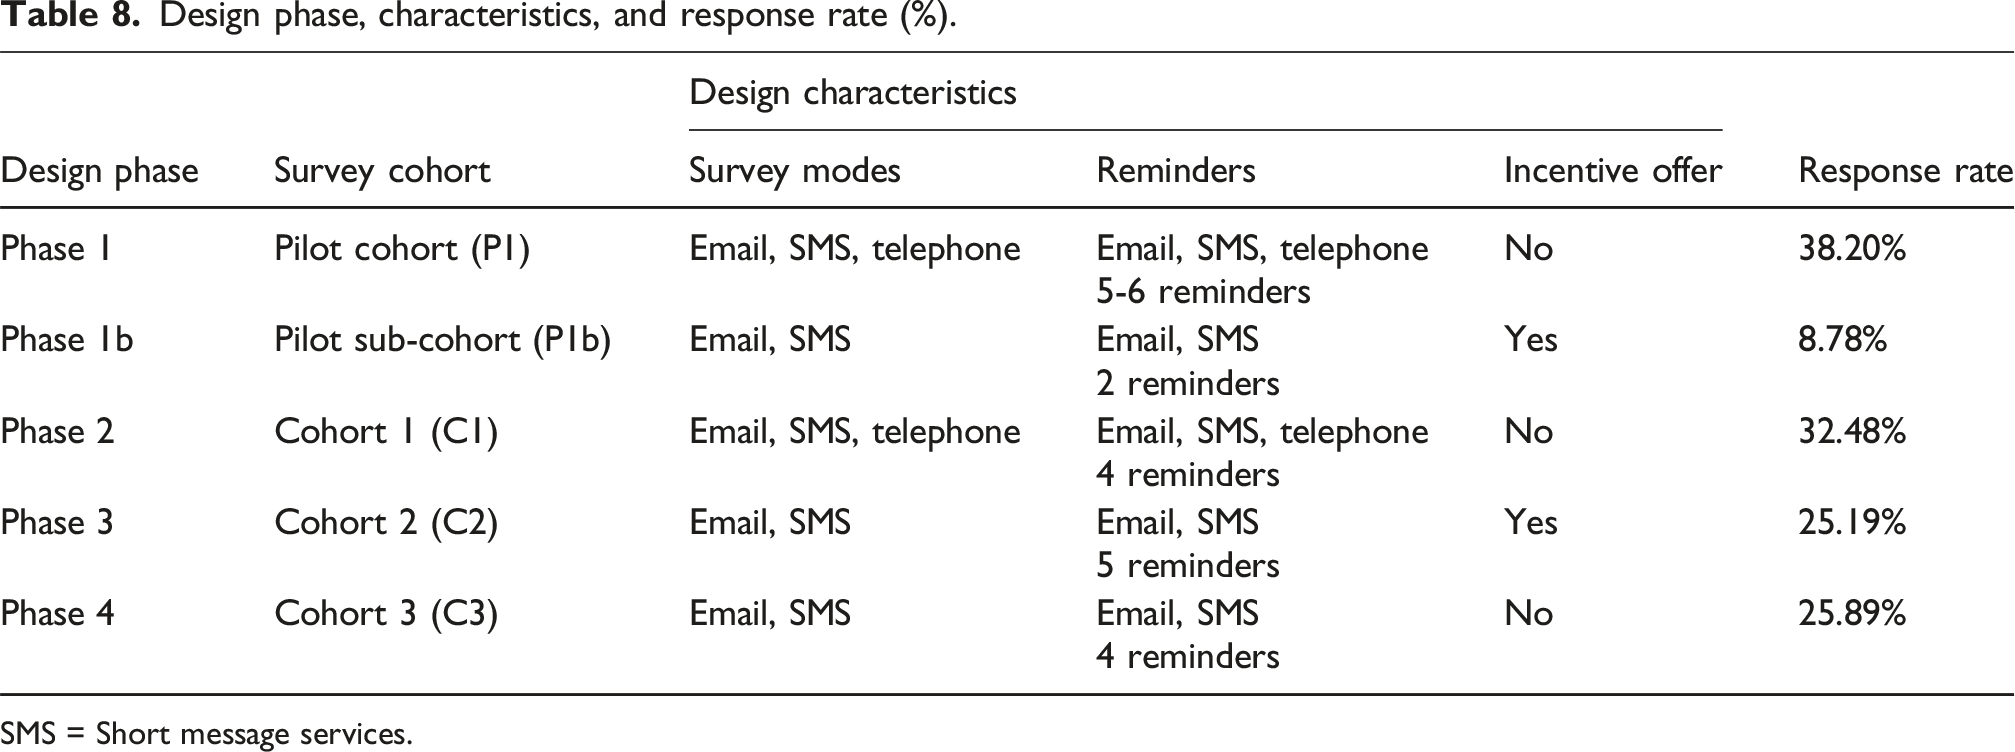
SMS = Short message services.
Overall non-response: Differences between respondents and non-respondents
Characteristics of MSQC-COHR population, survey sample, and survey non-respondents and respondents, unweighted.
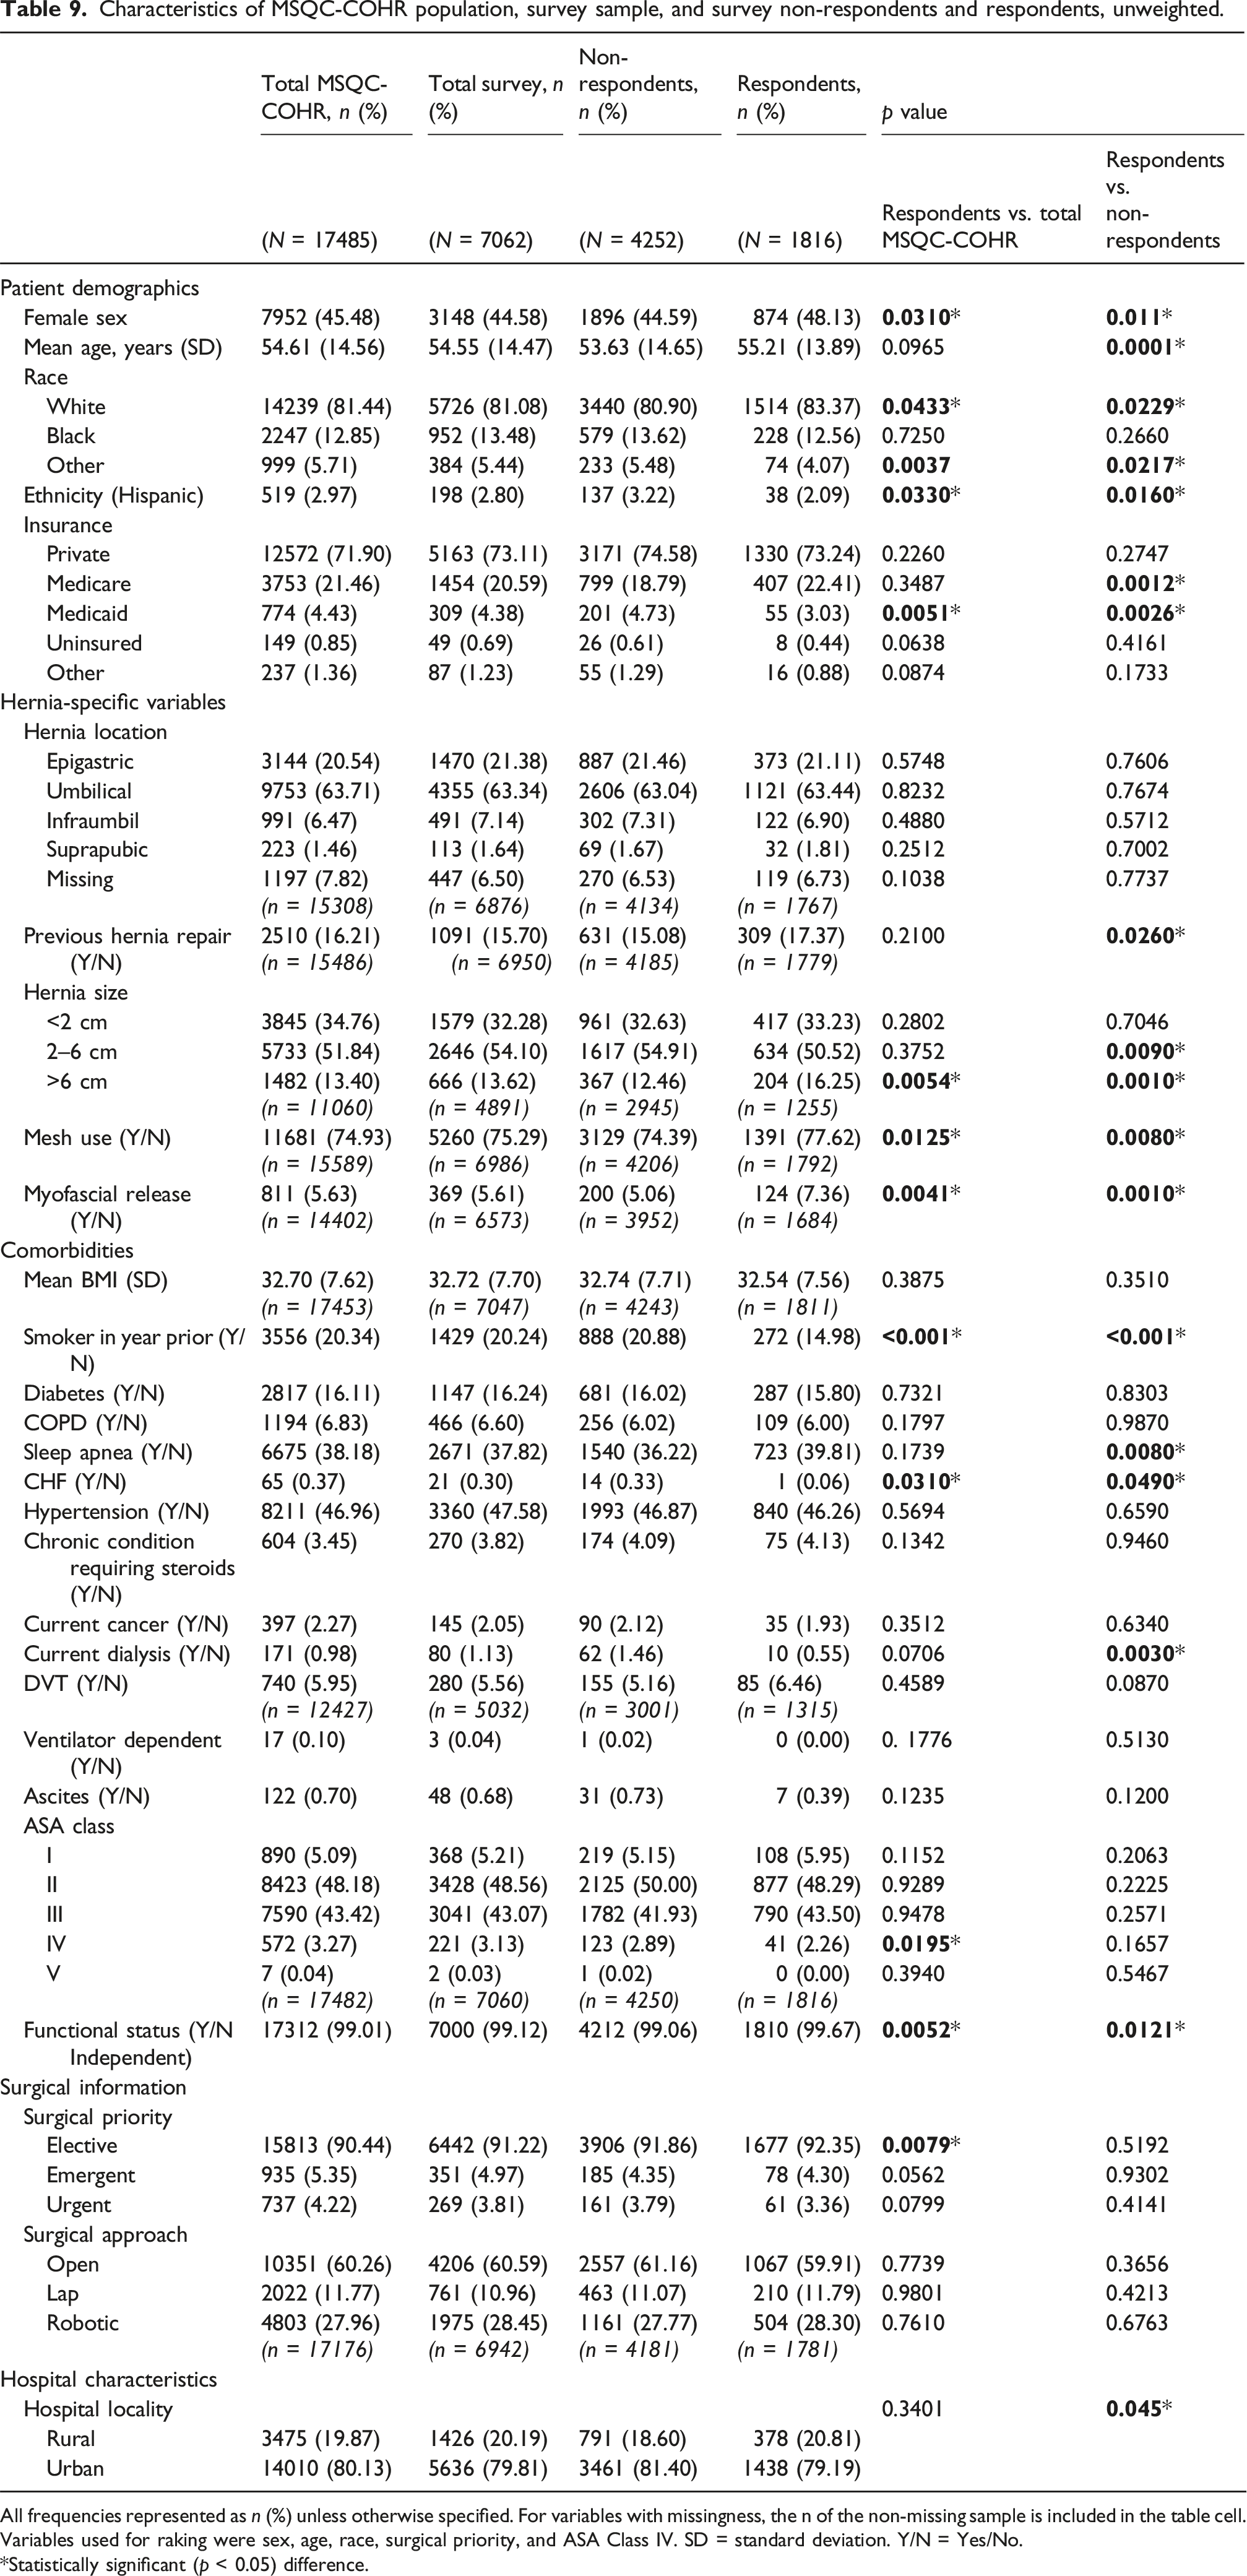
All frequencies represented as n (%) unless otherwise specified. For variables with missingness, the n of the non-missing sample is included in the table cell. Variables used for raking were sex, age, race, surgical priority, and ASA Class IV. SD = standard deviation. Y/N = Yes/No.
*Statistically significant (p < 0.05) difference.
Characteristics of survey respondents with non-response and raking weighting compared to MSQC-COHR population and survey sample.
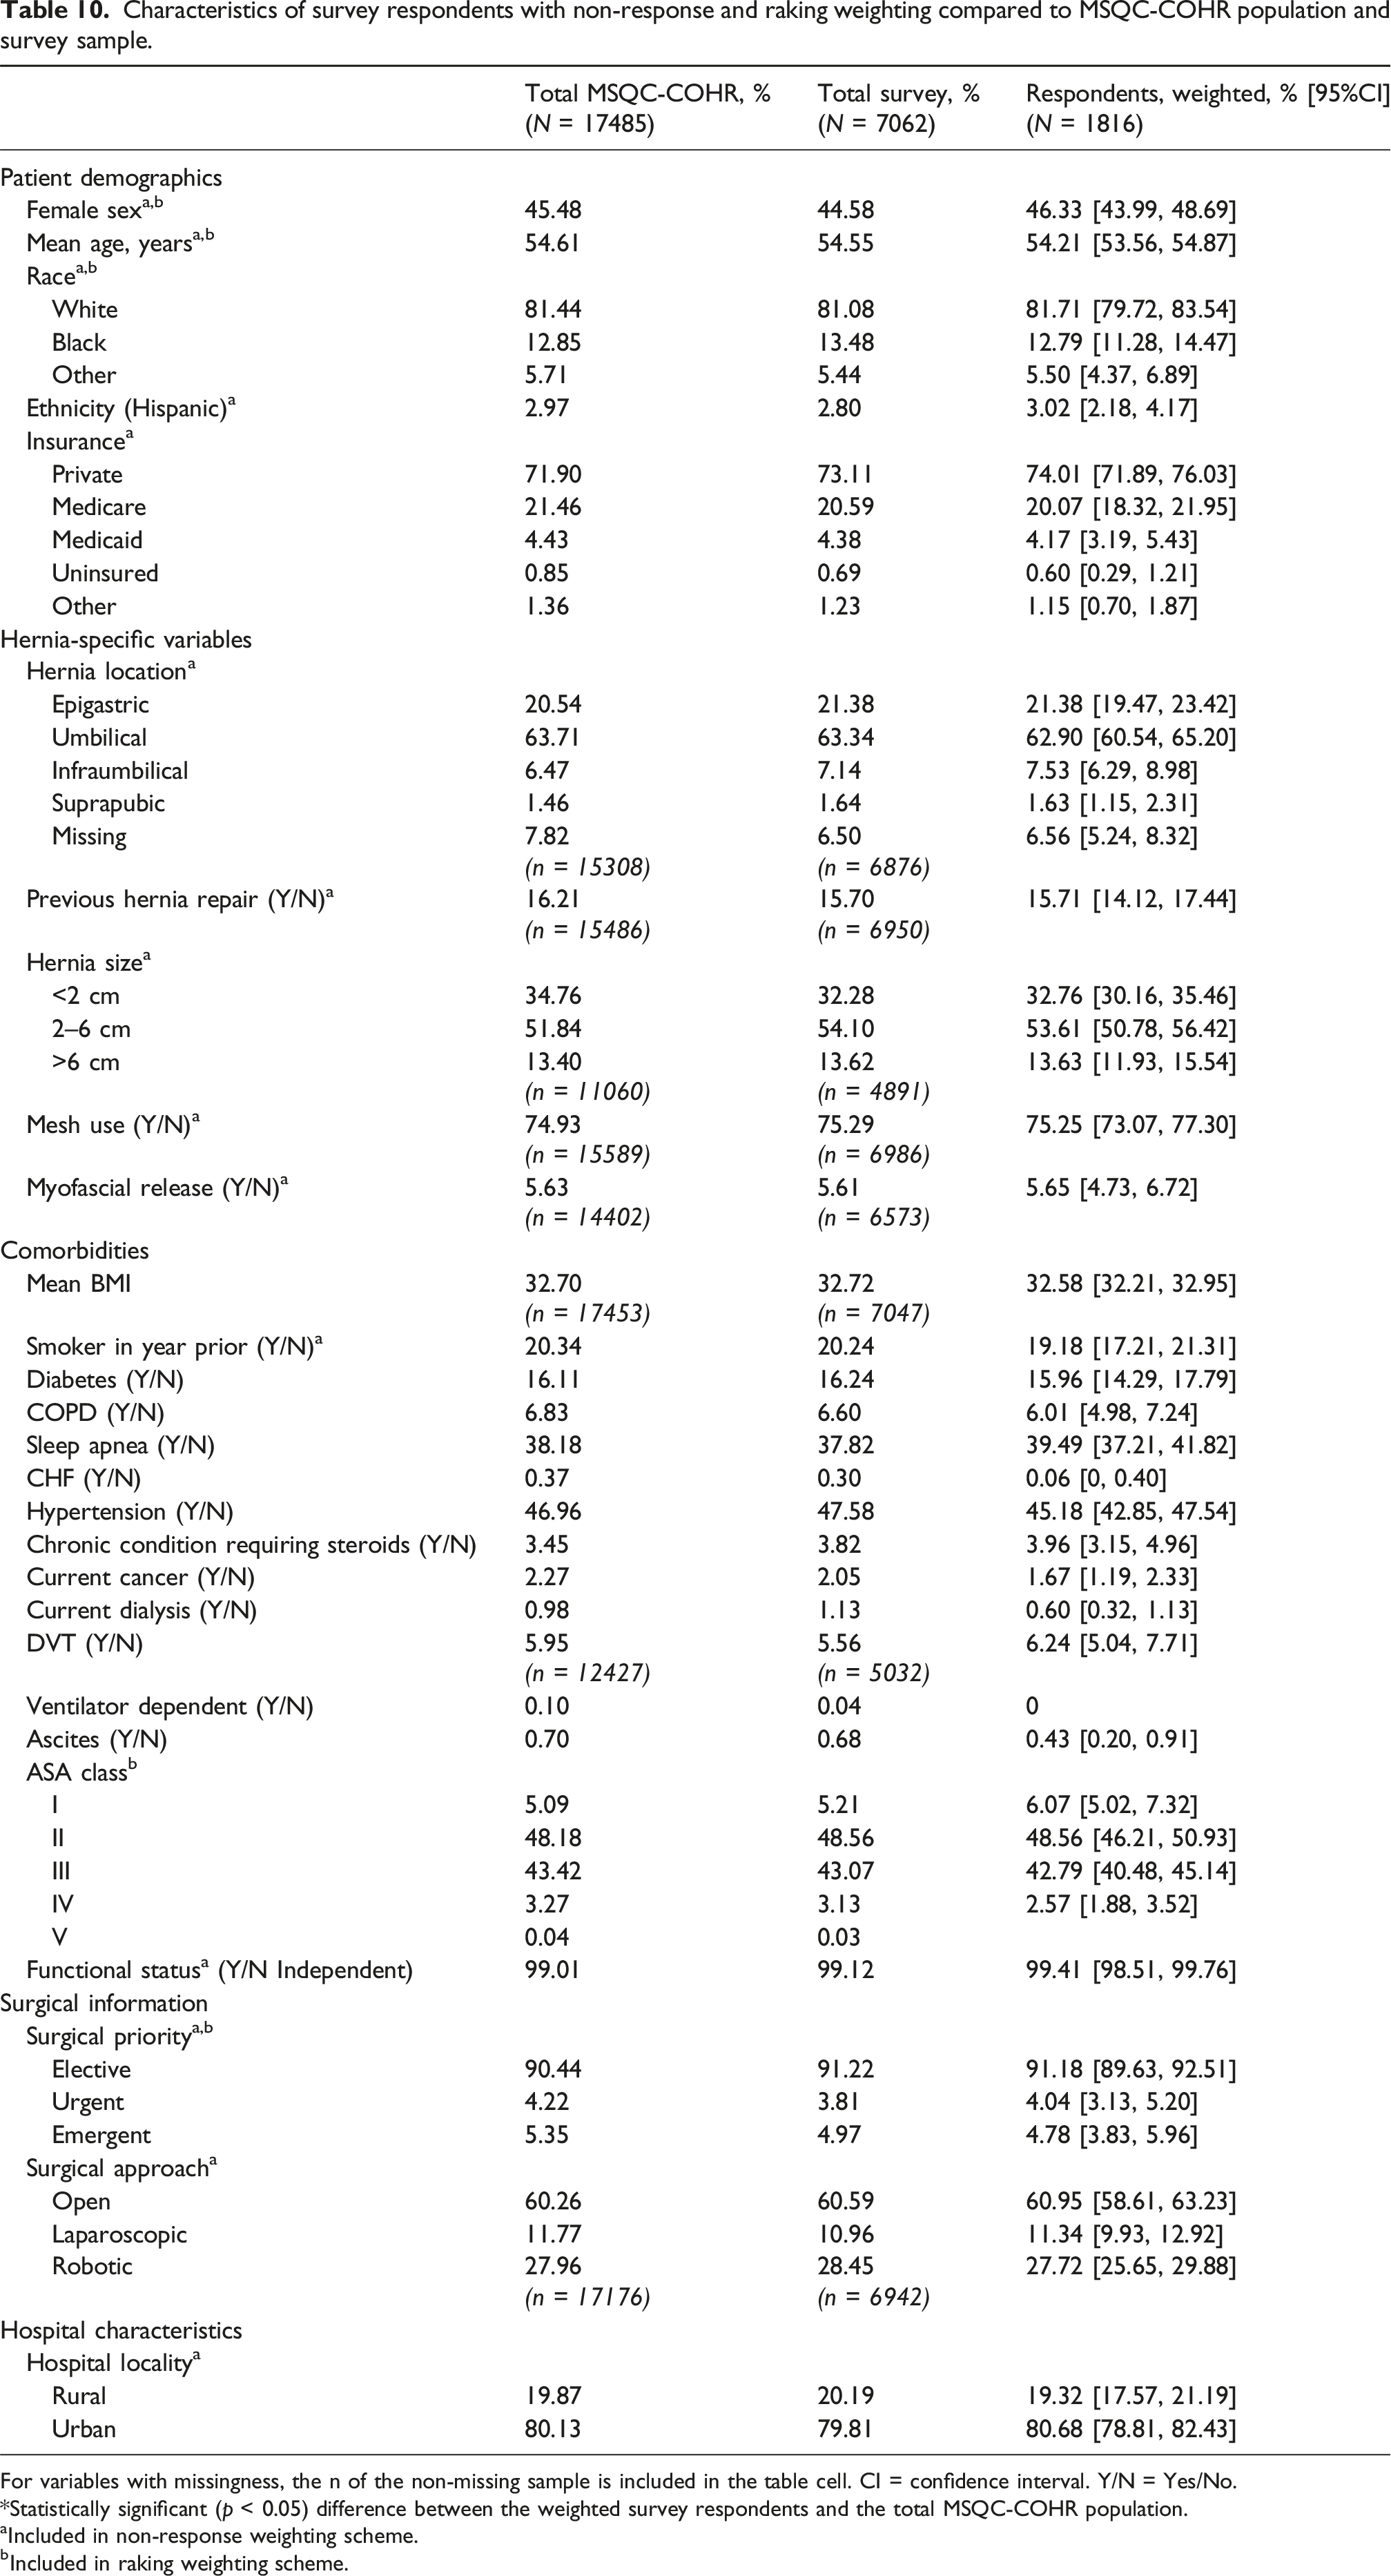
For variables with missingness, the n of the non-missing sample is included in the table cell. CI = confidence interval. Y/N = Yes/No.
*Statistically significant (p < 0.05) difference between the weighted survey respondents and the total MSQC-COHR population.
aIncluded in non-response weighting scheme.
bIncluded in raking weighting scheme.
Discussion
Measurement of patient reported outcomes (PROs) is a critical long-term need for surgical patients in order to improve shared decision-making preoperatively and patient care postoperatively.2,3,62 For hernia surgery, a preference-sensitive operation with low rates of morbidity and mortality, measurement of outcomes that center on the patient’s quality of life post-operatively stands to transform care. 63 To ensure that such transformation is evidence-based, the goal of this study was to design a survey of post-operative PROs using a responsive design approach. Building from prior efforts in other clinical specialties including orthopedics,26,37,64,65 bariatrics, 25 cardiology,66,67 and oncology, 68 we defined likely best practices for the measurement of PROs within the field of hernia. We then tested and iteratively refined these design characteristics throughout multiple survey design phases to achieve population-level representation of long-term PROs among individuals who received hernia repair.
Internal and external validity
Surveys are a well-established tool to measure PROs. Internal validity of the MSQC-COHR survey was ensured through use of validated PROMs 28 : the Ventral Hernia Recurrence Inventory (VHRI), 1 the PROMIS Pain Intensity 3a,23,48 and the HerQLes scale. 49 Other efforts to collect PROs from surgical patients have typically been single-surgeon or single-institution, or have independently conducted by participating institutions with wide variation in survey procedure, response rates, and small samples.25,26,37,65 Instead, we maximized external validity of our survey through integration into an existing clinical registry that ensured representativeness of patients at the state level.
Patient ineligibility based on lack of contact information available within MSQC-COHR may limit generalizability. Individuals without home internet access or with landline telephones (who could not have received SMS text messages) were at a disadvantage for survey participation. 69 This may have produced noncoverage bias if our sampling frame did not represent our target population.45,70 However, we tested multimode survey contact methods to reduce non-response error28,29 and to capture the maximum number of eligible patients. 71 In later survey phases, we discontinued contact of phone-only individuals given the required costs and the overall low contact and response rates with this population. However, as phone-only individuals in our sample were on average older and more likely to have received surgery at rural hospitals, some generalizability may have been lost. Future iterations of our survey will employ targeted telephone calls and other “mode-sensitivity” strategies to increase the probability of response among older, rural adults in the registry.26,72,73
To examine potential non-response bias, we compared survey respondents to the survey population and to non-respondents and found statistical differences, though with small magnitudes. We found a slightly higher mean age among respondents compared to non-respondents in our sample. Though this diverges from general literature on survey completion, where additional years of age is negatively associated with survey completion, 74 prior surgical PROs literature has shown a positive association between years of age and survey response.37,42,75 We also found that respondents were more likely than non-respondents to have Medicare insurance, which may be an artifact of the slightly higher ages in the respondent sample. 26
Respondents in our study were more likely than the survey sample to have undergone elective surgery and were less likely than non-respondents to be insured by Medicaid, both factors which may indicate greater access to care related to socioeconomic status (SES) among respondents. Individuals of higher SES are more likely to respond to surveys 26 ; individuals of lower SES may have worse health outcomes and thus be less likely to respond. 76 Undergoing elective surgery indicates a certain relationship with the healthcare system, and individuals with stronger ties to the surveying institution are more likely to respond. 76 Similarly, we observed that respondents were more likely than non-respondents to have undergone a previous hernia repair, likely indicating engagement with their care and greater personal benefit associated with investment in quality improvement efforts. 37
Respondents were more likely than non-respondents and the MSQC-COHR population to have larger hernias, which may be associated with higher preoperative pain, an established predictor of higher engagement with surveys. 37 Patients with larger hernias likely undergo more significant operations that may be associated with increased long-term pain. As a result, these patients with poorer long-term outcomes may engage more with surveys than patients without complaints. 1 Interestingly, respondents were also more likely than non-respondents and the MSQC-COHR population to have received mesh or myofascial release in their repair. An association between mesh use and hernia size 77 may drive this finding; however the association between mesh use and reduced risk of recurrence 12 may mean we underestimate overall recurrence in our sample due to non-response bias.
Comparison of early and late respondents is a particular strength of this paper, as survey literature suggests that individuals who require more contacts before survey response could be more similar to non-respondents, 45 and thus follow-up efforts like additional reminders can reduce non-response bias.24,28,29 Though we observe some statistical differences between early and late respondents, differences are largely minor and distinct from those unadjusted differences between respondents and the survey population. This suggests that our employment of additional reminders and extended follow-up may not be effective in reducing non-response bias as we fail to capture individuals more representative of the underlying population. Future work to investigate non-response bias should include description of differences in exposure-outcome associations between early and late respondents: for example, if late respondents’ outcomes are measured weeks to months after the outcomes of early respondents, and late respondents are less likely to have received mesh, we may estimate a false association between mesh use and recurrence simply due to late respondents’ longer time window during which a hernia could recur. 68 It is for this reason that we calculate and monitor median follow-up time in this analysis.
To further improve our generalizability we employed a non-response and raking weighting scheme. 29 Weighting allows for correction of imbalances on factors that potentially confound the association between PROs and likelihood of response, e.g., patient age or surgical priority. The auxiliary variables necessary for post-survey adjustment for non-response were readily available within the MSQC-COHR, including detailed demographic and clinical data on non-respondents.33,67 Our weighting scheme allowed for balance on all measured covariates between the study population and weighted respondents.
Replicability
A substantial goal of this project was to ensure that our survey process and results could be replicated for our registry into the future. We employed responsive survey design 24 to test, through multiple phases, survey mode, number of reminders, and incentive offer, all with a focus on cost effectiveness. Costs arose from two areas: staff resources and incentives. First, though non-FTE-dependent methods for survey collection (i.e., email/SMS distribution of electronic surveys) have been demonstrated as equally reliable and less cost-intensive than FTE-dependent methods (i.e., telephone interviews),42,78 we identified that mixed non-FTE and FTE-dependent strategies (i.e., use of telephone modality) captured a more representative sample than non-FTE-dependent methods only. Thus, we concluded that focused use of staff resources, like targeted use of telephone calls, was a cost-effective approach. Second, though reminders demonstrated some returns to survey response, the marginal returns to additional reminders diminished over time as all cohorts captured over two thirds of their total respondents by the end of the second reminder. Ideally, the benefits associated with the use of reminders must be balanced with their operative costs.25,43 By our final design phase, we identified four reminders as a cost-effective number.
Financial incentives were designed to minimize non-response bias among individuals who would have otherwise been non-respondents. 46 We tested their utility in two ways: towards likely non-respondents only, and across an entire cohort. Though counter to the majority of survey participation literature, we failed to observe key improvements in response rate with offer of a post-paid $10.00 incentive 33 or any differences in demographic or clinical patient types between respondents who were and were not offered incentives, indicating no likely reduction in non-response bias. At $10 per person, the incentive offer amounted to a major cost for our statewide effort but may not have been financially meaningful to patients. Thus, in future iterations of the survey we will discontinue the use of incentives and instead target patients’ salience and “intrinsic motivation” to participate through initial mention of the survey during clinical interactions, tailoring of the survey’s introductory language, and integration of the survey into the patient portal.46,72 As a positive, we did not find a decrease in response quality with the offer of incentives, 46 as item non-response was not meaningfully different in incentive versus non-incentive cohorts.
Limitations
This study was conducted in a single US state (Michigan) and within a clinical quality initiative (CQI, i.e., MSQC-COHR), which provided key infrastructure to our survey effort. However, this approach also has limitations. MSQC-COHR captures the vast majority (>90%) of our target population, but the remaining 10% of hernia cases in the state may be meaningfully different. Further, the use of a proprietary algorithm to sample cases leaves us unable to consider potential effects on sampling variance. Our dependence on a statewide registry of surgical patients with linked demographic and clinical data and contact information may make the application of our practices less straight-forward in other contexts. Nonetheless, the growing movement to form state-wide CQIs for surgical specialties 79 will hopefully expand the ability of clinicians in other states to collect population-level post-operative survey data. Even without the support of a larger CQI, our survey validation approach could feasibly be adopted by single institutions to better monitor patient outcomes over time.
Another limitation of this study is the degree of missingness in our data across eight covariates, largely concentrated within the first year of the MSQC-COHR database during which not all hospitals in the state were yet fully capturing hernia-specific covariates from patient charts. To account for this missingness, we coded for missingness in our weighting models, but a lack of full data limits our ability to evaluate and account for non-response bias. Another limitation is our inability to account for unobservable patient variables, particularly those representative of socioeconomic status not collected by the MSQC,44,80 thus limiting the power of our selection bias investigation and adjustment.33,43 However, we do not anticipate that the lack of these variables introduces significant bias into our results given the extent of the auxiliary data we have. In our study we did not capture non-English speaking hernia patients and instead categorized them as non-responders. Preferred language is not collected in our dataset, and so we were unable to evaluate whether non-English speaking nonrespondents were systematically different from English-speaking respondents. Future survey efforts may incorporate additional languages, such as Spanish or Arabic, to improve generalizability to all races and ethnicities within our state. Finally, findings on the effect of an incentive in cohort P1b are confounded with the additional survey invitation, and so we have focused our analysis of incentives on response rate to the comparison of cohorts 2 and 3.
Moving beyond response rates
The overall response rate across all four cohorts was 29.9%. Prior studies of PRO surveys in surgical cohorts have yielded widely varying 1-year response rates, from around 30%25,26 to upwards of 80%. 10 For example, Parrish et al. (2020) report a 43.6% response rate amongst orthopedic patients at a single U.S. institution whose outcomes were collected at 1 year post-operation either during a clinic visit (via tablet) or at home (via email). 37 In a statewide email-based survey of U.S. bariatric patients at 1-year post-surgery, Alvarez et al. (2021) found significant hospital-level variation (21.1% to 77.3%) in response rate, which the authors attributed to differences in procedure: hospitals with higher response rates had encouraged patients to complete paper surveys in clinic. 25 However, both of these specialties—orthopedics and bariatrics—can leverage more established long-term patient follow-up than hernia. Within hernia, the Danish Ventral Hernia Database touts exceptionally high response rates (>80%), 10 but such rates would be near-impossible to achieve in the US without a nationalized health system with permanent patient identification numbers.18,21 Instead, our approach—targeted multi-modal survey distribution to patients within a registry—is more practical within the U.S. healthcare environment and provides a comparable response rate to 1-year surveys conducted in person.
Conclusion
Patient-reported outcomes (PROs) are integral to the understanding of long-term hernia repair success. In this study, we report a pragmatic and sustainable methodology for survey collection implementation of validated PROs at 1 year within a statewide hernia surgical population, improving upon prior studies that require in-person collection of PROs. 2 Through responsive survey design we tested and implemented key techniques to reduce the risk of non-response bias through our sampling strategy, multimode contact methods, validated PROMs, and survey weighting scheme,33,69 and we transparently identified successes of our survey methods. Continued survey recruitment methods will be adapted to mitigate non-response bias. Our study offers a framework to successfully measure population-based long-term patient reported outcomes, within and beyond the field of hernia, so that we may improve upon the current information asymmetry between patients and surgeons, in which risk factors for recurrence, pain, and poor quality of life at 1 year and beyond are largely unknown. 10
Footnotes
Authors’ note
AK is an MD-PhD candidate (Epidemiology) at the University of Michigan (UM). TSG is an Associate Research Scientist at the Survey Research Center/Institute for Social Research at UM. BF is a general surgery resident at UM. AH is a Research Area Specialist Senior at the Center for Healthcare Outcomes & Policy and a PhD student in Health Infrastructure and Learning Systems (HILS) at UM. JY is a Project Coordinator for the Michigan Surgical Quality Collaborative and an MPH candidate at UM. MR is a Clinical Assistant Professor (Health Management and Policy) at UM. DT is Professor of Surgery at UM.
Acknowledgements
Thanks to the members of the Core Optimization Hernia Registry team, particularly Kiran O’Connor, Deena Sukhon, and Graham Gilliam for their assistance in conducting phone surveys; and Yuxuan Chen (Michigan Surgical Quality Collaborative) for data management support.
Ethical considerations
This quality improvement study was exempt from regulation by the University of Michigan Institutional Review Board (HUM00091060).
Author contributions
Survey design and rollout were conducted by AH, JY, and DT. AK merged and analyzed the data, developed the weighting scheme, interpreted all data, and wrote the manuscript. BF provided data support. TSG and MR provided survey design and analytic support. All authors read and approved the final manuscript.
Funding
The authors disclosed receipt of the following financial support for the research, authorship, and/or publication of this article: This work was supported by NINDS [grant number T32GM007863] (AK), NIMHD [grant number F30MD019520] (AK), NIH [grant number T32AG062403] (BF), and NIDDK [grant number R01DK128179]. The Michigan Surgical Quality Collaborative (MSQC) is funded as part of the Blue Cross Blue Shield of Michigan Value Partnership program. The content of this study is solely the responsibility of the authors and does not necessarily reflect the official views of Blue Cross Blue Shield of Michigan. No funder or sponsor had any role in the design and conduct of the study; collection, management, analysis, and interpretation of the data; preparation, review, or approval of the manuscript; or decision to submit the manuscript for publication. AK had full access to all the data in the study and takes responsibility for the integrity of the data and the accuracy of the data analysis.
Declaration of conflicting interests
The Authors declare that there is no conflict of interest. Dr Telem receives consulting fees from Medtronic.
Data Availability Statement
The data that support the findings of this study are available from the Michigan Surgical Quality Collaborative (MSQC) but restrictions apply to the availability of these data, which were used under agreement for the current study, and so are not publicly available. Data are however available from the authors upon reasonable request and with permission of Blue Cross Blue Shield of Michigan.