
Abstract
Two-step approaches for synthesizing proportions in a meta-analysis require first transforming the proportions to a scale where their distribution across studies can be approximated by a normal distribution. Commonly used transformations include the log, logit, arcsine, and Freeman-Tukey double-arcsine transformations. Alternatively, a generalized linear mixed model (GLMM) can be fit directly on the data using the exact binomial likelihood. Unlike popular two-step methods, this accounts for uncertainty in the within-study variances without a normal approximation and does not require an ad hoc correction for zero counts. However, GLMMs require choosing a link function; we illustrate how the AIC can be used to choose the best fitting link when different link functions give different results. We also highlight how misspecification of the link function can introduce bias; using an empirical sandwich estimator for the standard error may not sufficiently avoid undercoverage due to link function misspecification. We demonstrate the application of GLMMs and choice of link function using data from a systematic review on the prevalence of fever in children with COVID-19.
Generalized linear mixed models (GLMMs) allow for the synthesis of proportions from a meta-analysis using a one-step approach, where the model is fitted directly on the study proportions without first transforming them. GLMMs incorporate uncertainty in the within-study variances without normal approximation and do not require an ad hoc correction for zero counts.
Misspecification of the link function can lead to bias and subsequent undercoverage, which cannot necessarily be negated by an empirical sandwich estimator for the variance of the fixed effect. The probit and logit links tend to lead to similar results, while the cloglog differs; these differences are greater when the prevalence is high. The AIC can be used to select the best-fitting link function; we demonstrate this process using an applied example about the prevalence of fever in children with COVID-19.
GLMMs should be considered as a flexible alternative to two-step methods when synthesizing proportions in a meta-analysis; however, we recommend assessing the sensitivity of results to the choice of link function and subsequently choosing a link based on model selection criteria such as the AIC.What is already known
What is new
Potential impact for readers outside the authors’ field
Background
Several different approaches exist for synthesizing proportions in a meta-analysis within a random effects framework. Two-step methods require first transforming the study proportions from a 0% to 100% scale to one where the distribution of proportions across studies can be approximated using a normal distribution. Commonly used transformations include the log, logit, arcsine, and Freeman-Tukey double-arcsine transformations. 1 A random effects model can then be fitted on these transformed proportions, and the results subsequently transformed back to the original scale. Alternatively, a generalized linear mixed model (GLMM) can be fitted directly on the observed study proportions without transforming them in a separate step.1–4 This uses the exact binomial likelihood of the observations and importantly, unlike two-step approaches, accounts for uncertainty in the within-study variances and does not require an ad hoc correction for zero counts.2,3,5 Furthermore, Schwarzer et al. 1 and Röver and Friede 6 highlighted bias and inconsistent results due to issues of monotonicity and invertibility that can occur when using the Freeman–Tukey double-arcsine transformation (FTT) in the meta-analysis of proportions.
GLMMs can be easily extended to the case of multivariate meta-analysis, where related proportions of multiple outcomes or treatments may be reported in each study, and these outcomes are modeled jointly.7–9 These multivariate methods are particularly useful when one or more outcomes have missing data. In this case, they borrow information across outcomes, increasing precision and avoiding bias when the data are missing at random.10,11 In addition to the meta-analysis of prevalence data, 8 multivariate GLMMs have been frequently implemented in the meta-analysis of diagnostic test accuracy12–15 as well as network meta-analysis.16–21
GLMMs can be easily implemented using popular software packages such as R, 22 SAS, and Stata. The “meta” 23 and “metafor” 24 packages in R can be used to fit frequentist GLMMs in the specific context of meta-analysis; however, the R package “lme4” 25 can also be used. In SAS software, the GLIMMIX and NLMIXED procedures can be used to fit frequentist GLMMs, while the BGLIMM procedure can be used for Bayesian GLMMs. 26 The “meglm” and “metan” 27 commands in Stata can be used for frequentist GLMMs, while the “bayes: meglmc” command can be used for Bayesian GLMMs. Each of these methods is user-friendly, with little coding necessary. Empirical sandwich estimators of the variance are easily implemented in SAS software, using the EMPIRICAL option in the GLIMMIX or NLMIXED procedure, or by specifying “vce(robust)” in Stata.
A current limitation of the GLMM is that while the sample sizes for each study are incorporated when constructing the likelihood, unlike with the two-step approaches, explicit weights for each study are not available. However, how to quantify the contribution of each study can be an area of future work. Another limitation is that random effects models may result in overdispersion of the data relative to the model.28,29 One could alternatively use the generalized estimating equations (GEE) method to estimate the population-averaged proportion; this approach would be robust to misspecification of the covariances within studies. 30 However, the investigation of between-study heterogeneity is a central component of meta-analysis, and this type of approach would not explicitly model this heterogeneity. 31
While GLMMs offer a flexible and accessible approach to conducting a meta-analysis of proportions, they require choosing a link function and making a parametric (typically normal) assumption about the random effects distribution. In this paper we explore the robustness of GLMMs in the meta-analysis of proportions to misspecification of the link function, and whether the AIC can be used to reliably select the best fitting link. We illustrate this model selection process using data on the prevalence of fever from 36 studies included in a recent systematic review and meta-analysis of clinical characteristics and laboratory findings in children with COVID-19. 32
Generalized linear mixed model (GLMM)
We begin by reviewing the formulation of the GLMM for univariate proportion data. Let
As previously mentioned, the GLMM is fitted directly to the data using a “one-step approach” and fully accounts for uncertainty in the observed within-study variances, whereas traditional “two-step” approaches assume these variances within studies are known.2,3 Furthermore, the flexibility in the choice of link function allows the GLMM to accommodate different distributional shapes. For example, the cloglog and cauchit links can allow for skewed and heavy-tailed latent distributions, respectively. 2 One can select a link function based on model selection criteria such as the Akaike information criterion (AIC), or equivalently the Bayesian information criterion (BIC) (see Appendix), or consider model averaging in a Bayesian framework. To investigate this further, we explored the robustness of GLMMs to link function misspecification in the meta-analysis of proportions and whether the AIC can reliably select the best fitting link function. We also assessed whether using an empirical sandwich estimator of the variance of the fixed effect could minimize undercoverage bias due to link function misspecification.
Simulations
Methods of simulation
We simulated 2000 iterations of data within SAS On Demand for Academics using one of three links (cloglog, logit, or probit) under several different true median prevalences (π = 0.05 or 0.3) and between-study standard deviations, (τ; = 0.5, 1, 1.5, or 3); each simulation contained 25 studies with 100 participants each. We fitted six GLMMs using the GLIMMIX procedure for each set of simulated data, assuming a different link function and variance estimator (model-based or “MBN” empirical sandwich), and then found the AIC, bias, and the 95% coverage probabilities from each model.
Simulation results
The coverage using both the empirical sandwich and model-based standard errors largely remained near 95% when the link function was correctly specified (Figure 1). For cases where π = 0.3, if the data were generated from a logit link and a probit link was assumed, the coverage remained near 95% (and vice versa). However, when data were generated using a cloglog link, using a probit or logit link for the analysis resulted in coverage below 95% (and vice versa). This difference between the probit and logit links compared to the cloglog link became more apparent as the between-study heterogeneity increased. When π = 0.05, the coverage probabilities were less sensitive to the choice of link function. 95% coverage across 2000 simulations when the median prevalence (π) was 0.3; the left side shows the results for the model-based SE estimator and the right side shows those for the sandwich estimator. Each panel represents the true link function and the x-axis represents the between-study standard deviation (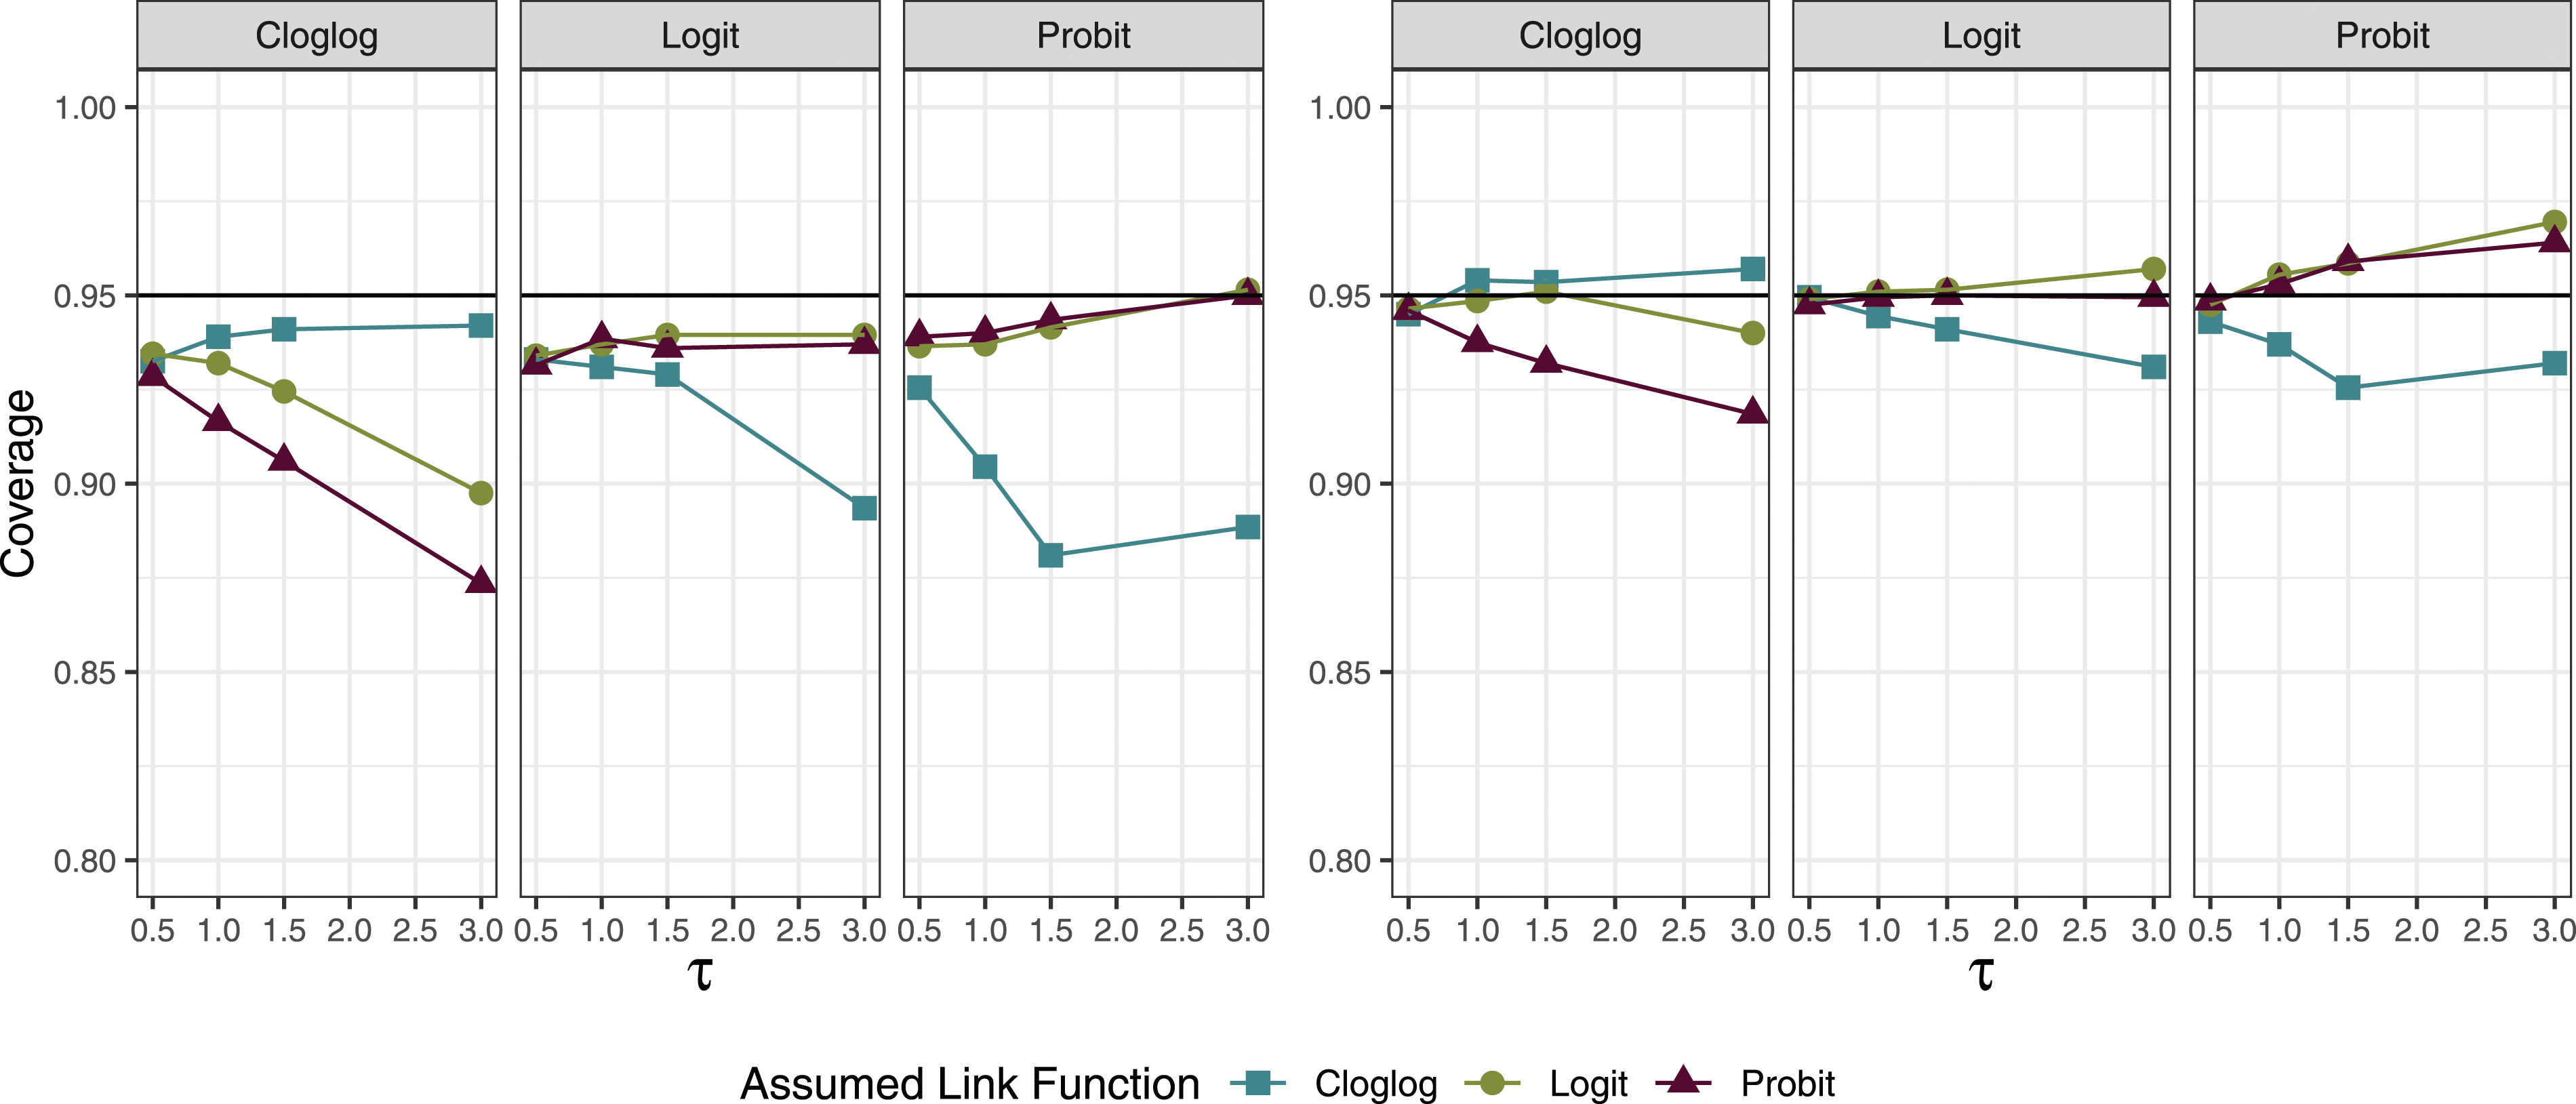
The bias tended to be lowest when the link function was correctly specified and the between-study variance was low. The impact of model misspecification on the bias was larger when π = 0.3 than when π = 0.05 (Figure A.2). We hypothesize that this is due to the shapes of the link functions, as the functions resemble each other more closely in the lower tail (Figure A.3).
We saw that using the model-based estimator tended systematically towards undercoverage and that the sandwich estimator tended towards over-coverage (Figure 1 and A.1). Coverage issues are driven both by the accuracy of the estimated standard error and by bias; the use of an empirical sandwich estimator will not remedy bias due to an ill-fitting link. However, undercoverage was slightly less extreme when using the sandwich estimator than the model-based estimator, as the average estimate of the standard error (MBSE) was more similar to the empirical standard error (ESE) when using the sandwich estimate, compared to the model-based estimate (average absolute difference for sandwich across all conditions: 0.01, for model-based: 0.03).
While the AIC had difficulty differentiating between logit and probit links when π = 0.3, as their shapes are similar, we observed that the AIC was able to correctly differentiate between a cloglog and a logit/probit link at least 47% of the time when the between-study standard deviation was 0.5 (Figure 2). As this standard deviation increased to 3, the rate increased to over 75% for all true links. We observed the largest impact of link function misspecification on bias and coverage in scenarios with high between-study heterogeneity; thus, the AIC’s differentiation ability was the greatest in scenarios where the correct specification of the link function was most important. Each bar shows the proportion of the 2000 simulations in which each link function was chosen by AIC when the true median prevalence (π) was 0.3. Each panel represents the true link function and the x-axis represents the between-study standard deviation (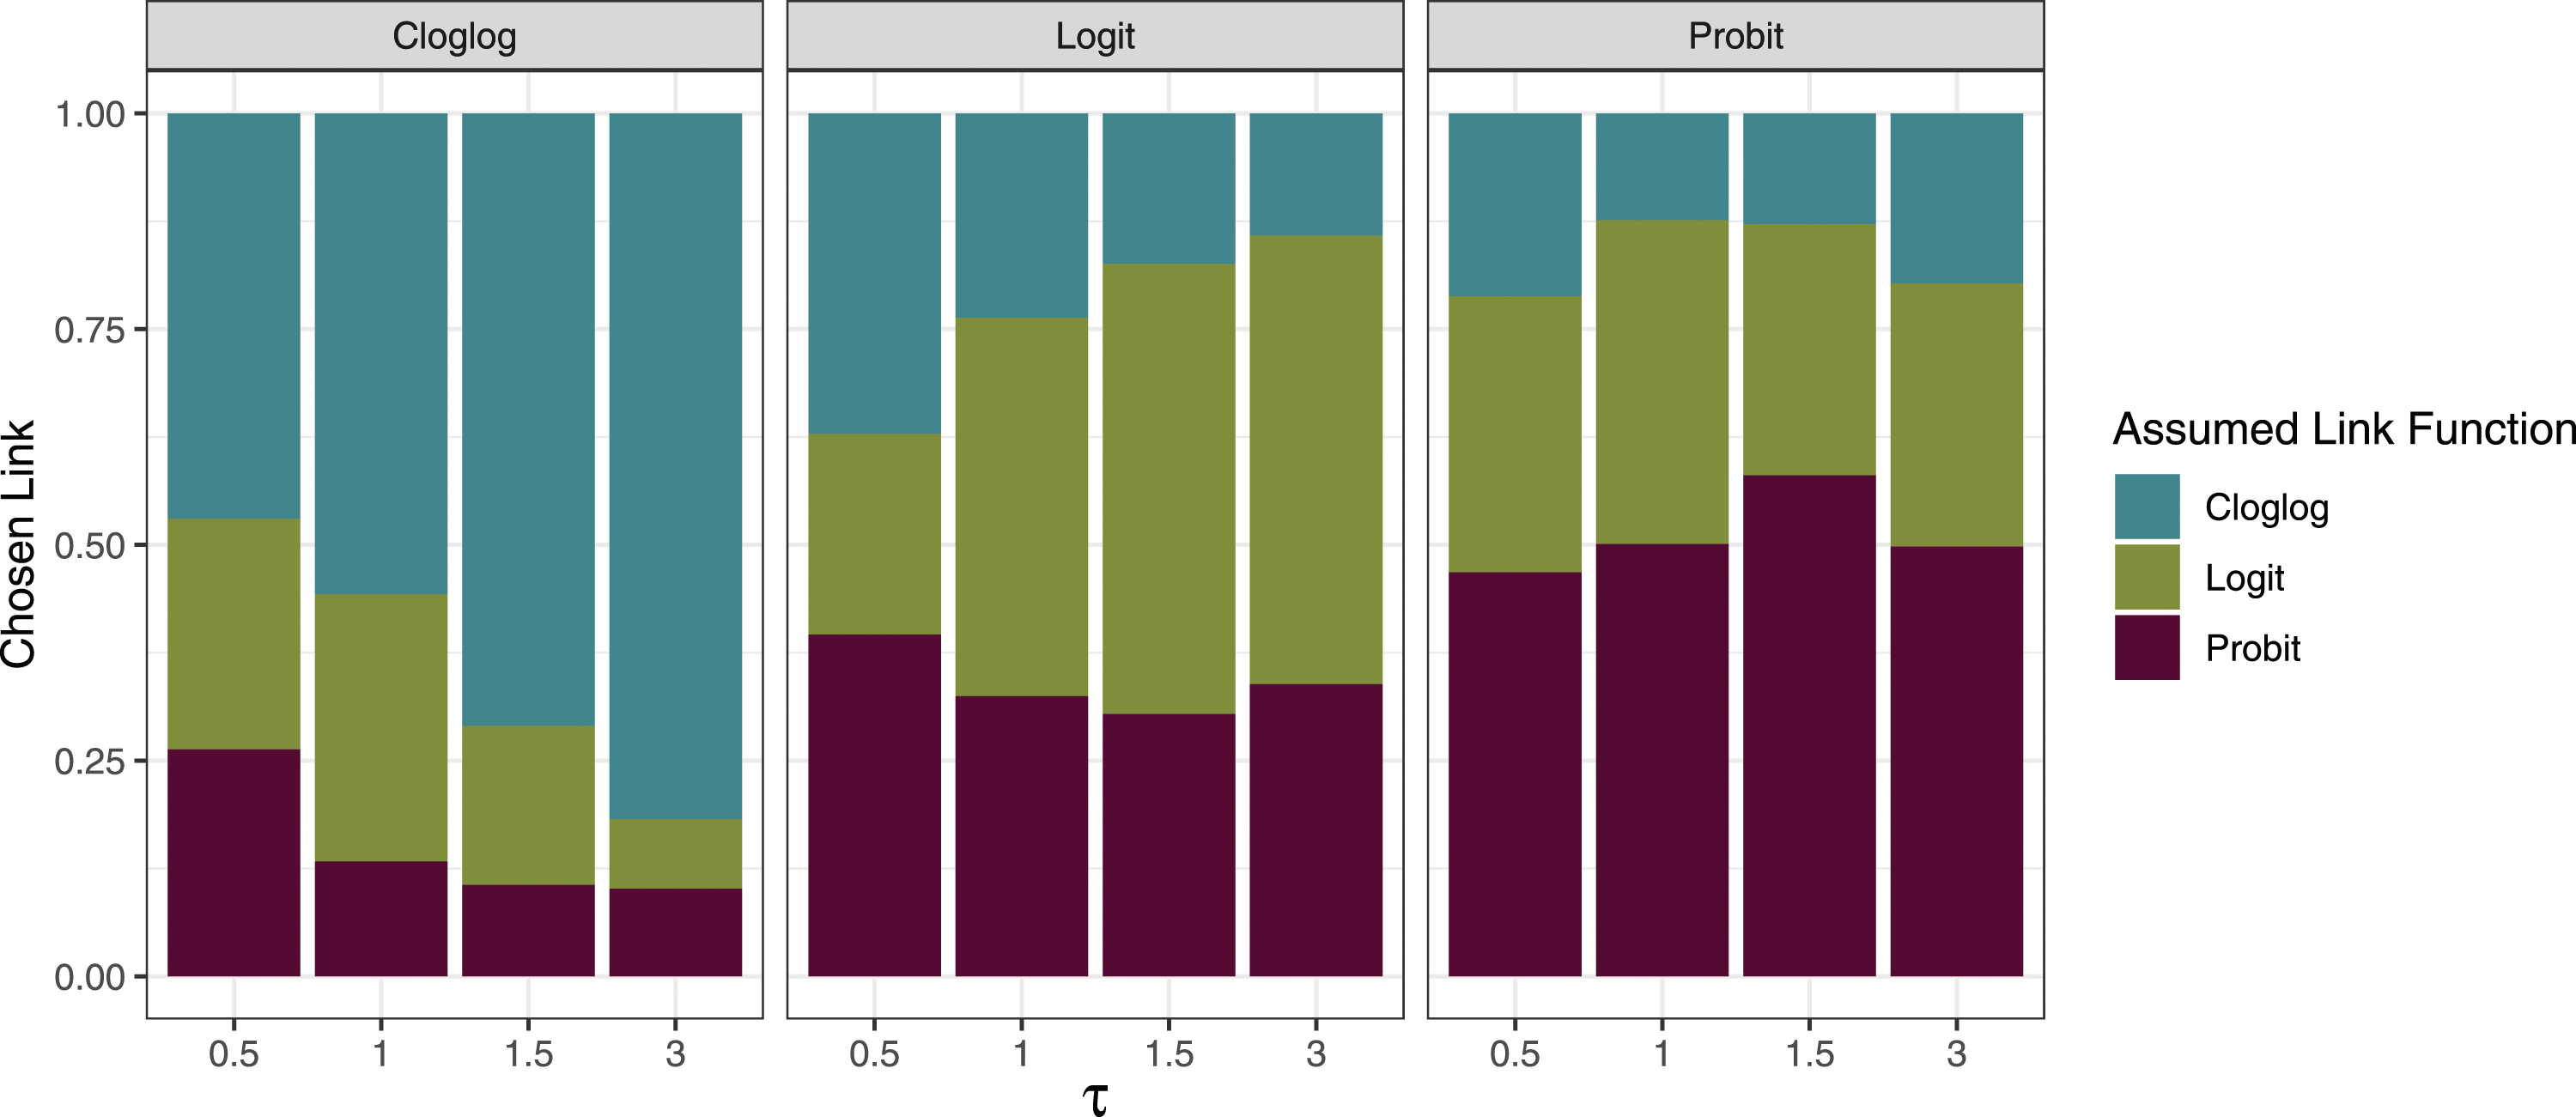
Prevalence of fever in children with COVID-19
Median prevalence (95% CI) and 95% prediction interval for a new study prevalence of fever estimated using GLMM with different link functions and model-based or empirical standard error (SE).
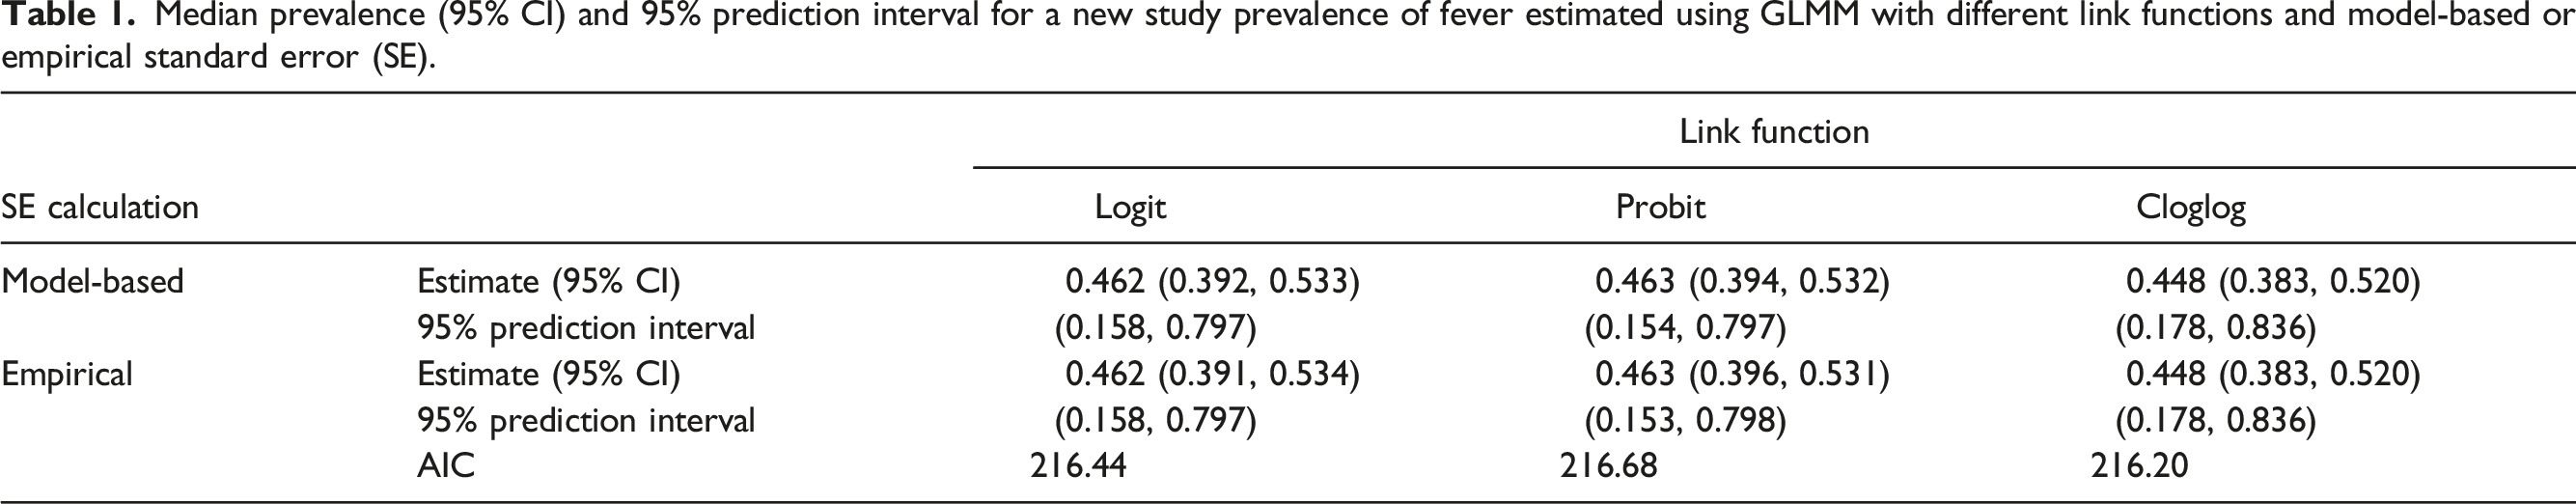
With the cloglog link, the estimated median prevalence of fever in children with COVID-19 was 44.8% (95% CI: [28.2%, 52.0%]). The study-level and pooled prevalence estimates are shown in Figure A.5. The 95% prediction interval indicates that we would expect 95% of future studies to have a prevalence of fever between 17.8% and 83.6%. We can plot the entire estimated distribution of study prevalences from the model, as shown in Figure A.6. This wide range of predicted values indicates a high degree of heterogeneity in the prevalence of fever across the pediatric studies included in the meta-analysis.
Conclusions
GLMMs provide an interpretable and flexible approach to summarizing proportions in a meta-analysis of multiple related studies. However, using a GLMM requires specifying a link function, and different choices can lead to different results. In particular, while the logit and probit functions generally have similar shapes, the cloglog link differs more substantially. As misspecification of the link function can lead to bias, undercoverage due to a misspecified link function cannot necessarily be avoided by using an empirical sandwich estimate of the variance, though we observed a small improvement when using this. To address this, we found that the AIC is an effective tool for choosing the link function in cases where alternate link functions give differing results. We recommend investigating the sensitivity of results to the choice of link function when conducting meta-analyses of proportions using GLMMs and using the AIC to choose the best-fitting link function when these results differ.
Footnotes
Declaration of conflicting interests
The author(s) declared no potential conflicts of interest with respect to the research, authorship, and/or publication of this article.
Funding
The author(s) disclosed receipt of the following financial support for the research, authorship, and/or publication of this article: This work was supported by the NIH National Heart, Lung, and Blood Institute (T32HL129956) and the NIH National Library of Medicine (R01LM012982).