
Abstract
Background
Meta-analysis is a popular approach for combining results from multiple studies investigating the same questions. Meta-analysis has gained wide popularity in genomic analysis due to the availability of large volumes of genomic study results from public databases. In genomic meta-analysis, researchers, often, tend to combine p-values related to significance testing of a gene from multiple studies where thousands of genes are tested simultaneously. The traditional p-value combination approaches aim to find genes which are differentially expressed in at least one of studies. An alternative form of meta-analysis has, recently, gained popularity where the aim is to find genes that are consistently differentially expressed in a large number, possibly a majority, of studies. An approach based on weighted ordered p-values (WOP) has been developed, in the recent past, to perform the latter type of meta-analysis.
Methods
In this article, we discuss the limitations of the WOP meta-analysis method due to its adherence to the standard null distributional assumptions of classical meta-analysis that can lead to incorrect significance testing results. Moreover, we propose a robust meta-analysis method for simultaneous significance testing of multitude of genes that improves the WOP approach using an empirical modification.
Results
Through simulation studies, we demonstrate the superiority of our proposed method over the existing WOP meta-analysis by substantially reducing false discoveries of significant genes and controlling type-I error rates especially in the presence of unobserved confounding variables. We illustrate the utility of our proposed method through a variety of meta-analysis of genomic studies in different diseases.
Keywords
Introduction
Meta-analysis of multiple genomic studies has become a common practice in recent years due to the fast developments in high-throughput technology and the availability of huge amount of data in public databases.1–3 The individual genomic studies, usually, have much smaller sample sizes compared to the number of genes which might result in loss of power of statistical detection after adjusting for multiplicities. Meta-analyzing the results from these individual studies can greatly increase the power of the tests and, therefore, has been recognized as an appropriate method for statistical detection and widely adopted in genomic studies. 4 Although several meta-analysis methods have been developed over the past few years, there are two main approaches for classical meta-analysis. 5 The first approach is to directly combine p-values of statistical testing from multiple studies. This approach includes popular methods such as the Fisher’s combined probability test, 6 the Stouffer’s Z test, 7 and the weighted variations of these methods. 8 The second approach combines the model-based effect sizes from different studies which includes method such as GeneMeta. 9 Even though both the approaches have their advantages and disadvantages, the first approach combining p-values is more flexible as it requires less information and assumption from individual component studies. In this article, we focus on the meta-analysis methods that directly combine p-values from multiple studies.
The aim of the classical meta-analysis methods combining p-values from multiple studies, such as the Fisher’s
6
or the Stouffer’s method,
7
is to test the alternative hypothesis that at least one of the studies is non-null. For example, in the genomic significance testing context, these methods test the alternative hypothesis that a gene is differentially expressed in at least one study against the null hypothesis that it is not differentially expressed in any of the studies. However, in meta-analysis of genomic studies involving thousands of genes, often it is more reasonable to identify a small subset of genes that are differentially expressed consistently in a majority of studies as opposed to only one or a few studies.
5
In recent years, a few methods have been developed to address this issue.5,10,11 These methods order the p-values for the same gene obtained from the different studies and use either a specific
Under the WOP framework, although many classical p-value combination approaches can be expressed, Li and Ghosh mainly focused on the two popular tests - Fisher’s combined probability test and the Stouffer’s Z test. One of the key assumptions of the classical p-value combination approaches, including the Fisher’s and the Stouffer’s methods, is that the p-values obtained from the individual studies are uniformly distributed under the null hypothesis of no differential expression. However, in large-scale multiple testing problems, this distributional assumption of the p-values may be violated 12 which can raise questions on the p-value combination approaches of Fisher, Stouffer, and hence the WOP method as well. One of the main differences that exists between a single hypothesis testing framework and a large-scale testing of multiple hypotheses, e.g., 10,000 hypotheses, is in their goals. In a single hypothesis testing framework, one is interested to reject a null hypothesis in favor of an alternative hypothesis with high power, say 90%, whereas in large-scale multiple hypothesis testing of thousands of genes, one often expects to identify a small number of significant genes that can be carried forward for further investigation. That is, it is not desirable to reject 90% of the 10,000 null hypotheses in multiple hypotheses testing of 10,000 genes unlike that in a single hypothesis testing. Rejecting a large proportion of null hypotheses of no significance in simultaneous testing of multiple genes, often, indicates false discoveries which can get multiplied when combining results through meta-analysis. This implies that, although a meta-analysis is usually performed to gain power and decrease type-II error rate, caution should be practiced in large-scale meta-analysis involving thousands of simultaneous hypotheses testing so that the type-I error rates are not inflated, and false discoveries are controlled. This issue of inflated type-I error rate and false discoveries is widespread in large observational genomic studies due to the presence of unobserved variable and hidden confounder effects, e.g., unmeasurable technical artifacts during sequencing, and biological effects such as cell cycle status. 13 This is because, presence of hidden confounders or unobserved variables dilate the null (hypothesis) distribution, hence violating the underlying theoretical distributional assumptions of the test statistics and the p-values. The consequence can be more serious in the meta-analysis when the theoretical distributional assumptions are violated in many of the individual studies being meta-analyzed.14,15 Therefore, when p-values are the only sources of information available from the individual studies for meta-analysis, the distributional assumption of the p-values from individual studies needs to be valid or corrected for accurate statistical inference using the WOP meta-analysis method.
One way to solve this problem is to take advantage of the large-scale multiple hypothesis testing framework that allows us to estimate the null distribution empirically and, therefore, eliminating the need to rely on a theoretical asymptotic null distribution. 12 Empirical null distribution can take into account the variation and moderate bias caused by unobserved variables and hidden confounders in large observational studies. In this article we propose a meta-analysis method for large-scale genomic experiments that implements the WOP method while estimating the empirical null distribution parameters through an empirical Bayes approach. 12 Like the WOP method, our proposed method has advantage over the classical meta-analysis methods as it aims to identify genes that are differentially expressed consistently in a majority of studies. Additionally, our proposed method, being able to obtain the null distribution empirically, has much robust performance than the WOP method. Through a variety of simulation studies, we show that our proposed method successfully controls the type I error rate and greatly reduces the false discovery rate (FDR) in comparison to the WOP method, especially in presence of hidden confounding effects in the individual studies. We also show the utility of our proposed method through meta-analysis on three sets of genomic studies on lung cancer, brain cancer, and diabetes.
The rest of the article is organized as follows. In Methods section, we describe our hypothesis setting, the proposed empirically adjusted weighted ordered p-values meta-analysis method, and method for empirical estimation of null distribution. In the Results section, we present results from various simulation scenarios comparing the performances of our proposed method and the WOP method. We also illustrate the application of our proposed meta-analysis method on three different sets of genomic data. We end the article with a Discussion section.
Methods
Hypothesis setting and weighted ordered p-values statistic
Suppose there are
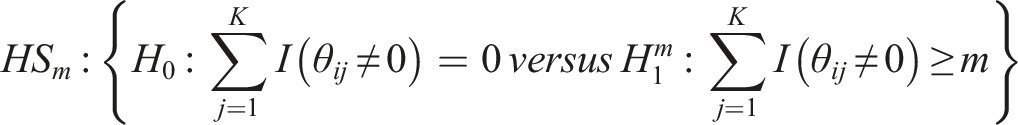
where
Note that, the hypothesis setting under our meta-analysis method can be generalized for any choice of
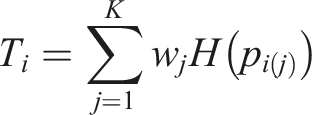
Next, we briefly describe the WOP meta-analysis statistic for testing
Proposed empirically adjusted weighted ordered p-values method
In this section, we describe our proposed meta-analysis method for testing
Assuming that there are
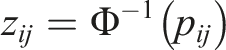
We obtain the p-value
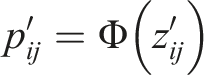
We consider the inverse z-transformation to get the corresponding z-scores as follows:
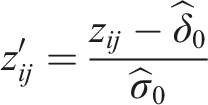
The z-scores in step 2 may not follow a standard normal distribution under the null hypotheses. Assuming that the null distribution of the z-scores is normal with mean These modified z-scores
We convert the empirically adjusted z-scores into corresponding p-values as:
For a gene
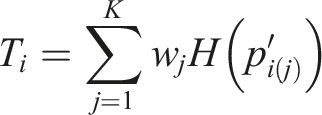
For gene (i) We randomly generate p-values from (ii) We calculate the summary statistic (iii) For gene Finally, we apply the Benjamini-Hochberg (BH) multiplicity correction method on the set of
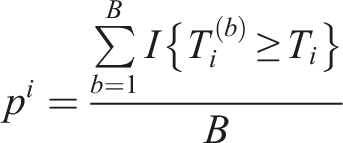
Note that, there is an alternative way for obtaining the p-value of the WOP statistic based on permutation analysis. 5 But this approach requires the original data for each study which, in most situations, are not readily available. Therefore, we focus on the more practical solution which involves computation of the p-values based on the numerical distribution of the WOP statistic as described above.
Empirical estimation of null distribution
Suppose the p-values corresponding to
The z-scores, corresponding to the
However, the above estimate of
Results
Simulation studies
We conducted simulation studies to evaluate the performance of our proposed method ENWOP for accurate identification of significant genes in a majority of studies. We simulated continuous gene expression datasets for multiple independent studies. Details of the data generation process are given below.
We considered 10 independent studies each involving continuous gene expression levels for 3000 genes, i.e.,
We generated the (log) expression level for the

For our simulations, we considered
For study


In our simulations, we assumed the presence of a hidden variable which acts as a confounder. The effect of the hidden confounder for the
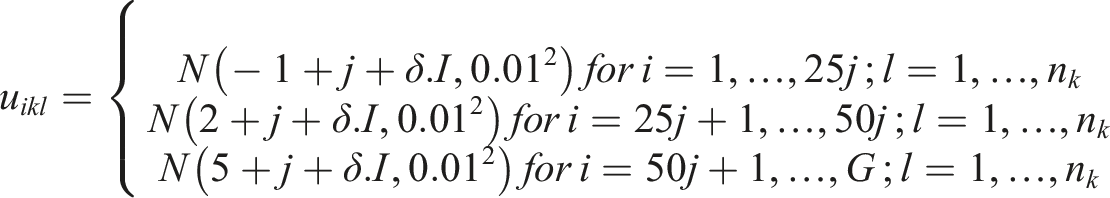
where
We introduced correlations among some of the genes through the generation of the error terms
We considered four groups of correlated genes given by
The error term
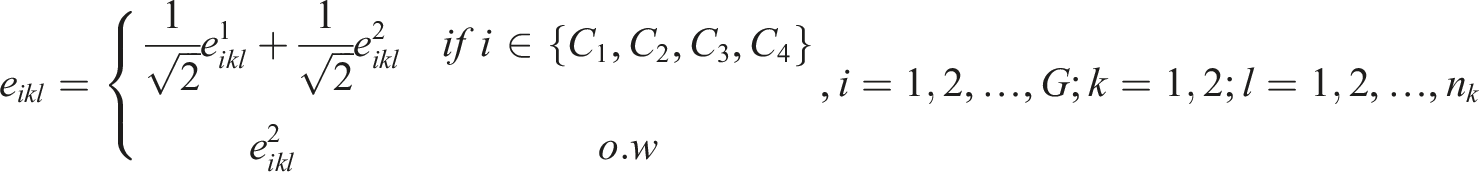
where
For each study, after generating the (log) gene expression values for all the subjects, we tested whether the genes are differentially expressed between the two subject groups using “limma” in Bioconductor
18
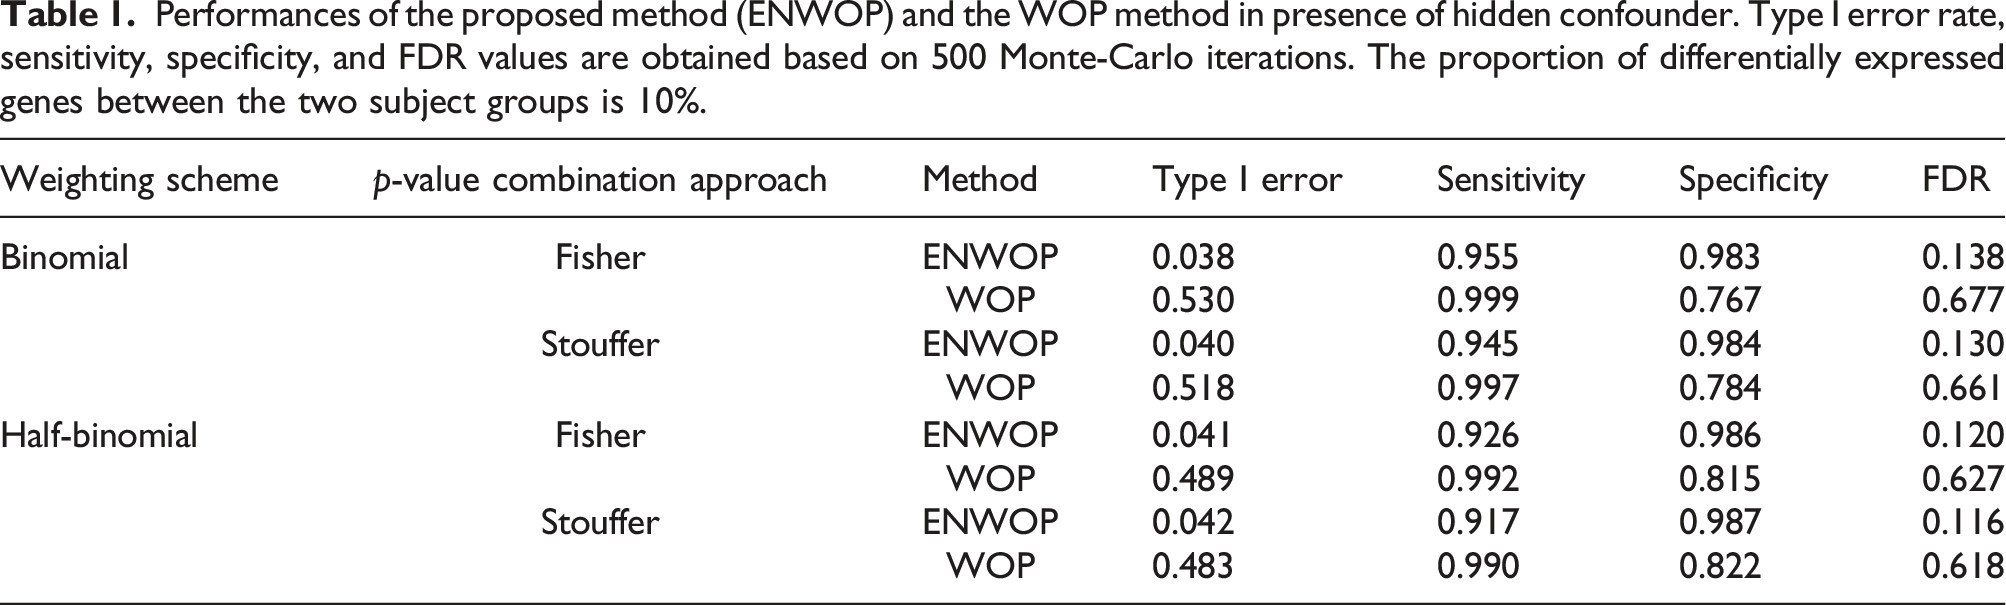
and stored the raw p-values. We then applied the ENWOP method and obtained the list of differentially expressed genes with a BH adjusted p-value cutoff of 0.05. We obtained the type I error rate for the ENWOP method as well as evaluated its performance using sensitivity, specificity, and FDR based on 500 Monte-Carlo iterations. Because of the hypothesis setup, as described in the Methods section, false positives and type I error are not the same. Type I error is rejecting the null hypothesis for a gene that is not differentially expressed in any of the studies while a false positive is rejecting the null hypothesis for a gene that is differentially expressed in less than
Performances of the proposed method (ENWOP) and the WOP method in presence of hidden confounder. Type I error rate, sensitivity, specificity, and FDR values are obtained based on 500 Monte-Carlo iterations. The proportion of differentially expressed genes between the two subject groups is 10%.
We, additionally, varied the proportion of differentially expressed genes between the two subject groups, ranging from 5% to 20%. Figure 1 shows the performances of the ENWOP method as well as the WOP method with varying proportion of differentially expressed genes in presence of hidden confounder in the studies. The ENWOP method has type I error rates controlled at 0.05 consistently in all settings, while the type I error rates of the WOP method are unacceptably high in the same simulated settings (see Figure 1). The FDR values of the ENWOP method are also much lower than those of the WOP method in all settings. Although the FDR values for the WOP method tend to decrease with the increase in the proportion of differentially expressed genes, they are substantially worse (higher) than our proposed ENWOP in every situation. The ENWOP method has slightly lower sensitivity values compared to the WOP method but the values increased when the proportion of differentially expressed genes is increased. The specificity values of the ENWOP method are close to one in all settings but the WOP method has much lower specificity values which further decreased as the proportion of differentially expressed genes is increased. Overall, our proposed ENWOP method significantly outperforms the WOP approach in all situations of hidden confounder presence by accurately identifying truly differential genes. Performances of the ENWOP method and the WOP method in presence of hidden confounder with varying proportion of differentially expressed genes between two subject groups. Type I error rate, sensitivity, specificity, and FDR values are obtained based on 500 Monte-Carlo iterations. WOP-BF: WOP method with binomial weighting scheme and Fisher’s p-value combination approach; WOP-BS: WOP method with binomial weighting scheme and Stouffer’s p-value combination approach; WOP-HBF: WOP method with half-binomial weighting scheme and Fisher’s p-value combination approach; WOP-HBS: WOP method with half-binomial weighting scheme and Stouffer’s p-value combination approach; ENWOP-BF: ENWOP method with binomial weighting scheme and Fisher’s p-value combination approach; ENWOP-BS: ENWOP method with binomial weighting scheme and Stouffer’s p-value combination approach; ENWOP-HBF: ENWOP method with half-binomial weighting scheme and Fisher’s p-value combination approach; ENWOP-HBS: ENWOP method with half-binomial weighting scheme and Stouffer’s p-value combination approach.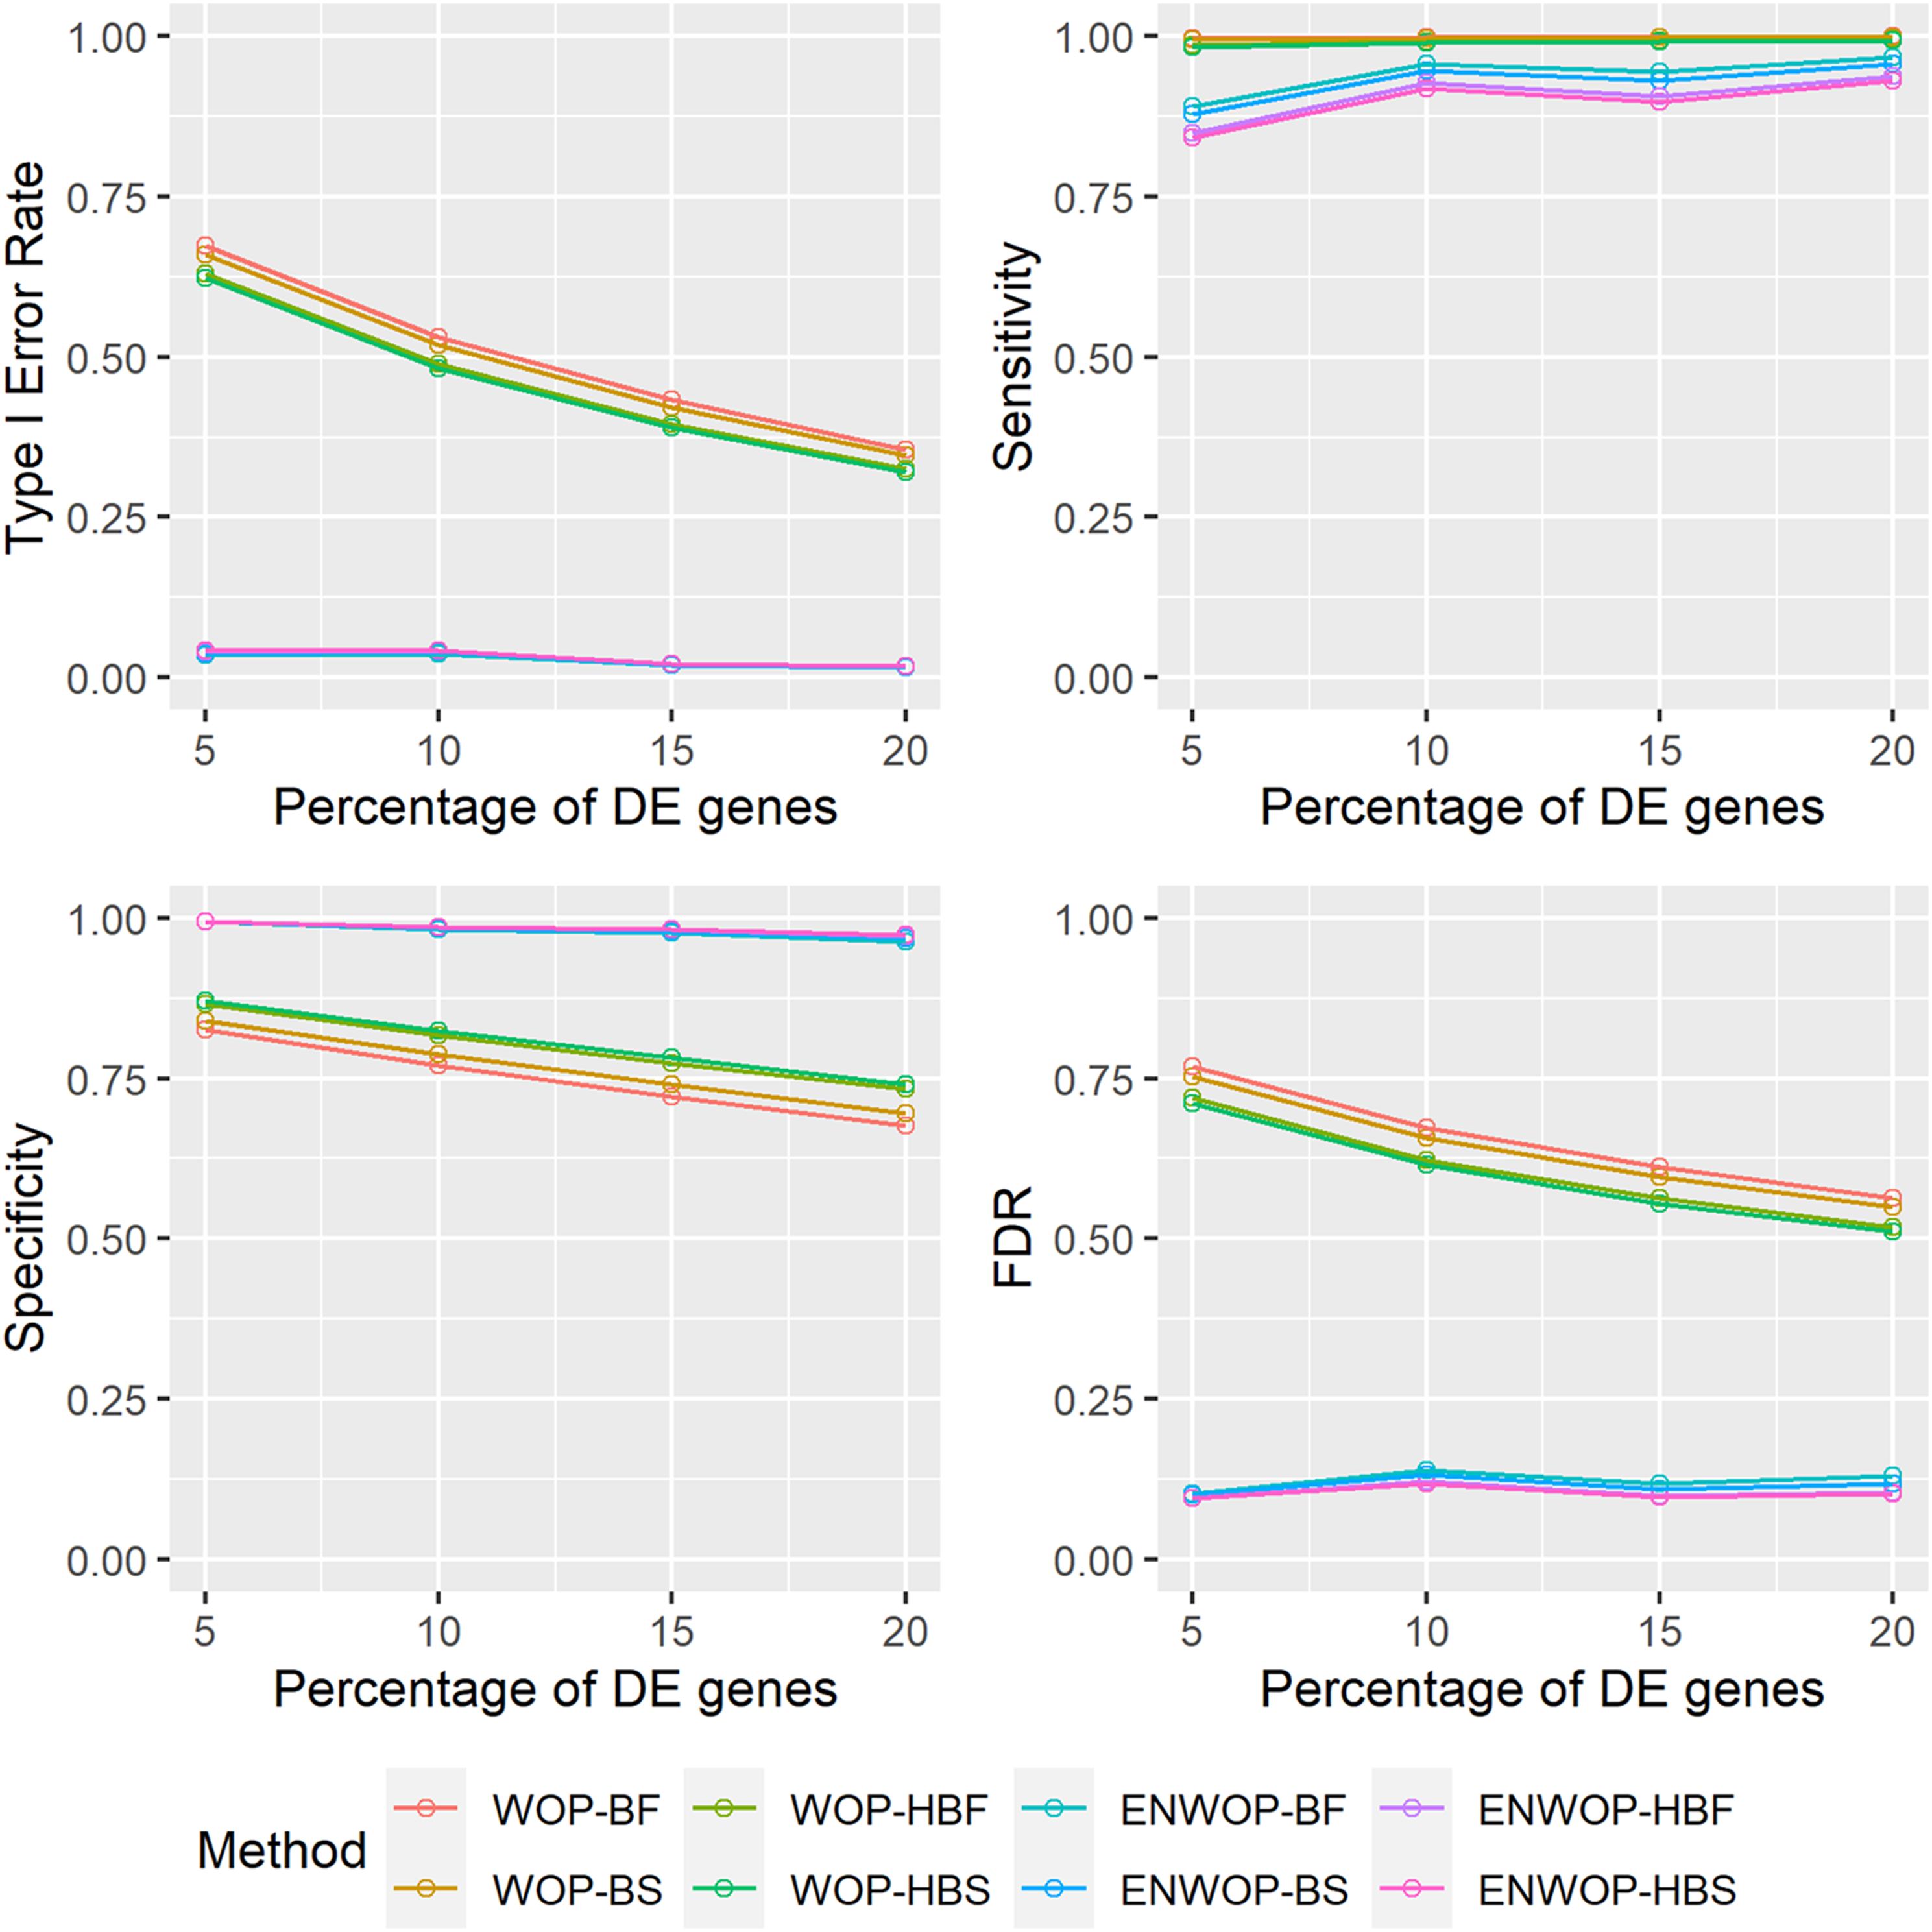
In addition to the simulated sceanrios with hidden confounders, we also considered some other variations in our simulation models. In particular, we considered a simulation scenario where we assumed the presence of a hidden variable that does not act as a confounder as well as a simulation scenario where there did not exist any effect of a hidden variable/confounder in the studies. Both scenarios are decribed below.
Presence of a hidden variable that does not act as a confounder
In this simulation scenario, we assumed the presence of a hidden variable which affects the outcome but does not vary between the two subject groups. We generated the distribution of the hidden variable for the 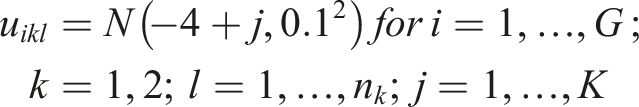
We considered 10% of the genes as differentially expressed between the two subject groups in at least five studies as considered before. The differences in magnitudes of (log) expression values of these differentially expressed genes are considered as two. All the other terms in the model for simulation are generated in the same way as described previously.
Supplementary Table 1 shows the results for the ENWOP method and the WOP method. In this simulation scenario, both the methods have controlled type I error rates under all settings. The FDR values of the ENWOP method are slightly lower compared to the WOP method. Both methods have very similar sensitivity and specificity values. The methods with half binomial weighting scheme have lower sensitivity as well as FDR values compared to those with binomial weighting scheme, similar to what we observed in presence of hidden confounder.
The performances of the two methods with varying proportion of differentially expressed genes, in the presence of hidden variable that does not act as confounder, are shown in Supplementary Figure 1. The type I error rates remained controlled at 0.05 for both methods consistently in all settings. Both the methods have similar FDR values for smaller proportion of differentially expressed genes, but the FDR values of the WOP method slightly increased with increase in the proportion of differentially expressed genes. The sensitivity values are very similar for both methods with half binomial weighting scheme having slightly lower values than binomial weighting scheme. Both methods have very similar specificity values.
No effect of any hidden variable
In this simulation scenario, we assumed that there is no effect of any hidden variable/confounder in the studies. Therefore, we set
Supplementary Table 2 shows the results for the ENWOP method as well as the WOP method. The type I error rates are controlled for both methods under all settings. The sensitivity and FDR values are slightly lower for the ENWOP method compared to the WOP method. Both methods have very similar specificity values. The half binomial weighting scheme have slightly lower sensitivity as well as FDR values compared to the binomial weighting scheme, consistent with what observed in the previous simulation scenarios.
Supplementary Figure 2 shows the simulation results for the two methods with varying proportion of differentially expressed genes when there is no effect of hidden variable/confounder in the studies. The performances of the methods are very similar to what we observed in the previous scenario in the presence of hidden variable that does not act as confounder.
An application to lung cancer studies
We conducted meta-analysis using the ENWOP method on five lung cancer gene expression datasets.14,19 These five studies will be referred to as Bhattacharjee,
20
GSE11969,
21
GSE29016,
22
GSE30219,
23
and GSE43580,
24
respectively. Each of the datasets contain normalized expression levels for 7200 genes, and subjects with different types of lung cancer. We aimed to identify the genes that are differentially expressed between two lung cancer types - adenocarcinoma (AD) and squamous cell carcinoma (SQ) in at least three out of the five studies. The sample size of each study is given in Supplementary Table 3(a). To obtain the original p-values for the genes for each dataset, we tested for differential expression between AD and SQ subjects using “limma”.
18
We applied the ENWOP method following the steps described in the Methods section. The empirically estimated mean and the standard deviation of the original z-scores are –0.83 and 1.99, respectively. That is, the empirical null distribution of the original z-scores is much different from the theoretical null distribution of
The number of significant genes (percentage) identified by our proposed method ENWOP and the WOP method with two choices of p-value combination approaches and two weighting schemes for the lung cancer meta-analysis.
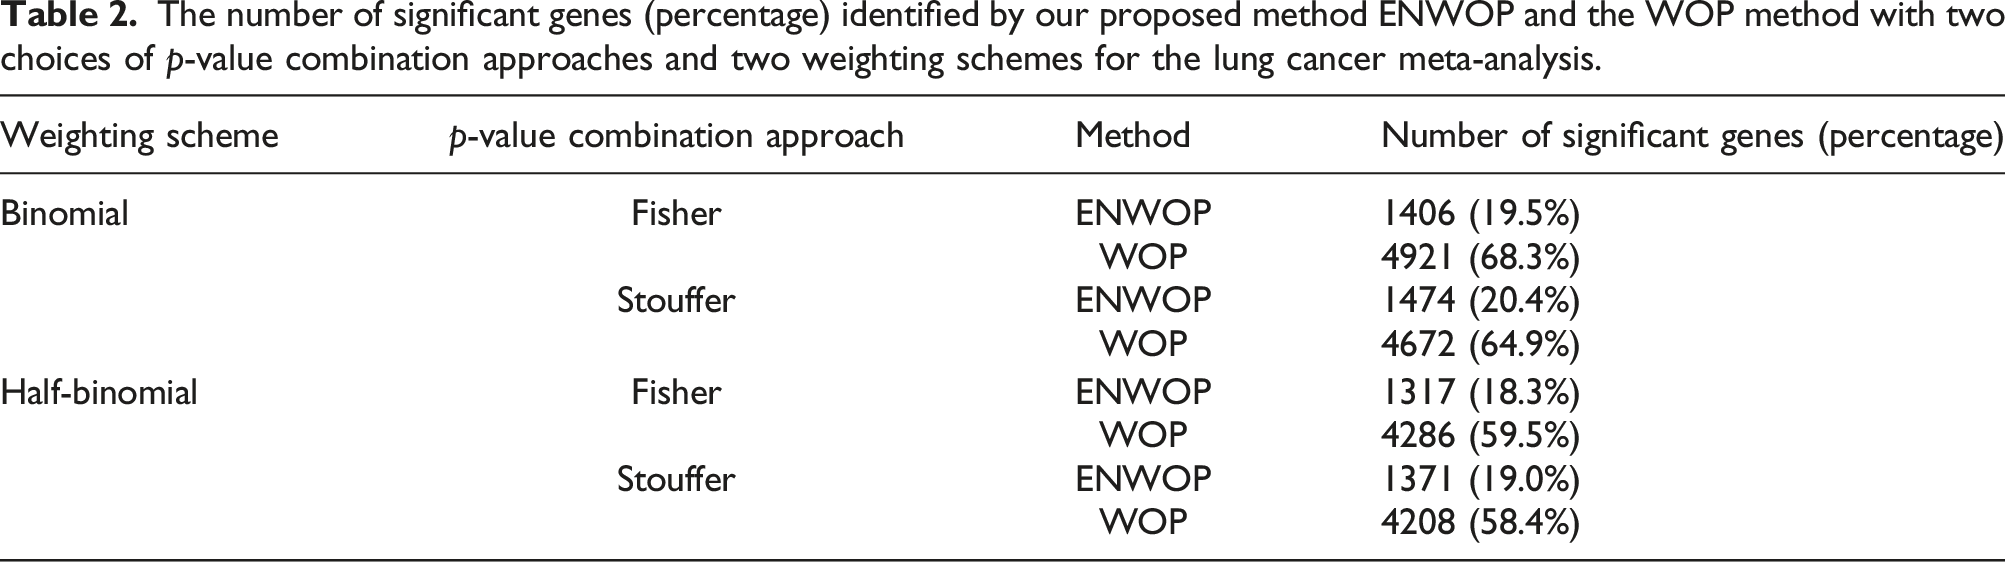
Figure 2 shows the overlap between the number of significant genes identified by the ENWOP method and the WOP method with both weighting schemes using the (a) Fisher’s, and (b) Stouffer’s p-value combination approaches for the lung cancer meta-analysis. For the Fisher’s p-value combination approach, there are 1234 genes which are identified by both methods with both weighting schemes (see Figure 2(a)). Similarly, for the Stouffer’s p-value combination approach, 1312 genes are identified by both methods with both weighting schemes (see Figure 2(b)). Using the same pair of p-value combination approach and weighting scheme, all the genes identified by the ENWOP method are also identified by the WOP method. In order to identify biological pathways associated with the gene lists identified by the ENWOP method with both p-value combination approaches and weighting schemes, we performed functional annotation clustering using Database for Annotation, Visualization and Integrated Discovery (DAVID) software.
25
The ENWOP method identified several biologically relevant pathways including cell cycle, DNA replication, and p53 signaling pathway based on the BH adjusted p-value cutoff of 0.05. We further investigated some genes which are identified as significant by the WOP method but not by our ENWOP method. For example, the gene with entrez ID 11131 was identified by the WOP method with both weighting schemes and p-value combination approaches, but not by the ENWOP method. Supplementary Figure 3 shows the box plots of the expression levels of the gene for the two cancer types (AD and SQ) in each of the five studies. From the boxplots, we observe that there is no significant difference in the expression levels of the gene between the two cancer types. Furthermore, based on the p-values from the differential expression analysis in the individual studies, the gene was not significant at p-value cutoff of 0.05 in any of the studies. This suggests that this gene is unlikely to be an important factor for the difference between AD and SQ patients, and therefore, it is reasonable that the proposed ENWOP method did not identify the gene. Since the genes identified by the WOP method is a superset of those identified by the ENWOP method, these findings are consistent with our simulation results that showed that the sensitivity of the WOP method can be similar or slightly higher than that of the ENWOP method but at the cost of very high false discovery rates and type-1 error rates. Venn diagram showing the overlaps between the number of significant genes identified by the ENWOP method and the WOP method with both weighting schemes using the (a) Fisher’s, and (b) Stouffer’s p-value combination approaches for the lung cancer meta-analysis. WOP-BF: WOP method with binomial weighting scheme and Fisher’s p-value combination approach; WOP-BS: WOP method with binomial weighting scheme and Stouffer’s p-value combination approach; WOP-HBF: WOP method with half-binomial weighting scheme and Fisher’s p-value combination approach; WOP-HBS: WOP method with half-binomial weighting scheme and Stouffer’s p-value combination approach; ENWOP-BF: ENWOP method with binomial weighting scheme and Fisher’s p-value combination approach; ENWOP-BS: ENWOP method with binomial weighting scheme and Stouffer’s p-value combination approach; ENWOP-HBF: ENWOP method with half-binomial weighting scheme and Fisher’s p-value combination approach; ENWOP-HBS: ENWOP method with half-binomial weighting scheme and Stouffer’s p-value combination approach.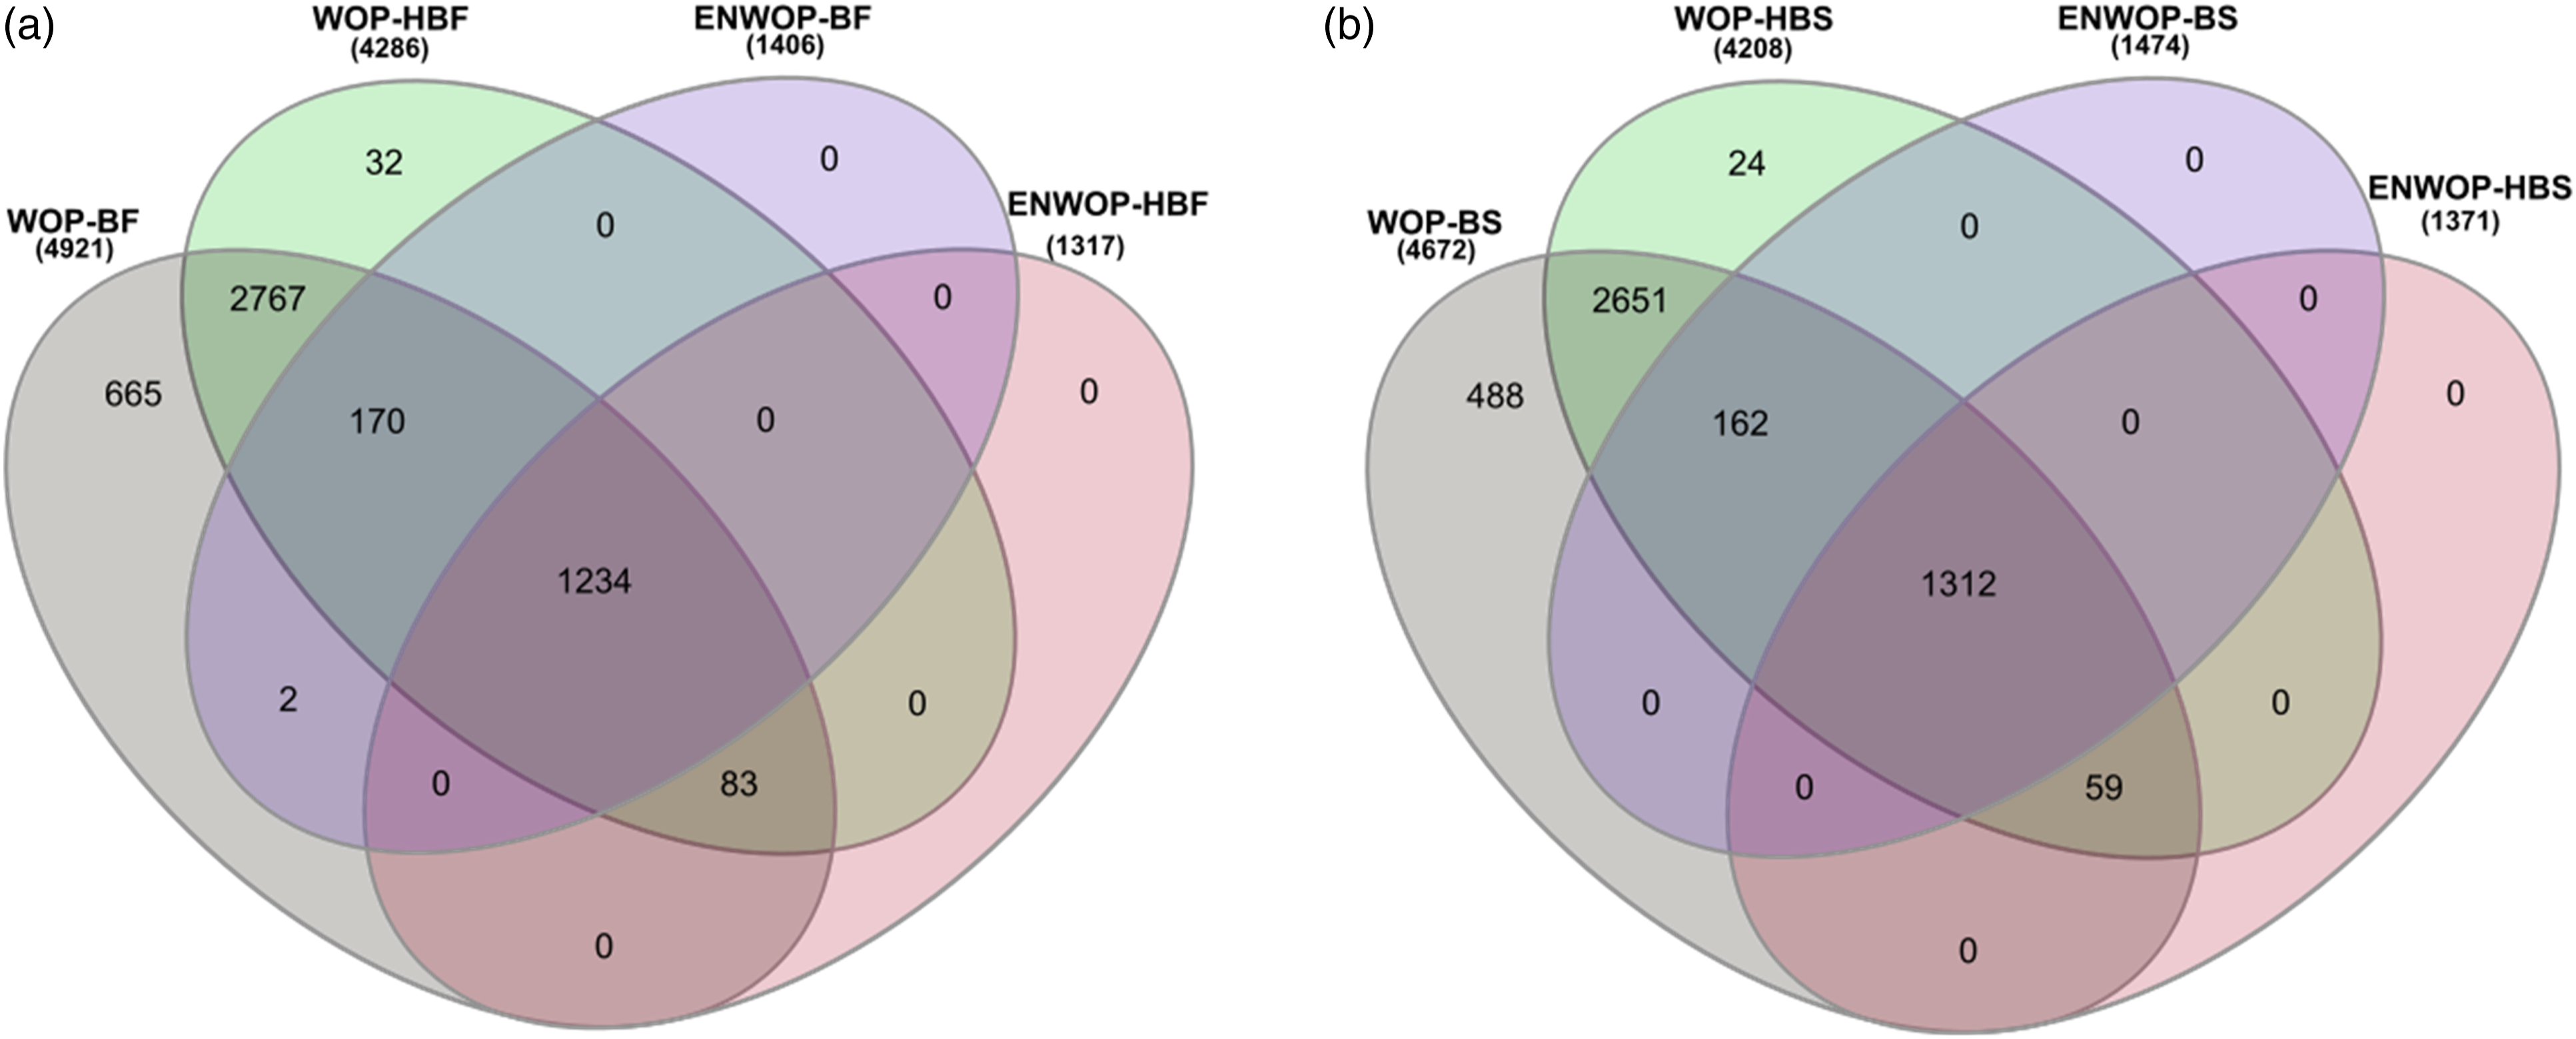
Further applications
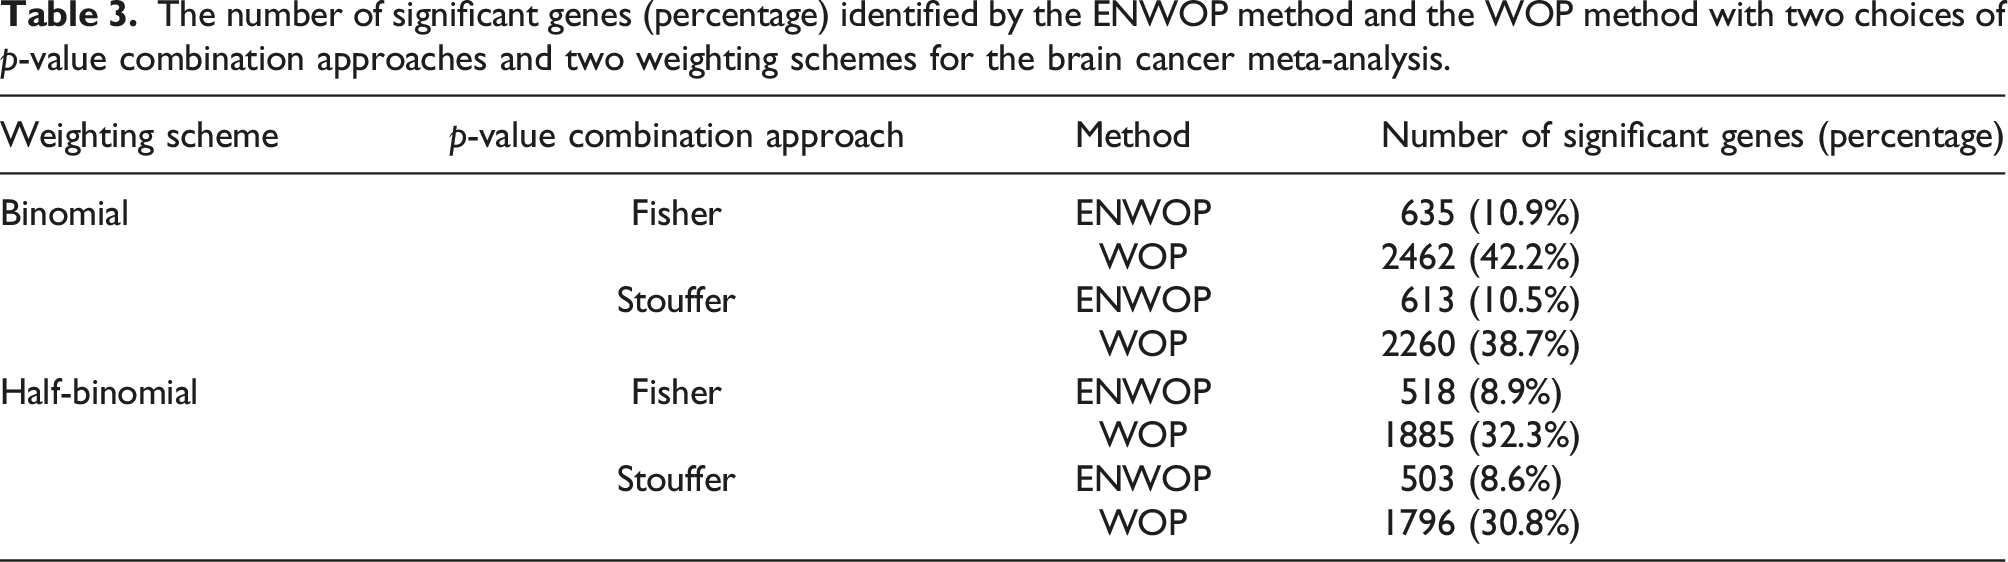
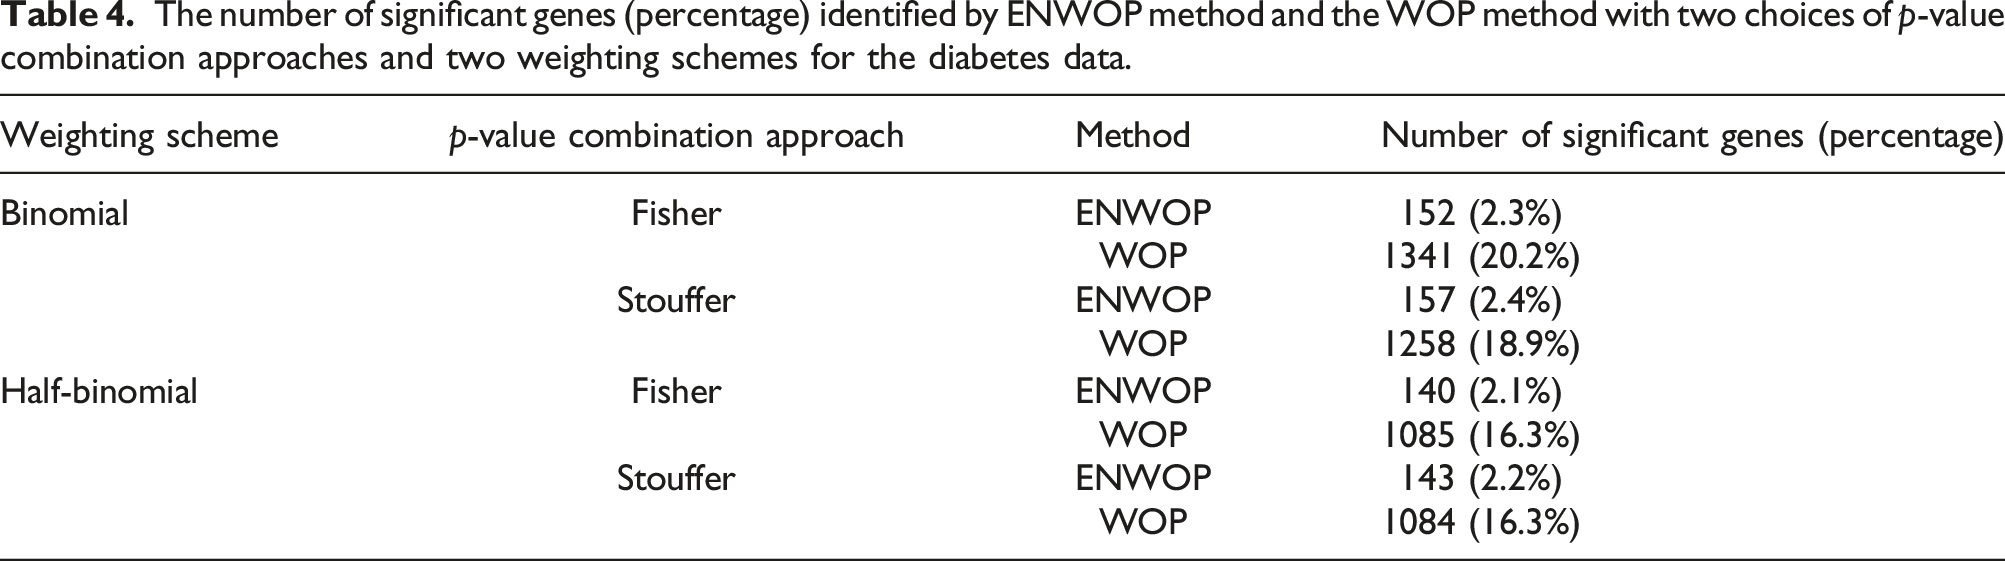
To further compare the performance of the ENWOP method with the WOP method, we considered two other micro-array meta-analyses. The first meta-analysis consists of seven studies on brain cancer and the second consists of 16 studies on diabetes. These datasets were previously analyzed by Li and Ghosh 5 and Song and Tseng 10 and we obtained the p-value for differential expression for each gene in each study from the supplementary material of Song and Tseng. 10 The seven studies in the brain cancer meta-analysis tested for differential expression for 5836 genes between two subtypes of brain tumors – anaplastic astrocytoma (AA) and glioblastoma multiforme (GBM). The studies in the diabetes meta-analysis tested for differential expression for 6645 genes between different tissues in mice and human subjects. We excluded the two studies from our analysis which included human subjects and meta-analyzed the remaining 14 studies on mice for consistency. Details about the sample sizes of the studies can be found in Supplementary Table 3(b)-(c).
The number of significant genes (percentage) identified by the ENWOP method and the WOP method with two choices of p-value combination approaches and two weighting schemes for the brain cancer meta-analysis.
The number of significant genes (percentage) identified by ENWOP method and the WOP method with two choices of p-value combination approaches and two weighting schemes for the diabetes data.
Discussion
Meta-analysis is a popular statistical technique for combining results from multiple studies. Such meta-analyses are frequently performed in various domains of scientific studies including medicine, epidemiology, and psychology among others. In genomic significance testing studies related to a disease, meta-analysis is often considered an important avenue to overcome the aspect of low power of detection from individual studies due to the smaller sample sizes compared to the number of genes or hypotheses to be tested. In these scenarios of large-scale hypotheses testing, combination of p-values obtained from individual studies has been one of the most popular approaches for meta-analysis. The classical p-value combination methods have been developed with the goal of declaring a gene to be overall significant if it is found to be statistically significant in at least one of the combining studies. However, such p-value combination methods have been recently criticized for not being able to capture the consistent pattern of signals from genes across multiple studies5,10 and an alternative form of meta-analysis has been proposed with the aim of finding genes that are consistently identified significant in multiple studies. The weighted ordered p-values (WOP) method is one of the important approaches that serve the latter form of meta-analysis. In this article, we have shown that the existing WOP method of meta-analysis can suffer from inflated type-I error rates and substantial false discoveries, even after multiplicity corrections, in large-scale simultaneous hypotheses testing of thousands of genes especially in the presence of unobserved variables and confounder effects. As a remedy to this problem we have proposed a meta-analysis approach, called ENWOP method, that empirically estimates the null distribution of the test statistic using the large-scale nature of the simultaneous hypotheses testing, as opposed to assuming a theoretical null distribution which can be violated in the presence of hidden confounder effects. The ENWOP method caters to the same meta-analysis aim as the WOP method but has superior performances than the WOP method especially in the presence of potentially hidden variable effects as seen through numerous simulated scenarios. Using a variety of real genomic data meta-analysis, we have demonstrated the usefulness of the proposed ENWOP method in identifying significant and biologically releveant genes for different diseases.
Our proposed ENWOP method is aimed at those situations where p-value is the only source of information that is consistently available for all the genes in all of the studies considered for meta-analysis. There exists another type of meta-analysis where model based approaches are employed for pooling results from multiple studies. 26 Since the latter type of meta-analysis requires substantially more information, e.g. effect sizes, than just the p-values in consistent pattern from all the individual studies, we have not focused on that type of meta-analysis in this article. Note that, in the rare event where the raw expression values are readily available for all the genes from every study, researchers have the option of performing the existing WOP meta-analysis through a permutation based hypotheses testing 5 as an alternative to our proposed ENWOP method. However, such situations of availability of complete expression levels from all the studies are not commonly encountered in a genomic meta-analysis which makes the permutation based WOP approach infeasible in most cases. This, again, highlights the importance of our proposed method in producing an accurate meta-analysis in the absence of abundant information from the component studies.
Supplemental Material
Supplemental Material - An empirically adjusted weighted ordered p-values meta-analysis method for large-scale simultaneous significance testing in genomic experiments
Supplemental Material for An empirically adjusted weighted ordered p-values meta-analysis method for large-scale simultaneous significance testing in genomic experiments by Wimarsha T Jayanetti, N Rao Chaganty, and Sinjini Sikdar in Research Methods in Medicine & Health Sciences.
Footnotes
Declaration of conflicting interests
The author(s) declared no potential conflicts of interest with respect to the research, authorship, and/or publication of this article.
Funding
The author(s) received no financial support for the research, authorship, and/or publication of this article.
Data availability statement
Supplemental Material
Supplemental material for this article is available online.
References
Supplementary Material
Please find the following supplemental material available below.
For Open Access articles published under a Creative Commons License, all supplemental material carries the same license as the article it is associated with.
For non-Open Access articles published, all supplemental material carries a non-exclusive license, and permission requests for re-use of supplemental material or any part of supplemental material shall be sent directly to the copyright owner as specified in the copyright notice associated with the article.