
Abstract
Linear regression is a simple yet powerful tool that has been extensively used in all fields where the relationships among variables are of interest. When linear regression is applied, the coefficient of determination or R-squared (R2) is commonly reported as a metric gauging the model’s goodness of fit. Despite its wide usage, however, R2 has been commonly misinterpreted as the proportion or percent of variation in the dependent variable that is explained by the independent variables (PVE -- percent of variation explained). This study demonstrated R2 substantially overstates the true PVE. When the assumptions of linear regression are met, R2 overstates PVE by up to 100%. For instance, when R2 is 0.99, 0.80, 0.50, or 0.10, the true PVE is 0.9, 0.55, 0.29, or 0.05, respectively. The misinterpretation of R2, which greatly exaggerates the effect of the interventions or causes on the outcomes, could exert undue influence on clinical decisions in medicine and policy decisions in other fields such as environmental protection and climate change research. Therefore, when linear regression is applied, reporting the true PVE is warranted.
Background
Since its initial conceptualization by Sir Francis Galtonand and a mathematical enhancement by Karl Pearson in the late 19th century,1,2 linear regression has been extensively used in all fields where the relationships among variables are of interest. For instance, in medical research, linear regression is commonly used to quantify the linear relationship between a continuous outcome (e.g., blood pressure) and one or more independent variables such as treatments and confounders.3–7
When linear regression is used, R2, also called the coefficient of determination, is a preferred and arguably the most often reported metric gauging the model’s goodness of fit.8,9 R2 is universally interpreted as the proportion or percent of the variation in the dependent variable that is explained or predicted by the independent variables (hereafter abbreviated to PVE -- percent of variation explained).4,10–15 Although R2 may not be the most important statistic for initial model selection or specification, thanks to its intuitive interpretation, R2 has become one of the most important metrics rendering real-life implications. When linear models are applied, R2 is often used to determine whether a disease is preventable, a treatment is effective, how much genetic factors and environmental toxins (e.g., tobacco smoking, pesticide exposures) contribute to diseases, and how much human activities are contributing to climate change.
However, R2 has been widely misconceived and misinterpreted, which significantly exaggerates the model’s predictive power and leads to overestimation of the strength of evidence or interventions. This study aimed to elucidate the misinterpretation of R2 and assess its relationship with the true PVE.
Methods and results
In this section, a heuristic example was first given to illustrate the fallacy of interpreting R2 as PVE, and then simulations were carried out to assess the relationship between R2 and PVE.
A heuristic example
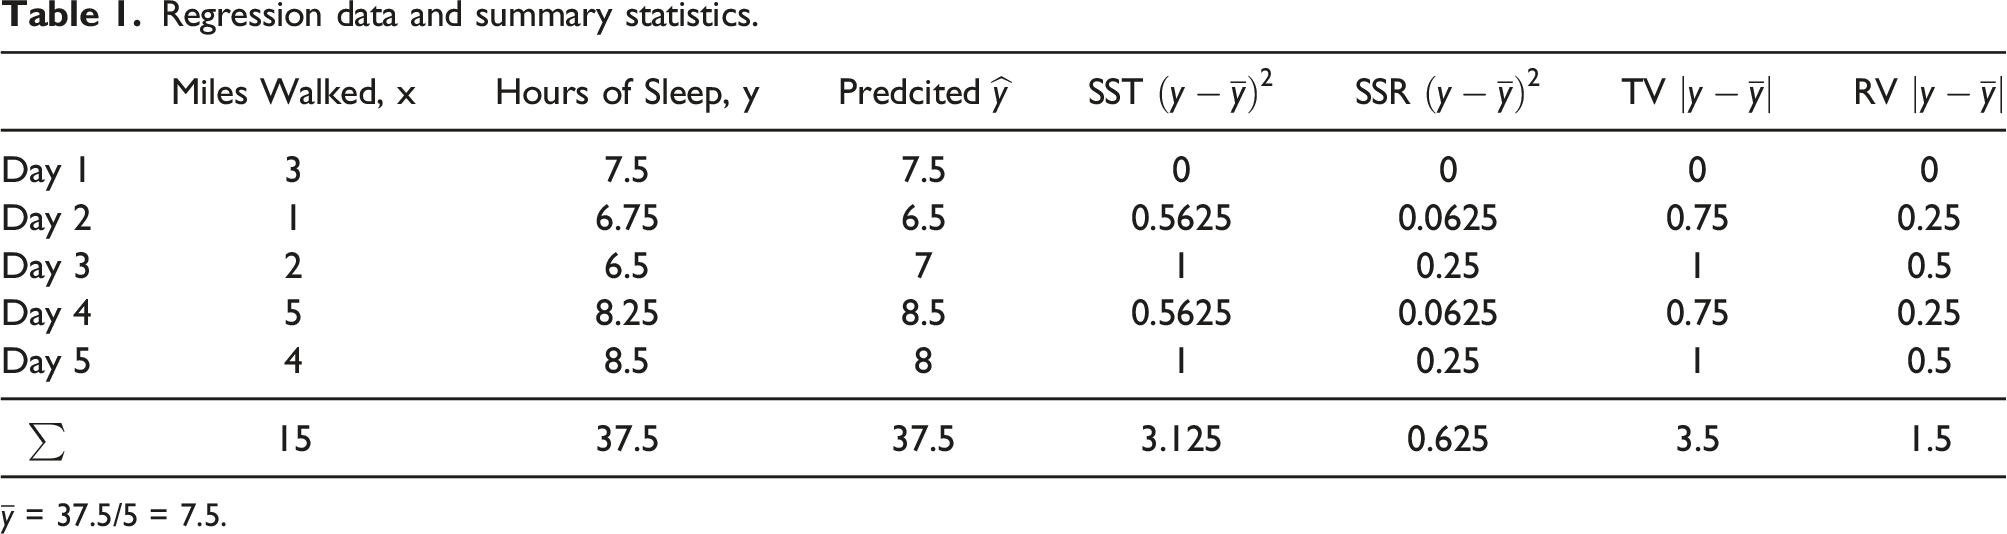
Regression data and summary statistics.
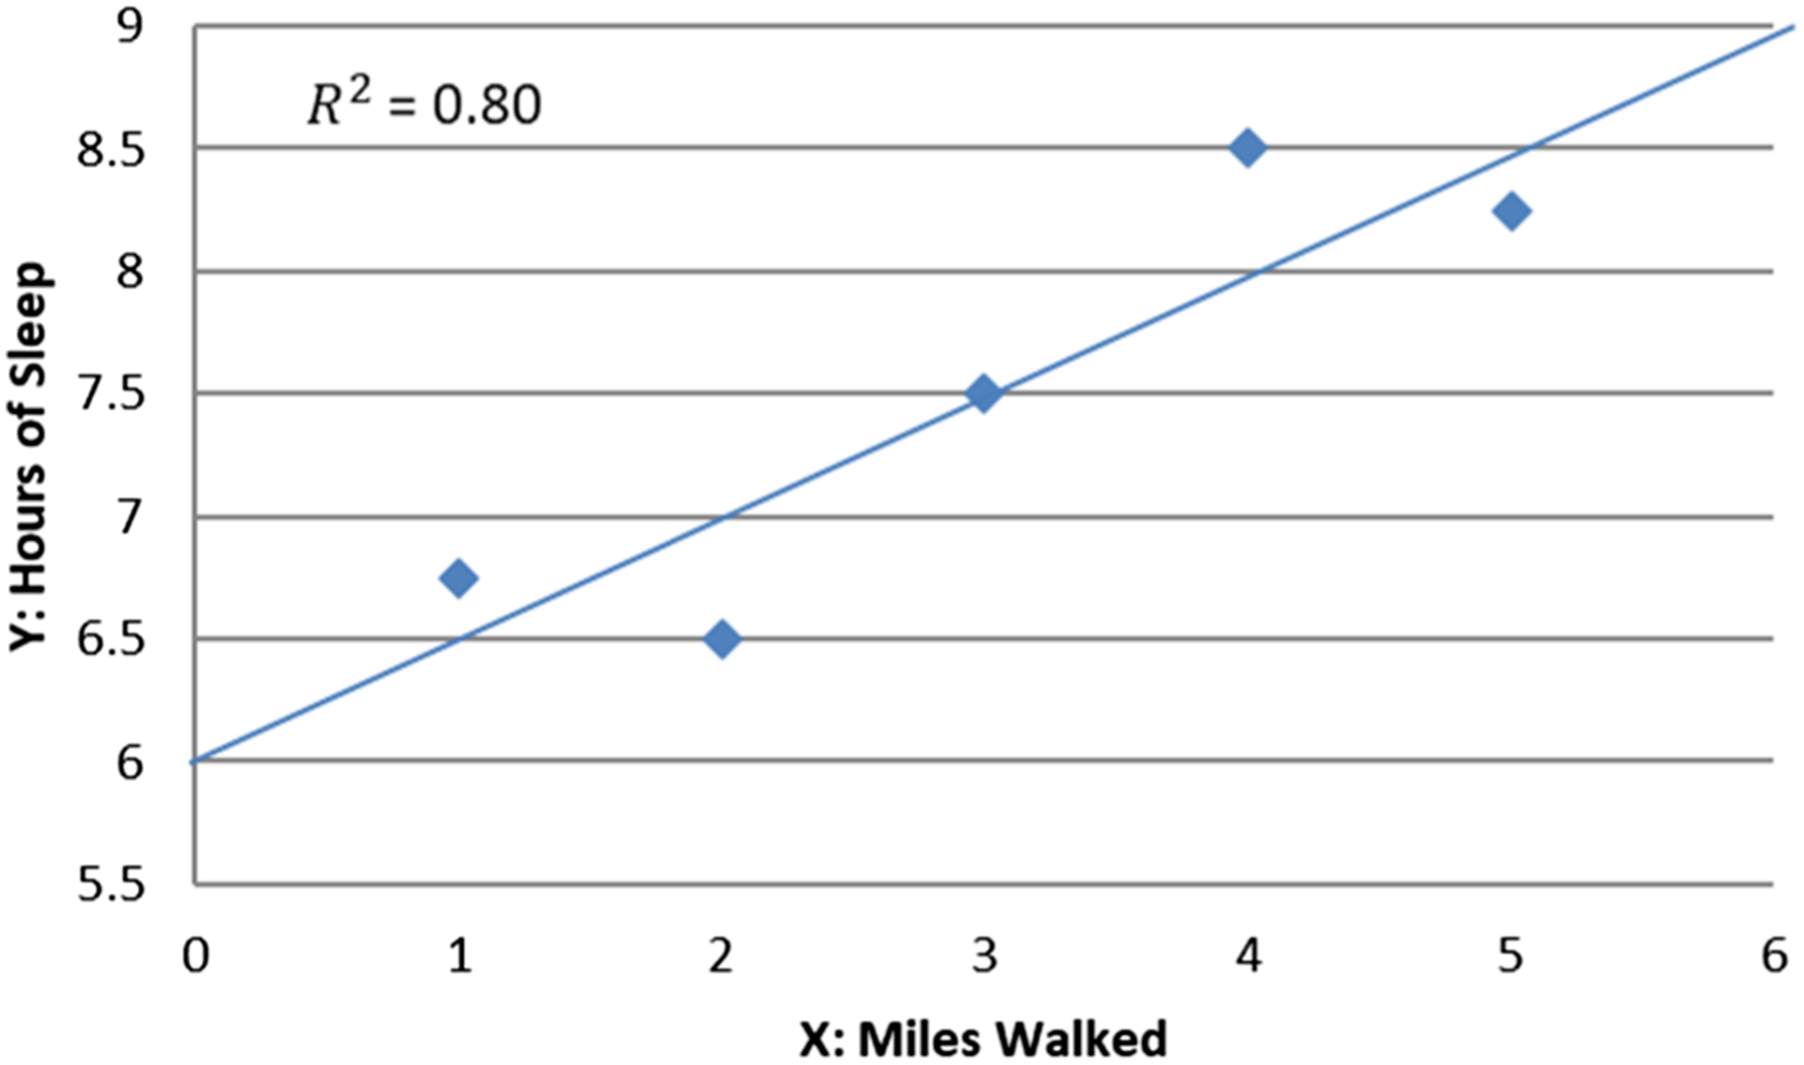
Correlation between walking distance and sleep duration.
The investigator was also interested in how much variation in the sleep hours can be explained by the walking distance and thus calculated
Now, does the walking distance explain 80% variation of the sleep hours? The answer is no. R2 overstates the model’s predictive power. The problem stems from the fact that SST is not the total variation of the dependent variable, and SSR is not the total variation of what is not explained by the regression. Rather, they are the sums of the squared variations. Therefore, R2 is not the proportion of variation in the dependent variable explained by the independent variables. As shown in Table 1, the true total variation (TV) is
What causes the discrepancy between R2 and PVE? It is the squaring. In calculating R2, |
It is worth to note that “variation” and “variance” are synonyms in everyday language and often used exchangeably in describing R2 in clinical literature. In fact, Sewall Wright,
16
who is credited for the creation of R2, used “variation” rather than “variance” in his 1921 seminal paper. However, in statistics, “variance” has a specific definition, i.e.,
Nevertheless, in statistics, variance is not equivalent to variation, and thus R2 is different from PVE. As shown in the illustrative example above, when R2 = 0.80, PVE = 0.57. Given the large difference between R2 and PVE, and the latter is more informative in practice, therefore, examining the relationship between them should be instructive.
Simulations
Since there is no closed form expression linking R2 and PVE, this study uses simulations to demonstrate their relationship. Without loss of generality, let’s assume the dependent variable Y is generated by the following process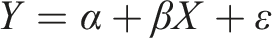
Simulation results: Relationship between R2 and PVE.
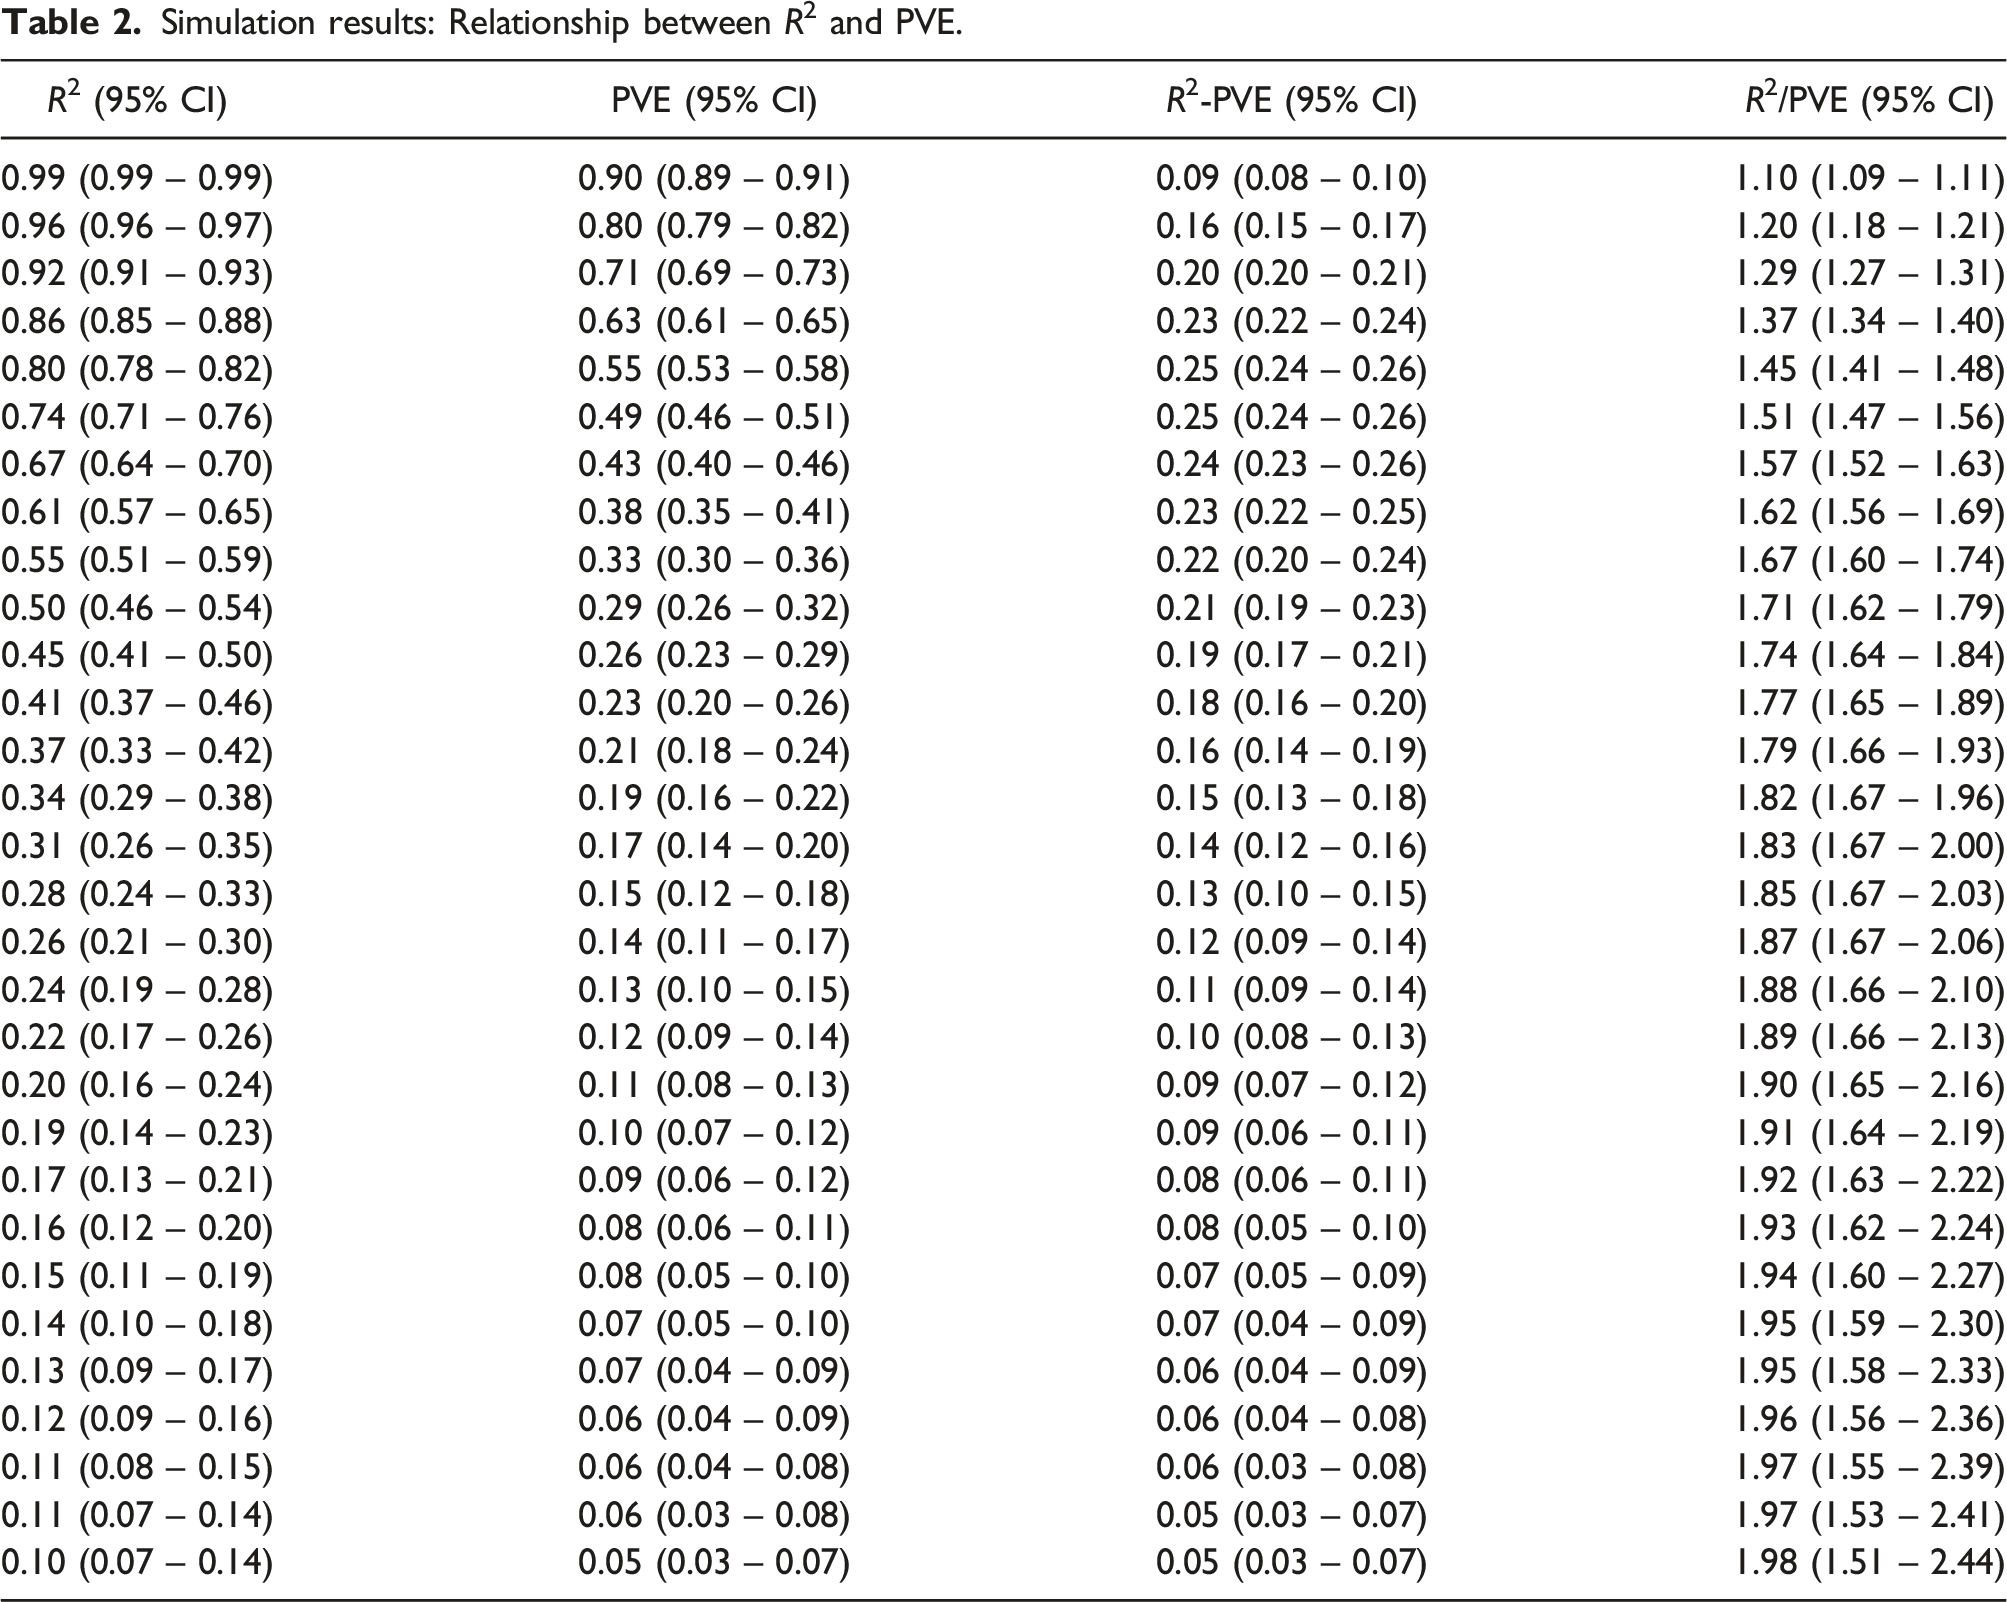
As shown in Table 2 and Figure 2, when R2 is high, the difference between R2 and PVE is small. In fact, when the regression has a perfect fit, both R2 and PVE equal 1. However, as R2 decreases, the difference between R2 and PVR accelerates: when R2 = 0.99, then PVE = 0.9, where R2 overstates PVE by about 10%. When R2 equals 0.8, PVE drops to 0.55, and thus PVE is overstated by 45%. When R2 drops to 0.5, PVE decreases to 0.29, where R2 overstates PVE by 71%. The trend continues: when R2 = 0.1, then PVE = 0.05, where PVE is overstated by 98%. Even though R2 = PVE = 0 when the model has zero predictive power ( Relationship between R2 and PVE.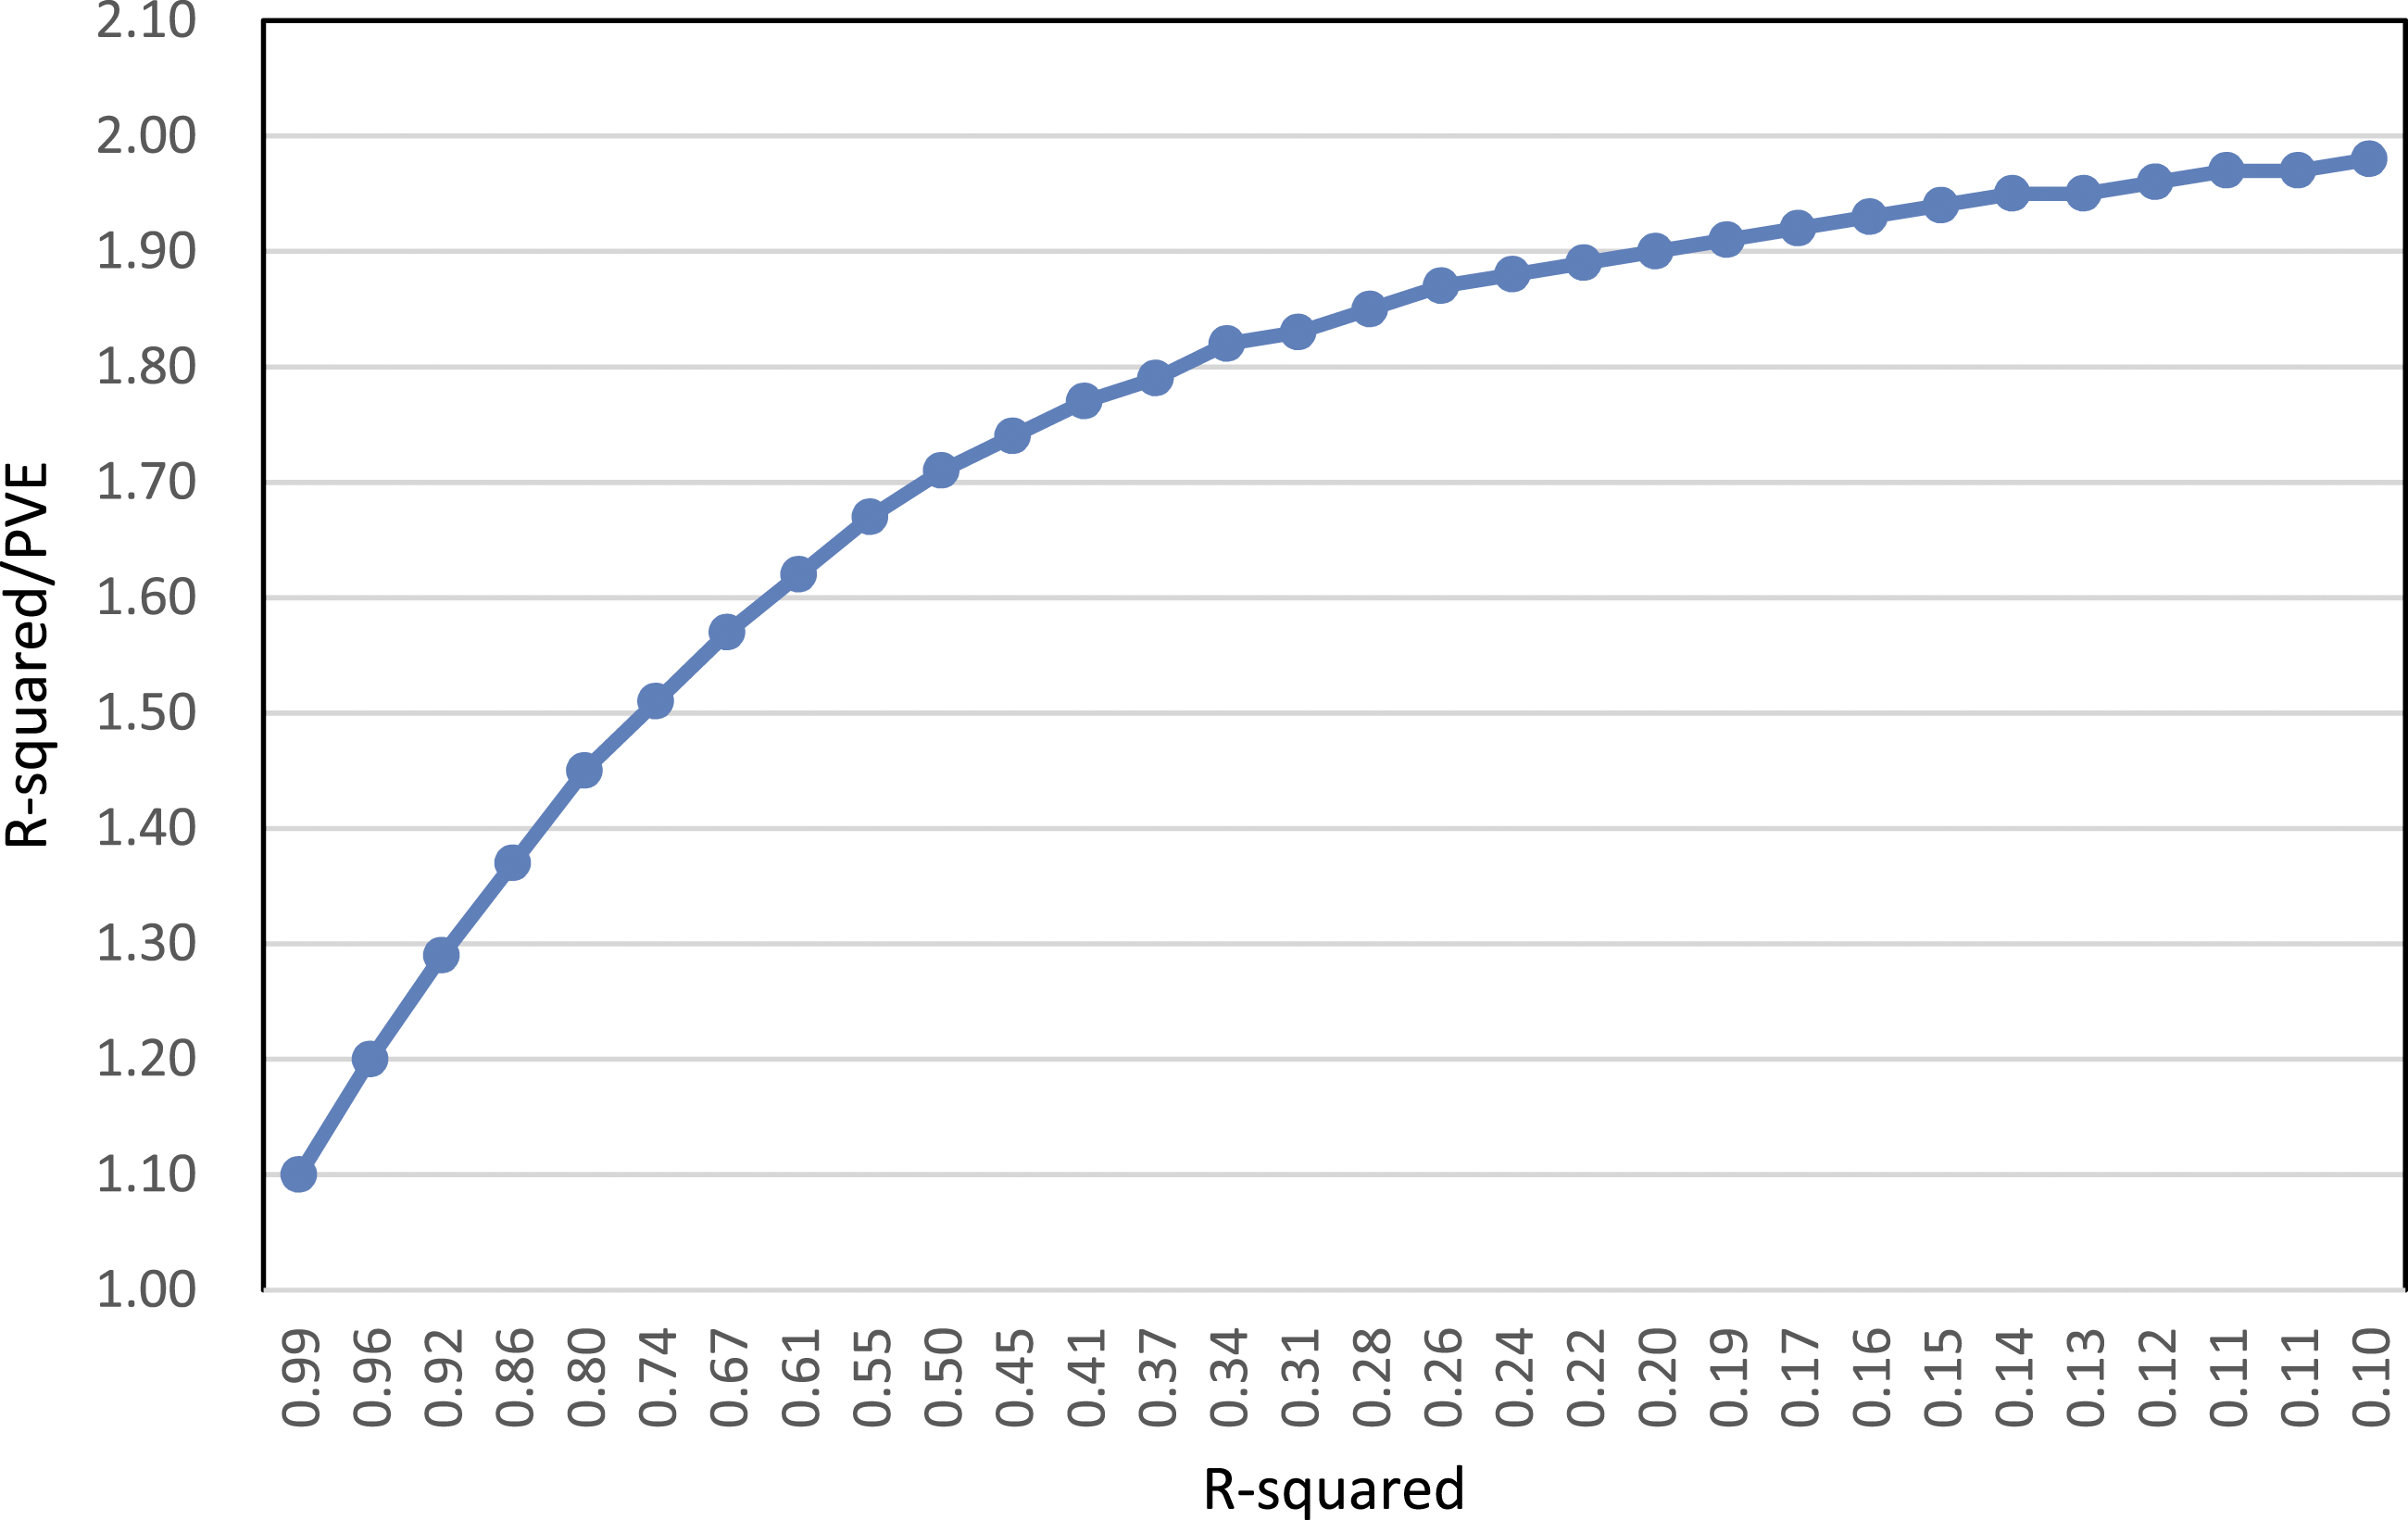
Further, although the distribution of X does not practically affect the relationship between R2 and PVE, the distribution of the error term
Discussion
The misconception of R2 is pervasive and can have significant ramifications in the real world. For instance, based on R2 = 0.65 (r = 0.804 between cancer incidence and normal stem cell divisions), two widely cited studies published in Science concluded that two thirds of cancer cases are due to intrinsic random genetic mutations and thus are unpreventable.18,19 This misconceived finding gave rise to the “bad luck” theory, which has been widely covered by mainstream media, academic journals, and anything between.20-24 In fact, R2 = 0.65 indicates about 40% rather than two-thirds of cancer is due to random mutations and thus unpreventable (given the premise that random genetic mutations cause cancer is valid). Obviously, misinterpretations like this can profoundly influence public health policies associated with disease prevention and thus people’s health.
Given the practical significance, medical researchers, clinicians, and policymakers alike need to understand the difference between R2 and PVE. Beneath the large discrepancy between R2 and PVE, the misunderstanding or misinterpretation of R2 stems from the fact that the true total variation of Y is
In fact, there are algorithms (e.g., linear programming) that minimize
Obviously, when the objective is to forecast, LAD is superior, especially given today’s computing power -- fitting LAD can be readily carried out, and its predictive power can be easily gauged. 29 On the other hand, if hypothesis testing is also involved (e.g., assessing whether an intervention is effective or not), linear models are more convenient because none of the commonly used tests are valid under LAD. Nonetheless, LAD has been rarely used in medical research and yet the misconception of R2 in linear regression has been overlooked.
Conclusion
Given the consequences of misinterpreting R2 in practice and PVE can be readily calculated, when linear models are applied, PVE, a measure of the true variation in the dependent variable explained by the model, should be reported.
Footnotes
Acknowledgements
This material is based upon work supported (or supported in part) by the Department of Veterans Affairs, Veterans Health Administration, Office of Research and Development. The author is indebted to Mr Frederick Malphurs, a retired senior healthcare executive, a visionary leader who dedicated his entire 37 years’ career to patient care, for his continued support of research to improve public health.
Declaration of conflicting interests
The author(s) declared no potential conflicts of interest with respect to the research, authorship, and/or publication of this article.
Funding
The author(s) received no financial support for the research, authorship, and/or publication of this article.