
Abstract
Background
Accurately measuring BMI in large epidemiological studies is problematic as objective measurements are expensive, so subjective methodologies must usually suffice. The purpose of this study is to explore a new subjective method of BMI measurement: BMI self-selection.
Methods
A cross-sectional analysis of the Mitchelstown Cohort Rescreen study, a random sample of 1,354 men and women aged 51–77 years recruited from a single primary care centre. BMI self-selection was measured by asking patients to select their BMI category: underweight, normal weight, overweight, obese. Weight and height were also objectively measured.
Results
79% were overweight or obese: 86% of males, 69% of females (P < 0.001) and 59% of these underestimated their BMI. The sensitivity for correct BMI self-selection for normal weight, overweight and obese was 77%, 61% and 11% respectively. In multivariable analysis, gender, higher education levels, being told by a health professional to lose weight, and being on a diet were significantly associated with correct BMI self-selection. There was a linear trend relationship between increasing BMI levels and correct selection of BMI; participants in the highest BMI quartile had an approximate eight-fold increased odds of correctly selecting their BMI when compared to participants within the lower overweight/obese quartiles (OR = 7.72, 95%CI:4.59, 12.98).
Conclusions
BMI self-selection may be useful for self-reporting BMI. Clinicians need to be aware of disparities between BMI self-selection at higher and lower BMI levels among overweight/obese patients and encourage preventative action for those at the lower levels to avoid weight gain and thus reduce their all-cause mortality risk.
Background
The conundrum of how to accurately measure body mass index (BMI) in large epidemiological samples has prompted much investigation, in many populations, over many years.1–9 Despite this research, to date, the gold standard for accurate BMI classification is objectively measured weight and height. This is prohibitively expensive and not practical in large studies, due to the high costs involved. Usually self-reported values of weight and height must suffice and although time and cost-efficient, have no guarantee of accuracy. 7 Both misclassification and misperception of weight status arising from BMI calculated from self-reported weight and height is common.8–13 We know that self-reported weight is significantly lower than measured weight for both men and women2,5,8,12 and that self-reported height is significantly higher than measured height in adults.2,5,8,9 This is problematic because it is an inaccurate measurement of BMI and leads to an overestimation between obesity and various health conditions.12,14 It is also challenging because researchers postulate that correctly identifying oneself as being overweight is a prerequisite to successful weight management. 15 We know this is at least true in some situations because in our recent study of children, referred to a community weight management programme, we found that parental failure to recognise their child’s overweight or obesity and denial of their child’s weight status was a key factor underlying their lack of engagement in the programme. 16
Exploring new methods to obtain accurate BMI measurement is necessary. In recent years, the notion of self-perception of weight status has gained particular traction with much research focused on children and adolescents.17–20 There are fewer studies of weight perception conducted on adults.15,21–27 There are no studies extant on BMI self-selection. In this study, we hypothesised that given the increased awareness of overweight and obesity, asking adults to identify their own BMI category (termed BMI self-selection), by simply asking them “Do you think you are underweight, normal weight, overweight or obese?” would provide an accurate estimate of their BMI. This is the first study to test this hypothesis. A secondary outcome was to establish the factors influencing correct BMI self-selection. Finally, we investigated the impact different levels of overweight and obesity had on BMI self-selection.
Methods
Study population and setting
The Cork and Kerry Diabetes and Heart Disease Study (Phase II – Mitchelstown Cohort) was a single centre study (random sample) conducted between 2010 and 2011 in the Living Health Clinic, Mitchelstown, County Cork, Ireland. The Living Health Clinic serves a population of approximately 20,000 Caucasian-Europeans, with an urban/rural mix. Stratified sampling was employed to recruit equal numbers of men and women from all registered attending patients in the 46–73-year age group. In total, 3,807 potential participants were selected from the practice list. Following the exclusion of duplicates, deaths and participants incapable of consenting or attending appointment, 3,051 were invited to participate in the study and of these, 2,047 (49% male) completed the self-administered questionnaire and physical examination components of the baseline assessment (response rate: 67%). The doctor recorded gender during patient consultations. Details regarding the study design, sampling procedures and methods of data collection have been reported previously. 28
A rescreen of the Mitchelstown Cohort patients was conducted between 2016 and 2017 and this study is a secondary analysis of the Mitchelstown Cohort Rescreen dataset. Surviving baseline participants (n = 1,881) were invited to attend the re-screen. 166 were deemed unfit or too ill to take part by their doctor. 1,378 patients participated. Data on BMI self-selection and objectively measured BMI were available for 1,364 participants. Due to low numbers of underweight participants, BMI <18.5 kg/m2, these participants were excluded. The final analysis consisted of 1,354 participants.
Clinical procedures
Data were collected by trained researchers with reference to a standard operating procedures manual. Height was measured with a portable Seca Leicester height/length stadiometer (Seca, Birmingham, UK) and weight was measured using a portable electronic Tanita WB-100MA weighing scale (Tanita Corp, IL, USA). The weighing scale was placed on a firm flat surface and was calibrated weekly. Body mass index (BMI) was calculated as weight in kilograms divided by height in meters squared (kg/m2).
Study participants attended the clinic in the morning after an overnight fast and blood samples were taken on arrival. Fasting glucose and glycated haemoglobin A1c (HbA1c) levels were measured by Cork University Hospital Biochemistry Laboratory using standardised procedures and fresh samples. Glucose concentrations were determined using a glucose hexokinase assay (Olympus Life and Material Science Europa Ltd., Lismeehan, Co. Clare, Ireland) and HbA1c levels were measured in the haematology laboratory on an automated high-pressure liquid chromatography instrument Tosoh G7 [Tosoh HLC-723 (G7), Tosoh Europe N.V, Tessenderlo, Belgium].
Data collection
A general health and lifestyle questionnaire was used to assess demographic variables, lifestyle behaviours and morbidity which included age, gender, education, living arrangement, self-rated health, smoking status, alcohol drinking habits, perceived diet quality, number of meals consumed in an average day, whether the participant had been told by a health professional to lose weight, whether they were on a diet to lose weight and the probability of a major depressive disorder and presence of type 2 diabetes. Physical activity levels were measured using the validated International Physical Activity Questionnaire (IPAQ). 29
A validated Food Frequency Questionnaire (FFQ) consisting of 150 different food items was used for dietary assessment. The average medium serving of each food item consumed by participants over the last twelve months was converted into quantities using standard portion sizes. Food item quantity was expressed as (gm/d) and beverages as (ml/d). Based on the FFQ, the Dietary Approaches to Stop Hypertension (DASH) diet score was constructed. DASH is a dietary pattern rich in fruits, vegetables, whole grains and low-fat dairy foods and is limited in sugar-sweetened foods and beverages, red meat and added fats. This diet has been promoted by the National Heart, Lung and Blood Institute (part of the National Institutes of Health, a United States government organisation) to prevent and control hypertension. DASH diet scores ranged from 5–38. Lower scores represent poorer and higher scores represent better quality diet. 30
Classification and scoring of variables
We classified lifestyle behaviours using the same methodology as used previously in the SLÁN National Health and Lifestyle Survey. 31 Smoking status was defined as follows: (i) never smoked, i.e. having never smoked at least 100 cigarettes (5 packs) in their entire life; (ii) former smoker, i.e. having smoked 100 cigarettes in their entire life and do not smoke at present; and (iii) current smoker, i.e. smoking at present. A categorical variable was then created: ‘Current’ smoker, ‘Former’ smoker and ‘Never’ smoked.
Alcohol consumption was measured in units of alcohol consumed on a weekly basis and was categorised into the following levels: (i) non-drinker, i.e. <1 drink per week; (ii) moderate drinker, i.e. between 1 and 14 drinks per week; and (iii) heavy drinker, i.e. >14 drinks per week. Moderate drinker was defined on the basis of previous work from the European Prospective Investigation into Cancer and Nutrition (EPIC) in the United Kingdom (UK) by Khaw et al. 32 For the current analysis, these were categorised as ‘Heavy’ drinker ‘Moderate’ drinker or ‘Light’ drinker.
Physical activity was categorised as low, moderate and high levels of activity using the IPAQ. We classified measured diet quality by dividing the DASH score into equal tertiles, with poorer diet quality defined as tertile 1 and higher diet quality defined as tertile 3. Objectively measured weight status was categorised as BMI levels 18.5 – 24.9 kg/m2 = ‘Normal-weight’, 25–29.9 kg/m2 = ‘Overweight’ and ≥30 kg/m2 = ‘Obese’ .
Categories of education included ‘some primary (not complete)’, ‘primary or equivalent’, ‘intermediate/group certificate or equivalent’, ‘leaving certificate or equivalent’, ‘diploma/certificate’, ‘primary university degree’ and ‘postgraduate/higher degree’. These were collapsed and recoded into a categorical variable: ‘Primary only’ and ‘Secondary or diploma’ and ‘Bachelor or higher’. The validated Center for Epidemiologic Studies Depression Scale (CESD) was used to assess the probability of a participant having a major depressive disorder. 33 Type 2 diabetes was determined as a fasting glucose level ≥7.0 mmol/l or a HbA1c level ≥6.5% (≥48 mmol/mol) 34 or by self-reported diagnosis.
Outcome variable: BMI self-selection
Study participants were asked the question “Do you think you are underweight, normal weight, overweight or obese?” Patterns of reporting bias were determined by cross-classifying the objectively measured BMI categories with the self-selection BMI categories. Participants who correctly classified their BMI were categorised as having a correct self-selected BMI.
Statistical analysis
Descriptive characteristics were examined according to objectively measured BMI. Categorical features are presented as percentages and age is shown as a median and interquartile range. Logistic regression was used to determine associations between examined variables and BMI self-selection. Independent univariate logistic regression models were fitted for each predictor and variables with a P value <0.1 were used to obtain a multivariable logistic regression model fit. Participants who were normal weight according to objectively measured BMI and those who overestimated their BMI selection were excluded (n = 295).
To observe whether objectively measured BMI levels influence BMI self-selection, participant true BMI values were divided into equal quartiles within the combined overweight and obese category and a variable was created with quartile 1 indicating lower overweight/obese levels and quartile 4 indicating higher values. A final logistic regression model was run to examine associations between higher BMI quartiles, i.e. the overweight/obese quartiles, and correct selection of BMI adjusting for significant variables determined in multivariable analysis.
Data analysis was conducted using Stata SE Version 13 (Stata Corporation, College Station, TX, USA) for Windows. For all analyses, a P value (two-tailed) of less than .05 was considered to indicate statistical significance.
Results
Descriptive characteristics
Characteristics of the study population according to objectively measured BMI are presented in Table 1.
Characteristics of the study population – all subjects and stratified by objectively measured BMI.a
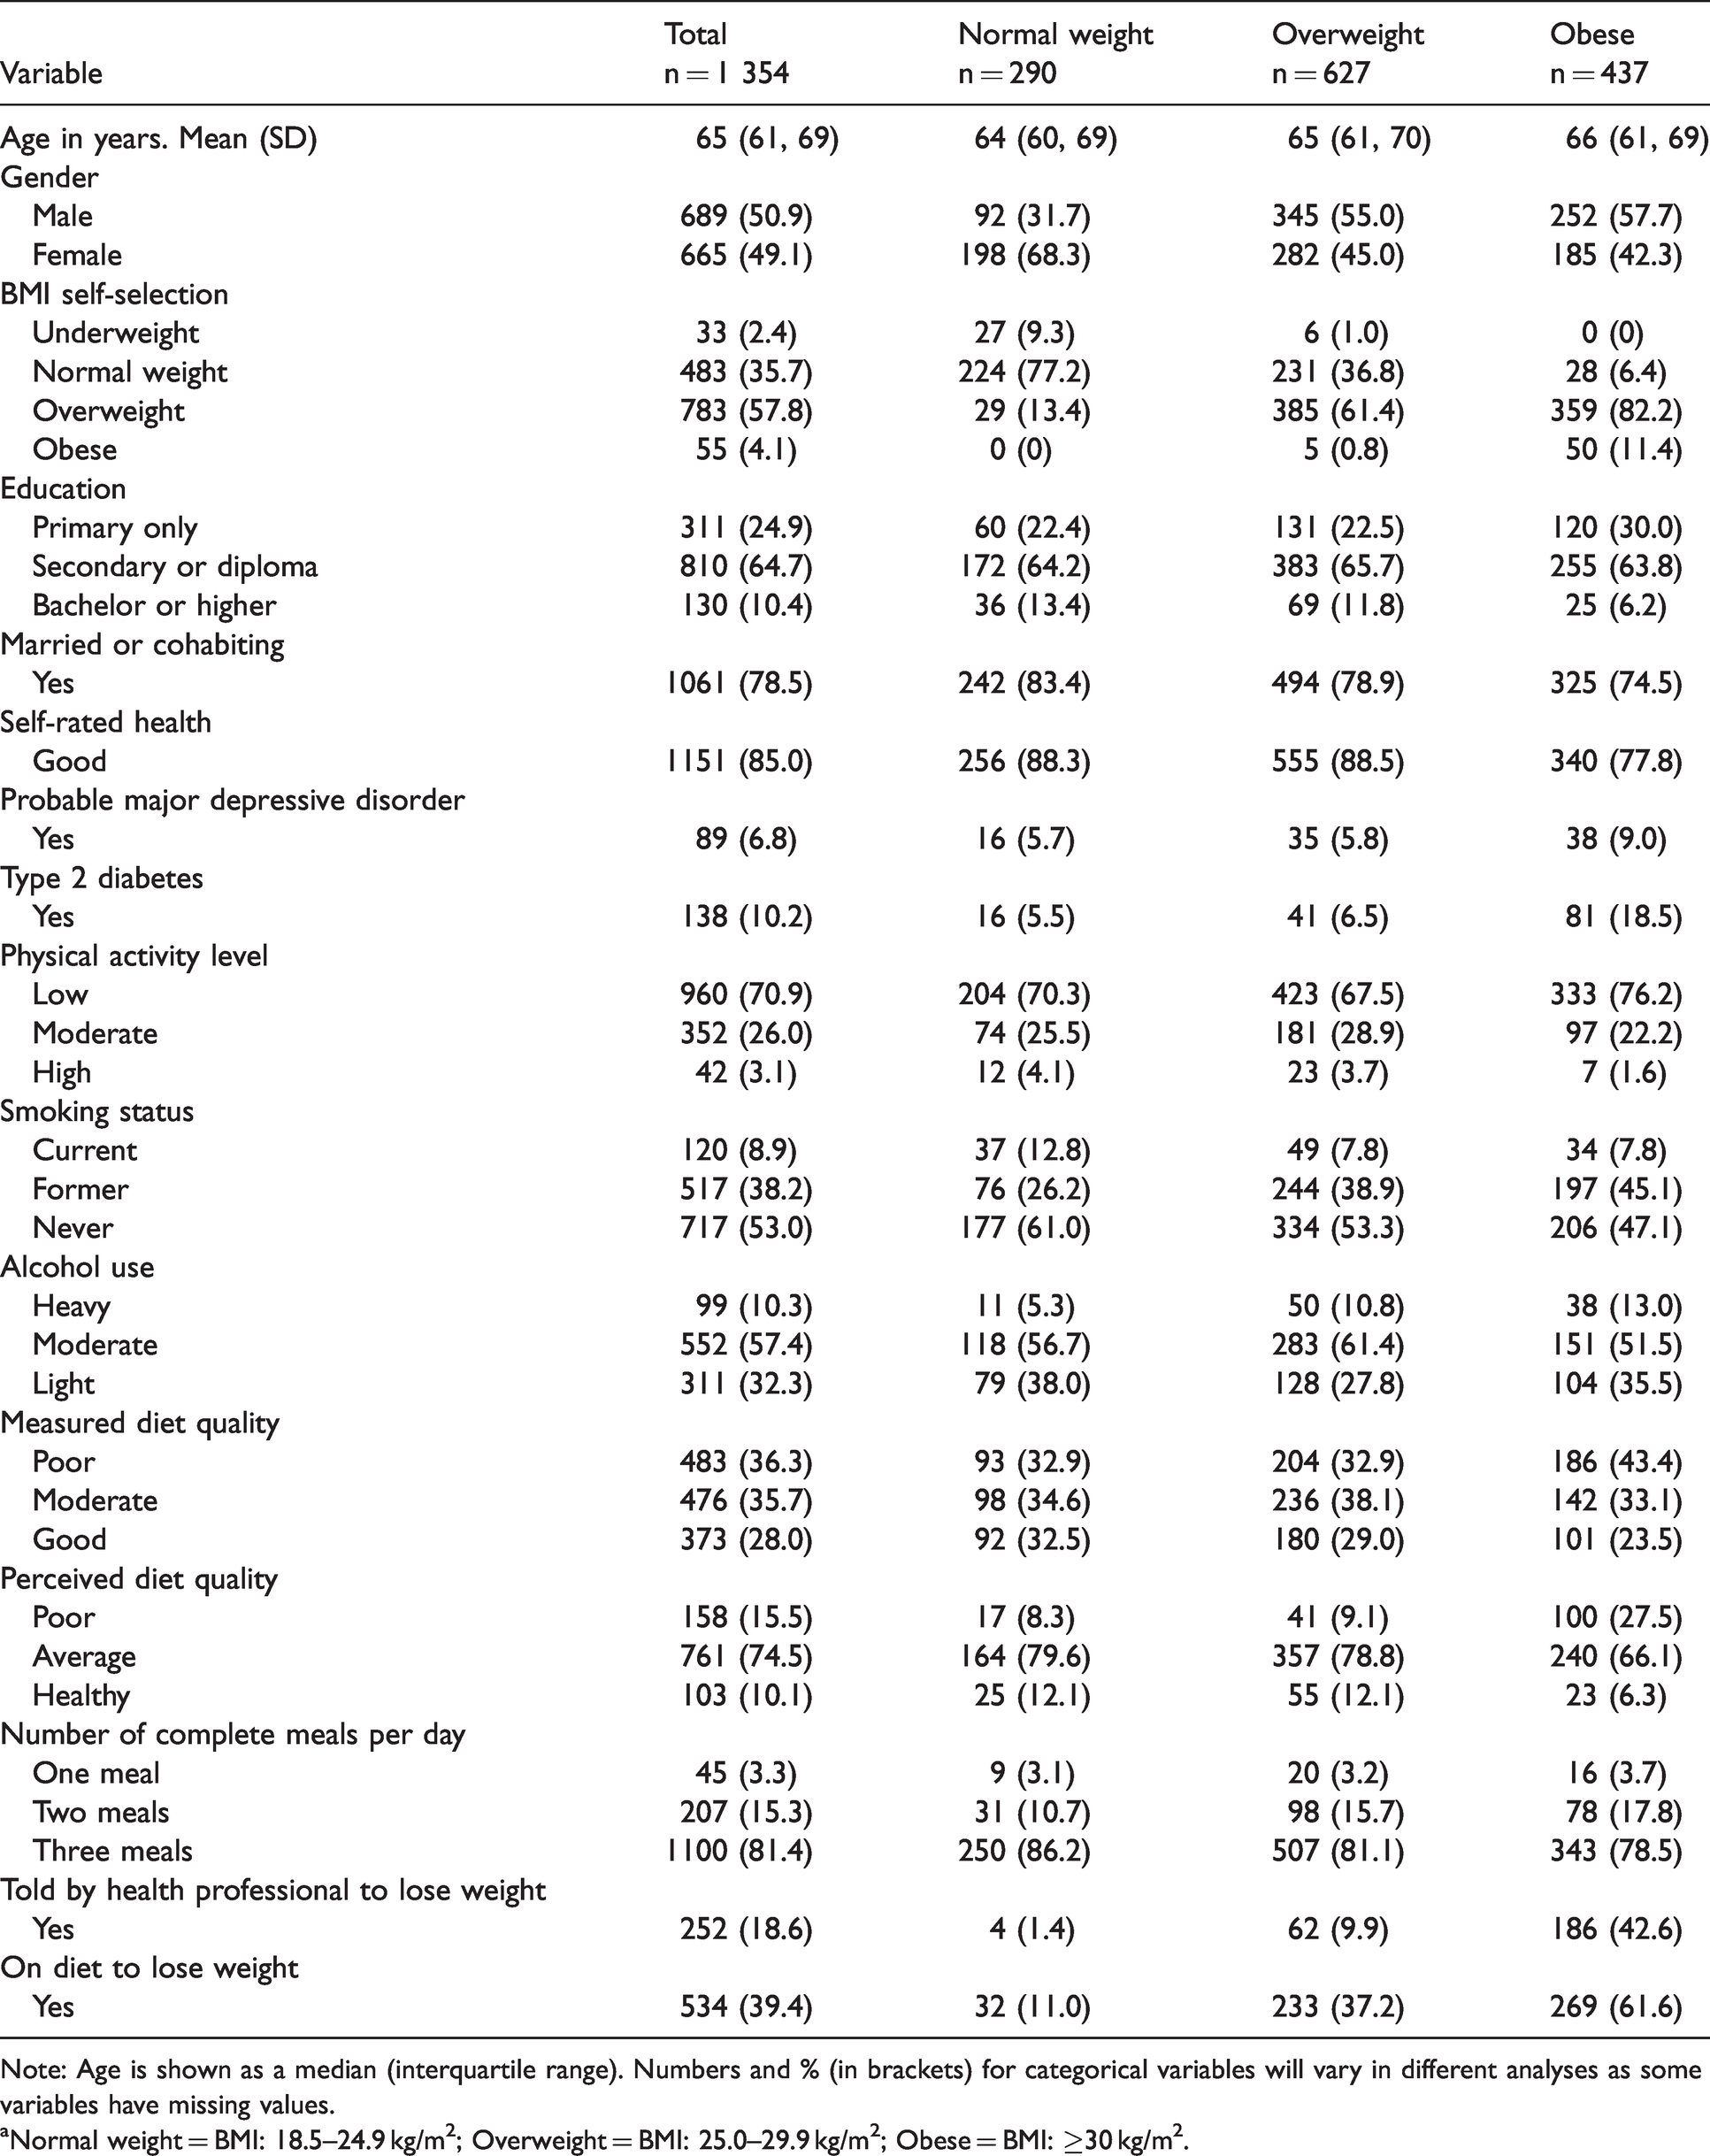
Note: Age is shown as a median (interquartile range). Numbers and % (in brackets) for categorical variables will vary in different analyses as some variables have missing values.
aNormal weight = BMI: 18.5–24.9 kg/m2; Overweight = BMI: 25.0–29.9 kg/m2; Obese = BMI: ≥30 kg/m2.
Of the 1,354 participants’ measured BMI, 290 (21%) measured as normal weight, 627 (46%) measured as overweight and 437 (32%) measured as obese. Collectively, 79% of the cohort were either overweight or obese. A higher percentage of males were overweight or obese when compared to females (86% vs. 69%, P < .001). 77% of normal weight people correctly perceived their BMI group, 61% of overweight people were correct and just 11% of obese people. 59% percent of overweight and obese participants underestimated their BMI. Among overweight people, 237 (38%) underestimated their weight, with 231 believing that they were normal weight. Among obese people, a majority 387 (89%) underestimated their BMI, with 359 believing they were overweight and 28 indicating they perceived themselves to be normal weight. After excluding participants with a normal BMI and participants who overestimated their BMI, 45% of males and 55% of females correctly classified their BMI group.
Logistic regression
Table 2 focuses on overweight and obese participants only and presents results from univariate logistic regression analyses displaying associations between variables and correct BMI self-selection.
Unadjusted odds ratiosa for factors associated with correct selection of BMI among overweight and obese subjects.
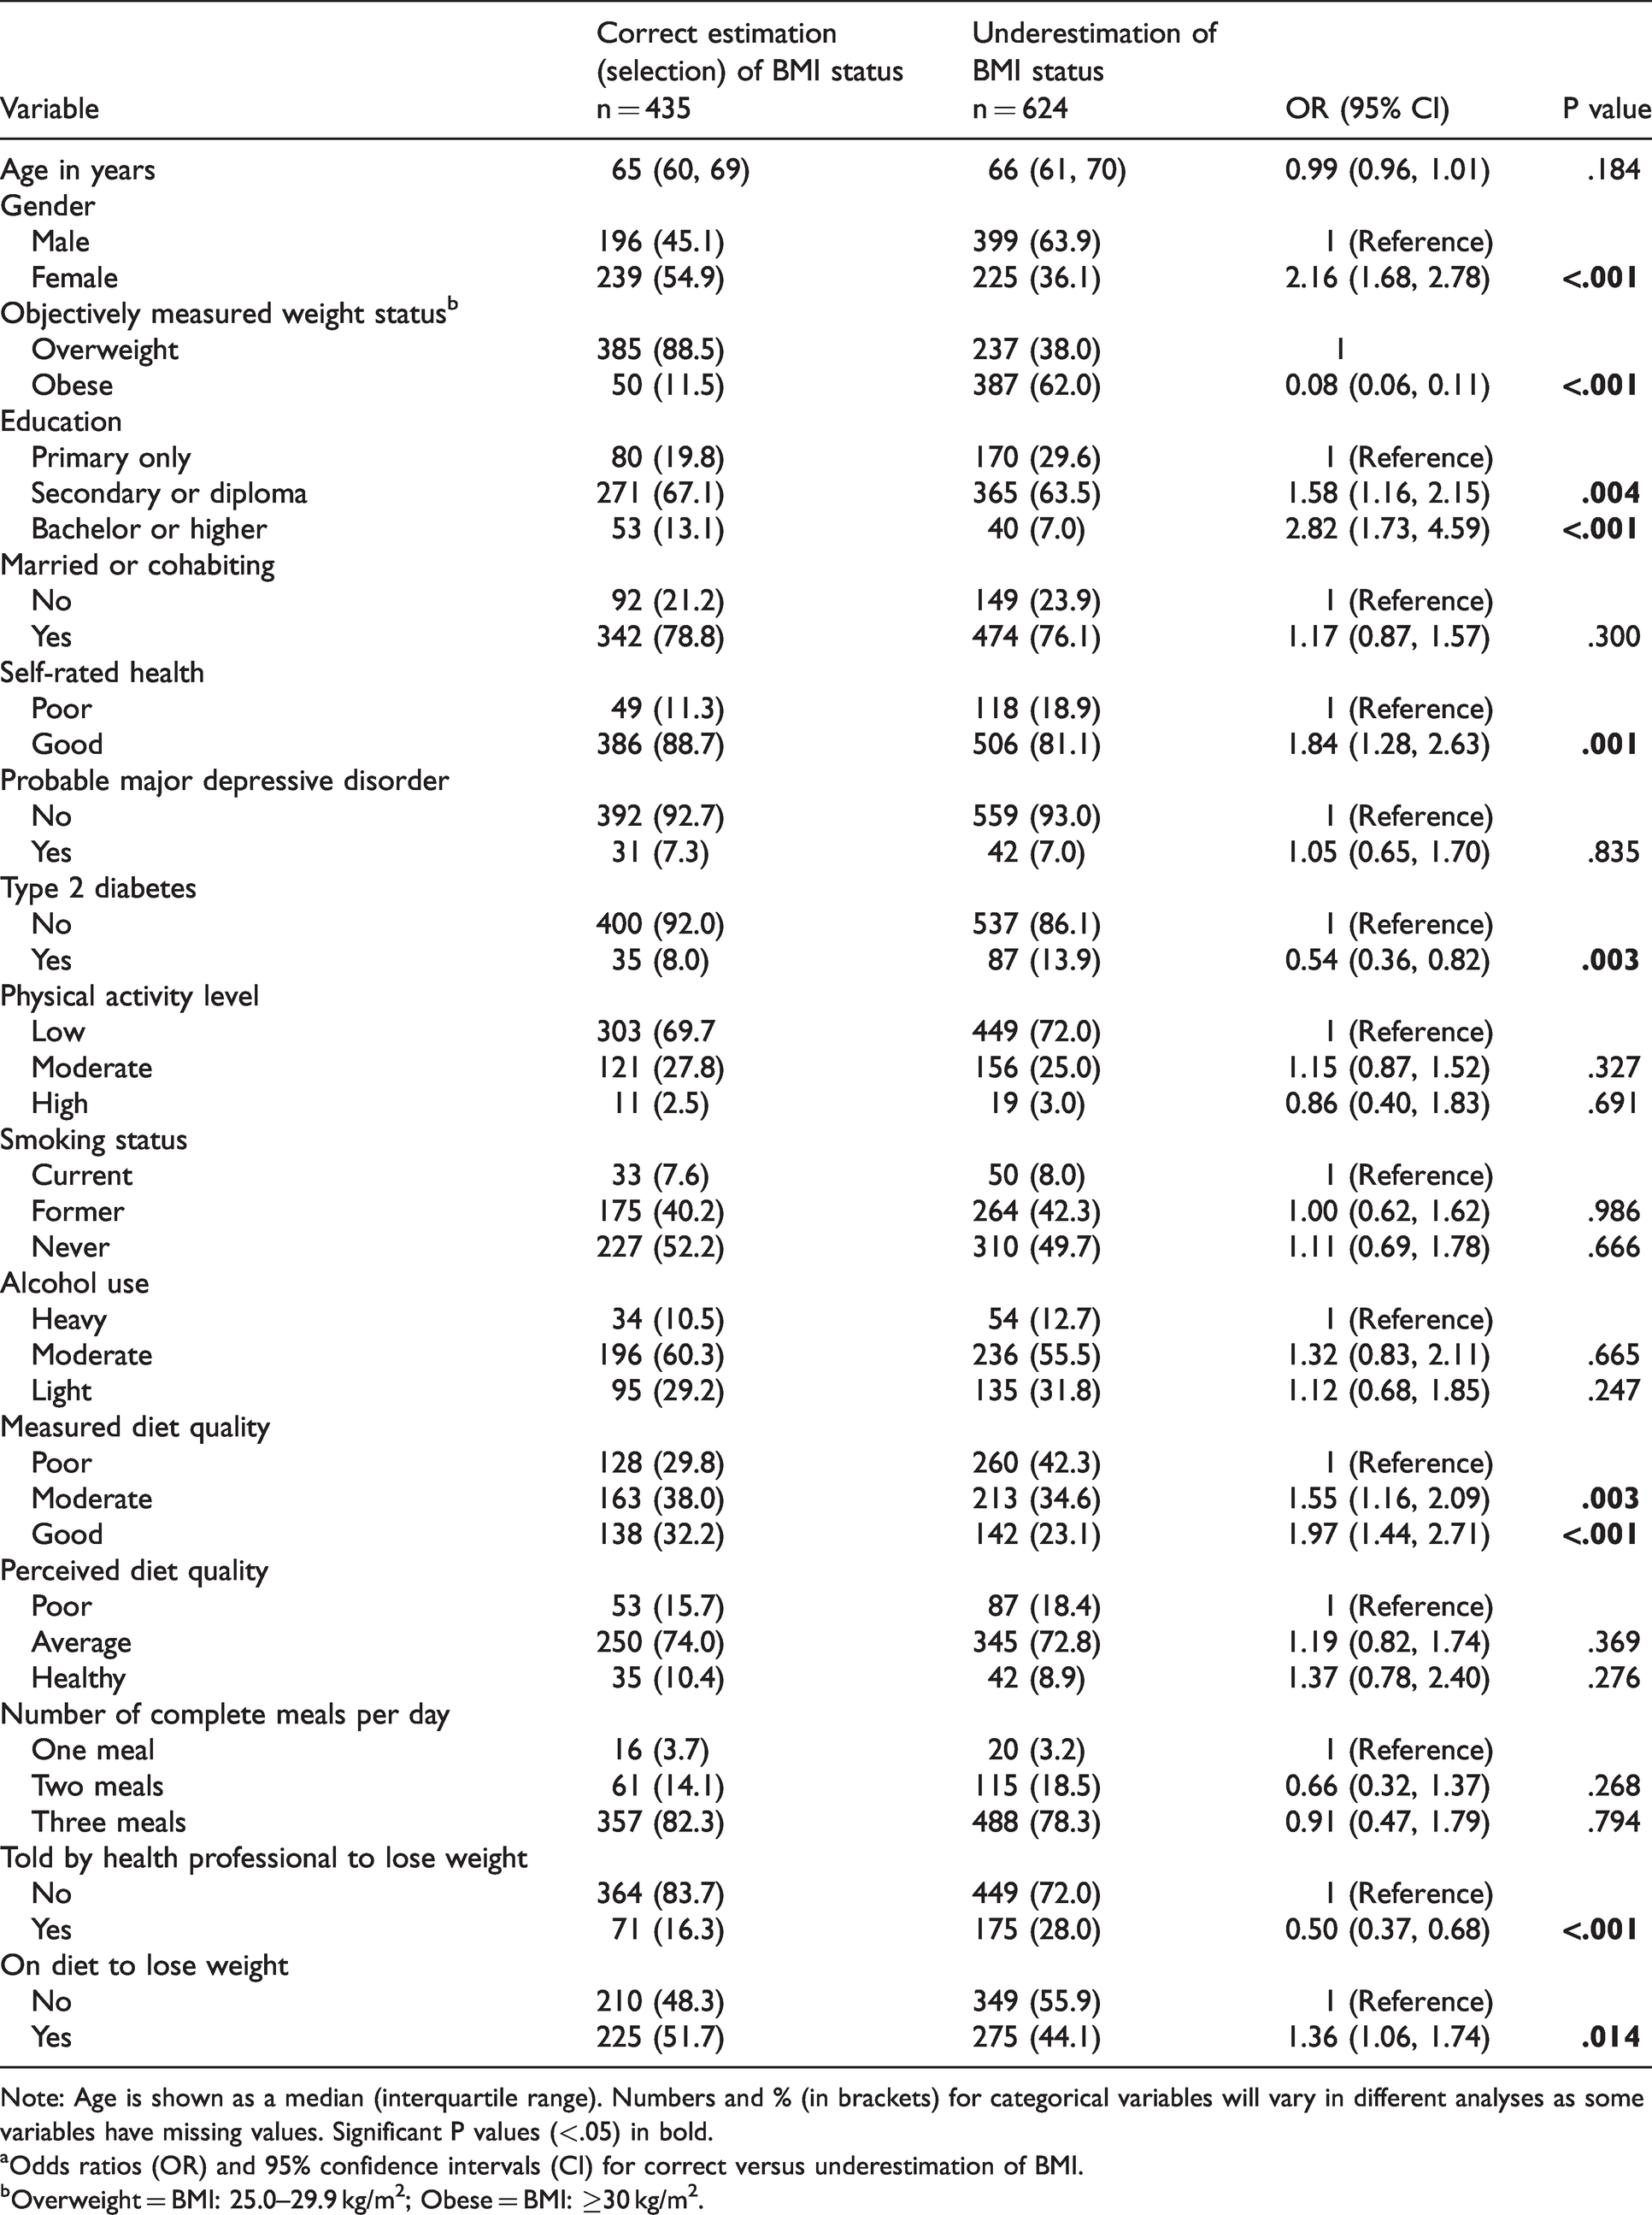
Note: Age is shown as a median (interquartile range). Numbers and % (in brackets) for categorical variables will vary in different analyses as some variables have missing values. Significant P values (<.05) in bold.
aOdds ratios (OR) and 95% confidence intervals (CI) for correct versus underestimation of BMI.
bOverweight = BMI: 25.0–29.9 kg/m2; Obese = BMI: ≥30 kg/m2.
Females were twice as likely to correctly select their BMI compared to males (OR = 2.16, 95% CI: 1.68, 2.78). Other factors related to correct BMI self-selection were higher educational levels, having good self-rated health, not having diabetes, better diet quality as measured using DASH, not being told by a health professional to lose weight and being on a diet to lose weight. Obese participants were significantly less likely to correctly perceive their BMI compared to overweight participants.
In multivariable analysis (Table 3), gender, education and objectively measured obesity (defined by BMI) remained significantly associated with correct BMI self-selection. Females were more than twice as likely to correctly classify their BMI group (OR = 2.57, 95% CI: 1.83, 3.61) than males, as were those with at least a Bachelor’s degree (OR = 2.03, 95% CI: 1.11, 3.70). In addition, participants who had been told by a health professional to lose weight were also more likely to correctly classify their BMI group (OR = 1.88, 95% CI: 1.17, 3.04), while participants who were on a diet to lose weight had three-fold increased odds of accurately classifying their BMI group (OR = 3.17, 95% CI: 2.18, 4.62). Those who measured as obese were significantly less likely to be correct (OR = 0.03, 95% CI: 0.02, 0.06). The c statistic for a model which included these variables was 0.84 (95 CI: 0.81, 0.87), indicating that the model was good at separating cases from non-cases.
Adjusted odds ratiosa for factors associated with correct BMI self-selection among overweight and obese subjects.
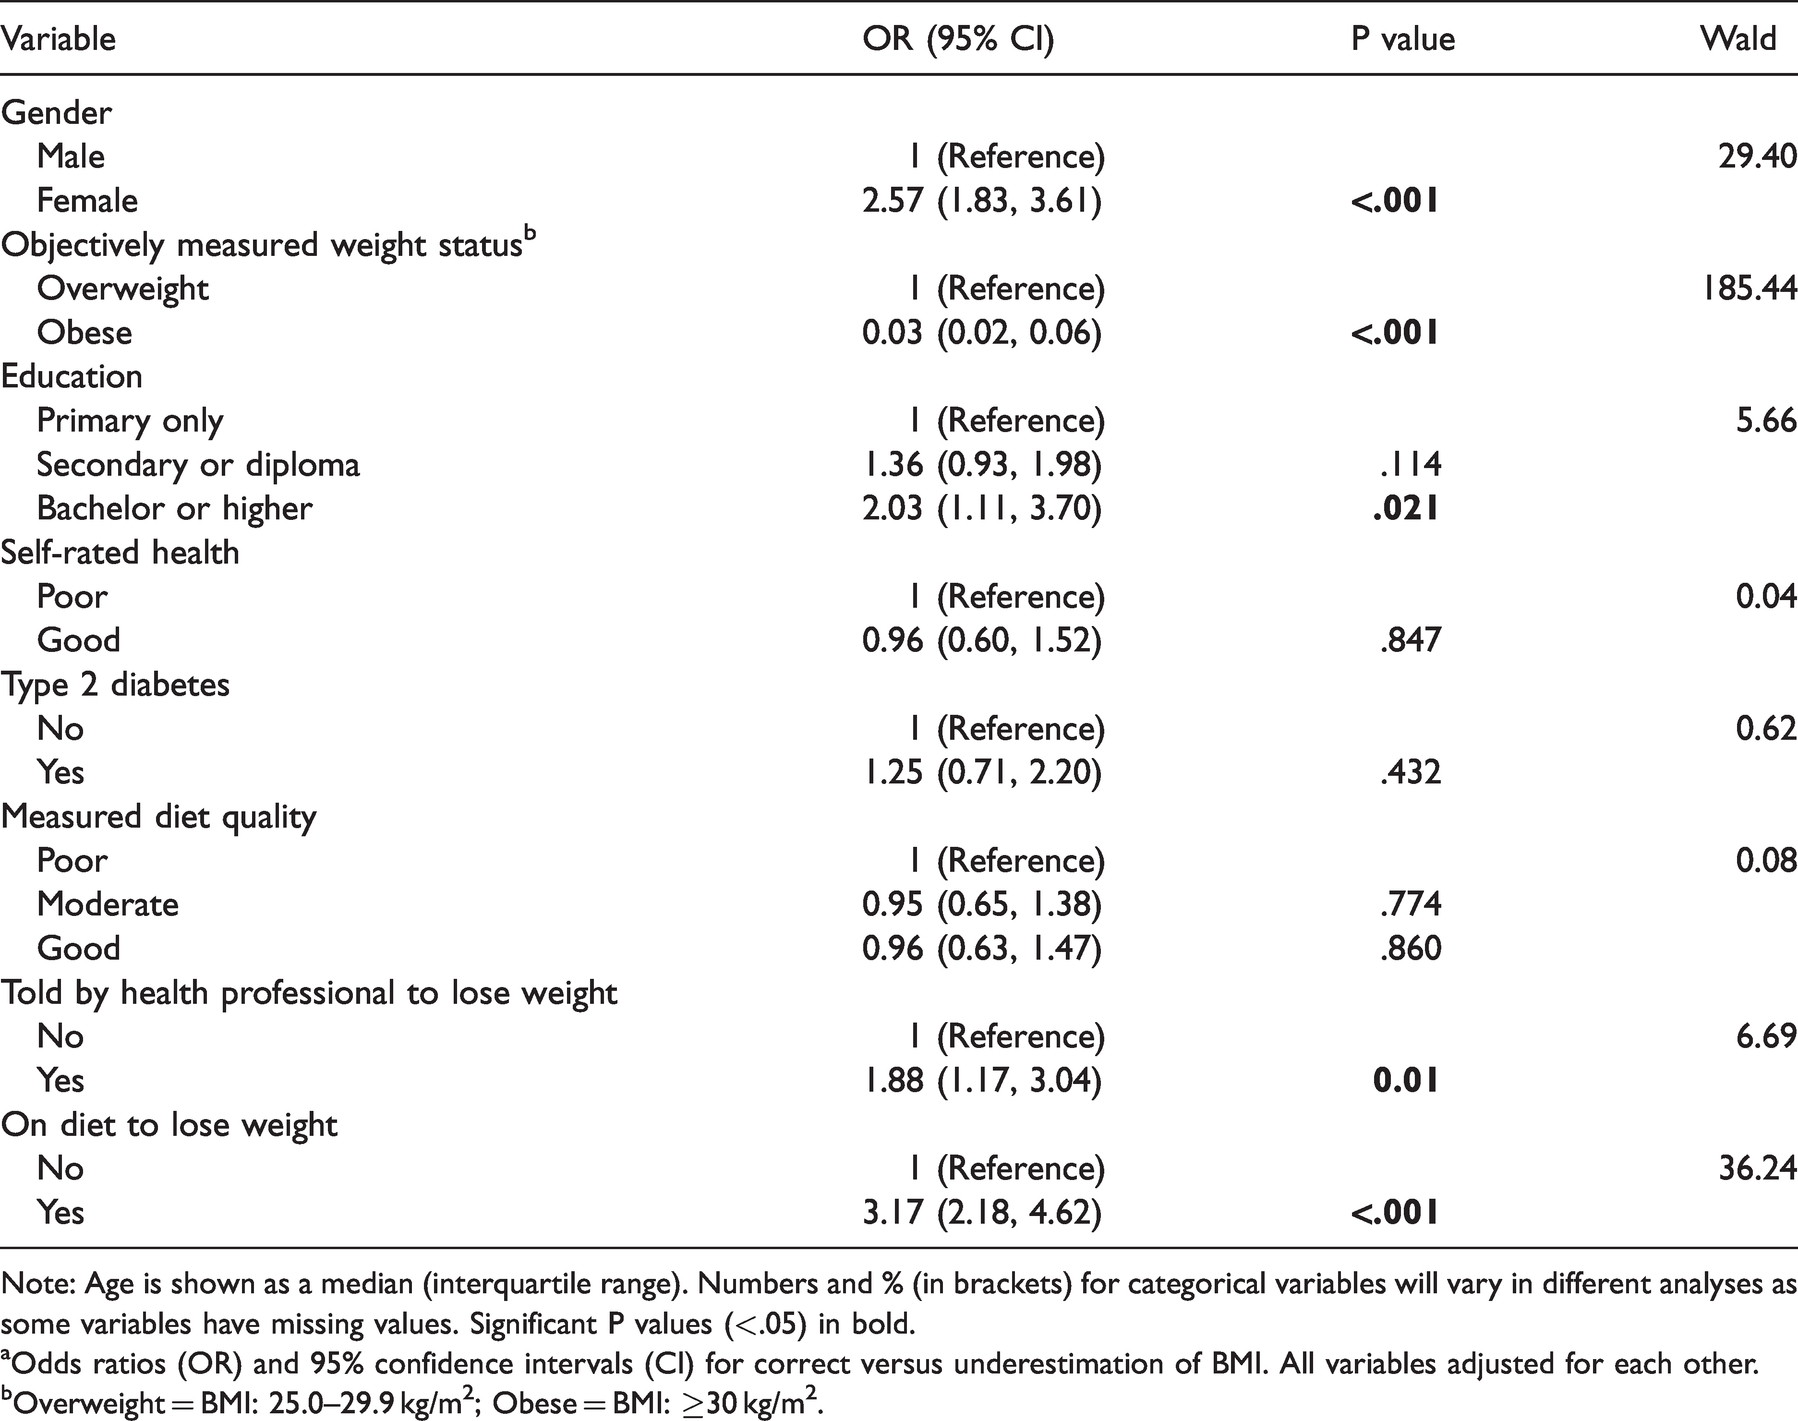
Note: Age is shown as a median (interquartile range). Numbers and % (in brackets) for categorical variables will vary in different analyses as some variables have missing values. Significant P values (<.05) in bold.
aOdds ratios (OR) and 95% confidence intervals (CI) for correct versus underestimation of BMI. All variables adjusted for each other.
bOverweight = BMI: 25.0–29.9 kg/m2; Obese = BMI: ≥30 kg/m2.
BMI self-selection according to BMI levels
Odds ratios for correct selection of BMI according to BMI levels are shown in Table 4.
Odds ratiosa for correct estimation (selection) of weight according to BMI levels among overweight and obese subjects.
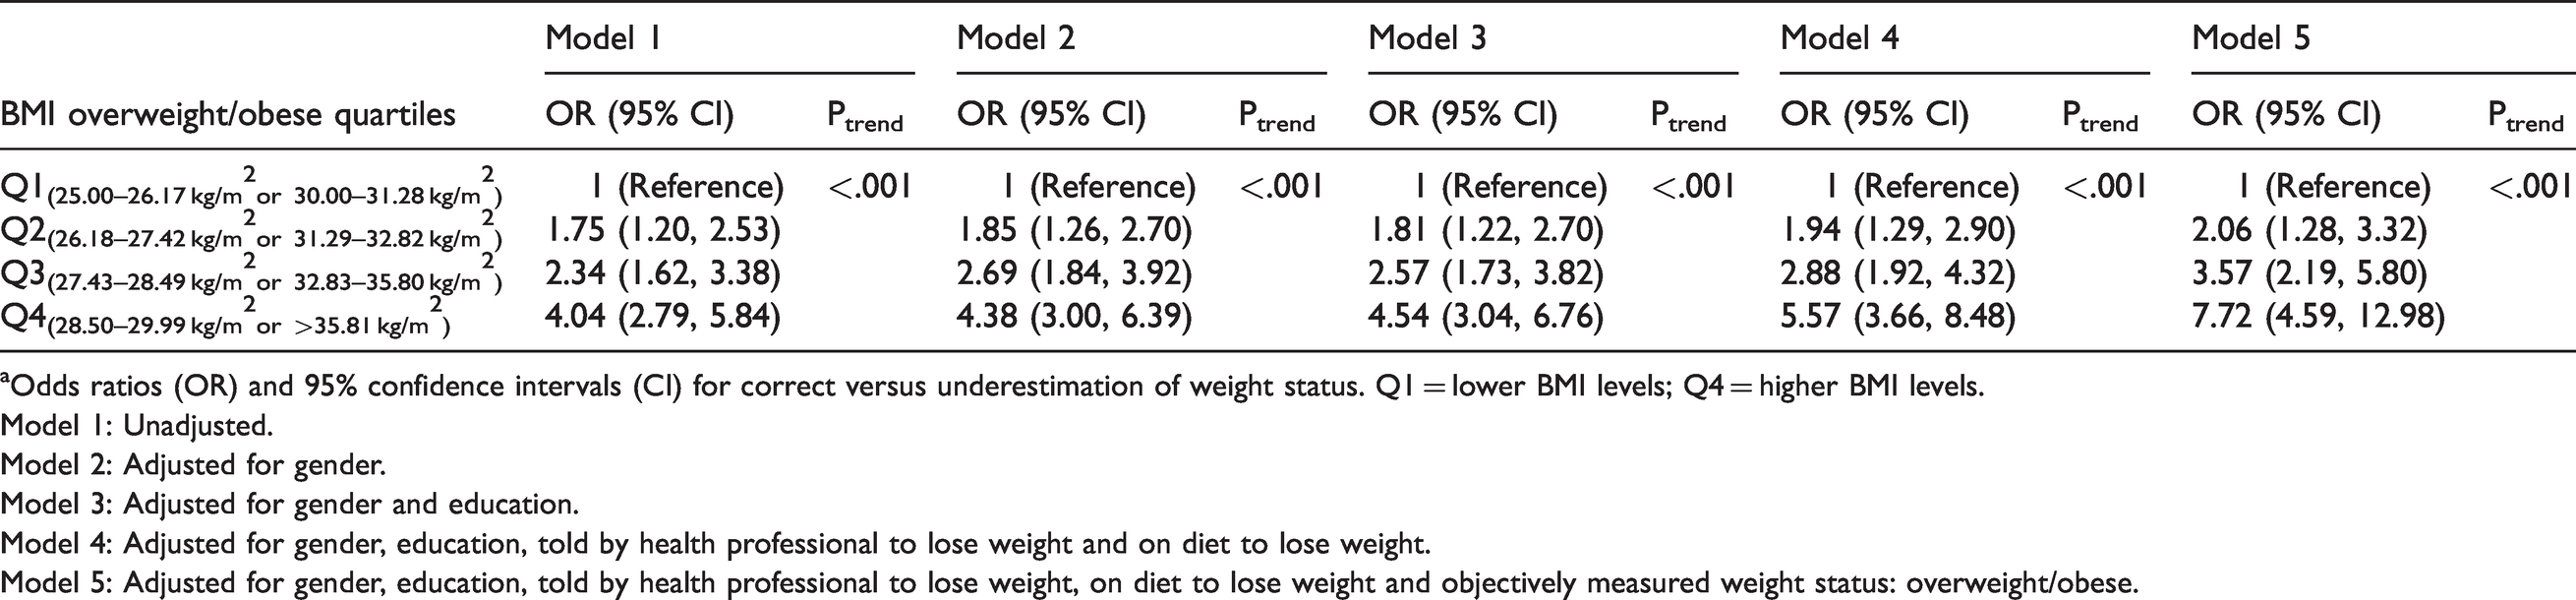
aOdds ratios (OR) and 95% confidence intervals (CI) for correct versus underestimation of weight status. Q1 = lower BMI levels; Q4 = higher BMI levels.
Model 1: Unadjusted.
Model 2: Adjusted for gender.
Model 3: Adjusted for gender and education.
Model 4: Adjusted for gender, education, told by health professional to lose weight and on diet to lose weight.
Model 5: Adjusted for gender, education, told by health professional to lose weight, on diet to lose weight and objectively measured weight status: overweight/obese.
Amongst overweight and obese participants, there was a linear trend relationship between increasing BMI levels and correct classification of BMI, with participants who were more overweight or obese being more likely to perceive their BMI correctly. In a final model, participants in the highest BMI quartile had approximately an eight-fold increased odds of correctly perceiving their BMI when compared to participants within the lower overweight/obese quartile (OR = 7.72, 95% CI: 4.59, 12.98).
Discussion
We examined a new epidemiologic method of measuring BMI, BMI self-selection, which if effective would have the potential to change methodology and significantly reduce the costs of accurate BMI measurement in large epidemiological surveys. BMI self-selection has not previously been tested or reported in the literature. Misclassification bias was evident in all three BMI categories, but was most apparent in the obese category where a sensitivity of just 11.4% was recorded. BMI self-selection was influenced by gender, education, BMI group, being told to lose weight by a professional and being on a diet to lose weight.
The high prevalence of overweight and obesity in our sample is concerning. We found that 79% of this population were either overweight or obese; 86.6% of males and 70.2% of females. This is an increase from our previous 2007 study of BMI misclassification whereby in the comparative age category, 75.6% were overweight or obese. 35 The most recent national comparator is the Healthy Ireland 2015 survey, a national survey of adults 15+ years. 36 The available figures are categorised by gender and age, so are not directly comparable. The trend is similar however. In the 2015 survey, BMI for men and women respectively is: 45–54 years: 76% and 62%; 55–64 years: 83% and 68%; 65+ years: 81% and 68%. We can conclude that levels of obesity for this study concur with the national statistics for 2015 and have thus increased over time.
The sensitivity of the obese category in this study is extremely low (11.4%), even when we compare it to our previous study of misclassification patterns between self-reported BMI (defined by self-reported weight and height) and objectively measured BMI (defined by measured weight and height), in which it was 53.4% in 2007 in a national study of adults over 18 years. 8 Although this study is more than 10 years old, and we are comparing different methodologies for BMI classification, we cannot conclude that this is a result of the differing methodologies as we had already seen a decline in the sensitivity of the obese category in the prior 10 years, from 1998 (79.5%) to 2002 (64%) to 53.4% in 2007. It may be the case, and is in fact highly likely, that this decline is related to our inability to correctly perceive BMI/weight status. This is even more likely to be the case, supported by our current study, given the significant underestimation of BMI in both the overweight (37.8%) and obese (88.6%) categories. A decline in ability to perceive BMI and/or weight status is observed worldwide3,27,37 and Ireland appears to be no different. However, the trend has changed over time in Ireland. In our prior 2010 study, 8 using 2007 data, the majority of misclassifications were in the overweight category, while in our current study, the majority of misclassifications were in the obese category. This is likely attributable to the overall rising rates of obesity in Ireland.
The linear trend relationship in the overweight/obese participants, between increasing BMI levels and correct BMI selection is a significant concern, particularly for clinicians. It is not unexpected that those with the highest BMI levels are more likely to correctly perceive their BMI because they are also more likely to have been told by a doctor to lose weight, are more likely to be on a diet to lose weight, and are thus more aware of their weight and BMI group. They are also the participants with the highest all-cause mortality risk as a result of metabolic sequelae including hyperlipidemia, hypertension, diabetes and cardiovascular disease. 38 However, the approximate eight-fold increased odds of being more likely to perceive their BMI correctly compared to the lower quartile, within the overweight/obese categories, is concerning. The question must be asked as to why this differential is so great? One possibility is that clinicians themselves underestimate their patients’ BMI as they have been desensitised to obesity, given the rising levels of obesity in our population. It is likely they underestimate the BMI of patients at the lower end of the BMI overweight and obese spectrum, as the patients themselves do, and thus are less likely to recommend to these patients that they lose weight compared to those at the higher end of the BMI overweight/obese categories. Patients at these lower overweight/obese levels are at a substantial risk of becoming more overweight/obese leading to significant health risks, particularly if they are unaware of their BMI status, as seems to be the case here. The focus for clinicians should be on targeting this group to prevent further weight accumulation, by making them aware of their BMI status and recommending they lose weight to achieve normal BMI levels and thus reduce their all-cause mortality risk.
After excluding participants with a normal BMI and participants who overestimated their BMI, 45% of males and 55% of females correctly classified their BMI status. These figures are quite low, and are concerning for future generations given that a diagnosis or recognition of overweight or obesity is a first step towards acceptance and potential change. 39 Among obese people, a majority 387 (89%) underestimated their BMI, with 359 believing they were overweight and 28 indicating they perceived themselves to be normal BMI. We have previously hypothesised that in Ireland, there is a shift in the social norms of obesity8,9,20 and international evidence verifies this hypothesis. 40 Our closest neighbours, England, report similar findings and though it is a national sample of men and women 16+ years, it is a useful comparator. 37 Overall, they report that 40% of men and 19% of women misperceive their weight, with men more likely than women to do so, and attribute it to the normalisation of overweight and obesity, which the author says is widespread in England.
In multivariable analysis, the factors associated with correct BMI self-selection are higher education level, gender, objectively measured BMI, being told to lose weight or being on a diet. It is understandable that being told to lose weight or being on a diet is associated with correct self-selection, as it is likely that these people have been objectively measured recently. The association with higher education level, though concerning, is not new. We know that compared to less educated adults, more educated adults have lower average BMI and a lower risk of overweight and obesity in both the US 41 and Europe. 42 A recent publication attributes this more to selection than causation; children with lower BMI attain higher levels of education, and higher educational attainment leads to lower BMI levels. 43 Therefore, this raises the important issue of tackling childhood obesity before it becomes an entrenched problem in adult life.
The gender disparity in BMI self-selection is clearly evident, with females more than twice as likely to select their BMI correctly compared to their male counterparts in multivariable analysis. We also know from this study that a higher proportion of males are overweight or obese. In a weight perception study in the US, this trend is also observed, as well as a higher probability that women are more dissatisfied with their weight. 44 It could thus be argued that amongst females, there is a greater awareness of the ill effects of overweight and obesity, be it image-related or health-related, and thus they are more mindful of their BMI and monitor their weight, which in turn leads to a more accurate classification of their BMI. We know that weight and appearance satisfaction are associated with life satisfaction, 45 thereby underlying the importance of accurate BMI selection to give realistic estimates of a ‘healthy satisfying body weight’. The findings here, as well as in numerous other studies, highlights the necessity to consider men and women separately when targeting them for public health interventions to tackle obesity.
Strengths and limitations
This is a large sample including objectively measured BMI derived from measured height and weight. The age range of the participants is limited to 51–77 years, therefore extrapolating findings to adults of other ages should be done with caution. However, the obesity levels are similar to the national statistics in 2015, thereby confirming a representative sample in this cohort. Missing data were not an issue in this study as the percentage of missing values in the variables of interest was extremely small, as evidenced by the large numbers in each table, therefore imputation was not necessary. Measurement bias is a consideration in this study but weight and height data in the Mitchelstown Cohort Study were measured by trained personnel using standardised equipment following a standard protocol thereby minimising any potential measurement biases. This is a cross-sectional study (albeit of a cohort), therefore causation cannot be inferred. We were unable to establish if BMI self-selection is superior to self-reported BMI (derived from self-reported weight and height) as self-reported weight and height were not collected, thereby limiting our comparisons. To truly examine the potential of BMI self-selection as a tool to measure BMI in large epidemiological studies, it would be most useful to compare it to self-reported BMI derived from self-reported weight and height, as well as objectively measured BMI, given that self-reported BMI based on weight and height is used most commonly. Future studies should also collect these data.
Conclusions
BMI self-selection is a potential cheap new method of measuring BMI in large epidemiological studies when objectively measuring it is not achieveable. As a first study focusing on BMI self-selection, it shows moderate sensitivity with objectively measured BMI for the normal and overweight categories, but poor sensitivity for the obese category. It is worth investigating the BMI self-selection method further and additional studies should include a broader age range. Furthermore, data should include all three measurements of BMI, self-reported BMI derived from self-reported height and weight, BMI self-selection and objectively measured BMI, to establish if BMI self-selection is at least superior to self-reported BMI, the method which is used most commonly in large epidemiological studies. The take home message for clinicians is to focus on those patients that appear to be ‘normal weight’ but clearly carry excess weight and urge them to be aware of their BMI and the significant risks to their health as a consequence of higher than normal BMI levels. These patients should be asked to lose weight and this should be monitored at each clinic visit. Public health policy makers should note the gender differences in this study and tailor their messages on BMI and obesity accordingly.
Footnotes
Availability of data and materials
The dataset used and analysed during the current study are available from the institution of the corresponding author on reasonable request.
Ethics approval and consent to participate
Ethics committee approval conforming to the Declaration of Helsinki was obtained from the Clinical Research Ethics Committee of University College Cork. A letter signed by the contact GP in the clinic was sent out to all selected participants with a reply slip indicating acceptance or refusal. All participants gave signed informed consent, including permission to use their data for research purposes. The Mitchelstown Cohort Rescreen Study is GDPR compliant.
Acknowledgements
Dr Janas Harrington and Professor Ivan Perry, PIs, Mitchelstown Cohort Study for allowing the use of the data.
Authors’ contributions
FS designed the study, drafted the background and discussion sections and contributed to the interpretation of the analysis. SM analysed the data, drafted the methods and the results sections. Both authors contributed to refining the paper for submission.
Declaration of Conflicting Interests
The author(s) declared no potential conflicts of interest with respect to the research, authorship, and/or publication of this article.
Funding
The author(s) disclosed receipt of the following financial support for the research, authorship, and/or publication of this article: This work was supported by a research grant from the Irish Health Research Board (reference: HRC/2007/13). The funders had no role in the study design, data collection and analysis, decision to publish or preparation of the manuscript.