
Abstract
Background
Scales for evaluating insomnia differ in number of items, response format, and result in different scores distributions and score ranges and may not facilitate meaningful comparisons.
Objectives
Transform ordinal item-scores of three scales of insomnia to continuous, equidistant, monotonic, normally distributed scores, avoiding limitations of summative scoring of Likert scales.
Methods
Equidistant item-scores by weighted sum using data-driven weights to different levels of different items, considering cell frequencies of Item-Levels matrix, followed by normalization and conversion to [1, 10]. Equivalent test-scores (as sum of transformed item- scores) for a pair of scales were found by Normal Probability curves. Empirical illustration given.
Results
Transformed test-scores are continuous, monotonic and followed Normal distribution with no outliers and tied scores. Such test-scores facilitate ranking, better classification and meaningful comparison of scales of different lengths and formats and finding equivalent score combinations of two scales. For a given value of transformed test-score of a scale, easy alternate method avoiding integration proposed to find equivalent scores of another scales. Equivalent scores of scales help to relate various cut-off scores of different scales and uniformity in interpretations. Integration of various scales of insomnia is achieved by finding one-to-one correspondence among the equivalent score of various scales with correlation over 0.99
Conclusion
Resultant test-scores facilitated undertaking analysis in parametric set up. Considering the theoretical advantages including meaningfulness of operations, better comparison, use of such method of transforming scores of Likert items/test is recommended test and items, Future studies were suggested.
Introduction
A number of patient-reported scales are used for screening, assessing insomnia severity, monitoring progress, evaluating treatment efficiency, etc. to assist investigators and clinicians in evaluating multidimensional insomnia. Commonly used scales in this context include Insomnia Severity Index (ISI), 1 Pittsburgh Sleep Quality Index (PSQI), 2 Athens Insomnia Scale, 3 etc. None of these scales gives a well-defined dichotomous outcome which more or less tallies with clinical interviews for epidemiological studies. 4 Insomnia Symptom Questionnaire (ISQ) 5 focuses on symptoms of insomnia which are based on DSM-IV and RDC criteria. High agreement of ISQ with clinical interviews tends to suggest better diagnosis of insomnia. 6 However, most of the scales do not meet the specific needs of investigators conducting epidemiological or clinical trial studies. 7 Major particulars of illustrative popular scales for Insomnia are given in Table 1.
Illustrative scales for insomnia.
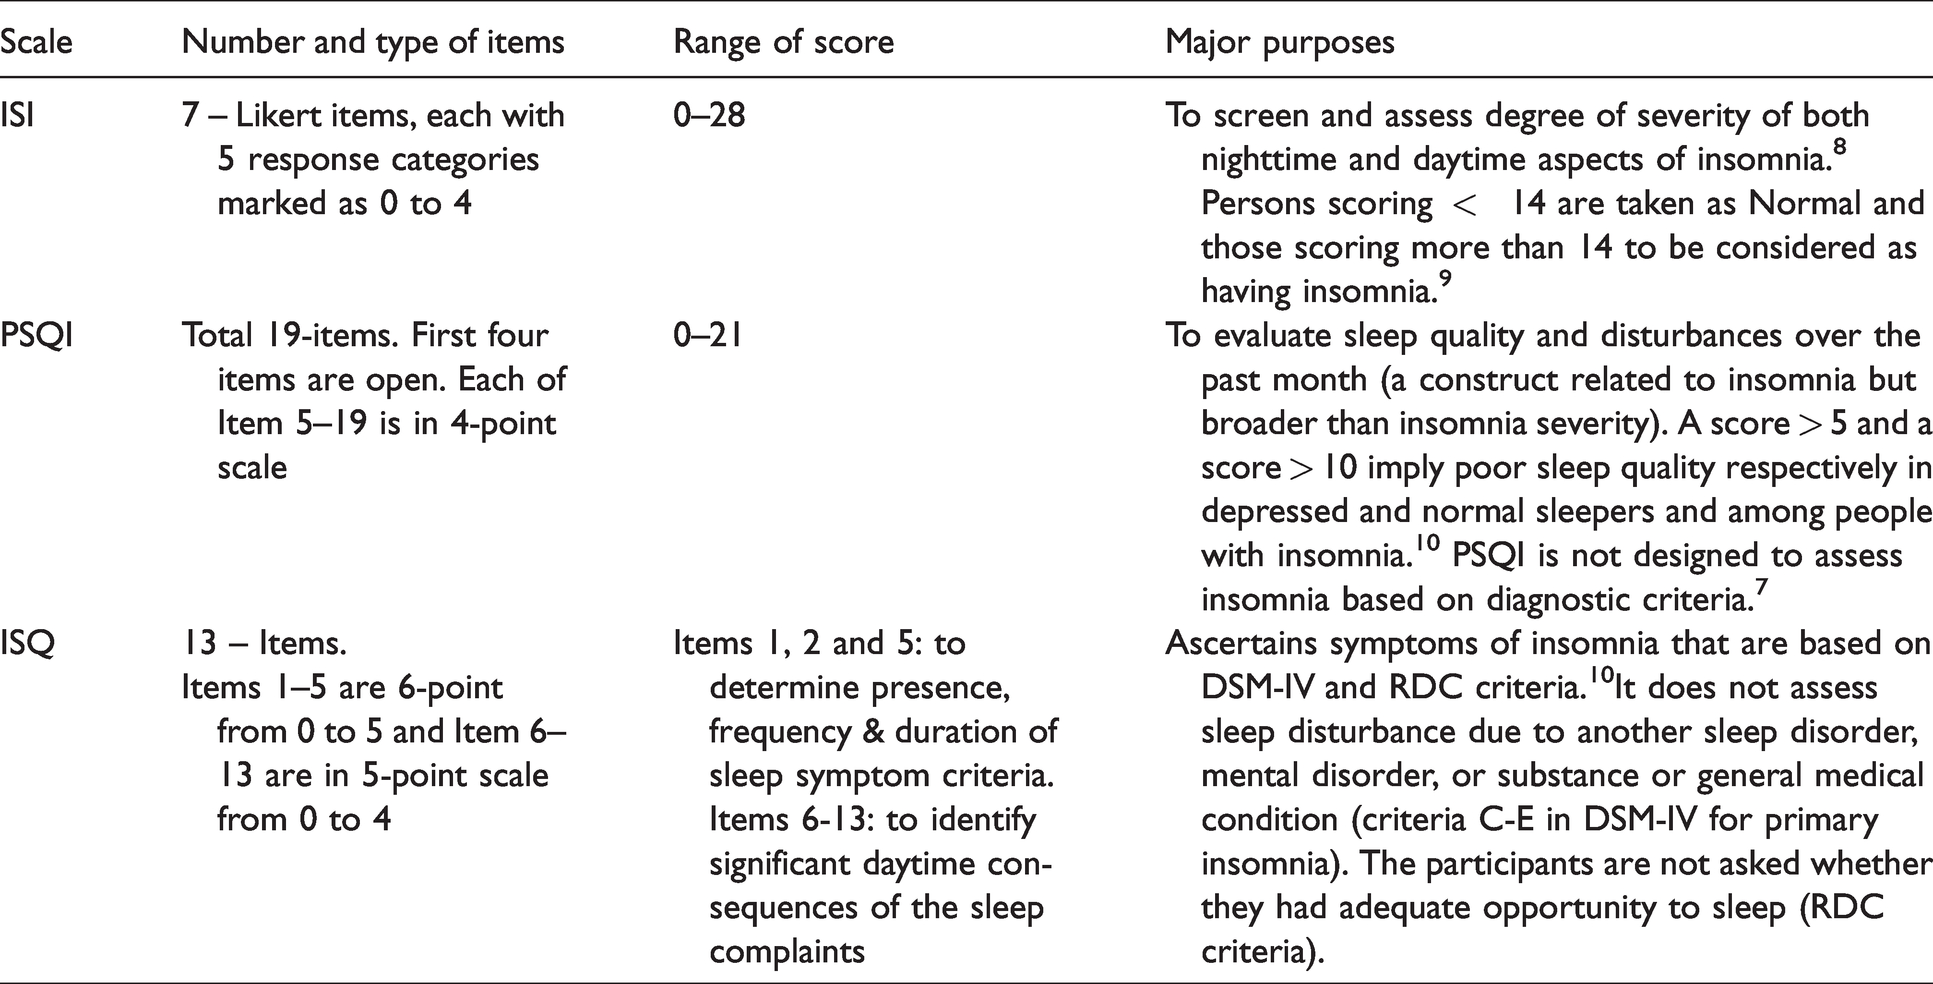
Each scale considers summative score which assumes (i) equal importance to all the items and (ii) satisfaction of equidistant property. Both the assumptions may not be justified. 11 The scales differ in terms of number of items, response format, etc. and result in different scores with different distribution and different score range and may not facilitate meaningful comparisons. Different scale formats distorted results of satisfaction surveys. 12 Test parameters like reliability, validity, and discriminating power indices are on lower levels for 2 point, 3-point, and 4-point scales from - the scales with higher number of levels. 13 Most of the Insomnia assessing scales consider zero as an anchor value which may distorts mean, standard deviation (SD), skewness, kurtosis of scales.14,15 Too many zero responses to an item lowers mean, variance of the item and covariance and correlation with that item. Techniques like Principal component analysis (PCA), Confirmatory Factor analysis (CFA), Structural equation modeling (SEM), etc. are sensitive to the characteristics of the data. 16 Effect of numerical value attached to various response categories have been investigated.17,18
Consider a situation where two scales (say ISI and PSQI) have been administered to the same sample. Different number of items (7 for ISI and 4 for PSQI, excluding the four open questions) and different number of response categories (5 for ISI and 4 for PSQI) will give different values of mean, SD for ISI and PSQI. In fact, distribution of ISI scores and PSQI score will be different and the two sets of scores may not be comparable. Higher number of response categories result in increased values of mean and SD.
19
Thus, the different cut-off scores for ISI and PSQI may not be equivalent. In other words, set of persons with
Equivalent score combinations of two scales 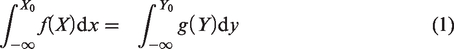
The above motivates need to transfer the raw scores of self-reported scales of insomnia using Likert items with different number of response categories so that transformed item scores satisfy equidistant property and other desirable properties like continuous, monotonic data following normal distribution. Test scores of each scale as sum of such transformed item scores may be rescaled further to have a desired score range say 1 to 10 and facilitate finding equivalent score combinations
Rest of the paper is organized as follows. After literature survey, methodology of the proposed method and properties are described. The following section deals with empirical verifications to the suggested methods. The paper is rounded up by recalling the salient outcomes and emerging suggestions.
Literature survey
A simple way to equate a 5-point (1 to 5) item with a 7-point (1 to 7) item is to use linear transformation of levels where the extreme numbers coincide and all the intermediate options are given equally distanced numbers in between. In other words, a k-point scale is converted to (k + c)-point scale by multiplying each k-point score by
Large volume of literature dealt with conversion of scores of K-point scale to (
Instead of mapping the numerical values attached to the end points, attempts can be made to map or equate raw scores of k-point item to say (k
Proposed method
Stage 1 – Modification of anchor values
Assign 1 – 5 to the response categories of 5-point Likert items instead of 0 – 4. This avoids the problems arising out of considering zero anchor value in items of various scales for insomnia. Moreover, consideration of zero as an anchor value does not allow taking expected value of an item which is defined as product of anchor values and corresponding probabilities of the response categories.
Stage 2 – Raw scores (X) to equidistant scores (E)
This involves transferring discrete ordinal raw scores of an item(X) (where response categories are marked as 1, 2, 3, …., k for a k-point scale) to continuous scores which are equidistant. Method of such conversion given by taking weighted sum where different weights are assigned to different response categories of different items.
30
Basic idea is, if response categories are marked as 1, 2, 3, 4 and 5 (for a 5-point item) and the finally selected weights for the i-th item are
Stage 3 – Normalization
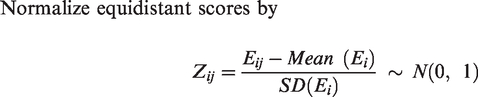
Here,
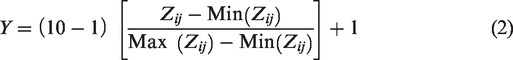
Stage 4 – Z-scores to Y in a desired score range
To avoid negative scores, convert the Z-scores to Y-scores so that Y has a fixed score range say
1 to 10 by using the following linear transformation:
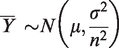
Note that test score as sum of normally distributed item-wise Assigning unique ranks to individuals Computing sample mean ( Computing 95% confidence limits of Fixed range of Y for each scale following Normal distribution helps to make ready comparisons and to find equivalent Y-scores of two scales using condition (1) Meaningful comparison of scales of different length and different formats and facilitate parametric analysis after checking additional assumptions of the respective parametric techniques, other than normality which is already ensured.
Correlation between X and Y (
Classification
The total ISI score is interpreted as follows: absence of insomnia (0–7); sub-threshold insomnia (8–14); moderate insomnia (15–21); and severe insomnia (22–28).
7
A cut-off score of 14 was recommended implying persons with score
Among various methods of classification aiming at partitioning the sample, Quartile clustering is more appealing for easy interpretation and distinct semantics.
32
Advantages of quartile clustering with respect to Y Well-defined cut-off scores for the four classes. Assigns equal probability to each quartile/class Identifies outliers by those
Equivalent scores
If quartile cut-off X-scores of ISI are
Empirical illustration
Data used for empirical illustration of the proposed method and their properties are based on hypothetical data of 101 persons on 7- ISI items (k = 5); 15 PSQI items (k = 4) and 8 ISQ items (k = 5, excluding the five 6-point items).
Let
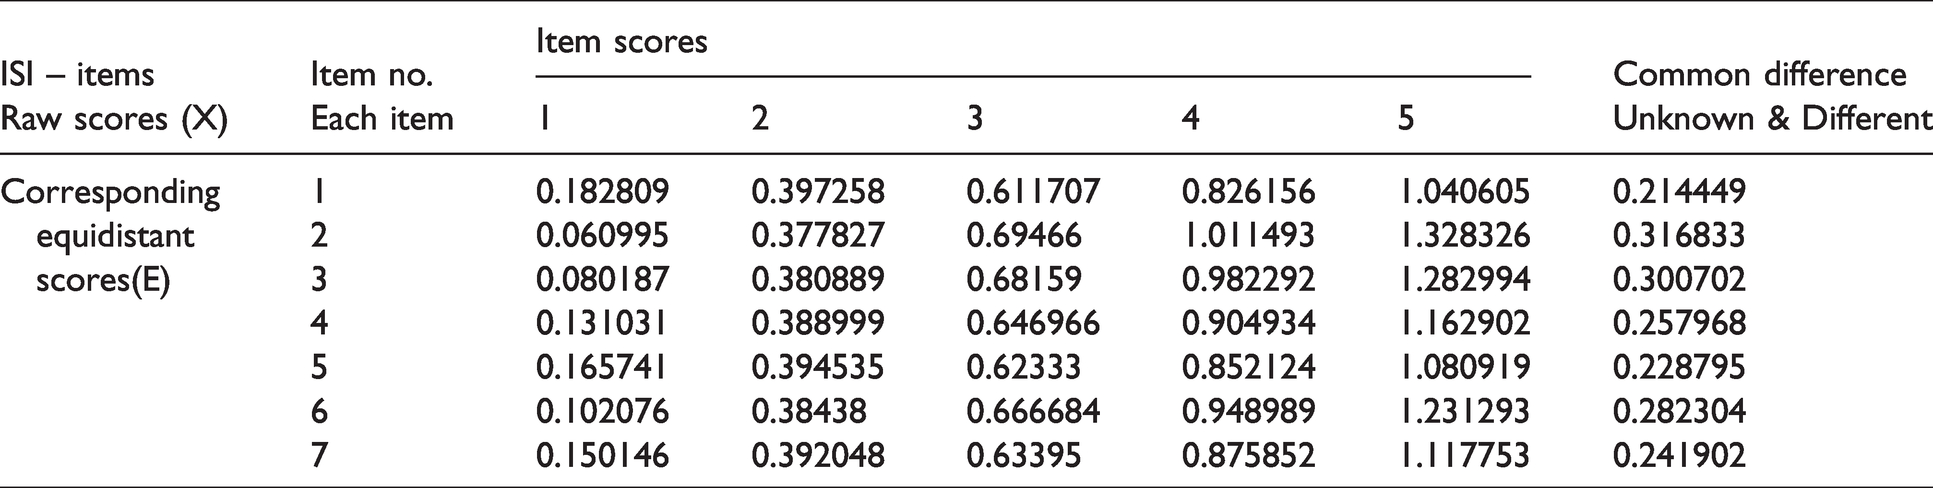
Raw scores and equidistant scores.
Observations
E-scores are continuous and equidistant. However, common difference is different for different items. Weights used for E-score are based on data driven empirical probabilities, obtained from the basic Item-Response category matrix Zero ties in equidistant score and Normalized score in [1, 10].
Observations
For two different persons i and j, Raw score failed to discriminate among the persons with tied score.
Descriptive statistics
Mean, variance, range, co-efficient of variation (CV=
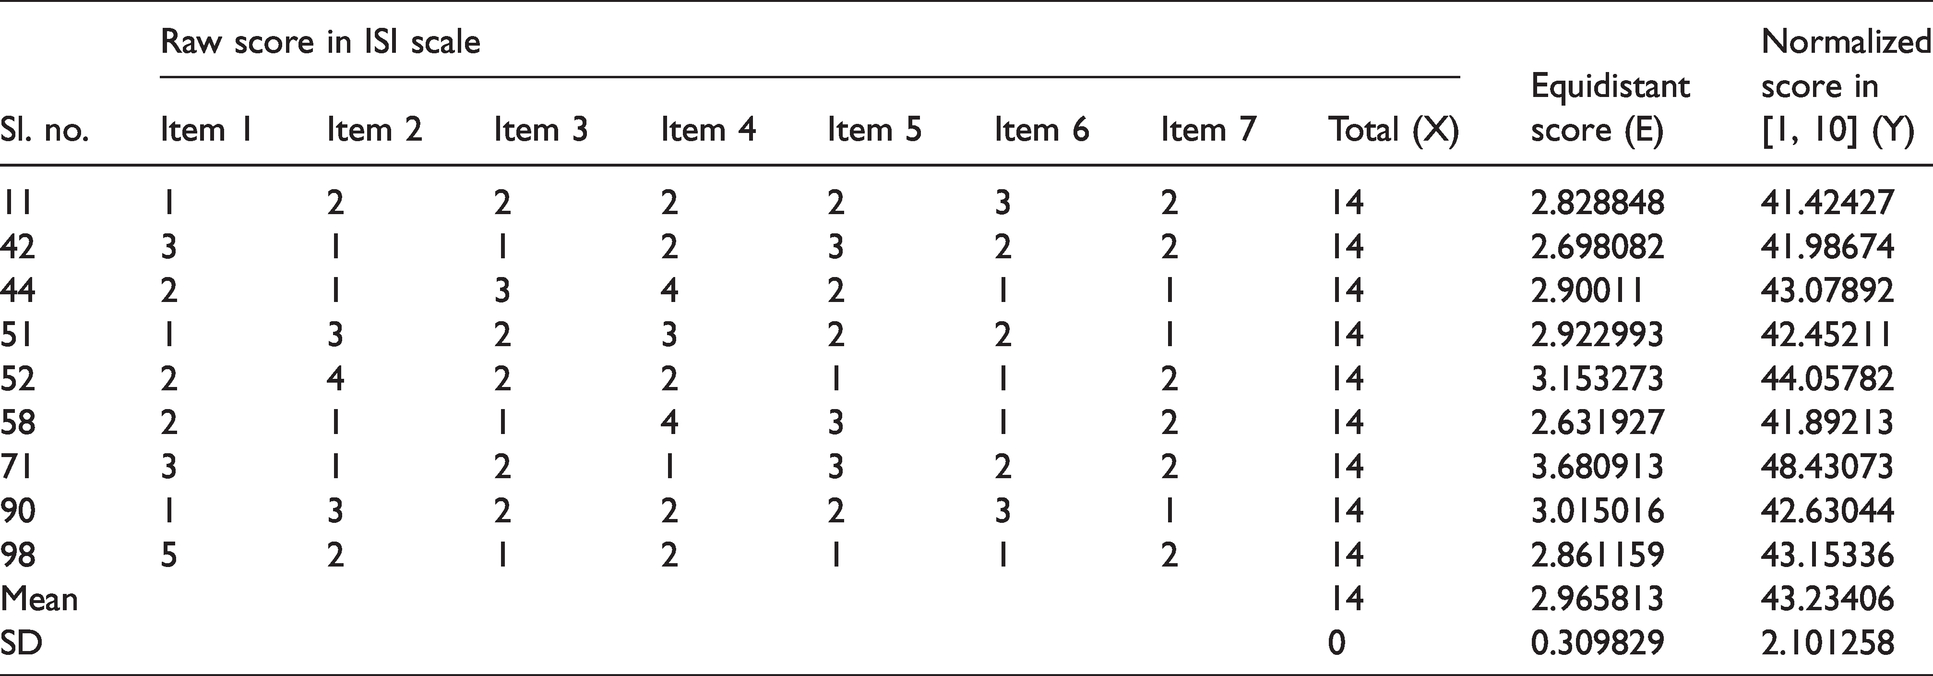
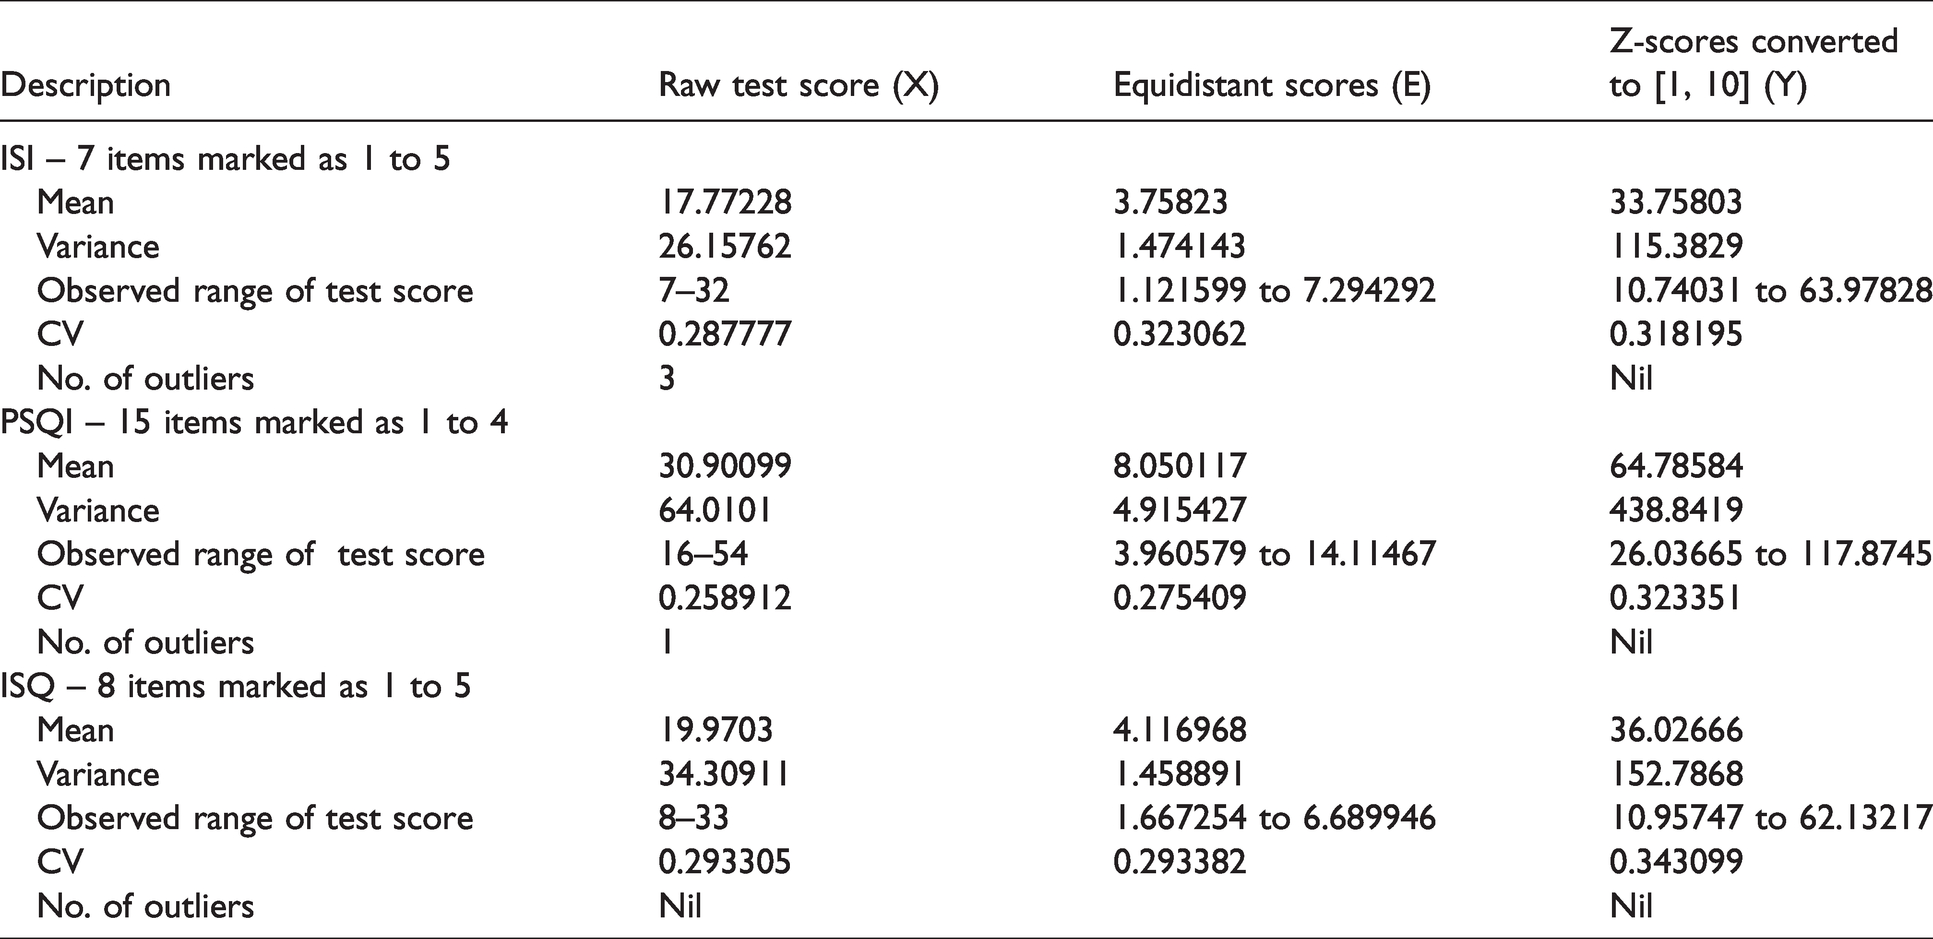
Descriptive statistics of test scores.
Observations:
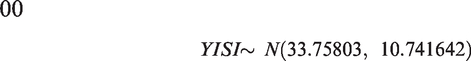
Mean, variance of X and Y differed for scales with different number of items and k. E-score made the data homogeneous and reduced range of test score for each scale. Y-score had higher mean and variance than the X-scores for each scale and will increase further if score range is increased to say [1, 100] from [1, 10]. Variance (Y) was highest for PSQI due to higher number of items; despite lesser value of k. High variance (Y) indicates positive correlations between pair of items in each scale. CV(Y) i.e. SD per mean implying consistency, was marginally higher than CV (X) for each scale. CV(Y) fluctuated in an extremely narrow range, 0.32 (ISI) to 0.34 (ISQ). Almost equal CV indicates that number of response categories may not have much influence on variation about the mean for Y. Y-score of a scale had no outliers. But X-score of ISI and PSQI had 3 and 1 outliers respectively Unlike X and E, Y followed Normal distribution with estimated population parameters as follows:


Correlations
Weighted sum to get E from X resulted in marginal deviation from perfect correlation between X and E. However,
Correlation matrix between scales and number of independent factors.
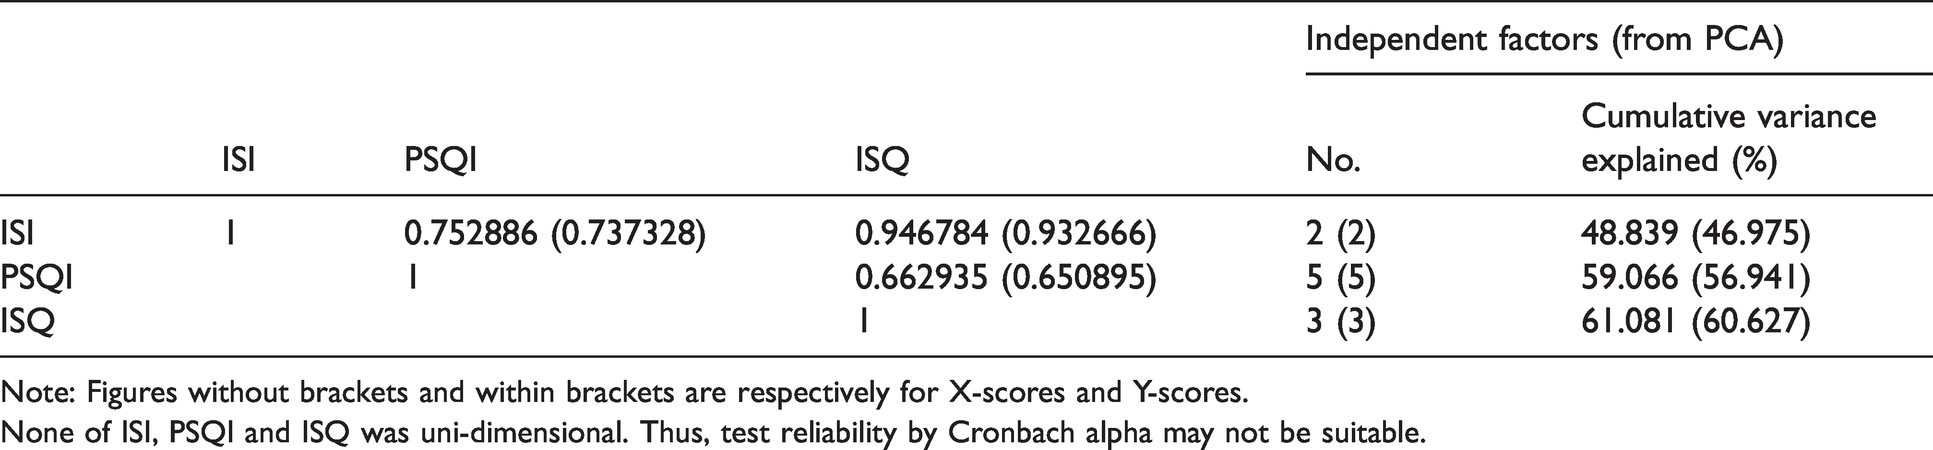
Note: Figures without brackets and within brackets are respectively for X-scores and Y-scores.
None of ISI, PSQI and ISQ was uni-dimensional. Thus, test reliability by Cronbach alpha may not be suitable.
Classification
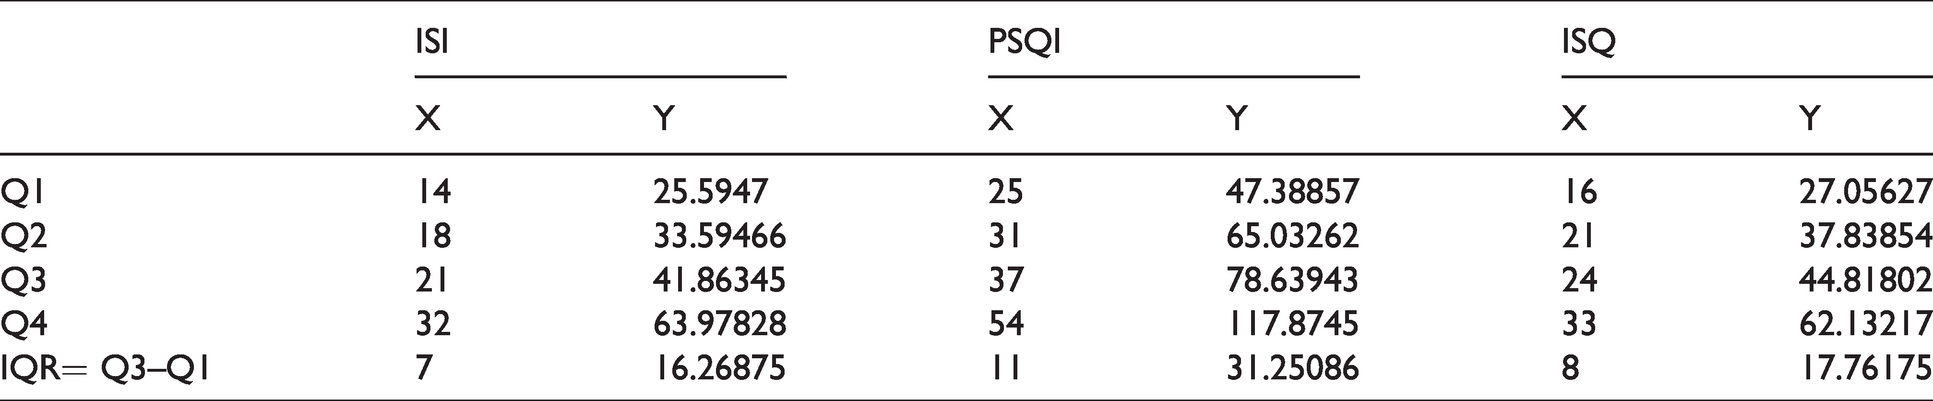
The sample was classified into four classes (Quartiles) based on X and Y separately for each scale. Results are given in Table 6.
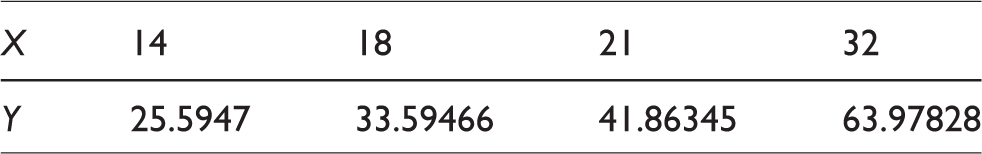
Quartiles and boundary values.
Observations
Higher value of IQR for Y is due to higher spread of the Y.
Maximum IQR for Y of PSQI is due to maximum SD of
Quartiles of a scale considering X differed from the same with respect to Y. For example, for ISI, number of persons under
Unique ranks to individuals in Y-score.
Equivalent scores
For a given value of
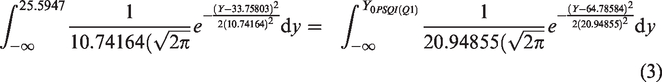
Following similar procedure, equivalent scores for quartiles were found and shown in Table 7.
Equivalent test scores for quartiles.
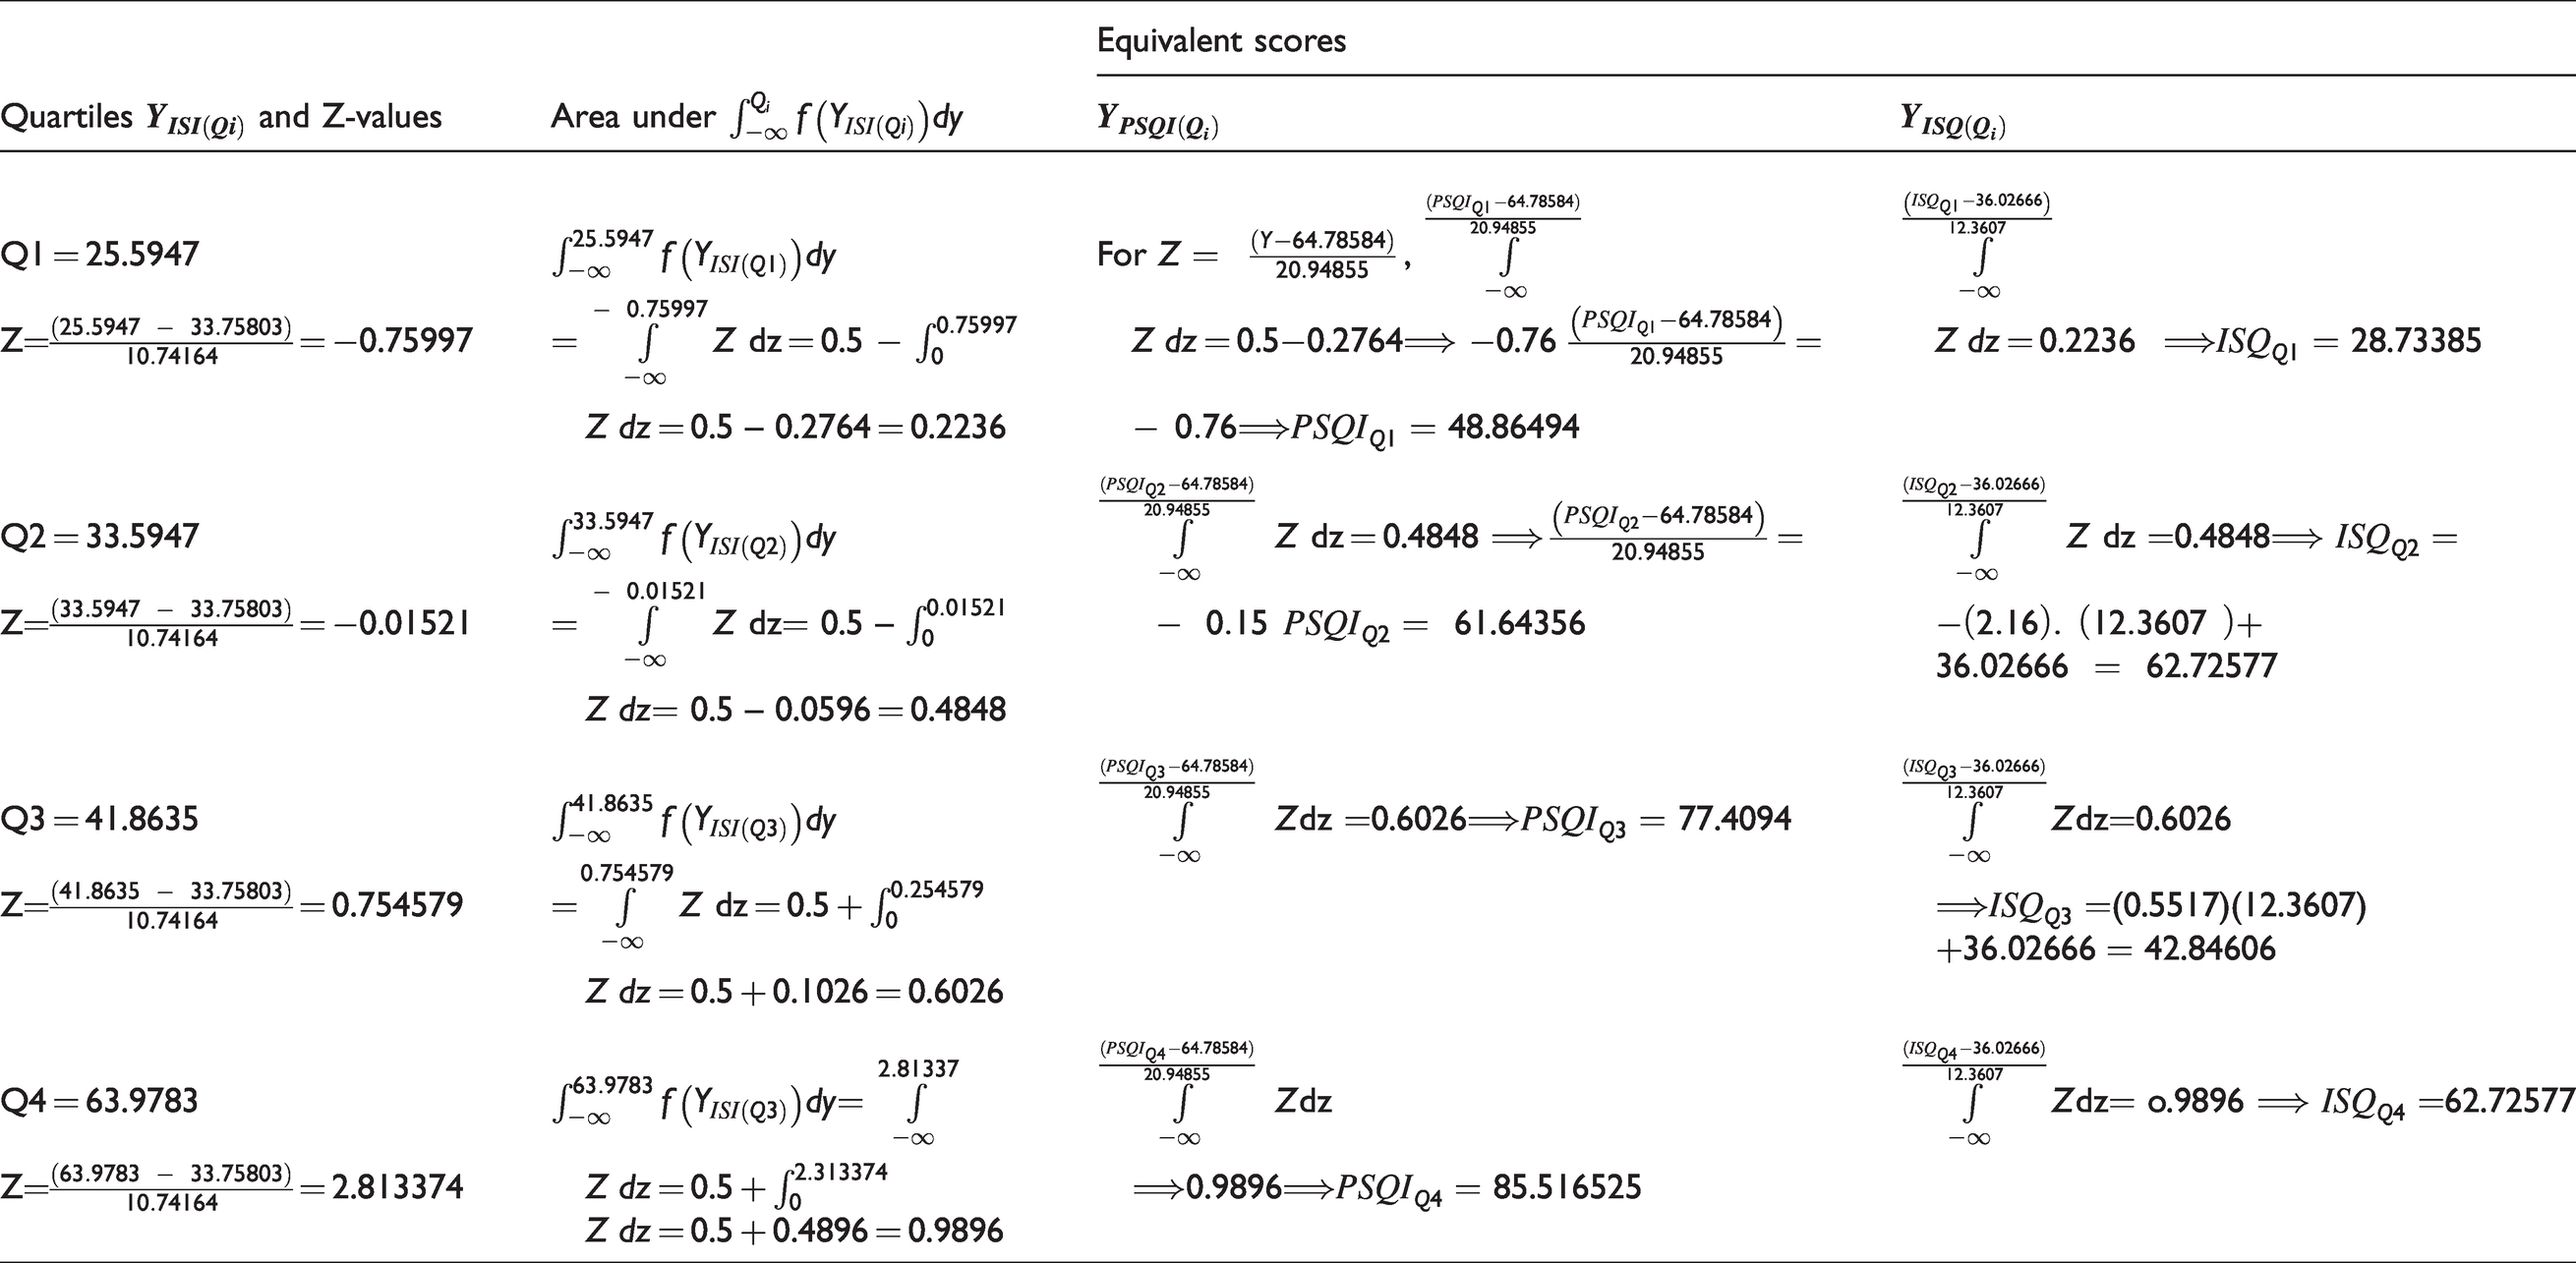
Clearly, equivalent quartile score of
The above table showing equivalent scores of the three scales are illustrative. Each Y-score of a scale following normal distribution has one-to-one correspondences with equivalent scores of other scales following Normal with different parameters. In other words, for the i-th individual,
Y-scores (with zero ties) of each scale was arranged in increasing order as per alternate easier approach avoiding integration and probability table of N (0, 1). Scores of the i-th person of the scales i.e.
Conclusions
The paper proposes a method of transforming discrete raw scores (
Alternate easier approach of arranging Y-scores of each scale in increasing order to find quickly equivalent scores, established
Correlation between a pair of such equivalent scores exceeded 0.99.
Y-score can be used for better ranking and classifying the individuals in the sample with respect to insomnia severity. Moreover, normality helps to undertake statistical analysis under parametric set up. The proposed approach of integrating Likert items with different number of response categories for different insomnia scales are critically relevant to practitioners and researchers in social sciences in general and epidemiological research in particular. Use of such methods of integrating several insomnia scales using Likert items is recommended for clear theoretical advantages and easiness in calculations. Future studies may be undertaken with multi-data sets along with issues relating to reliability and validity of the proposed transformation.
Footnotes
Declaration of Conflicting Interests
The author(s) declared no potential conflicts of interest with respect to the research, authorship, and/or publication of this article.
Funding
The author(s) received no financial support for the research, authorship, and/or publication of this article.