
Abstract
The performance of a biomarker is defined by how well the biomarker is capable to distinguish between healthy and diseased individuals. This assessment is usually based on the baseline value of the biomarker; the value at the earliest time point of the patient follow-up, and quantified by ROC (receiver operating characteristic) curve analysis. However, the observed baseline value is often subjected to measurement error due to imperfect laboratory conditions and limited machine precision. Failing to adjust for measurement error may underestimate the true performance of the biomarker, and in a direct comparison, useful biomarkers could be overlooked. We develop a novel approach to account for measurement error when calculating the performance of the baseline biomarker value for future survival outcomes. We adopt a joint longitudinal and survival data modelling formulation and use the available longitudinally repeated values of the biomarker to make adjustment of the measurement error in time-dependent ROC curve analysis. Our simulation study shows that the proposed measurement error-adjusted estimator is more efficient for evaluating the performance of the biomarker than estimators ignoring the measurement error. The proposed method is illustrated using Mayo Clinic primary biliary cirrhosis (PBC) study.
Keywords
Introduction
Due to current trends in medical practice towards personalised medicine, biomarkers have grown in importance in clinical studies. More and more studies are conducted to discover biomarkers that can accurately signal a clinical endpoint, e.g. measures of liver function such as prothrombin index as indicators of liver fibrosis, 1 and in clinical practice, rapid tests of biomarkers hold the promise of prompt diagnosis of diseases for an improved outcome, e.g. sepsis. 2 In this article, we refer the term “biomarker” to a single biomarker such as prothrombin index or to a composite risk score. A good biomarker can help identify patients who will have an early clinical benefit from a treatment or effectively guide the choice of therapeutic decisions, improving patients survival. However, due to imperfect laboratory conditions such as operator error, contamination, variable storage conditions, and limited machine precision, biomarkers are often subjected to substantial error in studies. 3 Failing to adjust for such measurement error may hinder the explanatory power of the biomarker, and in a direct comparison, useful biomarkers could be overlooked due to measurement error.4,5
The performance of a biomarker is based on how well the biomarker is capable of discriminating between individuals who experience the disease onset (cases) from individuals who do not (controls). It is usually quantified by receiver operating characteristics (ROC) curve analysis, a well-established methodology in medical diagnostic research. 6 The area under the ROC curve (AUC) is an effective way to summarise the discriminative capability of the biomarker. AUC takes values from 0 to 1, and a biomarker with high AUC is considered better. A single biomarker value at baseline is mainly used in this assessment. Baseline time is an important time horizon in practice, as it is considered as the earliest time point of the patient follow-up time and provides the time base to assess the disease progression. However, individuals who are free of disease at baseline may develop the disease later in the follow up, and therefore, the assumption of fixed disease status over time may not be appropriate when evaluating the biomarker performance. Hence, incorporating the time dimension in ROC curve analysis has recently been actively researched, enabling better clinical guideline in medical decision based on biomarkers. The time-dependent ROC curve is usually derived from risk regression models such as Cox proportional hazards model as they naturally account for censored failure times. This ROC curve estimates the performance of baseline biomarker at future time points. For example, in a breast cancer study, time-dependent ROC curve was used to assess whether the patients are free from subclinical disease if the clinical disease does not emerge by two years of screening. 7 It has also been used to assess the predictive ability of the gene expression signatures in detecting early tumour response among metastatic colorectal cancer patients. 8 Lu et al. 9 identified a robust prognostic biomarker for tumour recurrence among lung cancer patients using time-dependent ROC curve analysis by estimating the AUC of the 51-gene expression signature at 60 and 100 months of follow-up. Using time-dependent AUC, Chen et al. 10 made direct comparison of five recently recognised serum biomarkers and identified those can be recommended for use in clinical practice to surveillance of cirrhosis for hepatocellular carcinoma patients. A comprehensive review of current time-dependent ROC curve analysis approaches is provided by Kamarudin et al. 11 However, Faraggi, 12 Reiser 13 and others concerned about ignoring the measurement error of biomarker values in ROC methodology, and showed that the effect can be substantial on the decision as to the diagnostic effectiveness of the biomarker.
As discussed by Henderson et al.
14
and many others, a framework such as joint longitudinal and failure-time outcome modelling is capable of avoiding biases not only due to informative missingness in biomarker measurement schedule, but also due to measurement error. In a joint model, both longitudinally repeated biomarker and censored failure-time processes is modelled simultaneously. This novel modelling framework has rapidly been developed in the past decade (see Gould et al.
15
and Tsiatis and Davidian
16
for comprehensive reviews of the model). Many have adopted or extended this framework to investigate the association between the biomarker and the hazard of failure (e.g.
17
), or to derive risk predictions (e.g. Proust-Lima and Taylor,
18
Garre et al.
19
). However, adopting the joint models for estimation of diagnostic effectiveness of a biomarker has been limited. Kolamunnage-Dona and Williamson
20
used joint modelling framework to evaluate time-dependent discriminative capability of a biomarker within the ROC curve analysis. In other studies, ROC curve has been used to evaluate the accuracy of the predicted survival probabilities from the joint model (e.g. Rizopoulos
21
). Henderson et al.
22
has parameterised the underling association between longitudinal biomarker and failure-time processes by individual-level deviation of the longitudinal profile from the population mean, but
According to our review, 11 measurement error of the biomarker has been ignored in all current time-dependent ROC curve approaches. And, to our knowledge, joint modelling framework has not been adopted to make adjustment for measurement error when evaluating the performance of the biomarker in ROC curve analysis. As its main contribution, this article provides a new development of time-dependent ROC curve to evaluate the performance of baseline biomarker correcting for the measurement error. We propose to utilise a joint model to link the baseline biomarker and failure-time process, and use the individual-level deviation of the biomarker from the population mean to develop an estimator to evaluate the time-dependent ROC curve. In health research, often biomarkers are recorded longitudinally as patients are followed up over time, and we use available longitudinal measurements of the biomarker to make adjustment of the measurement error in our proposed approach. By incorporating the longitudinally repeated biomarker measurements, we make the most efficient use of the data available.
General notation
Let
Estimation of measurement error-adjusted estimator of baseline biomarker
Firstly, we formulate the joint model. A joint model is usually consisted of two submodels; a submodel for longitudinal measurements of the biomarker
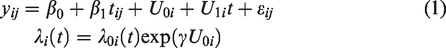
We can estimate the model by maximising the joint likelihood of the observed data via the Expectation-Maximization (EM) algorithm.5,11 The EM algorithm involves taking expectations with respect to the unobserved random effects
Secondly, based on the estimated values, we can compute measurement error-adjusted estimator based on the linear predictor of the failure-time submodel by

Estimation of the time-dependent ROC curve at future time horizons
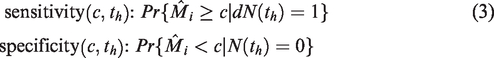
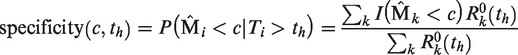
We need to define the cases and controls at time future time points
Finally, we can assess the discriminatory potential of the measurement error-adjusted estimator

Bansal and Heagerty
25
have also used the same incident/dynamic failure-times definition when there exists time-specific cases of interest at a particular time
In the proposed approach,
Simulation investigations
We have conducted three simulation investigations to demonstrate whether the proposed approach is an appropriate framework for estimating the time-dependent ROC curve. The details of data simulation and investigations are given in the supplementary file. Firstly, we explored the accuracy of estimation of association parameter
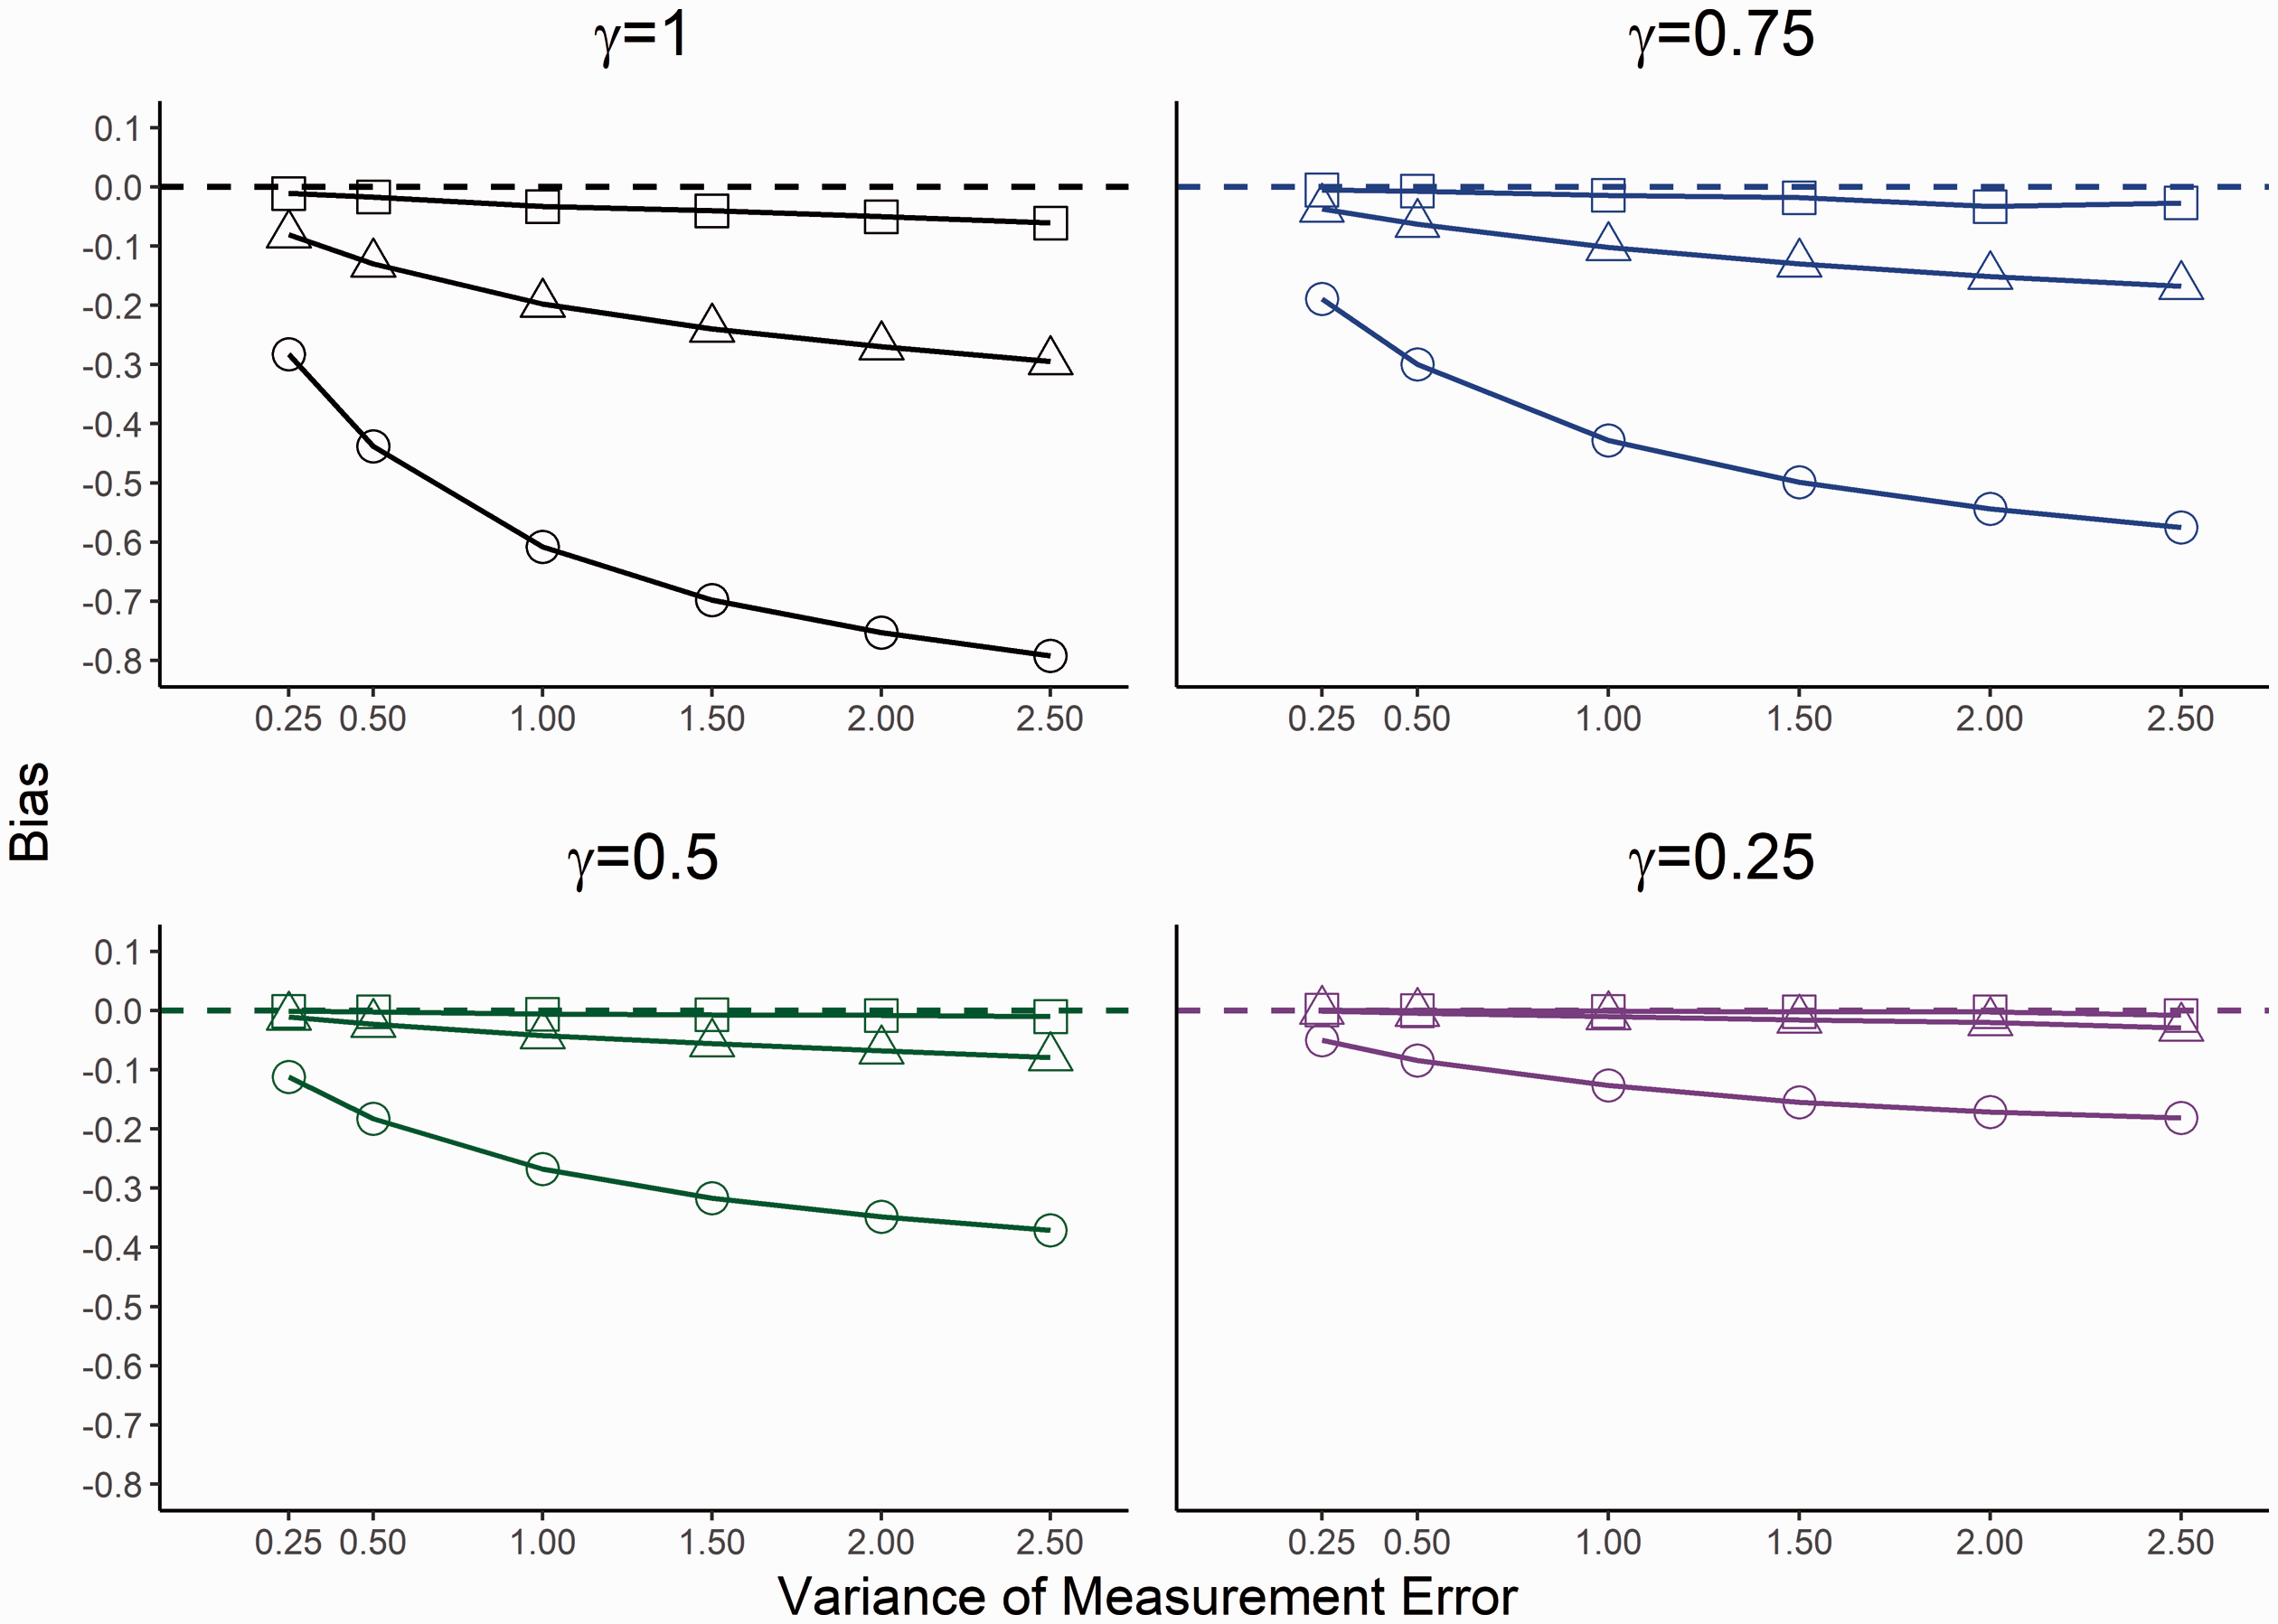
Bias for estimated association when censoring is 30%. Square indicates the estimated association from the proposed joint model, circle the Cox model with observed baseline value and triangle the estimated random intercept term from the LME model. The horizontal dashed line indicates no bias.
Secondly, we evaluated how the proposed measurement error-adjusted estimator
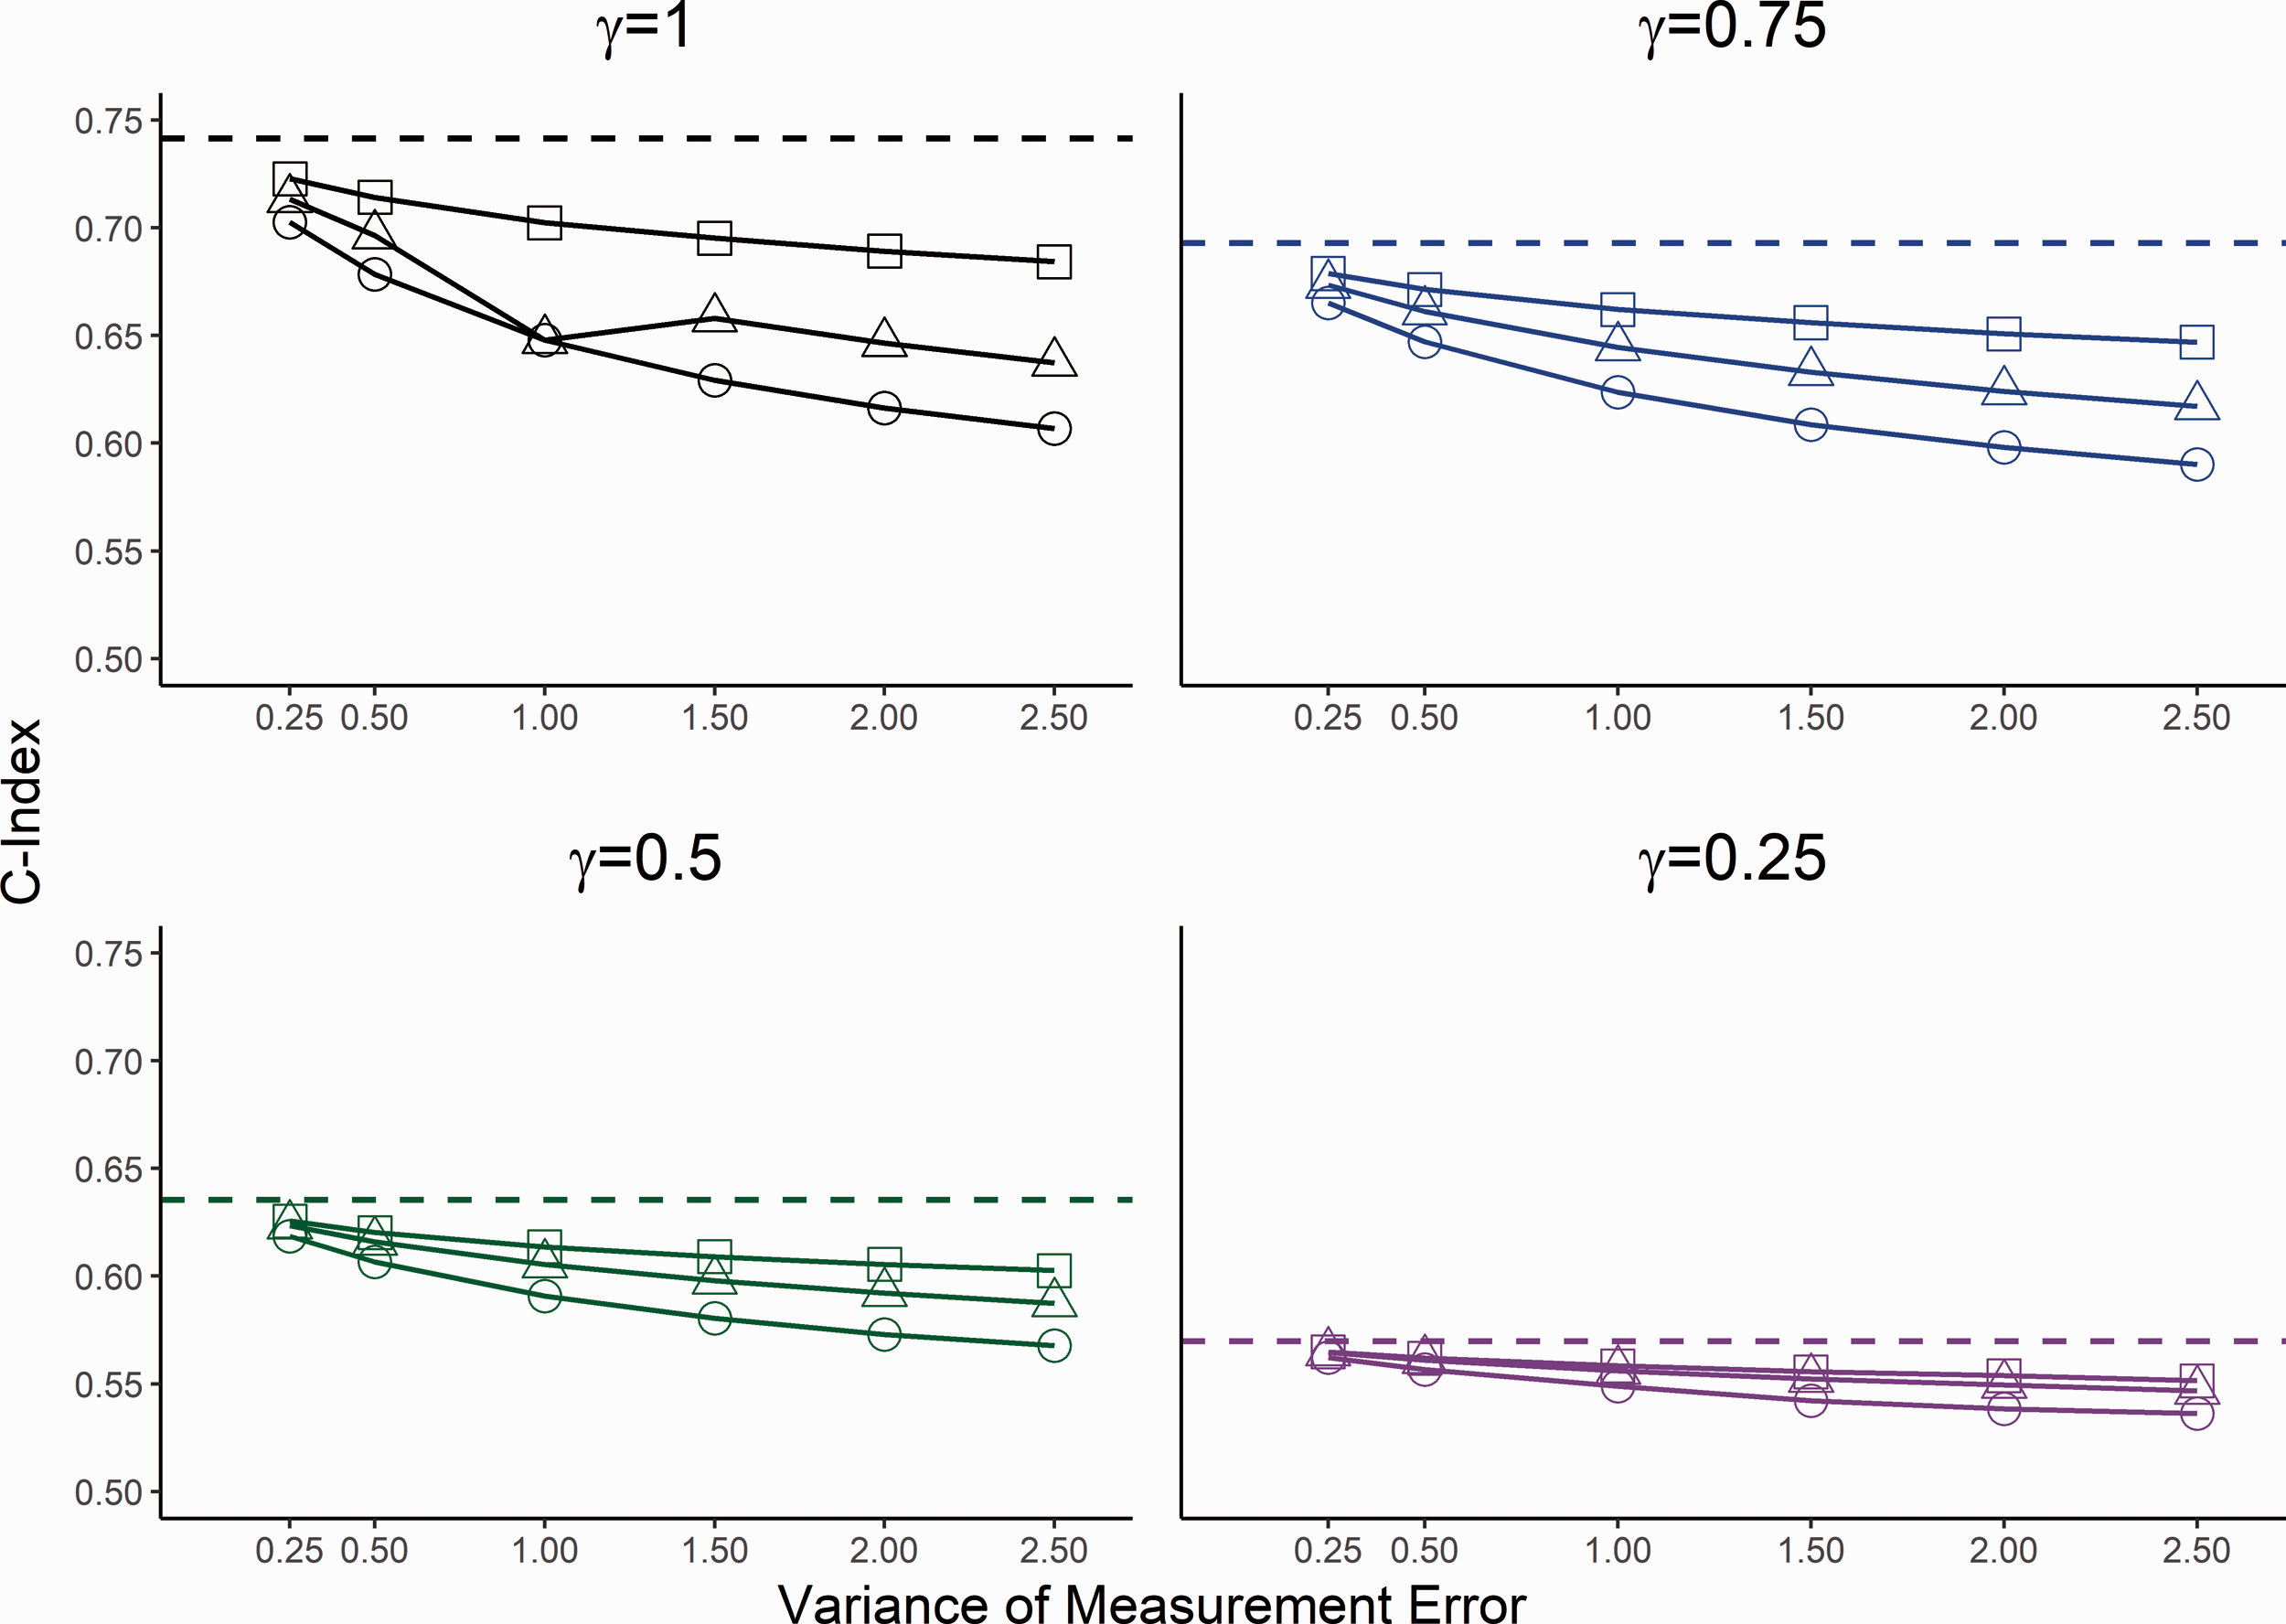
Estimated C-Index for 30% censoring. Square indicates the estimated value from the proposed measurement adjusted model, circle the Cox model with observed baseline value and triangle the estimated random intercept term from the LME model. The horizontal dashed line is the true C-index for corresponding association parameter.
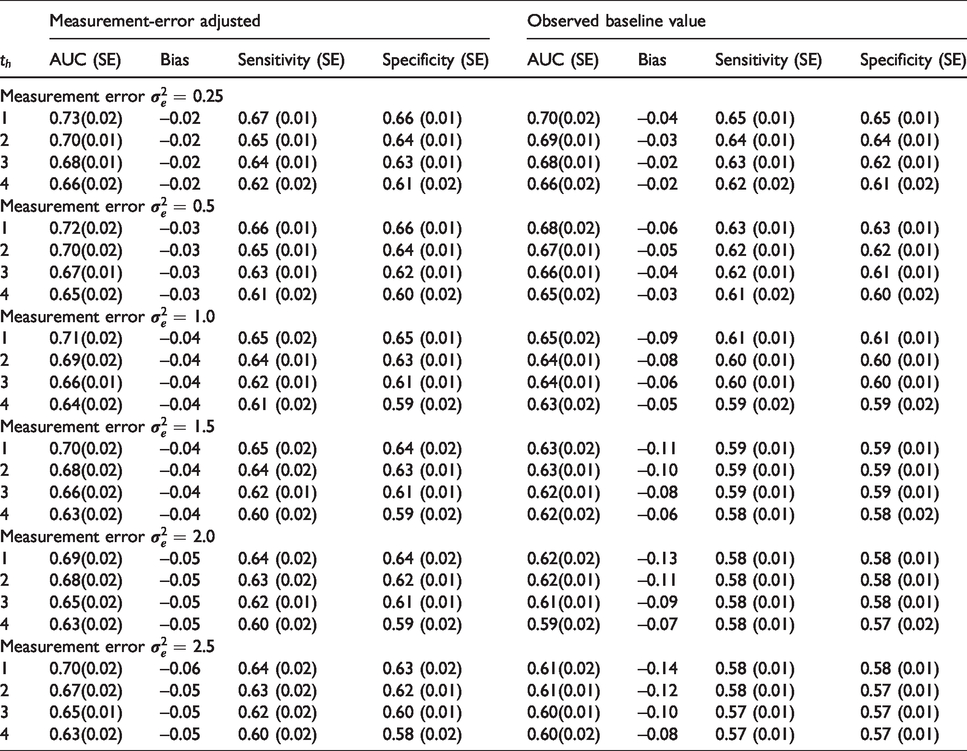
Finally, the accuracy of the time-dependent ROC curve was further evaluated by comparing the estimated AUC
Time-dependent AUC (Standard Error, SE) and Bias at
Application: Mayo Clinic primary biliary cirrhosis (PBC) study
We apply the proposed approach to the data from the Mayo Clinic trial in primary biliary cirrhosis (PBC) of the liver conducted between 1974 and 1984. PBC is a fatal, but rare liver disease. If PBC is not treated, and reaches an advanced stage, it can lead to several major complications, including death. The trial randomised 312 patients between D-penicillamine (n = 158) for the treatment of PBC and placebo (n = 154).
30
Among the 312 patients randomised, 125 died during the follow-up. Although the study established that D-penicillamine is not effective for the treatment of PBC, the data have been used to develop clinical prediction models, and has been widely analysed using joint modelling methods.31–34 Patients with PBC typically have abnormalities in several blood tests; hence, during the study follow-up several biomarkers associated with liver function were serially recorded for these patients. In this article, we considered three biomarkers: serum bilirubin (measured in units of mg/dl), serum albumin (mg/dl), and prothrombin time (seconds) with the aim of assessing the performance of each biomarker at the baseline level for patient survival. The available longitudinal measurements of each biomarker were used to correct for measurement error. As the proposed modelling framework assumes Gaussian random effects and errors, the bilirubin measurements were log-transformed and the prothrombin time were transformed by (0.1
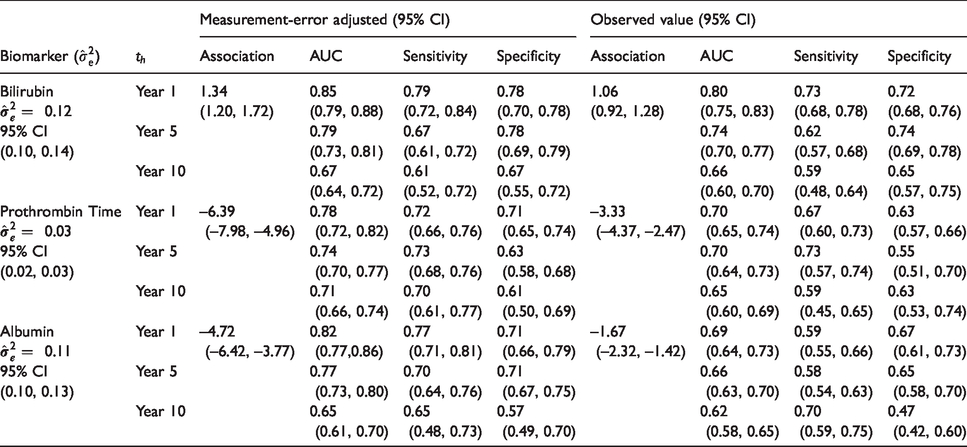
Table 2 shows the estimated time-dependent AUC, sensitivity and specificity at times
Time-dependent AUC, sensitivity and specificity (at the corresponding optimal threshold) at
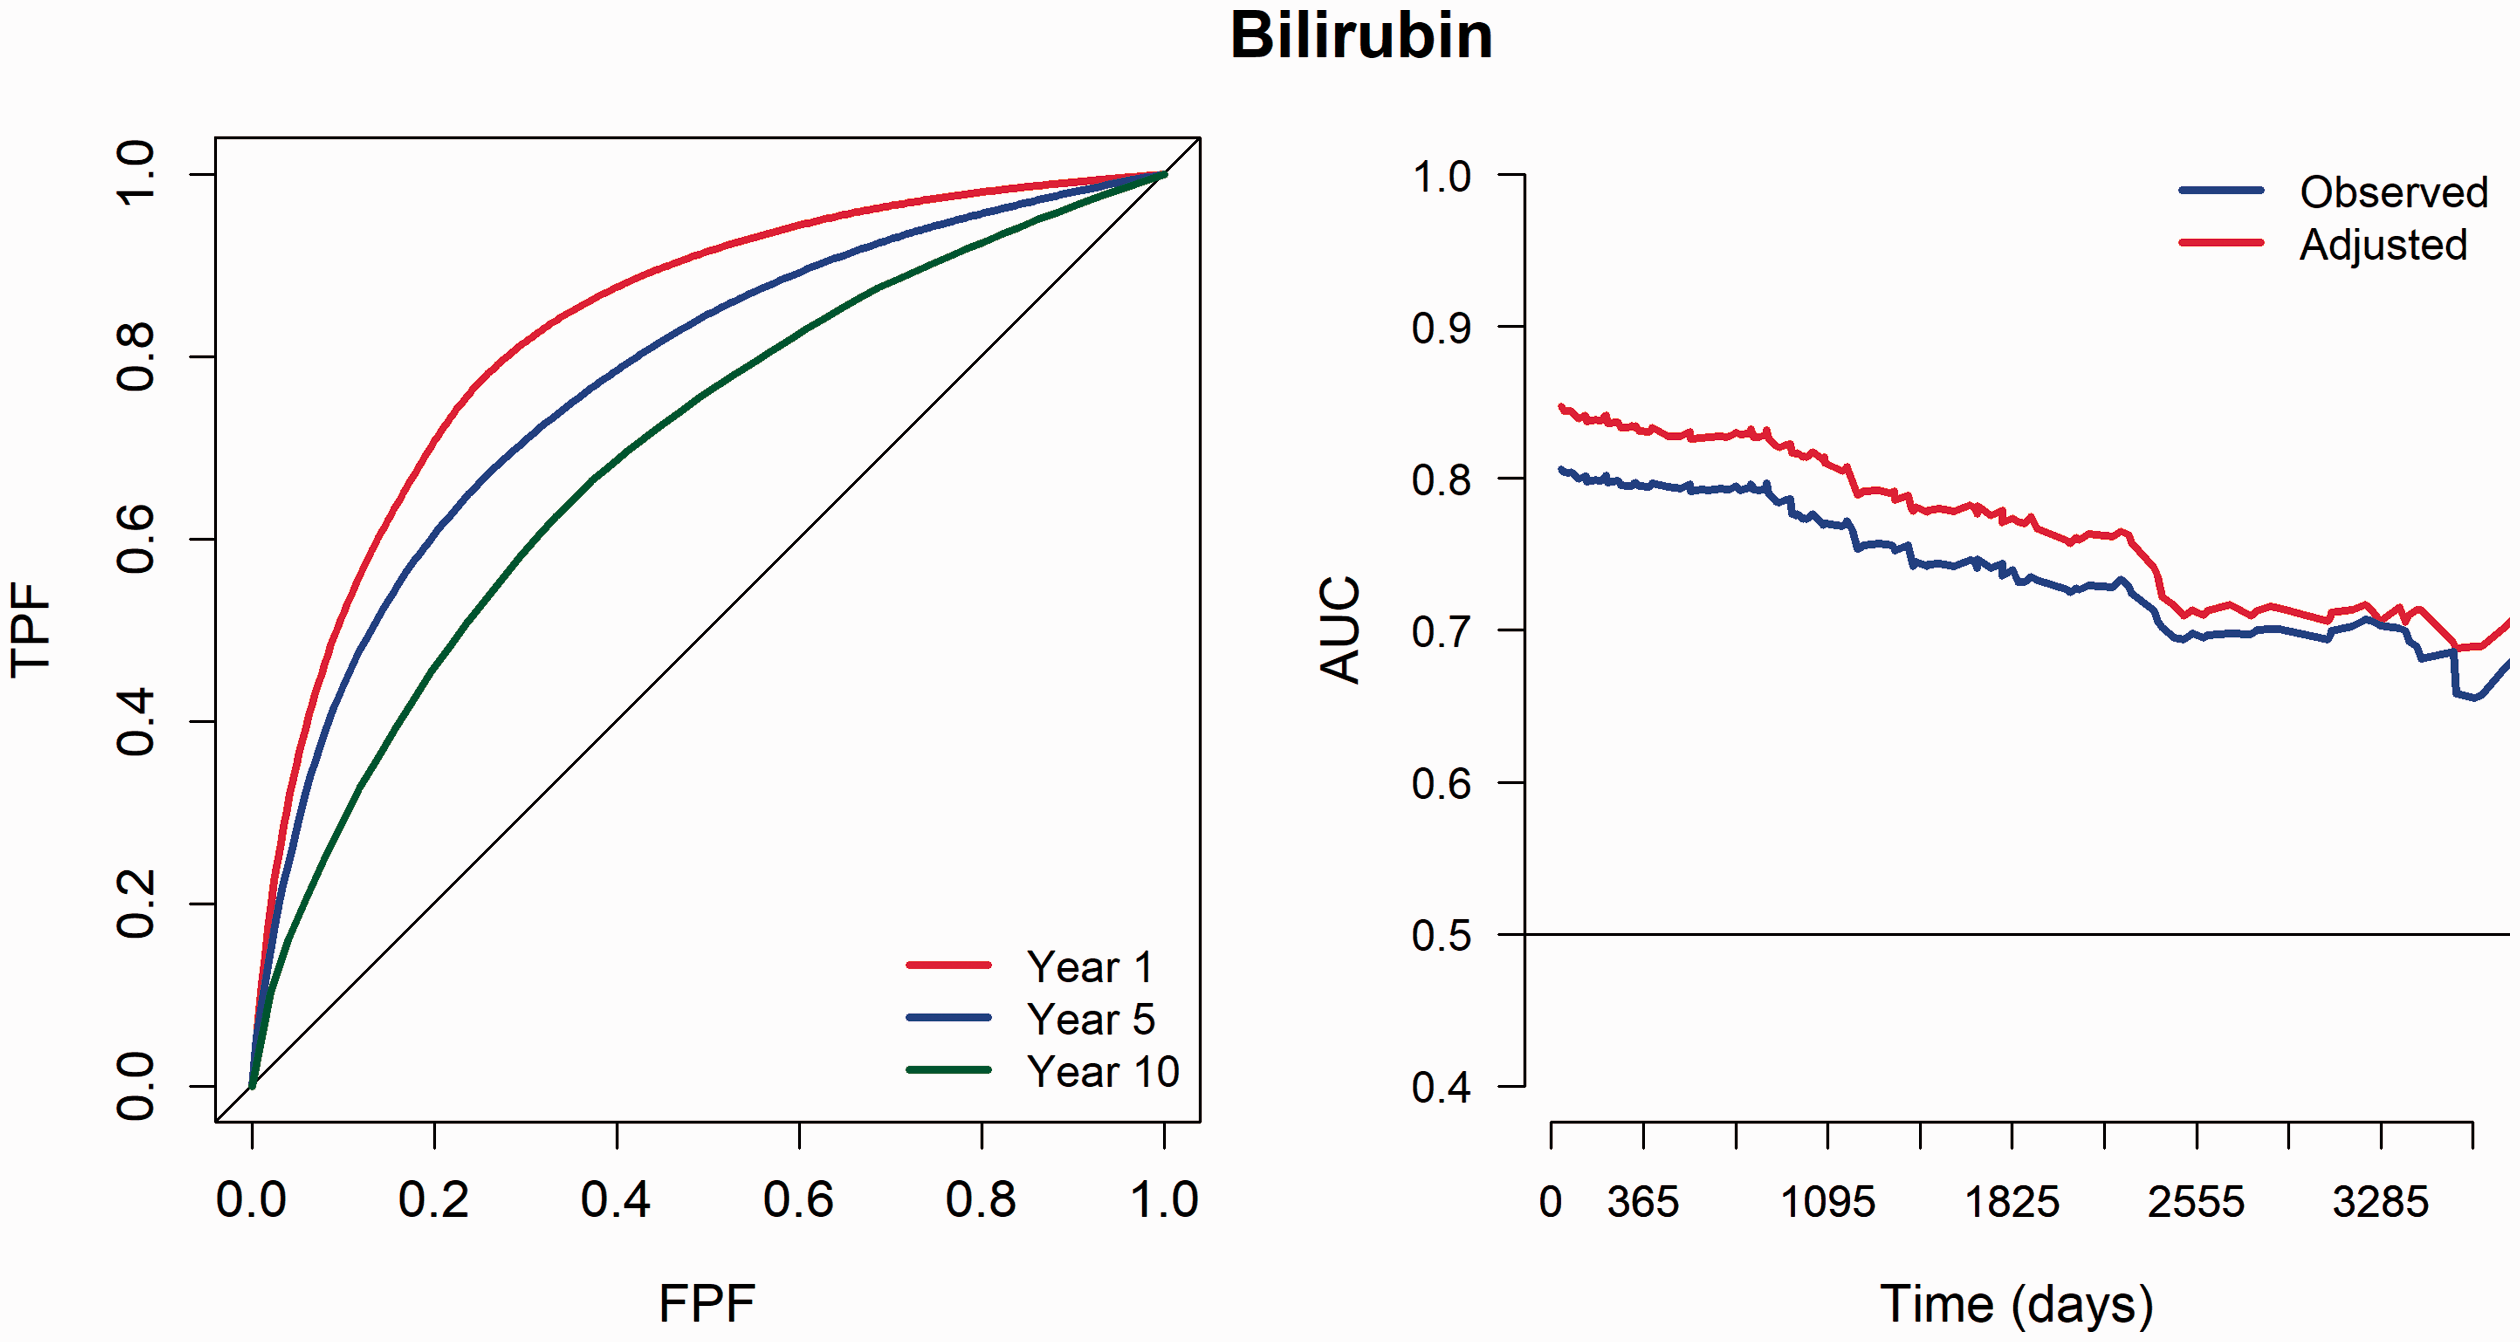
PBC data – ROC(t) curves (left) and time dependent AUC over the progression of time (right) for serum bilirubin.
Discussion
The focus of this article was to develop a novel methodology for evaluating time dependent performance of the baseline biomarker correcting for measurement error. We proposed a novel utility of the joint modelling framework within the theory of time-dependent ROC curve analysis by developing a more efficient estimator that links the risk of failure and baseline biomarker. The baseline is an important time point as the biomarker value at baseline can serve as the earliest indicator of a potential future adverse clinical event (e.g. death). We have shown from our simulation investigations that measurement error could cause a severe bias in estimating the association between the baseline biomarker and risk of failure event. Although, this has been investigated in joint modelling literature in relation to various specifications of the model, this study was the first to show that observed baseline value could severely underestimate the true discriminative capability of the biomarker as estimated by AUC. Our simulation investigations proved that the proposed methodology effectively corrects for a moderate measurement error when calculating the performance of the baseline biomarker over time.
A similar joint model specification was suggested by Crowther et al. 35 to predict survival for new patients. In their model, association was defined on the current biomarker value rather than the individual-level deviation, and restricted cubic splines were used to define the longitudinal biomarker while failure-time assumes a parametric distribution. This level of complexity is necessary to model highly nonlinear biomarker trajectories over time, and to capture complex baseline hazards when predicting the future survival probabilities. However, our aim was to quantify the true discriminant capability of the baseline biomarker at future time points, and a more classical modelling and estimation framework has been proven sufficient from our thorough simulation study. To facilitate the use of the methods in practice, software is written in R language (which is a free software environment). The proposed approach can be implemented with a relatively low computational burden; for example, in our application dataset with 312 patients, the proposed joint model for each biomarker took under 1 minutes to converge on a standard desktop computer, and the time-dependent AUCs were derived in few seconds.
More recently, quantities such as proportion of information gain (PIG) have been proposed to measure the importance of a biomarker. Li and Qu 36 adjusted for the measurement error in calculating the PIG for continuous, binary and failure-time outcomes. However, our focus in this article was to account for the measurement error of a more familiar and well established quantity among the medical research community. We proposed a computationally simple approach to estimate the true time-dependent ROC curve for a baseline biomarker subjected to measurement error. Although information from longitudinally repeated measurements is required for the proposed approach in addition to the single biomarker measurement at baseline, often in clinical studies, longitudinal measurements are recorded alongside the main study as secondary outcomes, e.g. to monitor the progression of a disease. Therefore, the prospects of utilising the proposed framework to detect the true performance of biomarkers is quite substantial.
The proposed ROC curve approach can be extended to incorporate multiple biomarkers by utilising multivariate joint models (e.g. Hickey et al. 34 ). In our application, we evaluated the measurement error-corrected performance of three biomarkers in separation for the survival of PBC patients. It may be of interest to assess the performance in a combination of biomarkers, as in many diseases it is unlikely that a single biomarker will ever be more effective due to complexity of the disease (e.g. Aerts et al. 37 ).
Supplemental Material
sj-pdf-1-rmm-10.1177_2632084320972257 - Supplemental material for Adjustment for the measurement error in evaluating biomarker performances at baseline for future survival outcomes: Time-dependent receiver operating characteristic curve within a joint modelling framework
Supplemental material, sj-pdf-1-rmm-10.1177_2632084320972257 for Adjustment for the measurement error in evaluating biomarker performances at baseline for future survival outcomes: Time-dependent receiver operating characteristic curve within a joint modelling framework by Ruwanthi Kolamunnage-Dona and Adina Najwa Kamarudin in Research Methods in Medicine & Health Sciences
Footnotes
Declaration of conflicting interests
The author(s) declared no potential conflicts of interest with respect to the research, authorship, and/or publication of this article.
Funding
The author(s) disclosed receipt of the following financial support for the research, authorship, and/or publication of this article: AK was supported by Malaysia government PhD studentship Majlis Amanah Rakyat Malaysia (MARA) during 2014–2018. This work was also partly supported by the Medical Research Council [grant number MR/M013227/1].
Supplemental material
Supplemental material for this article is available online.
References
Supplementary Material
Please find the following supplemental material available below.
For Open Access articles published under a Creative Commons License, all supplemental material carries the same license as the article it is associated with.
For non-Open Access articles published, all supplemental material carries a non-exclusive license, and permission requests for re-use of supplemental material or any part of supplemental material shall be sent directly to the copyright owner as specified in the copyright notice associated with the article.