
Abstract
Background:
Some glioblastoma multiforme (GBM) are characterized by the presence of gemistocytes (GCs), a unique phenotype of reactive astrocytes. Certain GCs can be identified as neoplastic cells but these cells were also found to be associated with diabetes in non-neoplastic lesions of the central nervous system. Our aim was to find a correlation between insulin - resistance metabolic features and the presence of GCs in patients with newly diagnosed GBM.
Methods:
Medical records from histologically confirmed GBM patients were retrospectively extracted for different systemic metabolic variables. A statistic-based comparison was made between GBM, diabetic patients with and without GC. Patients with poorly controlled diabetes (ie, hemoglobin A1C ⩾ 8.0) were also compared between the 2 groups.
Results:
A total of 220 newly diagnosed GBM patients were included in our study. 58 (26.3%) patients had a history of diabetes mellitus type 2 (DM2) at the time of admission. The rate of poorly-controlled DM2 was nearly as twice in the GC-GBM group than in the non-GC GBM group (18.75% vs 9.5%; P = .130). In the DM2 cohort, the subgroup of GC-GBM was significantly associated with demographic and metabolic features related to insulin resistance such as male gender predominance (89% vs 50%, P = .073) and morbid obesity (weight ⩾85 kg: OR 6.16; P = .0019 and mean BMI: 34.1 ± 11.42 vs 28.7 ± 5.44; P = .034 for group with and without GCs, respectively). In the poorly-controlled DM2 group, none of the GC-GBM patients were using insulin prior to diagnosis, compared to 61.1% in the non-GC GBM patients (OR = 0.04, P = .045).
Conclusion:
Systemic metabolic factors related to marked insulin resistance (DM2, morbid obesity, male gender) are associated with a unique histologic phenotype of GBM, characterized by the presence of GCs. This feature is prominent in poorly-controlled DM2 GBM patients who are not using synthetic insulin. This novel finding may add to the growing data on the relevance of glucose metabolism in astrocytes and in astrocytes associated with high-grade gliomas. In GBM patients, a correlation between patients’ metabolic status, tumor’s histologic phenotype, tumor’s molecular changes, use of anti-diabetic drugs and the respective impact of these factor on survival warrants further investigation.
Introduction
Gemistocytes (GCs) are a subset of astrocytic cells, microscopically characterized by a swollen appearance with hyaline, pink cytoplasm that stains positive for glial fibrillary acidic protein (GFAP). Their hyperchromatic and angulated nuclei are displaced within the cell bodies, producing a bizarre caricature of a reactive astrocyte. 1 GCs can appear in diverse primary central nervous system (CNS) tumors, with gemistocytic astrocytomas (GA) being the histopathological hallmark of a subgroup of low-grade gliomas, termed gemistocytic gliomas. GA are categorized as grade 2 diffuse gliomas and are the only subset of gliomas for which a gemistocytic variant is officially defined by the world health organization (WHO). 2 Accordingly, most published data on GCs in CNS tumors is focused on GA, which is a relatively rare tumor type. 3 In grade 2 diffuse gliomas, the presence of GCs is a prognostically ominous sign,4 -6 with evidence supporting the notion that these tumors are prone to a more rapid progression to anaplastic astrocytomas or glioblastomas. On the other hand, data on GCs in high grade gliomas (HGG) is scarce, mostly in regard to their pathogenesis and prognostic significance.
Glioblastoma multiforme (GBM) is the most common and the highest-grade astrocytoma (WHO grade 4). 2 Despite advances in diagnosis and treatment, GBM remains incurable with an average overall survival of 15 months, and a 2-year survival rate and a 5-year survival rate of <20% and <5%, respectively. 7 GCs can be found in GBM, and this association is usually described in the context of malignant progression of GA 6 and in young adults (<30 years old), where up to 75% of isocitrate hydrogenase (IDH)-mutant, grade 4 astrocytomas had microcystic features or gemistocytic tumor cells. 8
Over the last 2 decades, only a handful of studies have tried to characterize the histologic variant of gemistocytic GBM (GC-GBM) in adults,9 -11 including a possible association with some unique radiological and molecular features and prognostic implications. 12 Nevertheless, it remains unknown why this specific type of reactive astrocytes can be found in a small portion of newly diagnosed GBM and what the pathophysiological relevance of this observation is. Are these GC a consequence of rare alterations in the tumor’s microenvironment or do they represent systemic changes that affect the phenotype of astrocytes in GBM?
Cumulative data suggests that hyperglycemia and diabetes mellitus type 2 (DM2) may affect the metabolism of astrocytes. In retinal astrocytes, high glucose levels were associated with changes in intracellular signaling pathways involved in cell survival, migration and proliferation, resulting in alterations in the phenotype of astrocytes. 13 In addition, abundant GCs were found in cases of Hemichorea-hemiballism (HCHB) associated with nonketotic hyperglycemia. 14 A biopsy of a putaminal lesion from a hyperglycemia-related HCHB patient revealed a fragment of gliotic brain tissue with abundant GCs on microscopic examination.15,16 Based on this observation, it is possible to speculate that the presence of GCs in GBM is affected by the systemic metabolic status of the patient. Specifically, this pathological feature may be related to sustained hyperglycemia and/or to poorly-controlled DM2 in the short period preceding the diagnosis of GBM.
Taken together, the aim of this study was to investigate a possible association between DM2 and the presence of GCs in newly diagnosed, adult GBM patients. We have suspected that accumulation of GCs in some GBM cases is related to a systemic metabolic state of uncontrolled hyperglycemia. To test this hypothesis, a comparison was made between 2 subgroups of DM2 GBM patients: one with (DM2 GC-GBM) and one without (DM2, non-GC GBM) GCs. Patient cohorts were analyzed in detail for various demographic, clinical, radiological, metabolic and molecular characteristics. Later, we analyzed subgroups of poorly controlled DM2 GBM patients (hemoglobin A1C ⩾ 8.0), again by comparing data from patients with and without GCs. In addition, a possible influence of metformin administration on overall survival (OS) of DM2 GBM patients, with and without GCs, was investigated. Lastly, the correlation between GCs, glycemic-related changes and prognosis implications in GBM patients is discussed in depth.
Material and Methods
This study was approved by the Institutional Review Board of Rabin Medical Center (0387-19-RMC) and conducted in accordance with ethical standards of the 1964 Helsinki Declaration and its later amendments. This retrospective study is based on the electronic medical records of newly diagnosed adult (aged >18 years) patients with histologically-proven GBM, treated at Rabin Medical Center (Tel Aviv University, Israel) between January 2010 and December 2019. Patients with a known past medical history of diffuse astrocytoma grade 2 or GA and patients with diagnosis of IDH-mutated GBM (based on previous WHO classification) were excluded. The medical records were reviewed and extracted for analysis of demographics (age at diagnosis, sex, weight, basic metabolic index); past medical history (hypertension, dyslipidemia, cardiac or neurologic ischemic event, DM, duration of DM, number and type of anti-diabetic drugs, most recent HbA1C and blood tests for triglycerides and cholesterol, calculated ratio of non-high-density lipoprotein (HDL) to HDL); clinical (duration of symptoms, type of surgery, post-surgery Karnofsky performance score (KPS), time until oncology treatment, type of adjuvant therapy, need for second surgery, progression free survival (PFS), overall survival (OS), radiologic (pre-operative tumor’s maximal cross sectional diameter, extent of resection) and pathological and molecular (presence of GCs, % of GCs, Ki-67 maximal levels, TP53, TERT, immunostaining and O 6 -methylguanine-DNA-methyltransferase (MGMT) methylation status) data.
Basic metabolic index (BMI) was calculated by patient’s weight in kilograms divided by the square of height in meters. BMI of 25 to 29.9 is considered overweight. BMI ⩾ 30 is considered obesity. HbA1c ⩾ 8.0 was regarded as poorly-controlled DM in accordance with accepted definitions. 17 Normal values for triglycerides (TG) and for non-HDL to HDL ratio are <150 mg/dl and <3.5, respectively. TP53 immunohistochemistry was considered positive at ⩾10% staining and was considered “strongly positive” at ⩾20% staining. Positive TP53 immunostaining is strongly correlated with p53 mutations. All patients underwent surgical intervention for their tumor. The diagnosis of GBM was made by an expert neuropathologist (F.S), based on established morphological and molecular criteria. 2 Pathological slides from cases containing description of GCs were reviewed to determine the percentage of GCs in each case. Patients with at least 5% of GCs were categorized as GC-GBM. All other cases were considered non-GC GBM. In the GC-GBM group, cases with ⩽20% GCs were considered low percentage GCs, while cases containing >20% GCs were defined as high percentage GCs. See Figure 1 for some representative pathological cases (Figure 1). Patients who were eligible for adjuvant treatment received either the Stupp et al 18 protocol or the “short” protocol. 19 Gross total resection (GTR) was defined as no enhancement on post-operative gadolinium enhanced T1-weighted MRI sequence (done within 48 hours from surgery). Progression-free survival (PFS) was defined as time from date of diagnosis to first radiological progression. Overall survival (OS) was defined as time from date of diagnosis to death (non-censored) or last follow up (censored).

H&E, X20. GBM samples showing areas with prevalent gemistocytes characterized by voluminous, homogeneous, milk-like cytoplasm with plump cell processes and an eccentric nucleus (arrows). The percentage of gemistocytes in each case was defined as follow: (a) <20%, (b) >20%, and (c) >80%.
Statistical Analysis
A statistically-based analysis was used in different subgroups of patients to find any relationship between the different DM2-related characteristics and the presence of GCs in GBM. Specifically, a comparison was made between patients assigned to GC-GBM (group 1) and non-GC GBM (group 2); GC-GBM with DM2 (group 1a) and GC-GBM without DM2 (group 1b); GC-GBM with DM2 (group 1a) and non-GC GBM with DM2 (group 2a); and GC-GBM with poorly-controlled DM2 (group 1c) and non-GC GBM with poorly-controlled DM2 (group 2c) (Figure 2).

Subgroups being used in the study: name of the group and number of patients in each subgroup. Subgroups used for statistical comparison: group 1 versus group 2, group 1a versus group 2a and group 1c versus group 2c. Abbreviations: DM2, diabetes mellitus type 2; GBM, glioblastoma multiforme; GC, gemistocytic; n, number.
Baseline patients’ and treatments’ characteristics were evaluated using descriptive statistics. Comparisons between groups were made using independent samples t-tests for continuous variables and contingency tables with Pearson’s chi-squared test and two-sided Fisher’s exact tests for categorical variables, respectively. A univariate logistic regression was used for calculation of odds ratio (OR) for variables found to have statistically significant differences. A 95% confidence interval for difference was used. Kaplan-Meier analyses were performed for overall survival. Differences between groups were evaluated using Mantel-Cox log-rank and Breslow tests. Two-sided P-values <.05 were considered significant. The relatively small cohort size has prevented us from performing a multivariate logistic regression. All statistical analyses were performed using SPSS® statistics (IBM, Armonk, NY, USA; version 28) software.
Results
A total of 220 patients with newly diagnosed GBM were included in the study. Of these, 14.5% of cases were defined as GC-GBM (group I, n = 32) and 85.5% were defined as non-GC GBM (group 2, n = 188). About 5.9% had >20% GCs (n = 13). Mean age at diagnosis was 63.5 ± 11.84 years for the entire cohort. The male to female ratio of our cohort was 1.2 and the mean follow up period was 15.7 ± 13.6 months. The incidence of DM2 was 26%. The mean OS (months) was significantly longer for GBM patients with no prior diagnosis of DM2 in both GC and non-GC subgroups (17.9 ± 1.4 vs 11.4 ± 1.5; P = .003 and 19.0 ± 3.5 vs 8.8 ± 2.9; P = .043, respectively) (Figure 3).
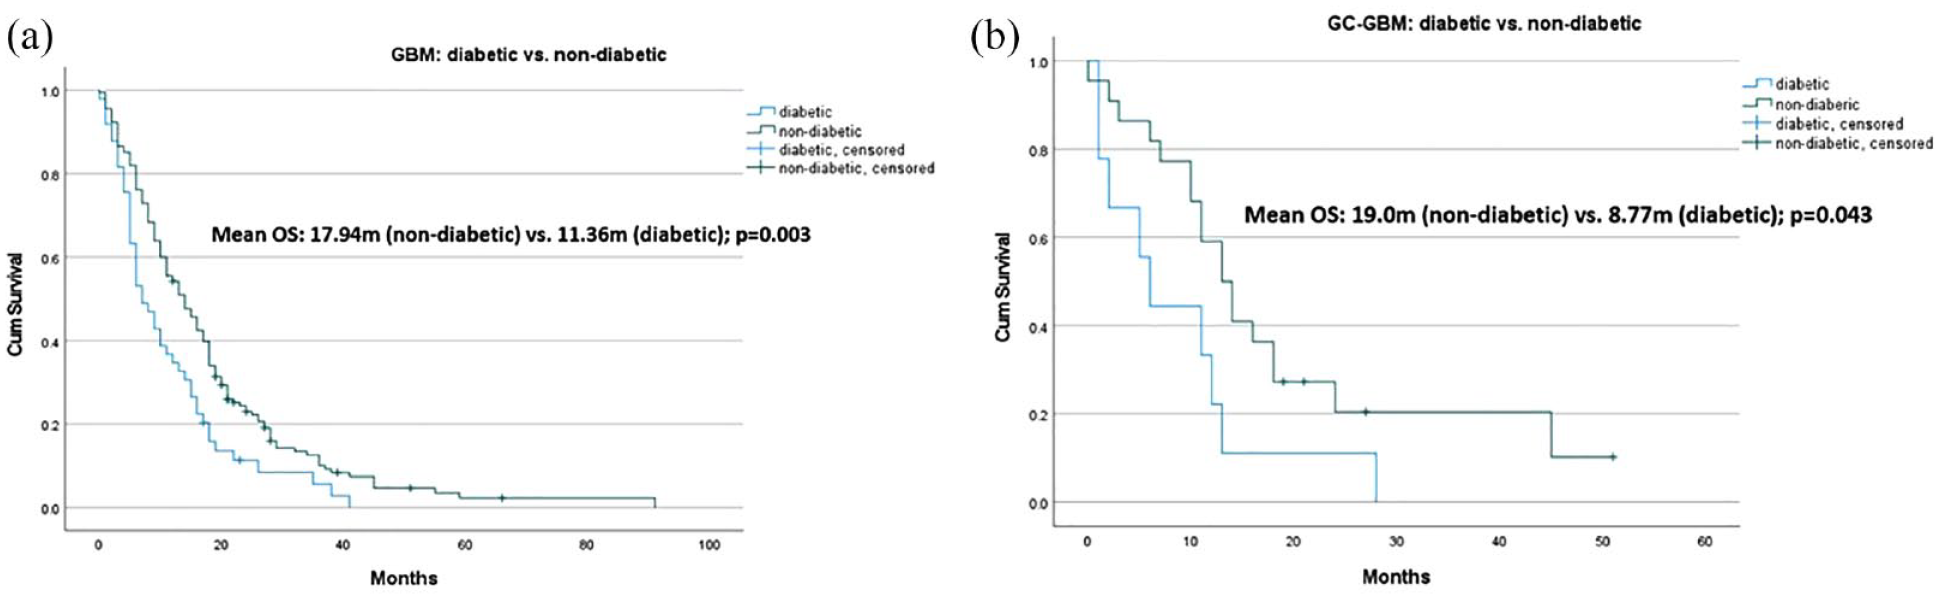
Kaplan-Meier curves of overall survival (OS) comparing DM2-GBM with non-DM2 GBM (a) and DM2 GC-GBM with non-DM2 GC GBM (b). Both groups had significantly worse OS in the DM2 subgroup as compared to the non-DM2 subgroup (P < .05).
GC-GBM (Group 1, n = 32) versus non-GC GBM (Group 2, n = 188)
No major differences were found between the 2 groups with respect to demographicsf. The incidence of DM2 was >25% in both groups without difference in median HbA1c levels. The rate of poorly-controlled DM2 (ie, HbA1c ⩾8) was much higher in group 1 than in group 2 (18.75% vs 9.5%), however this has not reached statistical significance (P = .13). Both groups had similar rates of hypertension, dyslipidemia and ischemic events and similar mean BMI and non-HDL to HDL ratio. Of note, the mean TG value was significantly higher in group 2 than in group 1 (138.74 ± 60.28 vs 117.36 ± 45.89, respectively; P = .035; 95% CI 1.63-41.1). Methylated MGMT and TERT promoter mutations were found in 46% and 45% and in 56% and 72% of examined group 1 tumors (n = 12) and group 2 tumors (n = 72) respectively. The mean PFS and mean OS were similar for both groups (see Supplemental Table 1).
DM2 GC-GBM (Group 1a, n = 9) versus DM2 non-GC GBM (Group 2a, n = 49)
Table 1 summarizes the characteristics of DM2 GC-GBM and DM2 non-GC GBM. In group 1a there was a male preponderance (88.8%), while in group 2a male to female ratio was 1.2 (OR 5.704, 95% CI 0.652-49.934; P = .073). The rate of poorly-controlled DM2 (ie, HbA1c ⩾ 8) was higher in group 1a than in group 2a (66.6% vs 40.4%), but did not reach statistical significance (P = .272). Significant differences between the 2 groups were found for mean weight (92.35 ± 21.10 vs 77.83 ± 15.24 for group 1a and 2a respectively; P = .022) and mean BMI (34.1 ± 11.42 vs 28.7 ± 5.44 for group 1a and 2a respectively; P = .034). Patients in group 1a were more likely to have weight ⩾85 kg (OR 6.16; 95% CI 1.3336-28.5147, P = .0019) as well as BMI ⩾ 30 (OR 3.46; 95% CI 0.804-14.901, P = .09). Of note, none of the patients in group 1a has received insulin prior to the diagnosis of GBM while 24.5% of patients in group 2a were treated by insulin prior to their diagnosis of GBM (OR 0.017; 95% CI 0.001-0.323, P = .006). Data on methylated MGMT and TERT promoter mutations status was available for only 20 patients, all in the non-GC GBM subgroup. The mean OS did not differ significantly between the 2 groups (8.77 ± 2.86 vs 11.36 ± 1.49 m for groups 1a and 2a respectively; P = .429).
DM2 GC-GBM versus DM2 non-GC GBM-epidemiological, metabolic, clinical, and survival characteristics.

Abbreviations: Adj, adjuvant; BMI, basic metablic index; Cx, chemotherapy; d, days; dl, deciliter; DM2, diabetes mellitus type 2; F, female; GBM, glioblastoma; GC, gemistocytes; GTR, gross total resection; HbA1C, hemoglobin A1C; HDL, high density lipoprotein; HGG, high grade glioma; HTN, hypertension; KPS, Karnofsky performance score; M, male; m, months; mg, milligram; PFS, progression free survival; PR, partial resection; RT, radiotherapy; STR, subtotal resection; SU, sulfonylurea; TG, triglycerides; w, weeks; y, years.
*indicates nearly reached statistical significance; **indicates statisticaly significant (p < 0.05).
GC-GBM With Poorly-Controlled DM2 (Group 1c, n = 6) Versus non-GC GBM With Poorly-Controlled DM2 (Group 2c, n = 18)
Table 2 summarizes the characteristics of poorly-controlled DM2 of GC-GBM and non-GC GBM. All patients in group 1c were males, as opposed to male to female ratio of 0.8 in group 2c (P = .024). The most significant metabolic-related difference between the 2 groups was related to insulin treatment prior to GBM diagnosis. None of the patients in group 1c were treated with insulin up to GBM diagnosis as opposed to 61.11% of patients in group 2c (OR 0.04; 95% CI 0.002-0.941, P = .045). Patients in group 1c had significantly higher mean weight (94.40 ± 14.29 vs 77.58 ± 16.30, respectively; P = .048). Patients in group 1c were highly more likely to have weight ⩾85 kg as well as BMI ⩾ 30 (OR 10.8; 95% CI 1.028-114.155, P = .047 and OR 4; 95% CI 0.563-28.397, P = .165; respectively). Mean Ki-67 was much lower in group 1c in comparison to group 2c (17.17 ± 9.39 vs 27.35 ± 15.82, P = .155). Mean OS was 9.66 ± 4.14 and 10.10 ± 1.86 m for groups 1c and 2c, respectively (P = .909). Table 3 summarizes the univariate analysis and odds ratios for selected variables associated with the presence of gemistocytes in DM2 GBM patients.
Poorly-controlled DM2: GC-GBM versus non-GC GBM – epidemiological, metabolic, clinical, and survival characteristics.

Abbreviations: Adj, adjuvant; BMI, basic metablic index; Cx, chemotherapy; d, days; dl, deciliter; DM2, diabetes mellitus type 2; F = female; GBM, glioblastoma; GC, gemistocytes; GTR, gross total resection; HbA1C, hemoglobin A1C; HDL, high density lipoprotein; HGG, high grade glioma; HTN, hypertension; KPS, Karnofsky performance score; M, male; m, months; mg, milligram; PFS, progression free survival; PR, partial resection; RT, radiotherapy; STR, subtotal resection; SU, sulfonylurea; TG, triglycerides; w, weeks; y, years.
*indicates statisticaly significant (p < 0.05).
Univariate analysis for selected variables associated with the presence of gemistocytes in DM2 GBM patients (odds ratio).

Abbreviations: CI, confidence interval; DM2, diabetes mellitus type 2; GBM, glioblastoma multiforme; GC, gemistocytes; OR, odds ratio.
*indicates statisticaly significant (p < 0.05); **indicates nearly reached statistical significance.
TP53 Immunostaining, Presence of Gemistocytes and the Use of Metformin at Time of Diagnosis
Positive immunostaining for TP53 did not differ significantly between the non-GC GBM and the GC-GBM subgroups or in the DM2 GBM subgroups. Metformin was used in 100% and 77.6% of DM2 GC-GBM and DM2 non-GC GBM patients, respectively, at time of diagnosis. Figure 4 presents the survival curves of various subgroups. TP53-pos was associated with favorable survival in the subgroup of GC-GBM. Major difference in mean OS was found between TP53-pos GC-GBM (n = 7) and TP53-neg GC-GBM (n = 21) (23.5 m vs 14.57 m; respectively, P = .048) (Figure 4a). In the group of DM2-GBM patients with metformin at time of diagnosis (n = 47), the presence of GCs (n = 9) was not associated with significant differences in OS (Figure 4b). However, in the subgroup of DM2-GBM patients with metformin that were TP53-neg (n = 30), the lack of GCs (n = 24) was associated with almost double the mean OS (11.98 vs 6.33, P = .173) (Figure 4c).

Kaplan-Meier curves of overall survival (OS) comparing the following subgroups: GC-GBM (n = 28): TP53-pos staining (25%, n = 7) versus TP53-neg staining (75%, n = 21) (a); DM2 GBM cases with metformin(n = 47): with GCs (19.1%, n = 9) versus without GCs (80.9%, n = 38) (b); and DM2 GBM with metformin and TP53-neg staining (n = 30): with GCs (20%, n = 6) versus without GCs (80%, n = 24) (c).
Discussion
The aim of this study was to investigate whether or not systemic metabolic features may determine the histopathological phenotype and clinical outcome in patient with newly diagnosed GBM. Specifically, we were looking for possible associations between DM2 characteristics and the appearance of GCs in samples of GBM. We furthermore explored whether the presence of GCs, together with other molecular and clinical parameters, may be correlated to observed differences in survival.
This study shows that, as a group, GC-GBM patients share systemic metabolic features with non-GC GBM patients. The only significant difference in investigated metabolic parameters between the 2 groups was the mean TGs level at time of diagnosis (showing significantly higher levels of TGs in the group of non-GC GBM). Research on lipid metabolism in GBM and its potential in targeted therapy is emerging 20 ; however, a comprehensive discussion on this topic is beyond the scope of this study. A key point of our study is the association between the presence of GCs and low systemic TGs levels, which warrants further research.
Both GC-GBM and non-GC GBM had similar rates of DM2 at the time of diagnosis (28% and 26%, respectively). Previous studies on GBM reported DM2 prevalence as low as 3% to 6%,21,22 while other works identified DM2 in 12%to 16% of GBM patients.23 -25 DM2, or any of its related metabolic risk factors, are not considered a risk factor for GBM. 26 Therefore, the incidence of DM2 in GBM patients should be similar to the incidence of DM2 in the general population. DM2 affects 10% to 14% of the western population. 27 However, the incidence of DM2 increases significantly with age, and can be found in as many as >25% of patients ⩾65 years old. 28 Given that the mean age of our entire cohort was 63.5 years, this explains well the >25% rate of DM2 found in our study.
DM2 is among the most common chronic illnesses worldwide, associated with obesity and metabolic syndrome. 27 However, and despite extensive research on glucose metabolism in GBM, only a small number of clinical studies have reported on HbA1C levels in these patients.22,29,30 Importantly, DM2 is associated with a decreased survival in GBM patients.22 -24,29,31 -38 Our study supports this, as DM2-GBM cases were significantly associated with poorer OS, both in the non-GC GBM group as well as in the GC-GBM group.
Derr et al discussed various mechanisms of how hyperglycemia contributes to poor prognosis in GBM, including the associated hyperinsulinemia that might stimulate tumor growth. In addition, glucose is an energy substrate for glioma cells, and high glucose level might result in uncontrolled growth. 32 Further studies have shown that diabetic patients with GBM do not have reduced survival in multivariate testing, unless patients are hyperglycemic and poorly controlled. 31 This finding is alarming, as the rate of poorly-controlled DM2 at time of diagnosis in GBM patients is comparatively high. In a previous study, 42.7% of DM2-GBM patients had Hb1AC levels of 6.5 to 7.9 and 23% had Hb1AC levels of ⩾8. 22 In our cohort, 41% of DM2-GBM cases had Hb1AC levels of ⩾8 and in the DM2 GC-GBM subgroup it was as high as 66.6%.
Examination of the subgroup of DM2 GBM has revealed some significant differences between DM2 GC-GBM and DM2 non-GC GBM. The former is characterized by significant male predominance (nearly 90%) and significantly higher mean weight (mean = 92.35 kg) and BMI levels (mean = 34.1). In addition, none of the patients in the DM2 GC-GBM group were taking insulin at time of surgery and diagnosis, compared to >24.5% in the DM2 non-GC GBM. Further investigation into the small group of poorly-controlled DM2 GBM patients have emphasized these differences even more. None of the patients in the poorly controlled DM2 GC-GBM group were taking insulin at time of surgery, and this observation was highly significant (0% vs 61%, P = .016).
To the best of our knowledge, this is the first description of a possible correlation between a systemic metabolic status and the appearance of a unique pathologic phenotype in GBM. Especially interesting is the possible association between significant insulin-resistant features (male gender, morbid obesity, poorly controlled DM2), no use of insulin and the appearance of GCs as will be further discussed.
Gemistocytes and Metabolic Modulation
The pathogenesis and phenotypical appearance of GCs in gliomas is not fully understood. An early theory claims that rapid progression of neoplastic glial cells may outgrow the vascular supply of the tumor, resulting in hypoxic environment for neoplastic cells, triggering tumor cell metamorphosis into a gemistocytic phenotype. 39 Nevertheless, although necrosis and hypoxic environment are a hallmark of GBM, noticeable number of GCs (ie, >20% of tumor’s cells) appears in only 6% to 8% of cases.12,40 Thus, the presence of GCs in GBM may have other causes.
Reactive astrocytes and GCs dynamically modulate their metabolism, rapidly responding to environmental stress. However, how the metabolic dynamics in astrocytes are affected by the GBM microenvironment is largely unexplored. 41 Unlike neurons, which possess a highly oxidative metabolism, astrocytes rely more on glycolytic metabolism.42,43 Glycolysis is the most effective and least energetically demanding process. 44 High glucose enhanced glycolysis and increased lactate production and adenosine tri-phosphate (ATP) content in astrocytes has been found in diabetic patients. 42 An association between high glucose levels and changes in astrocytes function and phenotype was found in a study on retinal astrocytes. Here, high glucose conditions were associated with changes in intracellular signaling pathways involve in cell survival, migration and proliferation, causing changes in the phenotype of astrocytes. 13 Furthermore, high glucose conditions also increased the expression of GFAP, a significant marker of GCs.1,13,45 Finally, biopsy of a putamen lesion from a poorly controlled DM2 HCHB patient revealed abundant GCs.15,16 This previously reported data suggests an association between high systemic glucose levels and reactive astrocytes’ function and phenotype. In addition to this unique, inert yet apparently modulated metabolic feature of AC, many cancer cells can alter their metabolism in order to increase glucose uptake and fermenting it to lactate, even in the presence of normal oxygen levels and with completely functioning mitochondria. This was termed aerobic glycolysis, and its relation to tumorigenesis is known as the Warburg effect, which has been the subject of intense research in recent years. 46 In this process, pyruvate is converted to lactate instead of entering mitochondria for the tricarboxylic acid cycle (TCA) cycle. 47 In order to engage in the Warburg effect, the cancer cells use much more glucose than normal cells, and so it follows that the ability for such cells to bring glucose into their cytoplasm needs to be increased. 44 Despite extensive research, the biological benefits of the Warburg effect are not fully understood.48,49 In GBM in particular, the Warburg effect plays a central role in the pleiotropic changes that occur in the affected tissue. 50 Interestingly, another anti-Warburg effect drives differentiation of GBM cells into astrocytes. 51 Together, this combination of a “pathologic” Warburg effect, that occurs in high grade astrocytomas, and a “natural” Warburg effect, that occurs in non-neoplastic astrocytes, may indicate that some systemic metabolic states, such as uncontrolled hyperglycemia and insulin resistance, can affect the microenvironment of GBM. 52 It supports our finding of 66% rate of poorly-controlled DM2 in the subgroup of GC-GBM.
Gemistocytes and Insulin Resistance
The most significant difference between the 2 subgroups of DM2 GBM patients was, that no patient in the DM2 GC-GBM was taking insulin at time of diagnosis. Until recently, studies on the effect of insulin in the CNS have focused mainly on neurons. Only in the past few years, studies on its effects and its role in other CNS cells, such as astrocytes, have emerged.53 -55 Ablation of insulin-receptors (IR) or insulin-like growth factor I receptor (IGF-1R) in astrocytes throughout the entire CNS causes significant metabolic changes, such as a decreased expression GLUT-1 (the major glucose transporter in astrocytes), a marked reduction in overall astrocytic glucose uptake and a lower glycolytic rate; thus, significantly hampering glucose transport into the brain. This emphasizes not only the role of insulin in the brain, but specifically the importance of astrocytes in insulin-dependent metabolism. 56
In relation to HGGs, insulin has been shown to stimulate glucose uptake in cultures of human GBM cells and dual inhibition of IR and IGF-1R exhibits promise for treating GBM. 57 GBM is sensitive to the mitogenic functions of insulin, thus significant insulin exposure imposes risk to GBM patients. 49 In a recently published study on a small GB-patient cohort (n = 25), the authors observed a statistically significant correlation (P < .03) between chronic glycemia and the cellular proliferation index of GBM (measured by cellular Ki-67 expression). 30 Although it was not the aim of our current study, an analysis of our data did not show any significant differences in Ki-67 expression between non-DM2 GBM and DM2 GBM, regardless to HbA1C levels (data not shown). However, in the cohort of DM2 GBM cases, the subgroup of DM2 GC-GBM was associated with marked insulin resistance, no prior use of insulin and lower levels of Ki-67 in comparison to DM2 non-GC GBM. The difference in Ki-67 levels was more pronounced in cases of poorly-controlled DM2. This observation may support the impact of insulin on the proliferative index of GBM.
Men and women differ substantially in regards to the degree of insulin resistance, body composition, and energy balance. Type 2 diabetic males with morbid obesity have the highest degree of insulin resistance. 58 Those were the significant characteristics of our DM2 GC-GBM group, especially those with poorly-controlled DM2. It is therefore very likely that in morbidly obese, poorly-controlled diabetic male patients, who are not taking insulin, the metabolic environment of the GBM cells and their related stroma is severely depleted of insulin and its action, thus a significant shift in the phenotype of astrocytes occurs, markedly increasing the number of GCs in the tumor.
Gemistocytes and Possible Impact on Treatment Failure and Overall Survival
The cross-talk between GBM neoplastic cells and surrounding glial cells, including astrocytes and GCs, is a key element in GBM heterogeneity and treatment failure. This cross-talk is a complex networking of metabolic modules, influenced by variation in the oxidative phosphorylation rate, glycolysis and response to hypoxia (see review by Virtuoso et al 41 ). In this regard, GCs can be considered merely “innocent bystanders,” reflecting changes in the tumor microenvironment in response to glycemic-related systemic changes. However, the presence of GCs may also have clinical implications, influencing the tumor’s behavior and response to treatment. One example of GBM-stroma interaction involves the placental form of Glutathione S-Transferase (GST-p), a detoxifying enzyme. High levels of free GST-p may cause detoxification of chemotherapeutic drugs, thus affecting the survival of GBM patients. 59 A recent study has shown that a GBM cell line with pre-existing temozolomide resistance had high GST-p expression and that GST-p knockdown resulted in decreased invasiveness in GBM cells. 60 Importantly, in human HGG, positive staining reactions of GST-p were noted especially in GCs. 61 Thus, theoretically, the presence of GCs may have therapeutic implications. In a study by Popov et al, 40 the mean OS for gemistocytic enriched GBM was as short as 4.1 months. Others have failed to describe such a profound impact on survival.9,62,63 In a previous report, our group did find a trend toward worse prognosis and decreased OS in association with increased percentage of GCs. 12
There is an ongoing debate whether or not GCs are neoplastic cells. They are known to have a very low proliferation rate, compared to other tumor cells. 1 Some studies claim that GCs are entrapped, non-neoplastic glial cells 39 while others consider them neoplastic, mainly due to findings of molecular changes that resemble those that are found in cancer cells. 64 One such important molecular change is p53 mutation. TP53, one of the genes found to be mutated in GBM, is heavily involved in the regulation of GLUT1 transcription. 65 Of note, numerous studies have failed to show a clear association between TP53 overexpression (=p53 mutations) and outcome in HGG. 10 Our current study did not demonstrate any significant differences in rate of TP53 positivity (neither ⩾10% nor ⩾20% expression) between any of the examined subgroups. However, major difference in mean OS was found between TP53-pos GC-GBM and TP53-neg GC-GBM (23.5 m vs 14.57 m; respectively). This means that p53 mutations may be associated with favorable survival in the subgroup of GBM patients with GCs. Interestingly, in a recent study, the authors have found that the presence of p53 mutations affects the behavior of tumor-associated macrophages (TAMs), another important component of the GBM microenvironment. These changes in the function of TAMs occurs in a longitudinal fashion, might be influenced by certain treatments and may affect tumor’s behavior and survival. 66 This again emphasizes the importance of the cross-talk between neoplastic cells and their surrounding in the presence of specific molecular changes.
Only a few papers23,24,67 (reporting on 1272 patients in total) found a better overall survival (OS) in DM2 patients with GBM who usually use metformin compared to those patients who do not take it. Supporting that observation, in our subgroup of DM2 GBM patients with no metformin treatment at time of diagnosis, TP53-pos cases were associated with grim prognosis (mean OS of 7.5 m). Another notable difference in OS was found in the subgroup of TP53-neg DM2 GBM cases with metformin at time of diagnosis. In this subgroup, the presence of GCs was associated with unfavorable outcome (mean OS of 6.33 m vs 11.98 m). Although this data should be read with caution due to relatively small cohort size in each subgroup and lack of multivariate analysis, we have shown that p53 mutations may have different prognostic implications in GBM, which may be depending on the metabolic-related phenotype of the tumor (with or without GCs) and possibly on the anti-diabetic drugs being used. Theoretically, different combinations of molecular changes (p53 mutations), pathological phenotypes (presence of GCs) and anti-diabetic treatment (eg, use of metformin) may be associated with differences in prognosis and in OS. To test this hypothesis, we will require further research.
Study Limitations
As a retrospective study, our investigation is prone to the typical inherent biases of this type of research. In addition, due to the fact that GCs are rather uncommon in GBM, some of our statistical analyses were limited secondary to relatively small cohort sizes in the different subgroups. This has prevented us from performing a multivariate analysis. Thirdly, the diagnosis of GCs is a morphological one. There are no specific immunohistochemical stains that distinguish GCs from other neoplastic cells with similar morphology such as rhabdoid or epithelioid cells in GBM cases. This may affect the diagnostic accuracy and requires the work of a dedicated and experienced neuropathologist. it should be emphasized that rhabdoid cells are defined as cells with large eccentric nuclei with prominent nucleoli and abundant eosinophilic cytoplasm containing globular paranuclear eosinophilic inclusions. The prominent nucleoli and the paranuclear eosinoplilic inclusions are not found in GCs. Epithelioid cells in GBM are defined as tumor cells with abundant eosinophilic cytoplasm, vesicular nuclei with prominent nucleoli, and distinct cytoplasmic borders. The prominent nucleoli and the distinct borders are not features that characterize GCs. In addition, the data was gathered during a period of changes in the WHO definitions of high-grade gliomas. We have tried to overcome this difficulty by selecting as much homogenous cohort as possible, excluding cases that were considered “secondary” GBM in the past. Finally, this study was not indented to be epidemiological in nature. The goal was to find metabolic risk factors correlating with the histopathological findings of GCs in GBM. Hence, some of the survival calculations should be read with caution. They were performed on small groups, without adjustments for risks and were mainly aimed to show trends and associations between 1 or 2 possible prognostic factors and overall survival. Although for the majority of the studied patients, no significant differences were found for established prognostic factors for survival (eg, age, extent of surgery, adjuvant therapy, and molecular profile), we recommend that our survival analyses will be validated on a larger cohort with proper risks’ adjustments. This is especially important for a more detailed survival analysis regarding the effect of metformin, HbA1C and glucose levels on OS. Many patients with GBM are under glucocorticoids treatment for prolonged periods following the initial diagnosis. This can affect their glucose metabolism and HbA1C levels. In addition, patients may change their anti-diabetic treatment over time. Therefore, the influence of DM2 and its associated prognostic factors on OS in GBM patients should be properly studied with these limitations in mind.
Conclusions
This study shows that certain aspects of a GBM patients’ systemic metabolic status may affect the tumor’s histological phenotype. Specifically, GBM patients with metabolic factors that are associated with marked insulin resistance (male gender, morbidly obese, type 2 diabetes) and those who are not treated with synthetic insulin are significantly more likely to present with GCs on their initial GBM pathology examination. This is a novel finding that may add to the growing data on glucose metabolism in astrocytes and astrocytic high-grade gliomas. It should be emphasized that the pathogenesis of GCs remains unknown. The majority of patients with GC-GBM had no DM2, no significant metabolic abnormalities and no remarkable molecular changes. We do not know why the tumors of these patients contain GCs. Nevertheless, for a subset of patients, we were able to correlate the presence of GCs with a specific metabolic state characterized by significant insulin resistance and no insulin administration. This has not been reported before as most studies on diabetes and GBM focused on epidemiologic and survival variables.
The presence of GCs in a genetically specific subgroup of patients associated with certain tumor’s microenvironment conditions, and perhaps with the influence of anti-diabetic drugs (such as metformin), may affect the prognosis of GBM. It is possible that in the future these subgroups of GBM patients will require a more tailored adjuvant treatment with closer consideration of their metabolic and molecular status.
Supplemental Material
sj-docx-1-pat-10.1177_2632010X231207725 – Supplemental material for Significant Systemic Insulin Resistance is Associated With Unique Glioblastoma Multiforme Phenotype
Supplemental material, sj-docx-1-pat-10.1177_2632010X231207725 for Significant Systemic Insulin Resistance is Associated With Unique Glioblastoma Multiforme Phenotype by Yosef Laviv, Eilat Sapirstein, Andrew A Kanner, Shani Berkowitz, Suzana Fichman, Alexandra Benouaich-Amiel, Shlomit Yust-Katz, Ekkehard E Kasper and Tali Siegal in Clinical Pathology
Footnotes
Funding:
The author received no financial support for the research, authorship, and/or publication of this article.
Declaration of conflicting interests:
The author declared no potential conflicts of interest with respect to the research, authorship, and/or publication of this article.
Data Availability
The datasets generated during the current study are available from the corresponding author on reasonable request.
Ethical Approval
This retrospective chart review study involving human participants was in accordance with the ethical standards of the institutional and national research committee and with the 1964 Helsinki Declaration and its later amendments or comparable ethical standards. The Human Investigation Committee (IRB) of Rabin Medical Center (Beilinson hospital, Tel Aviv University) approved this study.
Supplemental Material
Supplemental material for this article is available online.
References
Supplementary Material
Please find the following supplemental material available below.
For Open Access articles published under a Creative Commons License, all supplemental material carries the same license as the article it is associated with.
For non-Open Access articles published, all supplemental material carries a non-exclusive license, and permission requests for re-use of supplemental material or any part of supplemental material shall be sent directly to the copyright owner as specified in the copyright notice associated with the article.