
Abstract
This study uses fractional meta-regression analysis to investigate the heterogeneity in manufacturing and national efficiency scores in Brazil, Russia, India, China, South Africa, Egypt, Saudi Arabia, Iran, UAE and Ethiopia (BRICS)+ countries. The analysis of 281 manufacturing efficiency scores from 87 primary studies reveals an average efficiency of 65.9%, and 230 national efficiency scores from 39 studies produce an average score of 75.04%. Our findings indicate significant heterogeneity in both manufacturing and national efficiency scores, as well as the sensitivity of efficiency estimates to study-specific characteristics. Our findings reveal significant heterogeneity in efficiency scores driven by both methodological and economic factors. Methodological influences include estimation method, study orientation, sample size, number of variables, publication status and data type, reflecting differences in research design. Economically, variations arise from factors such as returns to scale and sector-specific conditions, which affect how inputs are converted into outputs. Notably, the manufacturing sector in BRICS+ countries holds substantial potential for output growth through efficiency improvements linked to better resource use, technology adoption and institutional support.
Introduction
Over the past four decades, the world economy has undergone a profound structural transformation, prompting the redistribution of economic resources across agriculture, manufacturing and services sectors. The Asian Tigers experienced rapid export expansion and industrial productivity growth, while Europe and North America have experienced deindustrialisation and servicification (Ramaswamy & Rowthorn, 1997). In contrast, Sub-Saharan African (SSA) and Latin American countries have experienced a wave of premature deindustrialisation and reprimarisation. Deindustrialisation is the sustained decline in the share of manufacturing in total employment or the share of manufacturing in gross domestic product (Tregenna, 2009). Reprimarisation is the shift from manufacturing to an economy dominated by the primary sector (Cooney, 2021).
Productivity growth is a crucial driver of structural transformation and international competitiveness. Emerging economies, such as Brazil, Russia, India, China and South Africa (BRICS), have gained considerable attention since the turn of the century due to their rapid economic growth and potential to reshape the global economic and financial landscape. More recently, Egypt, Saudi Arabia, Iran, the United Arab Emirates (UAE) and Ethiopia joined the alliance in January 2024, forming the ‘BRICS+’.
The BRICS+ countries are factor-driven, relying on labour, materials and natural resources (Alnafrah, 2021; Cai, 2011; Yueqin, 2012). However, reliance on labour-cost-based products and natural resource exploitation creates structural development traps that undermine long-term growth (Lin & Chang, 2009). In contrast, efficiency-driven economies generally record sustained growth (Wang et al., 2021). Differences in national efficiency explain most productivity and income disparities across nations (Danquah, 2018; Jerzmanowski, 2007).
National efficiency refers to a country’s ability to maximise output from its inputs and technology. Efficient countries can compete effectively in global markets, diversify their exports and improve citizenry welfare (Yang et al., 2021). It also significantly influences a country’s economic structure and specialisation. Despite their notable industrial and economic rise, concerns about deindustrialisation linger among the BRICS+ economies. The BRICS+ countries have experienced premature deindustrialisation (Cooney, 2021; Imbs, 2013) driven by increased globalisation, competition and trade (Rodrik, 2016). Brazil and Russia experienced reprimarisation, whereas China, India and South Africa experienced services sector expansion (Dasgupta & Singh, 2007; Imbs, 2013). Reviving the manufacturing sector is crucial, as it is a key driver of economic growth (Tang & Tregenna, 2019). Empirical evidence indicates that few countries have successfully transitioned from low- to high-income without developing their manufacturing sector (Hauge & Chang, 2019). The BRICS+ countries are vulnerable to efficiency- and innovation-driven competitive pressure due to the factor-driven nature of their economies. Strengthening the manufacturing sector and improving national efficiency is critical to enhancing competitiveness and counteracting deindustrialisation.
However, efficiency studies on the BRICS+ show significant heterogeneity in reported efficiency scores. For instance, Malik and Masood (2021) found an average score of 0.85 for the UAE using the stochastic frontier analysis (SFA), while Bashayreh et al. (2021) obtained 0.98 using the data envelopment analysis (DEA) from 2009 to 2016. Moreover, there is a limited systematic synthesis of extant primary manufacturing and national efficiency studies to examine the origin of the heterogeneity. Although methodological choice and study specifics can theoretically affect efficiency scores, their effect is mixed in the literature. For example, Dong et al. (2022) and Fall et al. (2019) found that studies using the DEA method yielded higher efficiency scores than those using the SFA method, while Samat et al. (2023) and Aiello et al. (2024) found the opposite. Moreover, Ho et al. (2021) found that panel data yielded lower scores than cross-sectional data, whereas Aiello and Bonanno (2019) and Chaffai (2022) concluded the opposite.
To our knowledge, this is the first meta-analysis to synthesise the literature on manufacturing and national efficiency in BRICS+ countries. By summarising the available information from primary studies, this study provides an overview of the development levels and input–output status of the manufacturing sector and national economies. Lastly, we examine the effects of different modelling methods and study specifics on average efficiency scores, offering insights for the design of future studies.
This study is organised as follows: the methodology discusses the study selection criteria, pre-estimation tests and the meta-regression methods. The results section presents and discusses results and conclusions.
Materials and Methods
Meta-analysis is the statistical analysis of previously reported research findings on a given hypothesis, empirical effect or policy intervention (Stanley & Doucouliagos, 2012). It combines results from related studies to determine an overall pattern and produce more detailed insights than individual studies. It helps to explain the heterogeneity of results across studies and the synthesis of studies applying different measures of the same construct (Stanley, 2005; Stanley & Doucouliagos, 2012). Tests for heterogeneity and publication bias were conducted before the meta-regression analysis. The ensuing section presents the search and inclusion criteria.
Inclusion Criteria
A vital step in meta-analysis is the collection of metadata. The metadata for this study were obtained from bibliographic databases and via the Google search engine. The key search words for national efficiency metadata were ‘national efficiency’, ‘country efficiency’, ‘national productivity’, ‘regional efficiency’, ‘country performance’ and ‘BRICS’. The keywords for manufacturing efficiency metadata were ‘manufacturing firm efficiency’, ‘manufacturing firm productivity’, ‘manufacturing firm performance’ and ‘industry efficiency’. Both published and unpublished studies written in English that reported efficiency scores at a country or a firm level and were conducted between 1980 and 2023 were included. Unpublished working papers were incorporated to control publication selection bias and to enrich heterogeneity (Stanley & Doucouliagos, 2012).
After searching the ScienceDirect, JSTOR, ProQuest, Springer Academic Journals, Wiley Online Library and Francis & Taylor and the subsequent exclusion of studies which did not report country-level efficiency scores or had missing information, 39 studies were included in the BRICS+ national efficiency metadatabase. Figure 1 shows the PRISMA flowchart of how the literature was systematically reviewed.
PRISMA Flow Diagram for Metadata, Which Includes Searches of Databases and Other Sources.
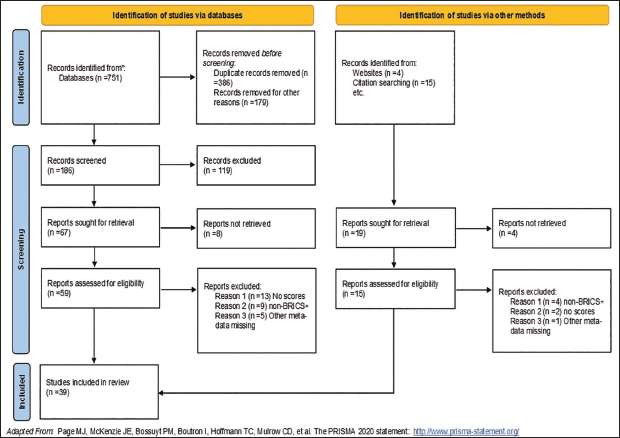
Following a similar procedure, metadata for manufacturing efficiency was screened down to 87 primary studies. Appendix A shows the PRISMA flow diagram for manufacturing efficiency studies.
Heterogeneity Test
Identifying and accounting for heterogeneity is critical in meta-analysis because heterogeneity affects the choice of statistical models. Heterogeneity can be informally assessed using forest plots and formally using statistical tests such as Cochran’s Q-test and Higgins’ I2 index. The Q-test is a weighted sum of squared differences between the individual study’s observed effect and the pooled effect:
where k is the number of studies,
The I2 ranges from 0% to 100%, with 25%, 50% and 75% denoting low, moderate and high heterogeneity, respectively.
Publication Bias
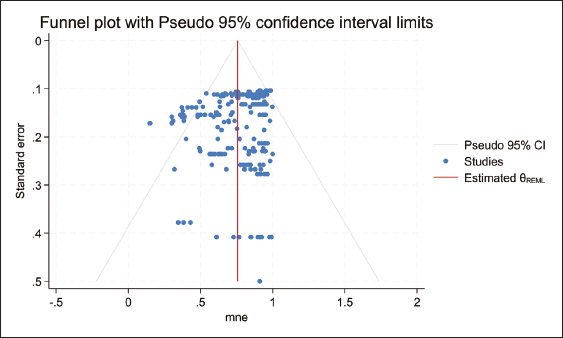
Meta-analysis is susceptible to publication bias. Publication bias occurs when the publication of studies depends on the nature and direction of results, such that published studies may be systematically different from unpublished studies (Card & Krueger, 1995). Funnel plots are a preliminary test for publication bias. Funnel plots are scatter diagrams of all empirical estimates of a given phenomenon and the estimates’ precisions of effect size. Precision can be measured by the inverse of standard error, sample size or square root of sample size (Begg & Berlin, 1988; Trong Ho et al., 2022). Asymmetrical plots denote that publication bias is likely, while symmetrical plots signify that it is unlikely. However, the visualisation is subjective.
The Egger’s funnel asymmetry test (FAT) is a more objective test for publication bias (Stanley, 2005). It regresses the standard normal deviate against its precision, resulting in:
where
Meta-regression Model
Meta-regression analysis is a multivariate empirical investigation using multiple regression analysis to determine how the characteristics of primary studies may affect outcomes and between-study heterogeneity (Stanley, 2001). Meta-regression is traditionally performed within the fixed effects and random effects frameworks.
The fixed-effects model assumes that one true effect size underlies all the studies in the analysis and that each study is an estimate of that true effect (Borenstein et al., 2010). The differences among the observed effects are thus attributed to sampling error (Nikolakopoulou et al., 2014). On the other hand, the random-effect model assumes that each study is different from other studies, allowing the true effect to vary among the selected studies (Stanley & Doucouliagos, 2012). This study covers countries from five sub-regions with heterogeneous economic structures that are unlikely to have a single underlying effect; hence, the random effects framework is adopted.
The Tobit and ordinary least squares (OLS) are the commonly used meta-regression models in efficiency studies. The bounded nature of the efficiency scores destroys the linearity condition, rendering the OLS inappropriate (Wang & Wang, 2022). The Tobit model is also inappropriate because the accumulation of efficiency scores is a natural consequence of how efficiency scores are defined, rather than a censoring mechanism (McDonald, 2009; Ramalho et al., 2010). Following Geffersa and Agbola (2019) and Djokoto et al. (2020), this study applies the meta-fractional regression model (MFRM), which treats efficiency scores as a proportional variable.
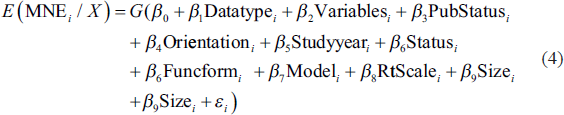
The MFRM is estimated using the nonlinear quasi-maximum likelihood estimation (QMLE), which is asymptotically efficient and consistent compared to the OLS and Tobit models. The MFRM presupposes a functional form for the conditional mean of the estimated values of the efficiency scores, such as logit and probit. Heteroscedasticity in the error term can be corrected by weighting both sides of the meta-regression model using precision, resulting in the weighted least squares. The empirical model for explaining heterogeneity in national efficiency scores is presented in Equation (4).
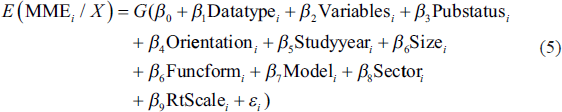
The model for explaining heterogeneity in manufacturing efficiency scores is specified in Equation (5).
where MNE is mean national efficiency, Datatype is data and takes a value 1—when data is panel and 0 if cross-sectional, Variables is the total of input and output variables in the efficiency model, PubStatus takes a value of 1 if the study is published in a journal, 0 if unpublished, Orientation takes a value 1 for output-oriented and, 0 for input-oriented, Studyyear is the average years of surveys used in primary studies, Status takes a value 1 if the country is low income, 2—lower middle income, 3—upper middle income, 4—high income, Size is the number of decision making units studied, Funcform assumes a value of 1 if translog and 0 if Cobb Douglas, Model takes a value of 1 if the model is SFA, 0 if DEA,
Moderator Variables
Moderator variables are the observed characteristics that explain heterogeneity in efficiency levels across studies. The variables include methodological and study-specific characteristics extracted from primary studies.
Estimation Method and Functional Form
The parametric SFA and the nonparametric DEA are commonly used efficiency measurement approaches in the literature. The SFA model is expected to produce higher efficiency scores than the deterministic DEA because it separates statistical noise from inefficiency. In contrast, the DEA treats all deviations from the frontier as inefficiency, resulting in lower efficiency scores. Functional forms apply to parametric SFA models. The commonly used forms include the Cobb–Douglas and translog functions. While the translog function offers greater flexibility than the Cobb–Douglas function, it consumes more degrees of freedom. The translog functional form is expected to fit the data more tightly, producing higher efficiency estimates (Nguyen & Coelli, 2009). Although the Lagrange Multiplier (LM) test is typically used to compare Cobb–Douglas and translog specifications during the direct estimation of production frontiers, it cannot be applied in our case. The LM test requires likelihood ratio comparisons of nested models, which depend on access to estimated production function parameters. In our study, efficiency scores are pre-estimated using a meta-frontier framework, and these parameters are not directly available. This methodological constraint is supported in the literature, where pre-estimated efficiency scores preclude formal model comparison through likelihood-based tests (Coelli et al., 2005).
Returns to Scale and Study Orientation
Returns to scale pertain to the optimal size of production units and are typically applicable to DEA studies. The DEA can be estimated under assumptions of constant returns to scale (CRS) or variable returns to scale (VRS). Erroneously assuming CRS when production units are not operating optimally produces efficiency scores confounded by scale efficiency. In contrast, VRS are devoid of such scale effects and are expected to yield higher average efficiency scores. Technical efficiency is estimated based on either input or output-orientated production functions. An output orientation is appropriate when the goal is to maximise output, while an input orientation is ideal when the goal is to minimise inputs or costs. Production orientation has an effect on efficiency under the VRS. Under CRS, input and output orientations yield identical efficiency scores (Coelli et al., 2005). Decision-making units (DMUs) with an input orientation operating under increasing returns to scale will produce higher mean efficiency scores, whereas the opposite is true for larger output-oriented DMUs.
Variables and Sample Size
The choice of input and output variables is a significant decision in production technology. Variable expansion through adding new input variables or disaggregating existing ones will increase the dimension of the frontier and produce higher efficiency scores (Nunamaker, 1985), while variable aggregation leads to a downward bias in efficiency estimates (Barnum & Gleason, 2005). The sample size is the number of decision-making units studied in the primary study. An increase in the sample size may push up the production efficiency frontier or leave it unchanged, depending on the new DMUs’ relative efficiency. If the new DMUs are part of the new frontier, previously identified efficient will be reclassified as inefficient. Conversely, if new entrants are on or below the existing frontier, the status of already identified efficient and inefficient DMUs remains the same. Increasing the sample size is unlikely to improve the mean efficiency scores.
Data Type and Study Period
Most efficiency studies in the literature use either cross-sectional or panel data. When heterogeneity and measurement errors are appropriately managed, panel data tend to produce more accurate efficiency scores (Samat et al., 2023). Repeated observations in panel data reduce variation over time, resulting in higher average efficiency scores compared to cross-sectional data (Nguyen & Coelli, 2009). Efficiency levels may also vary across study periods, and studies based on recent data are generally expected to yield higher efficiency scores.
Publication Status
The peer-review process can cause variation in efficiency scores between published and grey literature. The manuscript review process is expected to moderate the efficiency estimates, resulting in lower efficiency scores from published studies (Xu et al., 2023).
Income Status and Economic Sector
Contextual macroeconomic variables such as income and economic structure can also affect national efficiency. High-income economies specialising in skill and knowledge-intensive products are expected to be more efficient than resource-based low-income economies. High-income countries have the fiscal capacity and flexibility to support innovative research and benefit from well-developed infrastructure and institutions. This enables them to effectively acquire, adapt and customise imported technologies to local contexts, ultimately leading to enhanced productivity (Wang et al., 2021).
Results and Discussion
The meta-analysis of national efficiency scores was based on 230 national efficiency scores from 39 primary studies. The distribution of the efficiency estimates across the BRICS+ countries is shown in the pie chart in Figure 3. India has the highest efficiency estimates (17.39%), followed by Brazil (12.22%), while Ethiopia has the least. The distribution of efficiency scores by year of study is shown in the bar chart in Figure 3.
Funnel Plot of Mean National Efficiency Versus the Standard Error.
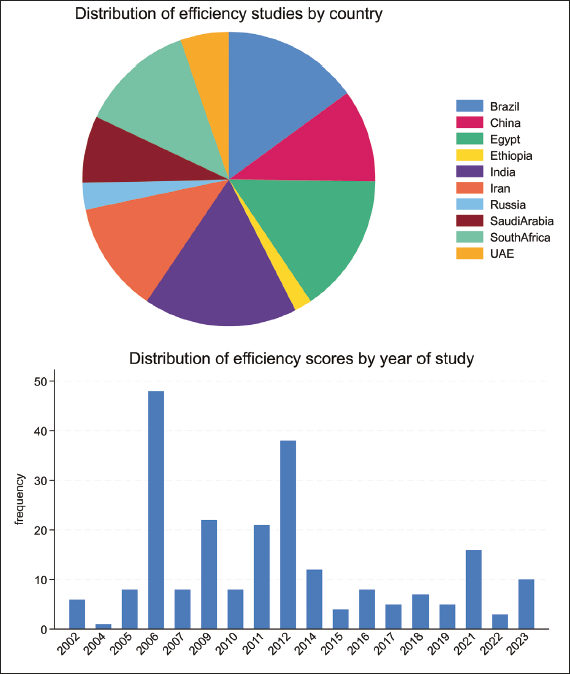
The chart indicates that the studies were published between 2002 and 2023, implying that national efficiency is a contemporary issue. Therefore, the findings of this study have significant implications for the design of future studies.
The average national efficiency is 0.7504, indicating that the BRICS+ countries can improve their national output by almost 25% by efficiently using available resources. The majority (79.13%) of the efficiency scores were obtained from the SFA method, while 20.87% were from the DEA method. Among the parametric studies, 76% assumed the translog functional form, while the remainder assumed the Cobb–Douglas function. Approximately 72% of nonparametric studies assumed CRS, while 28% assumed VRS. Most of the studies, 96%, were based on panel data.
The distribution of efficiency scores by study characteristics and technical estimation parameters is shown in Appendix B. On average, scores from the SFA (77.7%) are higher than those from the DEA (64.97%). Average efficiency scores are also higher in CRS models (71.63%) than in VRS models (66.57%). Panel data produced higher efficiency scores (0.7512) than cross-sectional data (0.7309). The heterogeneity is descriptive; a meta-regression analysis was required to validate the significance of these preliminary findings. The ensuing section presents publication bias tests, heterogeneity and meta-regression.
Before estimating the meta-regression model, the data was tested for publication bias. The funnel plot of the reported MNE scores against the inverse of the square root of the sample size is shown in Figure 2.
The plot shows that the distribution of the MNE scores is asymmetric, suggesting publication bias. The Egger’s test was applied to complement the funnel plot. The test results (with a
The I2 test of heterogeneity indicated substantial heterogeneity in MNE scores, with a value of 96.9%. Table 1 shows the results of the MFRM. The OLS, restricted maximum likelihood (REML) and weighted least squares (WLS) models were estimated to ensure robust results. Evidence suggests that study characteristics affect variability in efficiency scores. As shown in Table 1, the number of variables used in estimating the efficiency function positively and significantly impacts efficiency scores across all models. A unit increase in the number of variables results in a 0.3262 unit increase in national efficiency at a 1% significance level. This implies that studies estimating technical efficiency with more variables yielded higher scores, aligning with the findings of Villano and Tran (2019).
Meta-regression of Mean National Efficiency Scores.
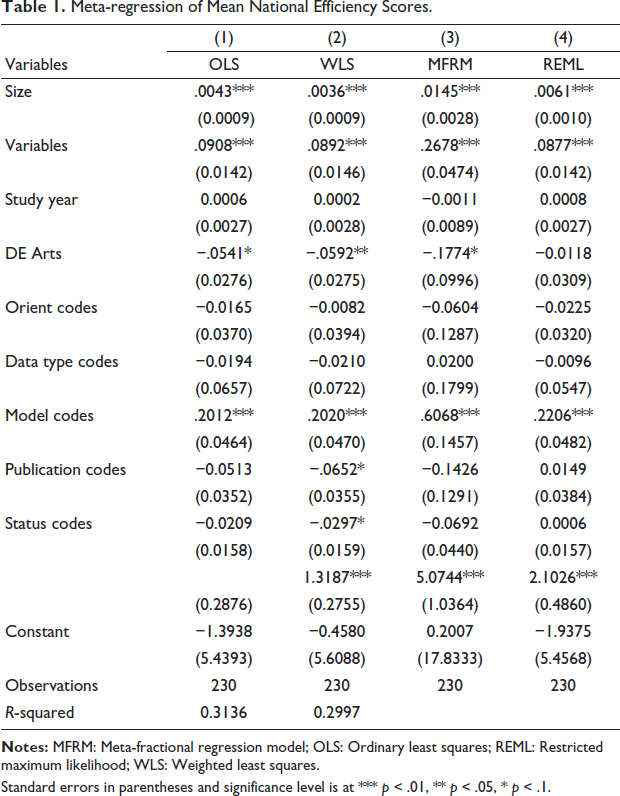
Standard errors in parentheses and significance level is at *** p < .01, ** p < .05, * p < .1.
The results also show that sample size positively and significantly impacts mean efficiency scores, indicating that MNE was higher in large-sample studies. The results imply that a unit increase in study sample size results in approximately 0.1866 units increase in mean national efficiency. This finding does accord with our prior expectations. One plausible explanation for this result is the dominant effect of parametric methods (SFA) in primary studies, constituting about 79%. The SFA method is less sensitive to sample size. The findings do not conform with those of Fall et al. (2018) who found that average efficiency decreased with sample size.
The study also shows that, on average, primary studies using SFA models report efficiency scores that are 13.75% higher than those using DEA models, a difference that is statistically significant at the 1% level. This difference may stem from variations in how each method models inefficiency and statistical noise. The finding is consistent with Chaffai (2022) and Samat et al. (2023).
Results suggest that returns to scale significantly impact MNE scores at the 10% significance level. On average, models assuming VRS technology yielded 2.64% lower MNE scores than those CRS models. The results do not align with our expectations but correspond to Angelini et al. (2024) findings. This suggests potential model misspecifications in the primary studies analysed in this research. Furthermore, DEA models assuming CRS tend to overestimate efficiency scores when extraneous variables are included (Galagedera & Silvapulle, 2003).
Regarding the effect of publication status, results from the WLS show that published studies yielded 6.52% lower efficiency scores than unpublished studies at a 10% significance level. The results imply that the manuscript review process moderates the efficiency estimates, resulting in lower efficiency scores from published studies. This finding is consistent with Fall et al. (2018) finding. The significance of the coefficient of the standard error (inverse of measure of precision) confirms the presence of publication bias in national efficiency metadata. Therefore, incorporating the standard error to control for publication bias was correct. Lastly, the data type, the orientation of the study and the year of study were insignificant and, therefore, do not seem to explain the heterogeneity of national efficiency scores. This study further examines manufacturing efficiency in BRICS+ countries.
The synthesis of manufacturing efficiency was based on 281 efficiency scores from 87 primary studies. The average was efficiency 0.659, implying a potential to enhance efficiency by 34.1%. The summary statistics in Appendix C reveal that average mean marginal effects (MME) vary with study characteristics. The trim and fill test for publication bias, shown in Appendix D, shows that scores were asymmetrically distributed, suggesting publication bias. The Egger’s and Begg’s tests in Appendix E confirm publication bias at 1%. Consequently, the study included the inverse of the square root of sample size among the moderators to control for publication bias.
A test for heterogeneity was also performed to ascertain the heterogeneity in the efficiency scores. The variance of the efficiency scores was,
Results show that published studies yielded 9.63% higher scores than unpublished studies at the 5% significance level. This finding aligns with Ogundari (2014) and Xu et al. (2023). It suggests that the peer review process ensures comprehensive data preparation and application of advanced methodologies, leading to higher efficiency scores than unpublished studies. Results also show that MMEs increase with the number of variables in the efficiency estimation model. A unit increase in variables results in 0.0759 unit increase in the MMEs. This finding shows the sensitivity of the DEA method to the number of integrated variables and aligns Fall et al. (2018) and Villano and Tran’s (2019) findings.
Meta-regression of Manufacturing Efficiency Scores.
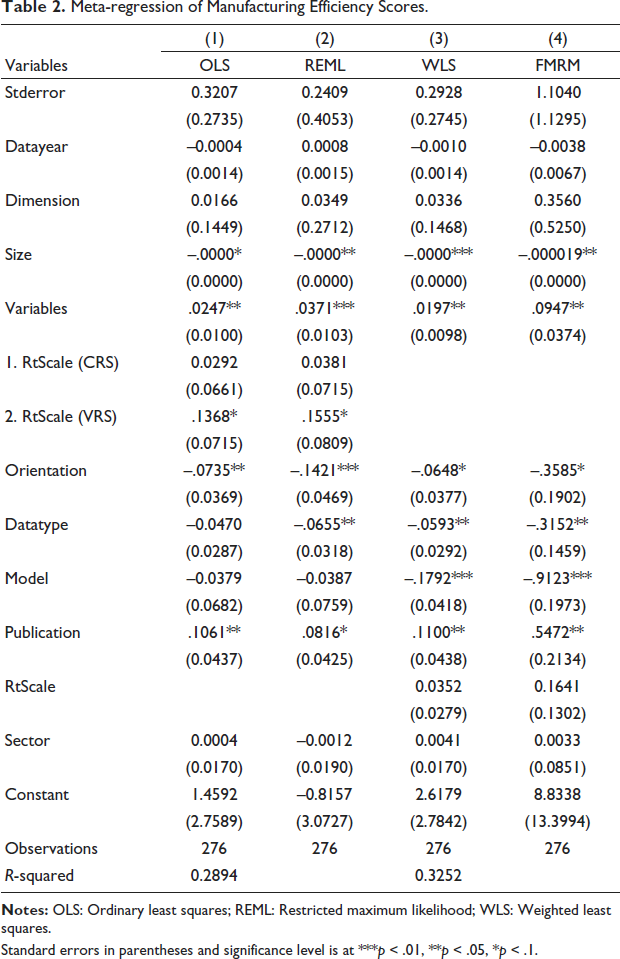
Standard errors in parentheses and significance level is at ***p < .01, **p < .05, *p < .1.
Results also show that sample size negatively affects the MMEs. These results are consistent with Fall et al. (2018) and Aiello and Bonanno (2019). One explanation is that a larger sample size increases the likelihood that additional firms are inefficient. Even if a few efficient new firms are added, a shift in the efficiency frontier could downgrade previously efficient firms, thus reducing MME.
Results also show that the estimation method significantly influences efficiency scores at the 10% significance level. Studies that applied the SFA yielded 10.29% lower scores than those using the DEA. The finding is consistent with Odeck and Bråthen (2012) and Xu et al. (2023). The reason may be that the SFA’s advantage of distinguishing the statistical noise from inefficiency is applicable when random shocks and measurement errors are present. In contrast, the DEA method attributes all deviation from the production frontier to inefficiency and ignores random noise; therefore, it potentially yields higher MME and typically generates more efficiency scores equal to 100.
The results show that MMEs from panel data studies were 14.95% lower than those from cross-sectional studies. This aligns with Geffersa and Agbola (2019) and Samat et al. (2023). This can be attributed to unobserved heterogeneity, measurement errors and endogeneity problems, which may reduce average efficiency. Additionally, cross-sectional data can overestimate MME due to static data prone to extreme values. Regarding the effect of study orientation, results show that efficiency scores from output-oriented studies were 8.51% lower than those from input-oriented models, conforming with Villano and Tran (2019). The study did find evidence of publication bias in the model with regressors; the (β1) coefficient for inverse size was significant. Lastly, the manufacturing sector and the year of study were insignificant in explaining heterogeneity in manufacturing efficiency.
Conclusion
This meta-analysis investigated the impact of study-specifics and methodological choices on the heterogeneity of manufacturing and national efficiency scores among BRICS+ countries. The mean manufacturing and national efficiency were 65.9% and 75.04%, respectively, suggesting potential improvement of 34% and 25%. The study confirms significant heterogeneity in efficiency scores influenced by methodological choices and study-specific attributes. Specifically, the SFA produced higher national efficiency scores, while the DEA yielded higher manufacturing efficiency scores. Published studies yielded lower national efficiency scores, but the reverse was true for manufacturing efficiency scores. Input-oriented models reported higher scores, while larger samples had lower scores, especially in DEA models. Contextual factors like income status and the manufacturing sector had minimal impact. Furthermore, the MME of 65.9% and MNE of 75.4% signify substantial potential for growth through improved efficiency. The lagging manufacturing efficiency highlights the need for BRICS+ policymakers to implement policies that enhance the manufacturing sector.
Lastly, it is important to recognise that efficiency estimates are sensitive to study details, and this study has limitations despite our efforts to control for heterogeneity and selection bias. Our meta-analysis is inherently constrained by its reliance on independent studies and the available metadata set.
Footnotes
Acknowledgement
The authors are grateful to anonymous referee of the journal for useful comments. Views are authors’ own. Usual disclaimers apply.
Declaration of Conflicting Interests
The authors declared no potential conflicts of interest with respect to the research, authorship and/or publication of this article.
Funding
The authors received no financial support for the research, authorship and/or publication of this article.