
Abstract
The Indo-Pacific blends a multitude of regions and melds a panoply of security architectures. Some regions are peaceful, with occasional spurts in environmental disasters and non-traditional security challenges, while others are typified by instability and security-dilemma. The Gulf region is a unique arena of the Indo-Pacific, that has stirred a virulent concoction of the oil economy, regional rivalry and US hegemony. Over a century ago, oil discovery has not just made the region wealthy but has also transformed it into a veritable Western Lake. But lately, two significant developments have begun to unravel this homeostatic condition—a tumble in oil prices and US retrenchment from the region. This is likely to have a profound influence on the regional security order. This article examines the role of oil in defining the security architecture of the region. It establishes the effect of demand-supply imbalance and the oil-price-futures on the economy of Gulf countries. Finally, it evaluates the impact of US retrenchment, and the 2020 oil price tumble, on the long-term stability of the region.
JEL Codes: F52, F56, Q22
Introduction
At the turn of 2020, oil-producing countries were confronted with the twin shocks of a deep plunge in oil prices and a simultaneous outbreak of COVID-19 pandemic. The virus has not only claimed lives, but has also led to a negative demand-shocks due to economic disruption in the global value chain and reduced business opportunities. Its effect has been further aggravated by the inability of the Organisation of Petroleum Exporting Countries (OPEC) and OPEC+ countries in reaching an agreement on substantially cutting oil production. As a result, Brent crude’s spot price fell to less than US$19 in April 2020. The futures price suggests that the Brent crude would hover around US$40 in 2020–2021, which is significantly less than the fiscal breakeven price of all Gulf countries. Despite high gross domestic product (GDP) per capita, Gulf economies are unsustainable and unstable. Unsustainable because their economies are founded on a depleting commodity and unstable because of political legitimacy. Thus, the twin shock has resurrected the fears of regime survival, similar to one witnessed during the Arab Spring in 2011–2012. Amidst the ongoing economic turmoil, the prospects of US retrenchment from the Gulf region have compounded the uncertainties. An intensification of conflicts has unsettled the security architecture in the region. A combination of all these factors is likely to have a profound impact on regional stability. This article examines the role of oil in defining the security architecture of the region. It establishes the effect of demand–supply imbalance and the oil-price-futures on the Gulf economy. Finally, it evaluates the impact of US retrenchment, and the oil price tumble on the long-term stability of the region.
The remainder of the article is organised as follows: the second section discusses the role of oil in the regional security architecture. The oil price and its effects on the Gulf region are addressed in the third section. Impact of US retrenchment of oil price tumble are discussed in details in the fourth section. The concluding remarks are drawn in the final section.
Role of Oil in the Regional Security Architecture of the Gulf Region
In the middle of World War II, realising the significance of oil to national and economic security, President Franklin Roosevelt had declared that ‘defence of Saudi Arabia is vital to the defence of the United States of America’. Consequently, in 1944, the Arabian American Oil Company (Aramco) and three other American oil companies (Exxon, Mobil and Texaco) joined SoCal as equal partners. Immediately after the war, the USA–Saudi relationship was formalised by an official agreement between President Roosevelt and King Abdulaziz, that assured exclusive US access to Saudi oil in return for protection to the Al-Saud regime (Askari, 2013).
Although commercial production of oil started in the Gulf at the turn of the twentieth century, until the 1960s, it was foreign oil companies that explored, produced and transported oil. The Gulf region was considered to be a veritable Western Lake. With political and military support of their governments, Great Britain, the USA, France and Italy exploited the oil wealth at the expense of local populace until the early 1970s. They dealt with dictators, kings, or presidents and coerced them with boycotts and military intervention (Askari, 2013). The first high profile confrontation between an oil-producing Gulf country and a western petroleum company occurred in May 1951, when an elected Prime Minister of Iran, Dr Mohammad Mosaddeq, nationalised Iran’s oil fields. It led to the removal of Mosaddeq from his office in 1953 by the British and US intelligence agencies in collusion with Iranian political opponents (Bayandor, 2019). This incident stamped western suzerainty in the region and vindicated the primacy of oil as a driver for the region’s security architecture.
Until the early 1970s, the Gulf’s security architecture was controlled by the United Kingdom (UK). After that, the USA has maintained an overbearing presence in the region (Soubrier, 2020). Having learned from the perils of enforcing Pax Americana in Vietnam, the USA was not keen on stepping into the UK’s shoes. But the oil fields of the Gulf and the shipping lanes of energy could not be left unattended, especially in the light of a friendship treaty between Iraq and the Soviet Union in April 1972. The strategy adopted by the USA was known as the Nixon Doctrine. It envisaged drawing down on US presence in Asia and propping up amiable proxies to protect its interests. It was prepared to provide its allies with the requisite weapons and training. Consequently, Mohammed Shah Pahlavi, the monarch of Iran, was propped up as the Guardian of the Gulf (Cooper, 2011). But the Iranian revolution in 1979, turned the tide against Iran and kindled the dormant USA–Iraq relationship. Briefly, though, Saddam Hussain was projected as the regional ally in the 1980s (Markakis, 2016).
The Carter Doctrine came into effect in response to the Soviet invasion of Afghanistan in 1979, and the taking of 66 hostages in November 1979 by Iran (FRUS, 1979). President Carter had declared that ‘An attempt by any side to gain control of the Persian Gulf (oil) will be regarded as an assault on the vital interests of the US … and will be repelled by all necessary means, including military force’ (Tisdall, 2020). Thus, the Carter Doctrine formally justified the US military’s presence and the exercise of its hegemony, to a degree unmatched even at the height of British imperialism. British domination was expressed far more indirectly through the stability and loyalty of its protectorate, rather than absolute military power projected by the USA (Gause, 2019).
Between the first Gulf War in 1991 and the terror attack on the World Trade Centre in 2001, the Clinton administration had adopted a strategy of dual containment of Iraq and Iran (Sokolsky, 2003). After 9/11, the Bush Doctrine stepped-up its domination by authorising pre-emptive and preventive actions (White House, 2002). Promotion of democracy had been a feature of the US foreign policy ever since the dawn of the twentieth century. But the USA had turned a Nelson’s eye on democratisation, of the Middle East, for the sake of oil. However, the terrorist attacks on 11 September 2001 led to a change in its perceptions. Democracy deficit in the Middle East was considered as the primary reason for instability (Markakis, 2016). As a result, Iraq became the first casualty in 2003. It had also coincided with a decade of US unipolar moment.
The USA protected its energy interests in two distinct ways—military interventions and expansive military infrastructure in the region. It intervened twice in Iraq (1991, 2003), liberated Kuwait (1991), fought Iran including a tanker war (1987–1988), unleashed the global war on terror since 9/11 and imposed the ongoing sanctions against Iran. The second benchmark of US domination was the sheer size of its physical military infrastructure. For example, the USA operates numerous drones out of Saudi Arabia, has army facilities in Iraq and Kuwait, hosts a major Air Force Command Centre in Qatar and has based the US Navy Fifth Fleet in Bahrain. Besides, a large inventory of fighter jets and missile systems in Gulf countries provide the USA with the justification for positioning its technicians. The USA also maintains the logistic capacity to implant special forces into any country at short notice. It also operates an extensive network of satellite and reconnaissance facilities to monitor the region (Yom, 2020).
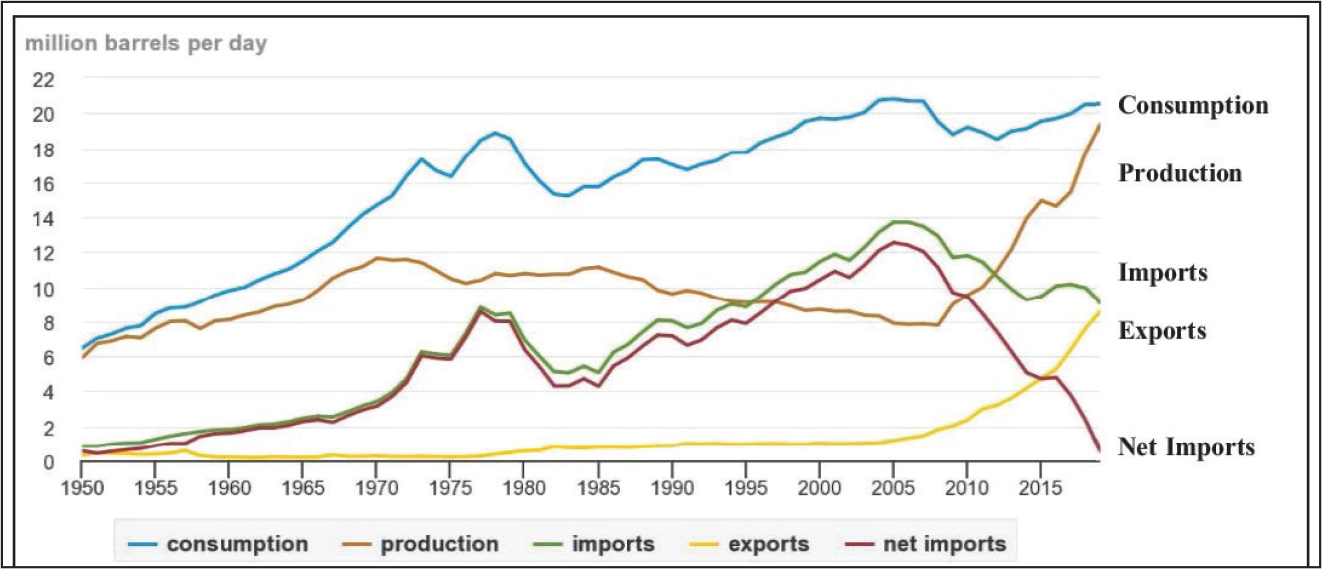
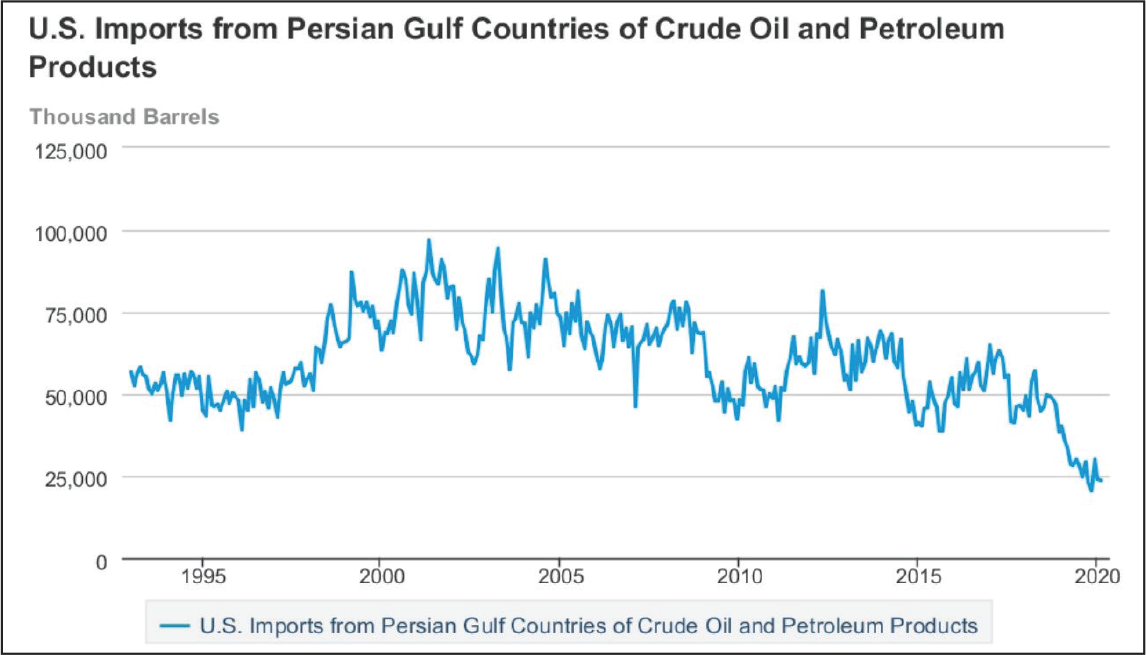
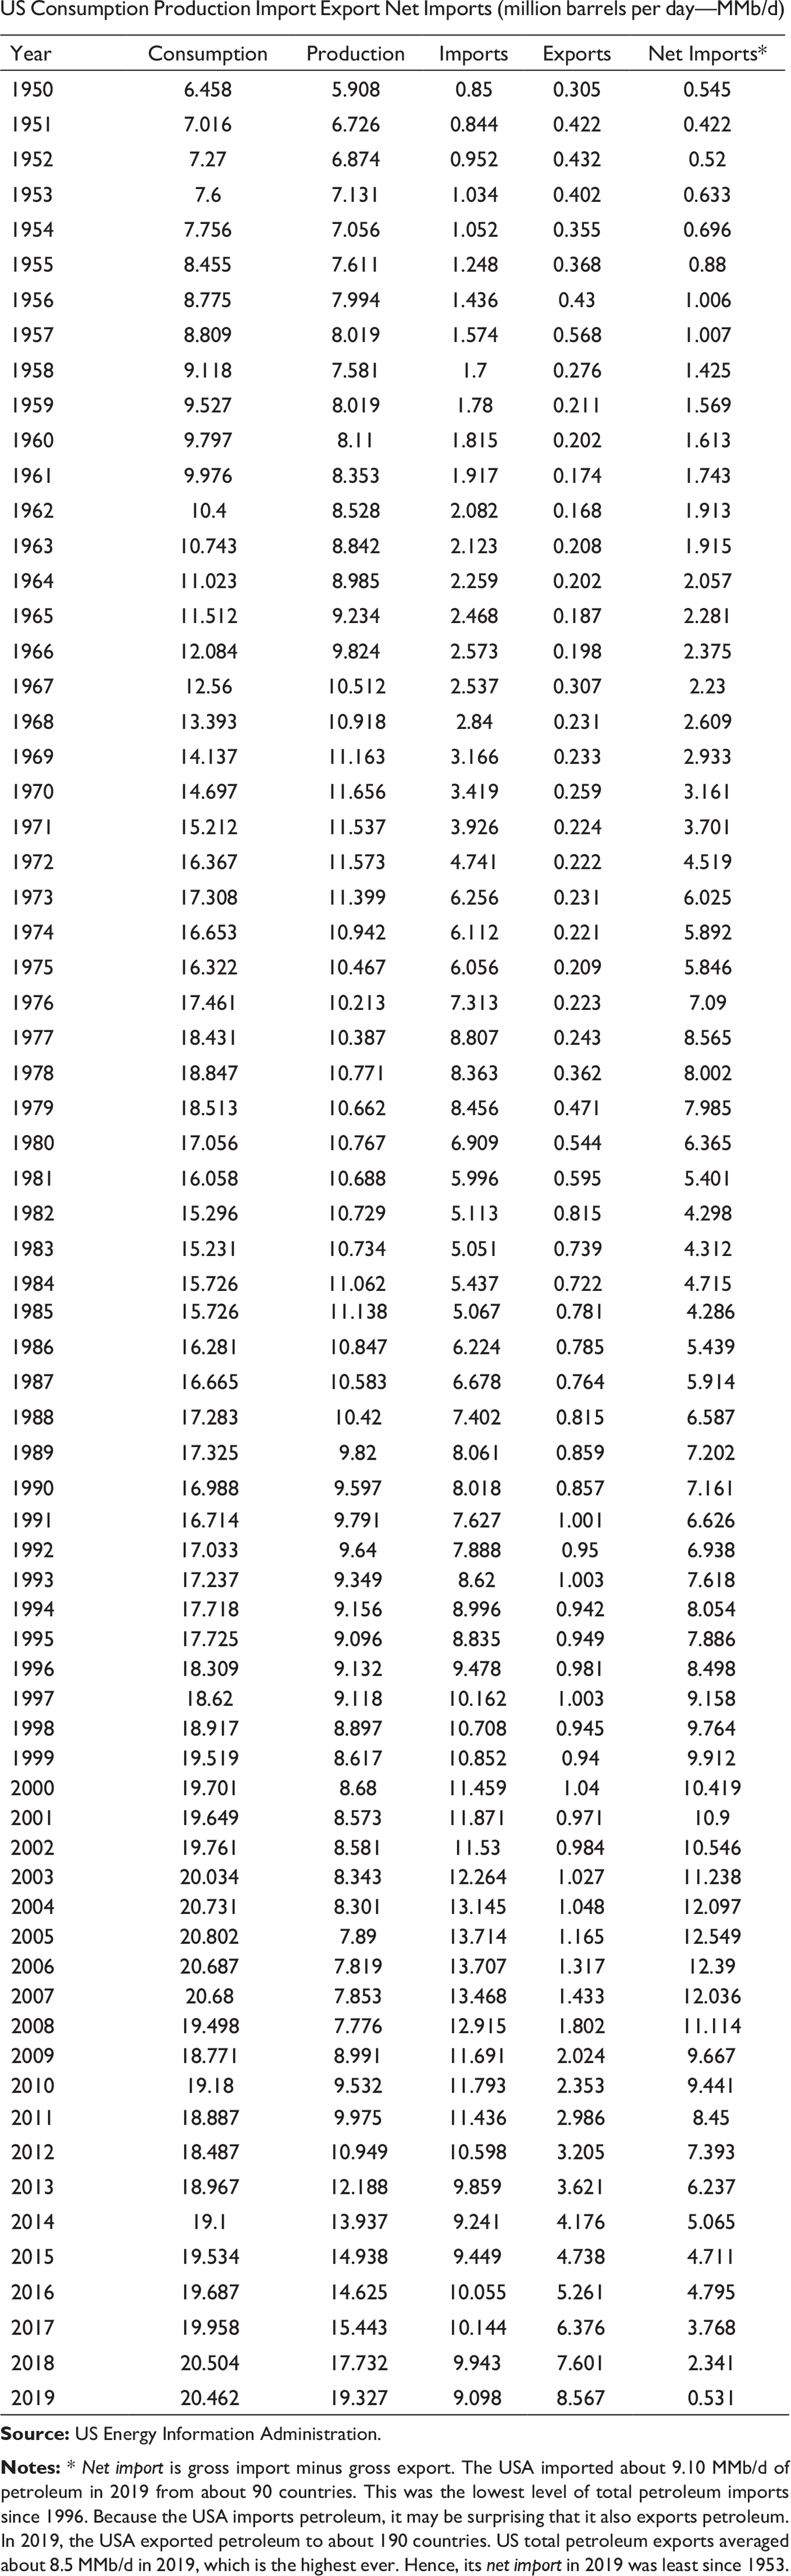
It could, thus, be reasoned that the US dependence on Gulf oil informed its foreign policy and its dominance shaped the security architecture of the region. However, with the commencement of President Bush’s second term in 2005, US’ overall oil imports had started to decline (Figure 1, also refer to Appendix A), along with imports from the Gulf (Figure 2). This article argues that the commencement of decline in US oil imports in 2005 is often overlooked and could be considered as an inflexion point. The effects of this change were to be felt in the following Obama and Trump administrations and was to have a profound impact on the security architecture of the Gulf in the coming years.
The Gulf was essential to the USA for containing communism and protecting its energy interests (Yom, 2020). With the end of the Cold War, communist ideology ceased to be a concern. But criticality of the region did not dwindle till the time US domestic oil production picked up (Figure 1). It can be found that a drastic shift in the US’ Gulf policy from the Carter Doctrine to Trump Doctrine, is largely driven by US’ energy interests. Under the Trump administration, successive attacks on oil tankers in the Gulf in May and June 2019 and missile attacks on Saudi’s Aramco oil fields in September 2019, did not provoke the usual retaliatory actions from the USA (Arab Centre for Research and Policy Studies, 2020). Some argue that these are the signs of an imminent US retrenchment. The gradual but deliberate recoil of US interests in the Gulf commenced during the Obama administration. It could be attributed not only to a change in the strategic outlook of the elites but also to a more profound structural shift on how the USA had started to perceive the Middle East. After America got bogged down in Afghanistan and Iraq, the Obama Doctrine demoted the Middle East and North Africa (MENA) from the centrepiece of its foreign policy. Since then there has been considerable continuity between Obama and Trumps’ foreign policy towards the region.
Amidst the transformative changes in US foreign policy on Gulf, the USA–Iran tensions have remained fairly constant since 1979. It got heightened after the Trump administration decided to withdraw from the 2015 Joint Comprehensive Plan of Action (JCPOA). More recently, it has been further aggravated by the killing of Qasem Soleimani, the commander of Iran’s Islamic Revolutionary Guard Corps-Quds Force (IRGC-QF), on 3 January 2020. Attacks on the critical oil infrastructure in Saudi Arabia, in September 2019, demonstrated that Iran was capable of engineering considerable damage on the USA and its allies (Katzman et al., 2020). An imminent US retrenchment seems to have intensified the competition between Iran and Saudi Arabia for influence and hegemony and has provided them greater space for shaping the regional security architecture.
Conflicts between Iran and Saudi Arabia have more roots than the traditional Sunni–Shi’a divide. An imminent US retrenchment has provided them greater space and intensified the competition for influence and hegemony in the region. Iran played a decisive role in halting Islamic State (IS) expansion into Iraq and Syria. It has also supported the Houthis in order to resist Saudi Arabia and its allies. Saudi Arabia consider Yemen as its backyard and do not appreciate Iranian influence in its southern neighbourhood. Likewise, Iran does not want Saudi Arabia to undermine the Houthis and Zaydis. Saudis also accuse Iran of interference in Arab politics and for creating proxy groups like Hezbollah in Lebanon (Mousavain, 2018). The oil economy enables them to sustain such proxies in the region. But this could change after the twin shock of oil price tumble and demand–supply imbalance post-COVID-19 pandemic.
It can be summarised from the above discussion that oil has provided wealth and prosperity to the Gulf countries. But it has also attracted foreign powers into the region. The security architecture of the regions was dominated by Great Britain till the 1970s and thereafter by the USA. Oil has also provided the Gulf states considerable economic leverage to vie for influence and dominance in the region.
Trends in Oil-price and Effect on the Gulf Economy
Despite diversification into non-oil sectors like infrastructure, tourism, health and logistics, for over a decade, the economies of eight Gulf countries remain heavily dependent on oil and gas exports. According to the International Monitory Fund (IMF), the fiscal breakeven price per barrel for 2019 were: US$67 for UAE, US$83 for Saudi Arabia, US$45 for Qatar, US$53 for Kuwait, US$56 for Iraq, US$93 for Oman, US$106 for Bahrain and US$245 for Iran (IMF, 2020). Analysts typically look at the fiscal breakeven price, which is the minimum oil price per barrel that an oil-producing country can afford to balance its fiscal budget. If the oil prices go below this level, the country faces a budget deficit (Clayton & Levi, 2015). An unprecedented oil price crash in 2020 saw the prices of the OPEC basket tumble from a spot price of US$71 on 6 January 2020 to US$27 on 15 May 2020 (Quandl, 2020) (Figure 3). Non-OPEC countries have also been hit by a similar plunge.
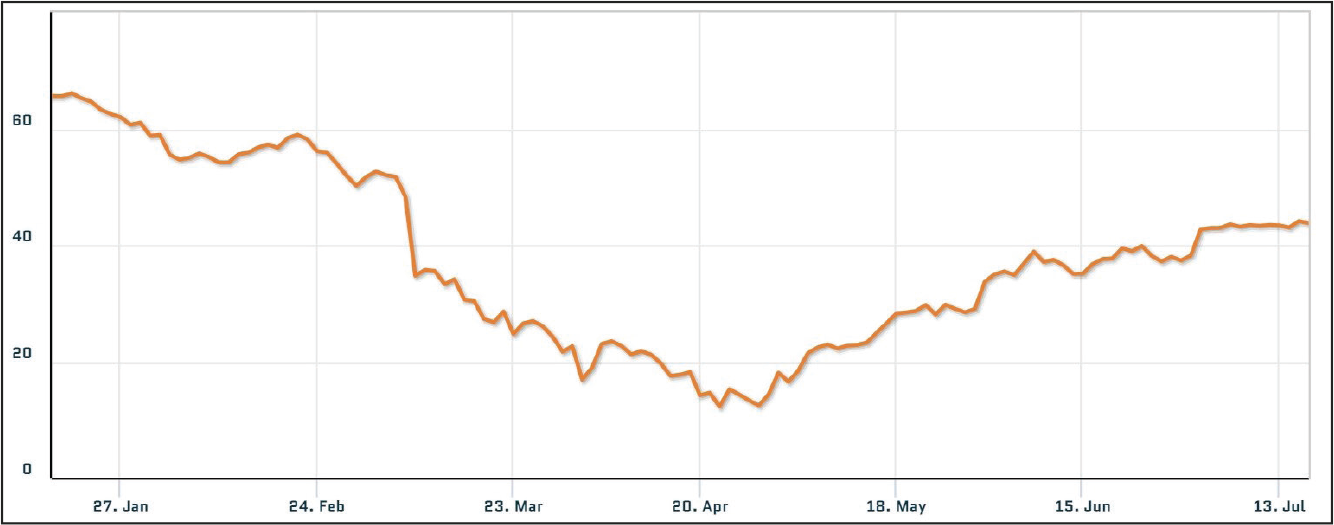
Failing to reach a consensus on production cuts in Vienna on 6 March 2020, led to an all-out price war between Saudi Arabia and Russia (Raza, 2020). The OPEC basket price reached an all-time low of less than US$19 (Quandl, 2020). Portentously, the price war coincided with an equally unprecedented event of a global pandemic due to the COVID-19 outbreak. Thus, the economic impact of low oil prices got further aggravated by a sudden fall in oil demands. Against this backdrop, two crucial questions arise—how will the countries adapt to the situation and how long will the backwardation trends continue.
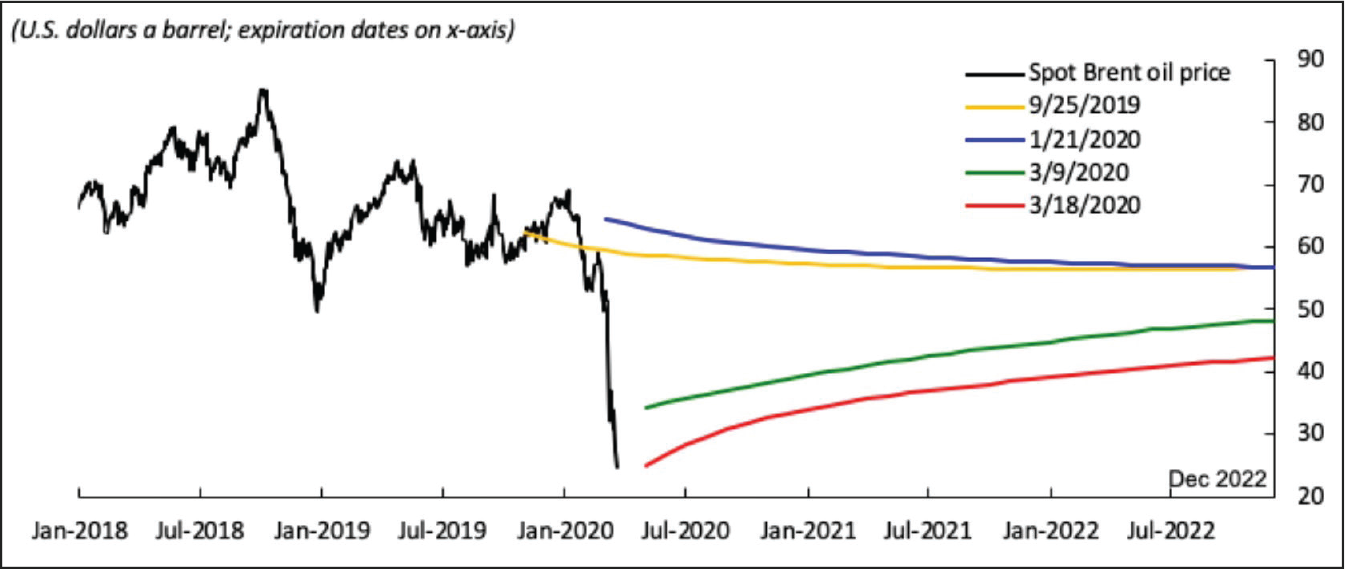
Among many factors that influence oil prices, storage capacity is one of the significant indicators that provide the likely path of future oil prices. The current global oil production is 90 million barrels per day (bpd) and consumption is 75 million bpd. One way to offset the supply–demand imbalance of around 15 million bpd is by storing excess oil. The global oil storage capacity stands at 6.7 billion barrels. International Energy Agency (IEA) estimates that in January 2020, oil storage holding was 4.2 billion bbls, representing utilisation of 63 per cent. Due to overproduction, it is expected that 80 per cent of the nameplate capacity, which is the maximum operational level, would be filled by early June 2020. Floating tanker storage offers an alternative, but very large crude carrier (VLCC) rates have skyrocketed to US$100,000 per day for a 3-months charter (Seafong, 2020). Hence, there will be no storage capacity to absorb overproduction. It will continue to affect the futures price. The futures contract for Brent Crude expiring in July 2020, was trading at US$35 per barrel on 15 May 2020 (Bloomberg, 2020). If the supply-demand imbalance is not corrected before the contracts’ expiry, the contango will remain shallow and prices could hover around US$40 per barrel, well into 2021 (Figure 4). US$40 per barrel is well below the fiscal breakeven price of all Gulf countries.
While the collapse of oil prices hurts every oil-producing nation, the impact on each is not uniform. A study of fiscal deficits underscores several dynamics. First is the budget surplus or deficit. Kuwait had a budget surplus of 6.7 per cent of the GDP in 2019. Saudi Arabia has been facing a deficit for the last 6 years, resulting in a rise in government debts to 23 per cent of GDP. By contrast, Russia has shown a budget surplus in 2018 and 2019, amounting to 16 per cent of GDP. Second, are the mitigation measures. While some countries like Oman and Kuwait are amid multi-layers austerity measures, Saudi Arabia continues to spend, despite a sharp decline in revenue. Finally, each state has different levers to adapt to the ongoing crisis. Russia has flexible exchange rates and oil production costs denominated in local currency. Countries like Saudi Arabia have ample foreign currency reserves as a buffer. Hence, it can be found that each nation has begun from a different start point, and their resilience to stem the crisis depends on the many variables, the cost of oil being one of them (Tsafos, 2020).
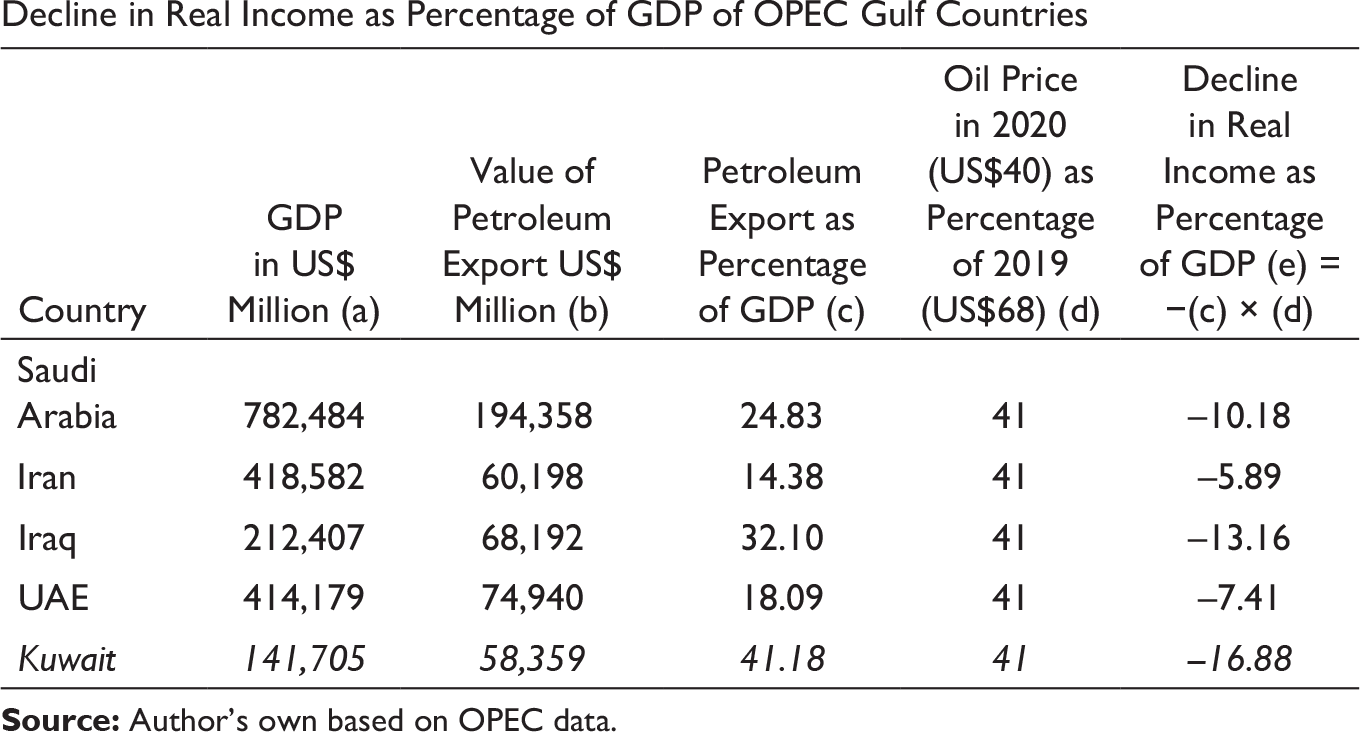
The twin shock of COVID-19 and price war are intertwined but distinct. The negative supply and demand shock due to COVID-19 are expected to be short-lived but dramatic. The demand-supply imbalance might recover once the pandemic subsides, but the resilience will depend on the length and depth of disruption. Effect of COVID-19 on the economy of the OPEC Gulf countries can be sensed by calculating the decline in real income as a percentage of GDP (Arezki & Nguyen, 2020). It can be obtained by multiplying the petroleum exports as percentage of GDP (2018) with percentage by which Futures price of oil price (US$40) has reduced to the average price of 2019 (US$68). For example, petroleum export as a percentage of GDP of Saudi Arabia in 2018 reduced by 25 per cent (Appendix B), and the percentage reduction of futures oil price for 2020 vis-a-vis the average price of 2019 is 41 per cent (100 × (68 − 40)/68). Then the decline in real income as a percentage of GDP is 10 per cent (25 × 41/10000) of the GDP. Similarly, impact on other OPEC Gulf countries would be—Kuwait 17 per cent, Iran 6 per cent, Iraq 13 per cent and UAE 7 per cent (Figure 5). Decline in real income of Qatar, Oman and Bahrain would be in similar range, but has not been plotted due to unavailability of data. Tabulation of the histogram is in Appendix B. To draw a comparison, a 10 per cent decline in India’s GDP would be equal to approximately ₹20 lack crores or US$300 billion, which will indeed cause a substantial impact on India’s economy for many years to come. Other factors of economic slowdown due to the pandemic will only tend to aggravate the impact on the Gulf countries.
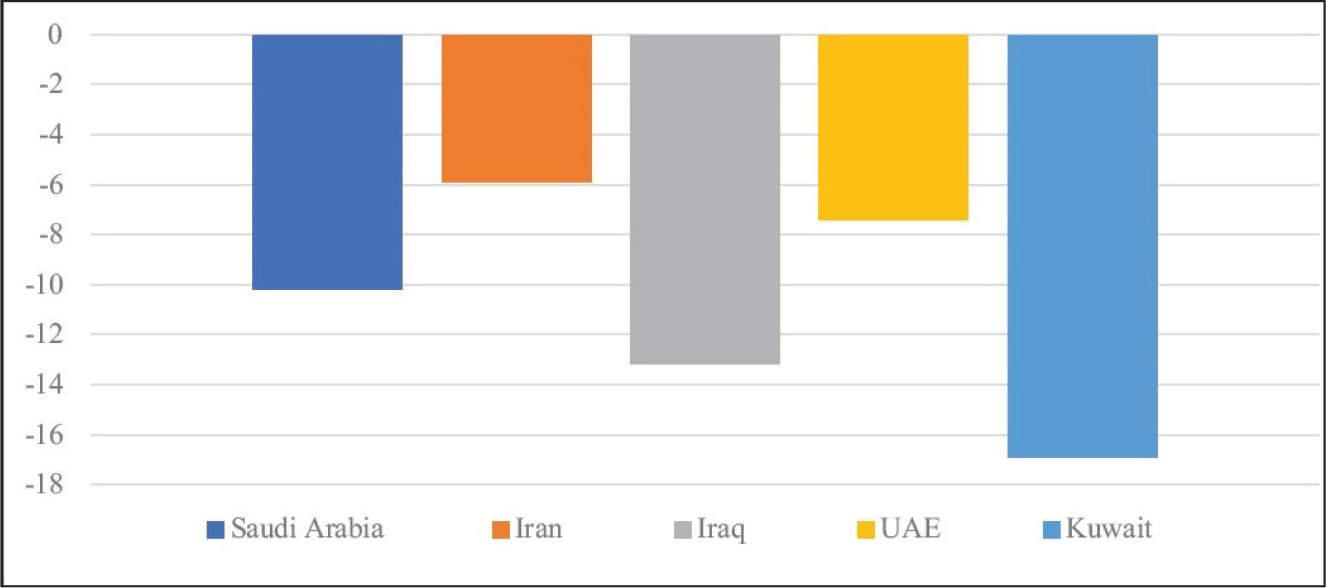
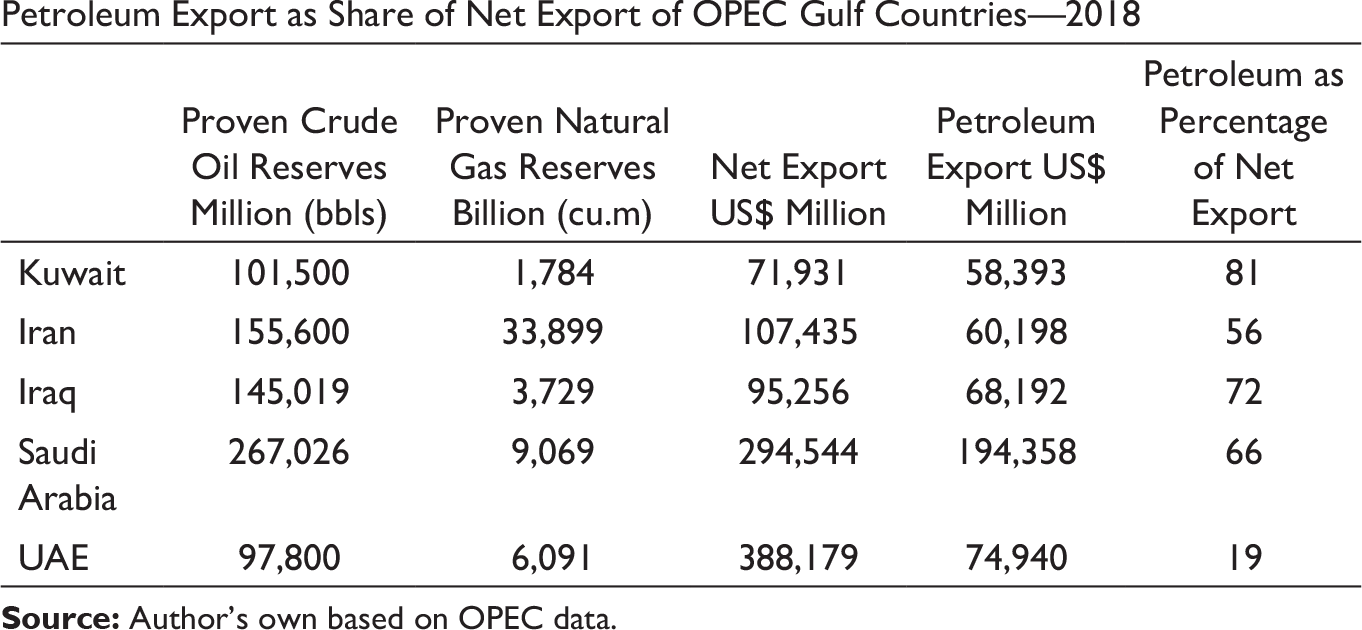
Islam and oil have been the two primary forces that have shaped the political contours of the Gulf. While Islam has been a ubiquitous factor for 1,400 years, oil has been a relative newcomer for the past 100 years. Today, oil and the Gulf are inseparable (Askari, 2013, p. xv). It is the backbone of the Gulf economy and forms a substantial share of the countries’ net export. For example, petroleum exports of OPEC Gulf countries as a share of their net export constitute—81 per cent for Kuwait, Iran 56 per cent, Iraq 72 per cent, Saudi Arabia 66 per cent and UAE 19 per cent (Appendix C). It can thus be found that most countries in the Gulf, including the dominant regional players like Iran and Saudi Arabia, depend heavily on oil exports. Hence, a decline in real income from oil, of the magnitude illustrated in Figure 5, is bound to have a long-term impact on their economies and military spending. Consequently, it can be argued that all Gulf countries are currently confronted with a harsh and unsustainable economic situation, which would fundamentally affect their ability to influence the region’s security architecture.
Impact of US Retrenchment and Oil Price Tumble on the Stability of the Gulf Region
Hegemonic theory informs that the relative decline of a hegemon undermines its ability to defend a favourable international order (Gilpin, 1981). Balance of power theory argues that any shift in the balance poses a threat to the survival of the dominant power (Wolfer, 1962). Transition theory advocates that the relative decline of a leading state creates opportunities for the challenger to change the status quo (Organski, 1968). Against the backdrop of China’s rise, each of these theories suggests that the relative decline of the USA would undermine its stature and consequently it must respond. However, these theories ignore the dynamic nature of structural changes in the international system and the limitations of domestic resources. When commitments have overstretched, a reorientation of foreign and security policy would be required. Retrenchment is one such policy that enables cutting the costs of security, risks and burdens. It can accrue positive outcomes if, in the end, the strategic solvency can be left intact. (Robinson, 2019).
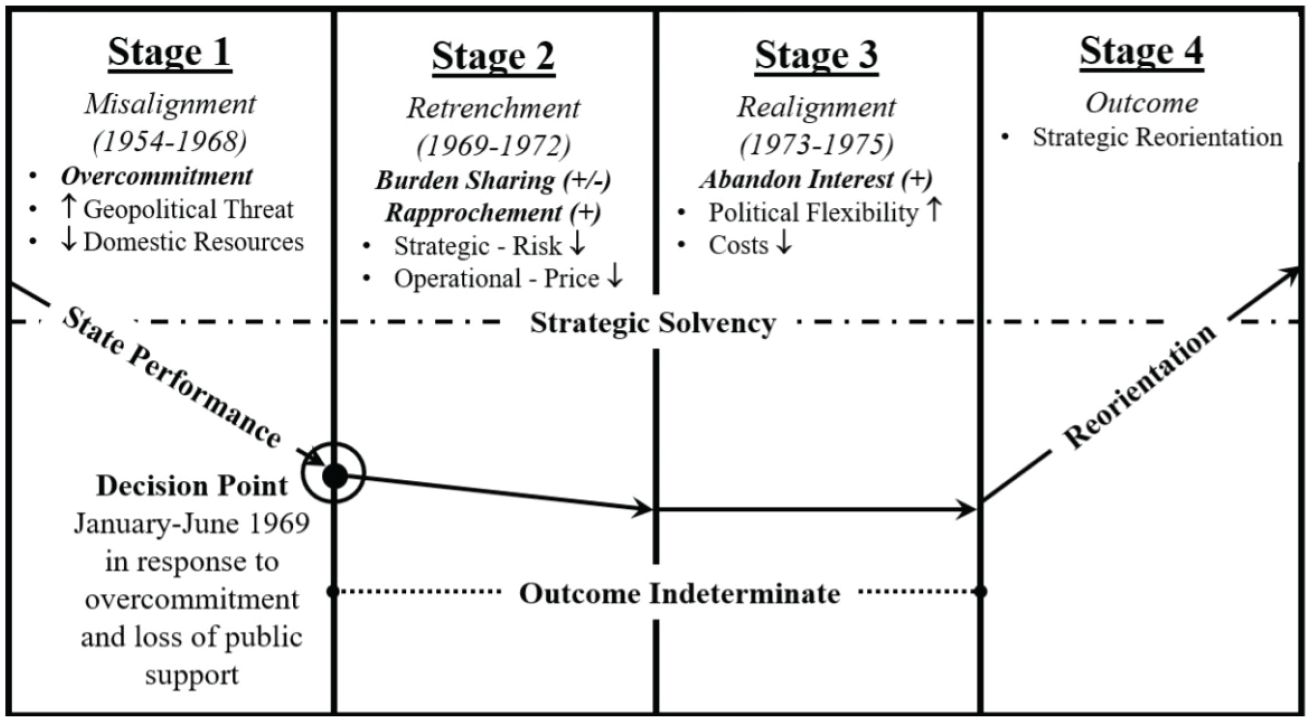
President Nixon’s retrenchment from Southeast Asia during the Vietnam War is considered a success, as, in the end, the USA managed to retain its strategic solvency (Figure 6).
Nixon and Kissinger had rightly identified the misalignment (stage 1) between the US foreign policy and structural changes of the international system. Threats to US supremacy were on the rise due to the rising powers of western Europe and Japan. The Soviet Union had also achieved strategic parity. Vietnam war had depleted US resources due to overcommitment. As a result, the Nixon administration opted for retrenchment (stage 2) in 1969. It tried to initially share the burden with its ally, South Vietnam, which turned out to be unsuccessful. Fortuitously, its rapprochement with the Soviets and China turned out to be a success. The USA then realigned its foreign policy (stage 3) by forsaking its interest in the Asia-Pacific, which paved the way for North Vietnam taking over the South. The outcome was a reorientation (stage 4) in the US foreign policy towards other vital regions like the Gulf. Nixon’s retrenchment is considered a success, as the USA managed to preserve its strategic solvency. Neither did its policy damage other allies in the region like South Korea, the Philippines and Thailand. Nor did it encourage any aggression from its adversaries—the Soviet Union and China (Robinson, 2019).
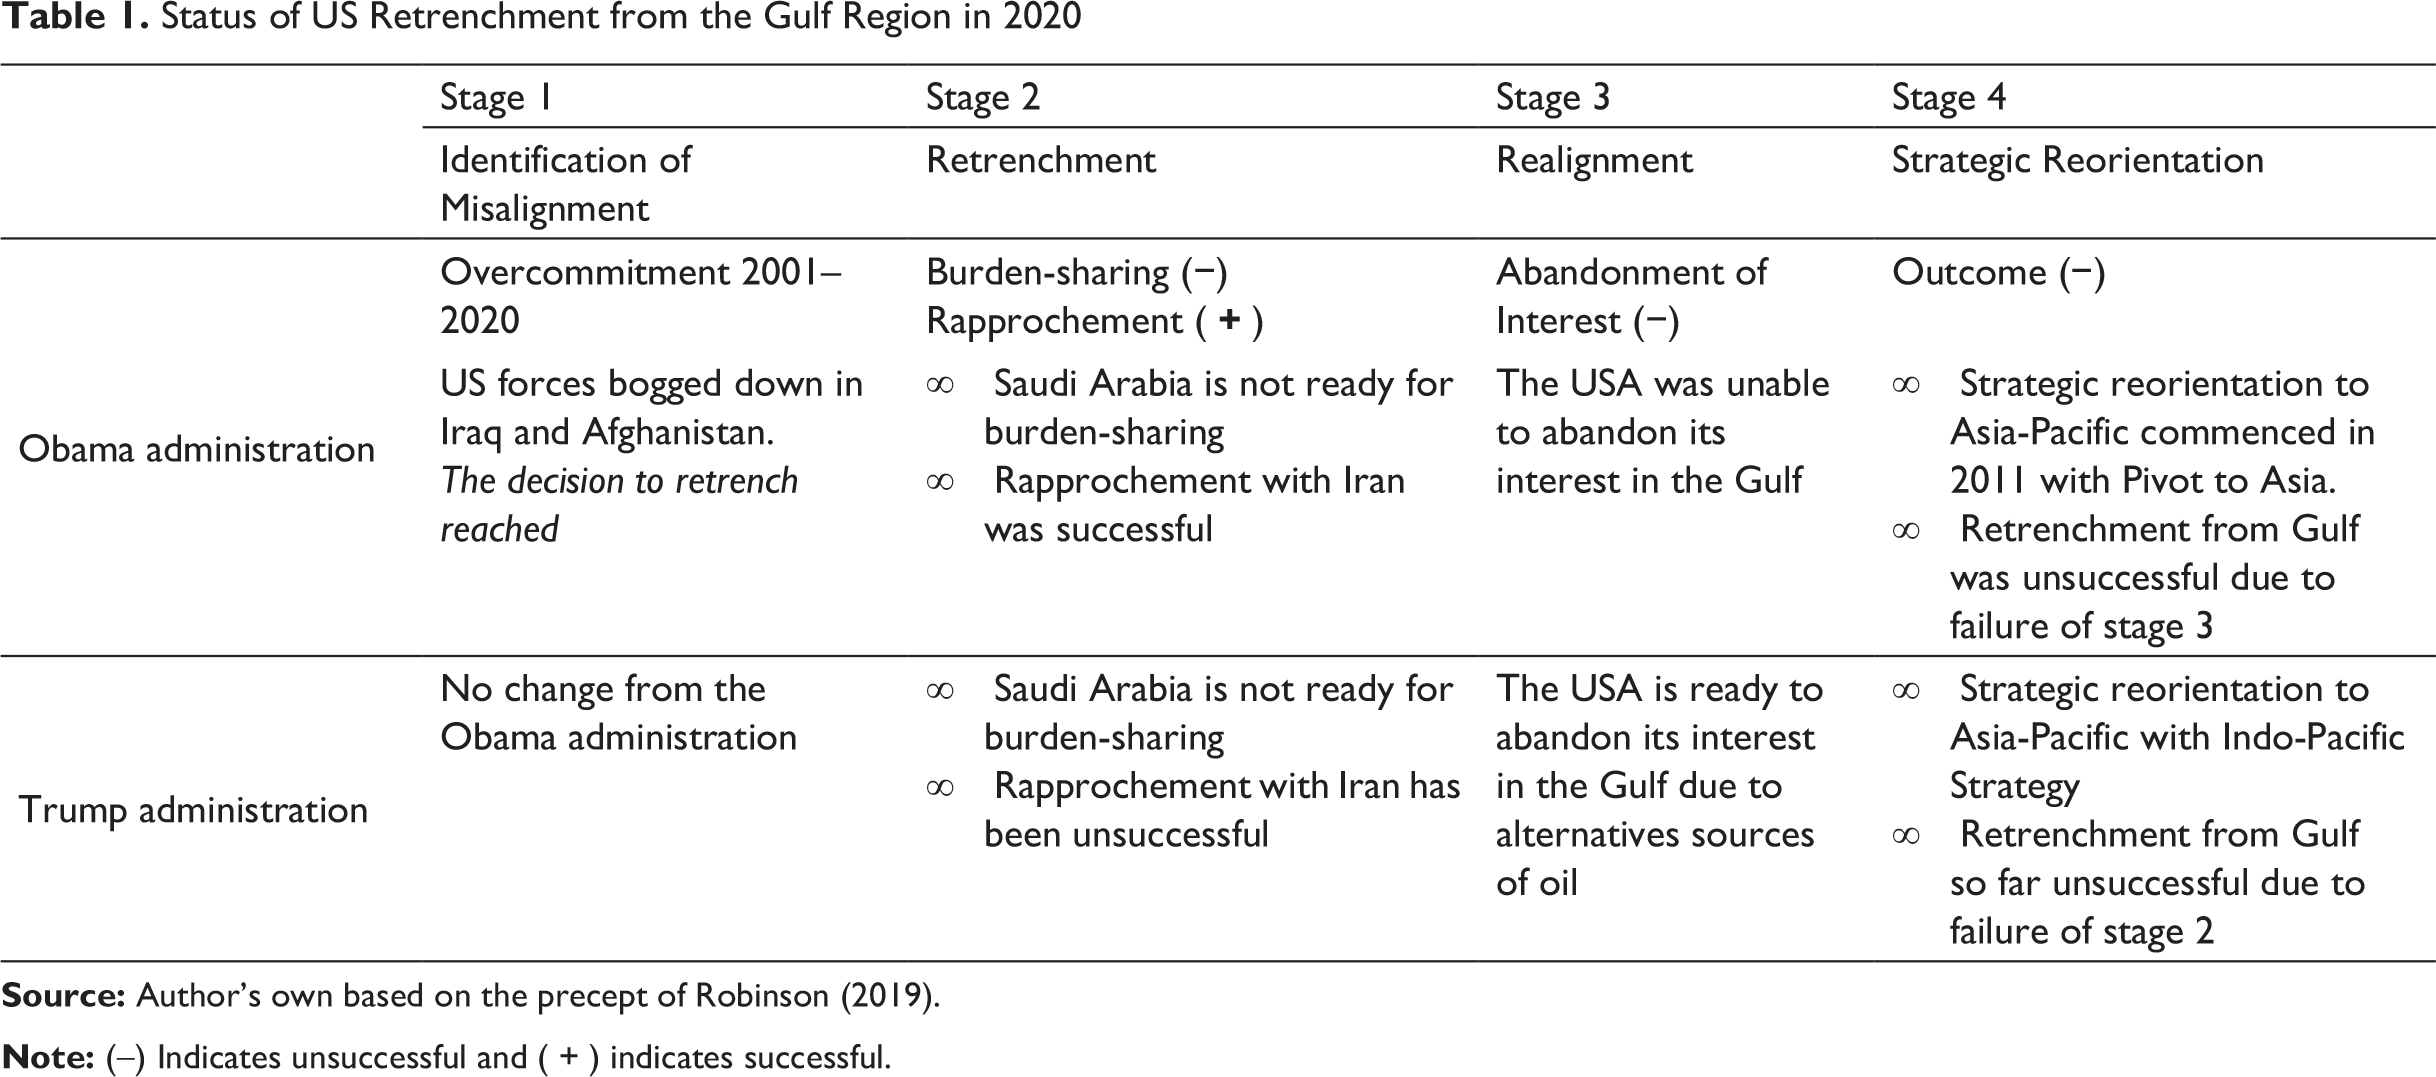
A similar analysis can be undertaken for the Gulf region to evaluate if the US policy of retrenchment is headed in the right direction. President Obama was faced with a similar situation as Nixon, when the US forces got bogged down in Iraq and Afghanistan, followed by the financial crisis in 2008 (stage 1). Subsequent turmoil due to the Arab Spring and the expanding influence of Iran had sparked intense debate on the need to withdraw. Though Saudi Arabia failed to take over the burden of security, Obama managed to establish a rapprochement with Iran. So, Obama achieved success in stage 2. But he could not abandon US interests in the Middle East altogether (stage 3). He intervened directly and indirectly, in Libya and Syria in 2011. Therefore, he was unable to relinquish the US military commitments in the Gulf. Due to the failure of stage 3, Obama failed in his attempt to retrench from the Gulf (Robinson, 2019; Table 1).
US foreign policy towards the region changed once again after President Trump assumed office. With no change in stage 1, the Trump administration altered stage 2 drastically by breaking the rapprochement with Iran. But, maximum pressure on Iran and withdrawal from JCPOA has not achieved any significant strategic effect. So, Trump reversed Obama’s success of stage 2. However, with regard to stage 3, Trump has been more successful than Obama. He managed to progressively abandon the US interests in the Gulf region (Figure 7). Oil imports from the Gulf have reduced drastically since Trump assumed office in 2016 (Appendix A). Net Import in 2019 was the least since 1953. Other regions of the world have emerged as more critical players in oil trade. The cumulative annual growth rate (CAGR) of Gulf countries for the period 2000–2018 is less than that of the USA, Russia, Brazil and Canada (Appendix D). The US Congress has also introduced a No Oil Producing and Exporting Countries (NOPEC) bill to block oil imports from Saudi Arabia and seek compensation for the crash in oil prices, by making oil-cartels illegal (US Congress, 2019).
It can thus be reasoned that US retrenchment would be successful only if President Trump can find a suitable ally for burden-sharing in the Gulf and/or can reach a rapprochement with Iran (stage 2). If that happens, the USA would be able to retain strategic solvency post-retrenchment. In other words, it would not lose allies in the region, and retrenchment would not spawn new aggressors capable of unsettling the region’s stability in future. A comparison between the Obama and Trump administration on their unsuccessful bids to retrench from the Gulf region is illustrated in Table 1.
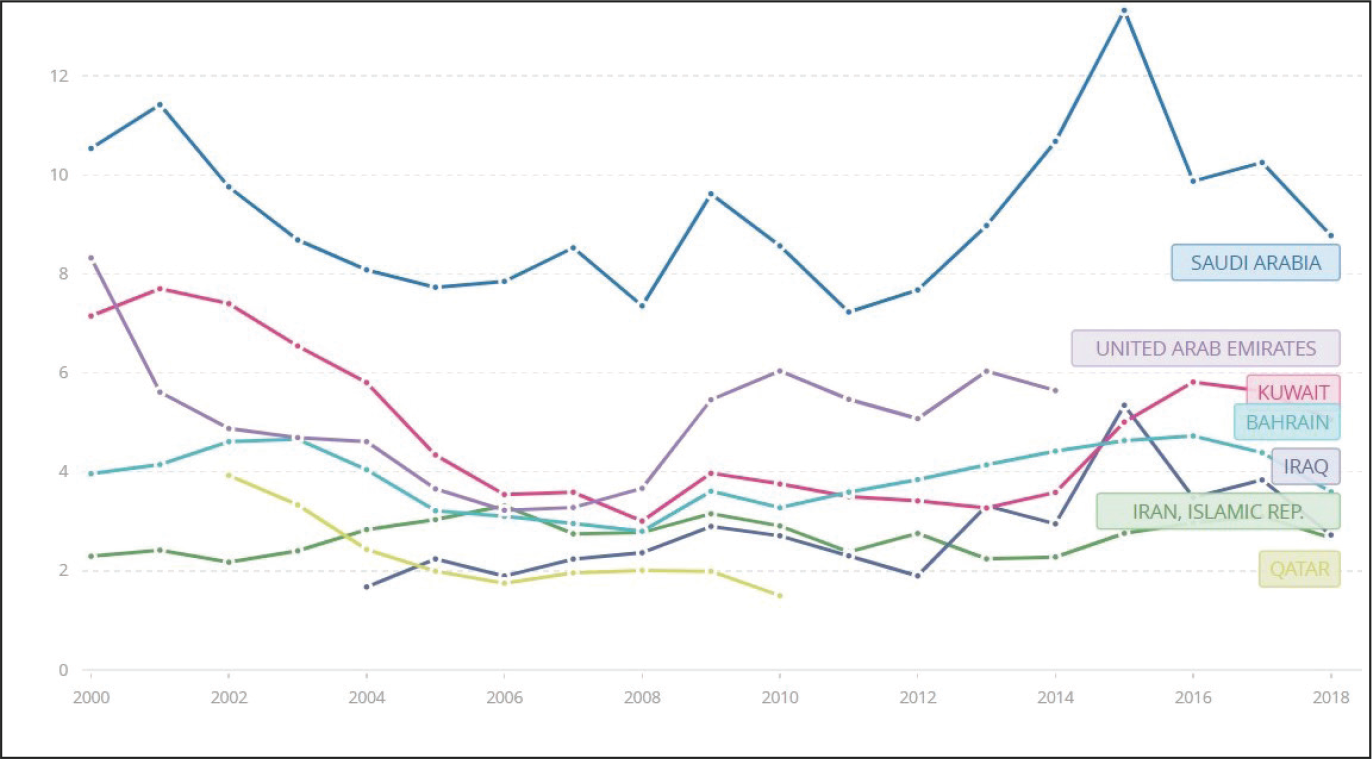
Military expenditure of Gulf Countries as a percentage of GDP (2018) are relatively higher than that of major stakeholders in the region—NATO 2 per cent; USA 3.11 per cent; Russia 3.1 per cent, China 1.26 per cent (Cordesman & Harrington, 2018). India’s defence budget as share of GDP for the same period was 1.54 per cent (Behera, 2018). Saudi Arabia had the highest percentage of defence budget with 8.7 per cent of GDP in 2018. Even though the World Bank figures on Iran and Iraq (Figure 7) appear to be unrealistic, the graph illustrates that defence budget of Gulf countries has been consistently high. But there has been a downward trend since 2017. It would be safe to assume that the defence budget of these states is likely to decline even further due to the twin oil shock of 2020.
Several consecutive attacks on oil tankers in the Gulf in May and June 2019 and missile attacks on Saudi’s Aramco oil fields in September 2019, did not provoke the usual retaliatory actions from the USA (Arab Centre for Research and Policy Studies, 2020). Besides, it is reported that the USA has removed two of the four Patriot missile batteries from Saudi Arabia and 24 aircraft from the Middle East (Capaccio & Carey, 2020). These are some of the visible signs of US retrenchment. Without US commitment, Gulf states are vulnerable to Iran’s hostilities. These developments have convinced the Gulf states that the USA is avoiding military action against Iran and is no longer willing to defend them. It has brought about a behavioural change in the Gulf Cooperation Council (GCC) states (Brands et al., 2019).
Due to an impending US retrenchment and a beleaguered economy, United Arab Emirates (UAE) has already started to withdraw from the war in Yemen against the Houthis. It has also begun talks with Iran for decreasing tensions in the Gulf. Even the Saudis are being pushed for a modus vivendi with Iran. For the GCC, it will be a painful retreat but would be a constructive step for regional stability. Hence, President Trump’s policy of retrenchment and harsh economic condition is forcing the Gulf region to rethink their foreign policies (Brands et al., 2019).
Status of US Retrenchment from the Gulf Region in 2020
Collective security, proposed by Russia, is not an option for the Gulf because it requires the states to respond collectively to any violation of agreed norms or rules by an aggressor. It is often difficult for states to decide on the definition of an aggressor and the corresponding response. Instead, Cooperative Security would be a more flexible option. It broadens the definition of security beyond traditional military challenges to include environmental, economic and social concerns. It encompasses a process of confidence-building through consensus. It overcomes the hesitancy of political risks and lowers the walls erected between societies and governments over the past decades (Snyder, 1999). Thus, amidst the economic recession, Cooperative Security would be more prudent than continued hostilities.
US retrenchment from the Gulf is likely to continue due to its focus on Asia-Pacific. The Russian and Chinese model of collective security has not found much traction. Very nascent signs of a thaw in hostilities between the Gulf countries are becoming palpable due to the harsh economic recession (see Figure 5). Therefore, the present situation is just ripe to put together a mechanism of Cooperative Security in the region. The Gulf is vital for India’s energy security, and a stable region would be in India’s long-term economic interest. India shares a cordial relation with all in the Gulf and is well placed to bring them together on a common platform. India could take the lead by drawing a Framework for Cooperative Security in the Gulf Region and facilitate negotiations between them. It would provide India with an opportunity to position itself in the region’s security architecture and make up for its exclusion from the JCPOA negotiations.
Concluding Remarks
This article has argued that oil has provided wealth and prosperity to the Gulf countries. But it has also attracted foreign powers into the region. The security architecture of the regions was dominated by Britain till the 1970s and thereafter by the USA. Oil has also provided the Gulf states with the economic leverage to vie for influence and dominance in the region.
It can be found that most countries in the Gulf, including the dominant regional players like Iran and Saudi Arabia, depend heavily on oil exports. This article has established that the twin shock of a plunge in oil prices and a fall in oil demands due to COVID-19 pandemic, will have a long-term impact on the economies and military spending of the Gulf countries.
Finally, the article concludes that retrenchment is a prudent foreign policy to reduce costs and risks. The Obama administrations had commenced the process of retrenchment from the Gulf but was unsuccessful. Rapprochement with Iran would be key to a successful US retrenchment for the Trump administration. Due to harsh economic conditions and imminent US rapprochement, Gulf countries have shown some thaw in hostilities. This provides an opportunity to establish a Cooperative Security Framework in the Gulf region, which India could facilitate.
Footnotes
Acknowledgements
The author is grateful to an anonymous referee of the journal for comments on the earlier version of the article. Usual disclaimers apply.
Declaration of Conflicting Interests
The author declared no potential conflicts of interest with respect to the research, authorship and/or publication of this article.
Funding
The author received no financial support for the research, authorship and/or publication of this article
Notes
| Year | Consumption | Production | Imports | Exports | Net Imports* |
| 1950 | 6.458 | 5.908 | 0.85 | 0.305 | 0.545 |
| 1951 | 7.016 | 6.726 | 0.844 | 0.422 | 0.422 |
| 1952 | 7.27 | 6.874 | 0.952 | 0.432 | 0.52 |
| 1953 | 7.6 | 7.131 | 1.034 | 0.402 | 0.633 |
| 1954 | 7.756 | 7.056 | 1.052 | 0.355 | 0.696 |
| 1955 | 8.455 | 7.611 | 1.248 | 0.368 | 0.88 |
| 1956 | 8.775 | 7.994 | 1.436 | 0.43 | 1.006 |
| 1957 | 8.809 | 8.019 | 1.574 | 0.568 | 1.007 |
| 1958 | 9.118 | 7.581 | 1.7 | 0.276 | 1.425 |
| 1959 | 9.527 | 8.019 | 1.78 | 0.211 | 1.569 |
| 1960 | 9.797 | 8.11 | 1.815 | 0.202 | 1.613 |
| 1961 | 9.976 | 8.353 | 1.917 | 0.174 | 1.743 |
| 1962 | 10.4 | 8.528 | 2.082 | 0.168 | 1.913 |
| 1963 | 10.743 | 8.842 | 2.123 | 0.208 | 1.915 |
| 1964 | 11.023 | 8.985 | 2.259 | 0.202 | 2.057 |
| 1965 | 11.512 | 9.234 | 2.468 | 0.187 | 2.281 |
| 1966 | 12.084 | 9.824 | 2.573 | 0.198 | 2.375 |
| 1967 | 12.56 | 10.512 | 2.537 | 0.307 | 2.23 |
| 1968 | 13.393 | 10.918 | 2.84 | 0.231 | 2.609 |
| 1969 | 14.137 | 11.163 | 3.166 | 0.233 | 2.933 |
| 1970 | 14.697 | 11.656 | 3.419 | 0.259 | 3.161 |
| 1971 | 15.212 | 11.537 | 3.926 | 0.224 | 3.701 |
| 1972 | 16.367 | 11.573 | 4.741 | 0.222 | 4.519 |
| 1973 | 17.308 | 11.399 | 6.256 | 0.231 | 6.025 |
| 1974 | 16.653 | 10.942 | 6.112 | 0.221 | 5.892 |
| 1975 | 16.322 | 10.467 | 6.056 | 0.209 | 5.846 |
| 1976 | 17.461 | 10.213 | 7.313 | 0.223 | 7.09 |
| 1977 | 18.431 | 10.387 | 8.807 | 0.243 | 8.565 |
| 1978 | 18.847 | 10.771 | 8.363 | 0.362 | 8.002 |
| 1979 | 18.513 | 10.662 | 8.456 | 0.471 | 7.985 |
| 1980 | 17.056 | 10.767 | 6.909 | 0.544 | 6.365 |
| 1981 | 16.058 | 10.688 | 5.996 | 0.595 | 5.401 |
| 1982 | 15.296 | 10.729 | 5.113 | 0.815 | 4.298 |
| 1983 | 15.231 | 10.734 | 5.051 | 0.739 | 4.312 |
| 1984 | 15.726 | 11.062 | 5.437 | 0.722 | 4.715 |
| 1985 | 15.726 | 11.138 | 5.067 | 0.781 | 4.286 |
| 1986 | 16.281 | 10.847 | 6.224 | 0.785 | 5.439 |
| 1987 | 16.665 | 10.583 | 6.678 | 0.764 | 5.914 |
| 1988 | 17.283 | 10.42 | 7.402 | 0.815 | 6.587 |
| 1989 | 17.325 | 9.82 | 8.061 | 0.859 | 7.202 |
| 1990 | 16.988 | 9.597 | 8.018 | 0.857 | 7.161 |
| 1991 | 16.714 | 9.791 | 7.627 | 1.001 | 6.626 |
| 1992 | 17.033 | 9.64 | 7.888 | 0.95 | 6.938 |
| 1993 | 17.237 | 9.349 | 8.62 | 1.003 | 7.618 |
| 1994 | 17.718 | 9.156 | 8.996 | 0.942 | 8.054 |
| 1995 | 17.725 | 9.096 | 8.835 | 0.949 | 7.886 |
| 1996 | 18.309 | 9.132 | 9.478 | 0.981 | 8.498 |
| 1997 | 18.62 | 9.118 | 10.162 | 1.003 | 9.158 |
| 1998 | 18.917 | 8.897 | 10.708 | 0.945 | 9.764 |
| 1999 | 19.519 | 8.617 | 10.852 | 0.94 | 9.912 |
| 2000 | 19.701 | 8.68 | 11.459 | 1.04 | 10.419 |
| 2001 | 19.649 | 8.573 | 11.871 | 0.971 | 10.9 |
| 2002 | 19.761 | 8.581 | 11.53 | 0.984 | 10.546 |
| 2003 | 20.034 | 8.343 | 12.264 | 1.027 | 11.238 |
| 2004 | 20.731 | 8.301 | 13.145 | 1.048 | 12.097 |
| 2005 | 20.802 | 7.89 | 13.714 | 1.165 | 12.549 |
| 2006 | 20.687 | 7.819 | 13.707 | 1.317 | 12.39 |
| 2007 | 20.68 | 7.853 | 13.468 | 1.433 | 12.036 |
| 2008 | 19.498 | 7.776 | 12.915 | 1.802 | 11.114 |
| 2009 | 18.771 | 8.991 | 11.691 | 2.024 | 9.667 |
| 2010 | 19.18 | 9.532 | 11.793 | 2.353 | 9.441 |
| 2011 | 18.887 | 9.975 | 11.436 | 2.986 | 8.45 |
| 2012 | 18.487 | 10.949 | 10.598 | 3.205 | 7.393 |
| 2013 | 18.967 | 12.188 | 9.859 | 3.621 | 6.237 |
| 2014 | 19.1 | 13.937 | 9.241 | 4.176 | 5.065 |
| 2015 | 19.534 | 14.938 | 9.449 | 4.738 | 4.711 |
| 2016 | 19.687 | 14.625 | 10.055 | 5.261 | 4.795 |
| 2017 | 19.958 | 15.443 | 10.144 | 6.376 | 3.768 |
| 2018 | 20.504 | 17.732 | 9.943 | 7.601 | 2.341 |
| 2019 | 20.462 | 19.327 | 9.098 | 8.567 | 0.531 |
Appendix B
| Country | GDP in US$ Million (a) | Value of Petroleum Export US$ Million (b) | Petroleum Export as Percentage of GDP (c) | Oil Price in 2020 (US$40) as Percentage of 2019 (US$68) (d) | Decline in Real Income as Percentage of GDP (e) = −(c) × (d) |
| Saudi Arabia | 782,484 | 194,358 | 24.83 | 41 | –10.18 |
| Iran | 418,582 | 60,198 | 14.38 | 41 | –5.89 |
| Iraq | 212,407 | 68,192 | 32.10 | 41 | –13.16 |
| UAE | 414,179 | 74,940 | 18.09 | 41 | –7.41 |
| Kuwait | 141,705 | 58,359 | 41.18 | 41 | –16.88 |
Appendix C
| Proven Crude Oil Reserves Million (bbls) | Proven Natural Gas Reserves Billion (cu.m) | Net Export US$ Million | Petroleum Export US$ Million | Petroleum as Percentage of Net Export | |
| Kuwait | 101,500 | 1,784 | 71,931 | 58,393 | 81 |
| Iran | 155,600 | 33,899 | 107,435 | 60,198 | 56 |
| Iraq | 145,019 | 3,729 | 95,256 | 68,192 | 72 |
| Saudi Arabia | 267,026 | 9,069 | 294,544 | 194,358 | 66 |
| UAE | 97,800 | 6,091 | 388,179 | 74,940 | 19 |