
Abstract
Aim
Grid size and Statistical Uncertainty (SU) settings have an impact on the efficiency and accuracy of the treatment plans. Hence, it is very important, to find an optimum combination of the two-dose calculation parameters for efficient treatment planning. This study aims to study the impact of Grid Size and SU on Head and Neck cancer plans which were planned using the Volumetric-Modulated Arc Therapy (VMAT) technique.
Materials and Methods
15 patients were selected for this retrospective study who had undergone radiation therapy at KMC, Manipal for various Head and Neck cancers. VMAT plans were generated for each case in Monaco 5.11 Treatment Planning System (TPS) using the Monte Carlo algorithm. For each patient, nine plans were generated in which the Grid size values were taken as 2 mm, 3 mm, and 5 mm and for each Grid size, SU settings were varied as 1%, 2%, and 5%. The plans were analysed and evaluated using outcome measures such as the Homogeneity Index (HI) and the Conformity Index (CI).
Results
The plans were evaluated as per the ICRU guidelines. In all the plans, PTV coverage achieved was above 95% with the maximum coverage (97.009) achieved with the 3 mm/1% combination. Overall, the effect of varying Grid Size and SU was insignificant in the plans generated, but there were few variations in the dose calculation parameters. For 2 mm/1%, 2 mm/2%, 2 mm/5%, 3 mm/1%, 3 mm/2%, 3 mm/5%, 5 mm/1%, 5 mm/2%, 5 mm/5%, the mean values of HI were 1.073, 1.078,1.078, 1.075, 1.0805, 1.0805, 1.068, 1.079, 1.089, and the mean values of CI were 0.968, 0.967, 0.967, 0.968, 0.958, 0.96, 0.954, 0.946, 0.948, respectively. Among all the combinations, the results for 5 mm/1% yielded more homogeneity, whereas 2 mm/1% and 3 mm/1% combinations resulted in better conformity. The 3 mm/1% combination gave maximum target coverage and quite fewer Monitor Units (MU) as well.
Conclusion
3 mm Grid Size and 1% SU is suggested for the Head and Neck carcinomas planned using the VMAT technique.
Introduction
Radiation therapy is one of the most effective ways of treating cancer worldwide, in the modern era. Of the 10.9 million people diagnosed with cancer worldwide each year (International Agency for Research on Cancer), around 50% are prescribed radiation Therapy. 1 Among all the types of cancers, Head and Neck cancers account for 30% of all cancers in males and 11%–16% in females. 2
Treatment of the Head and Neck region is a major challenge in Radiation Therapy. The critical organs like the Brainstem, Spinal Cord, Optic Nerve, Larynx, and so on, often lie in close vicinity of the tumour. In addition to that, there is usually more than a single target volume, each with a different prescribed dose. The overall target thus becomes quite spread out and the presence of several critical structures in that region makes the planning process difficult. 3 The most preferred technique for head and neck cancers are Volumetric-Modulated Arc Therapy (VMAT).
VMAT is an advanced type of Intensity Modulated Radiation Therapy (IMRT) technique in which the gantry is made to move in an arc producing continuous variation in dose rate. The MLCs are conformed to the shape of the tumour. When the gantry rotates along the set angles, the MLCs also keep moving. VMAT delivers a more accurate dose with a lesser number of Monitor Units (MU) while also providing a more homogenous target coverage as compared to conventional IMRT. 4
Monaco allows the user to alter the plan’s quality, MU efficiency, and delivery time by defining characteristics such as Grid Size and Statistical Uncertainty (SU), which in turn impact the dose calculations.
The regular spacing of calculation points on a grid is referred to as Grid spacing or Voxel size. The dosage calculation grid separates the patient’s 3-dimensional (3D) data into many voxels, which are then used to calculate forward dose. The Treatment Planning System (TPS) comes in a range of grid sizes from 1 mm to 10 mm5 Smaller grid sizes result in higher image quality and more precise computations, but they also increase the calculation time. Larger grid sizes cause increased dose to the structures, poorer resolution and require higher MU to achieve the target coverage. 6
The SU setting regulates the amount of statistical noise that remains in the treatment plan. As the SU value decreases, there is a lower degree of statistical noise in the final display but it also leads to an increase in the dose calculation time. 7 MC SU decreases inversely with the square root of the computation time 8 but decreasing SU also increases the dose accuracy.
Thus, the selection of Grid Size and SU for any plan must be done considering both the dose accuracy, precision as well as the dose calculation time.
Hence, we have undertaken this study to find a good accord between the Grid size and SU to arrive at an efficient and accurate treatment plan. The study is conducted on 15 Head and Neck Cancer patients treated in Kasturba Medical College, Manipal out of which eight were Ca Tongue, three were Ca Oropharynx and four were Ca Pyriform Fossa all of which were planned via VMAT technique using the Monaco TPS. Keeping all the other parameters constant, we have varied Grid Sizes and SU settings for each patient.
Homogeneity Index
Homogeneity index (HI) is a quick and convenient tool that helps in assessing uniformity of the dose in the target volume. It is useful in comparing the dose distributions of different radiotherapy plans.
9
The ideal value is 1 and it increases as the plan becomes less homogeneous.
10
The HI equation is:

where, D5% and D95% are doses prescribed to 5% and 95% of target volumes, respectively.
Conformity Index
Conformity Index (CI) is another plan evaluation tool proposed by the Radiation Therapy Oncology Group (RTOG) which helps in comparing radiotherapy treatment plans based the coverage of the target volume. The ideal value of CI is 1. A CI greater than 1 means that the volume which is being irradiated is greater than the target volume. If the CI is less than 1, it means that the target volume coverage is inadequate.
11
The equation for CI is:

where, CI is the Conformity Index, VRI is the reference isodose volume and VT is the Planning Target Volume.
Materials and Methods
Monaco TPS Version 5.11
Elekta’s Monaco version 5.11 is the latest version of this TPS. It is an extremely user friendly TPS which is capable of obtaining dose calculations at a speed of up to four times that of the previous versions. It allows multiple optimizations at a time thus allowing multiple plans to be executed simultaneously thereby reducing the overall treatment time to a large extent. 12 Monaco enables treatment plans for photon as well as electron beams. It allows easy import and export of the plans which leads to an increase in efficiency.
Patient Positioning and Immobilization
All the patients were made to lie down Headfirst Supine (HFS) position on the CT Simulator couch. A 4-clamp thermoplastic Mould (ORFIT) for the site of the tumour, here HN, prepared for each patient was used for immobilization during the simulation procedure. The CT images of the patients were acquired in the Philips Brilliance Big Bore Computed Tomography with a Slice Thickness of 3 mm. After the CT scan was acquired, the CT images were sent to the Monaco TPS version 5.11.03 for the delineation of the Target Volume and the surrounding organs.
Image Registration and Contouring
The delineation of the surrounding OARs like the Spinal cord, Brainstem, Parotids, Larynx, Mandible, and so on, was done on each CT slice. The external contour of the patient was also drawn but without any margin.
The Treatment Planning
The treatment planning was done in the Monaco TPS version 5.11. The treatment technique used was VMAT and the dose calculation algorithm used was Monte Carlo. All the plans were made with a double arc and the isocentre was placed within the PTV. The gantry start angle was kept at 180 degrees with a complete 360° degree arc rotation in the Clockwise direction. In all the cases, a photon beam of 6 MV energy was used.
Showing Delineation of the OARs and the Placement of the Arc.
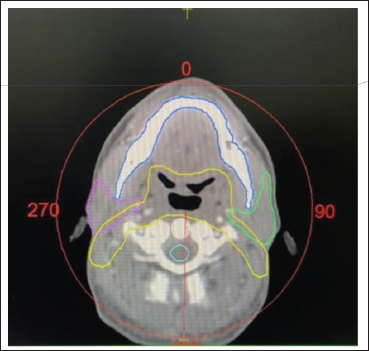
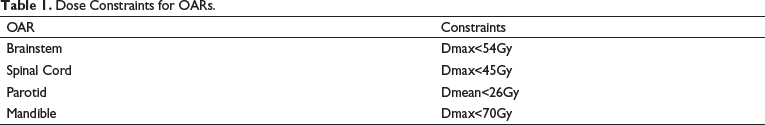
This being a retrospective study, the CT scans of the patients were taken after the approval of the Head of the Department. For each patient, nine plans were generated in which the Grid size values were taken as 2 mm, 3 mm and 5 mm and for each Grid size, SU settings were varied as 1%, 2% and 5%. Optimizations were done to ensure adequate coverage to the PTV while keeping the dose to the OARs below their limits. The treatment plans were generated, followed by dose calculation. After approval by the Oncologists, the plans were then executed by the Elekta VersaHD Linear Accelerator (Figure 1, Table 1).
Dose Constraints for OARs.
Elekta Versa HD Linear Accelerator
It is a Linear Accelerator which is capable of delivering photon beams of energies 6MV, 6 MV FFF, 10 MV, 10 MV FFF, 15 MV and electron beams of energies 4 MeV, 6 MeV, 8 MeV, 10 MeV, 12 MeV and 15 MeV. It is capable of delivering all kinds of advanced delivery techniques such as VMAT, IMRT, 3DCRT. 13
Plan Evaluation
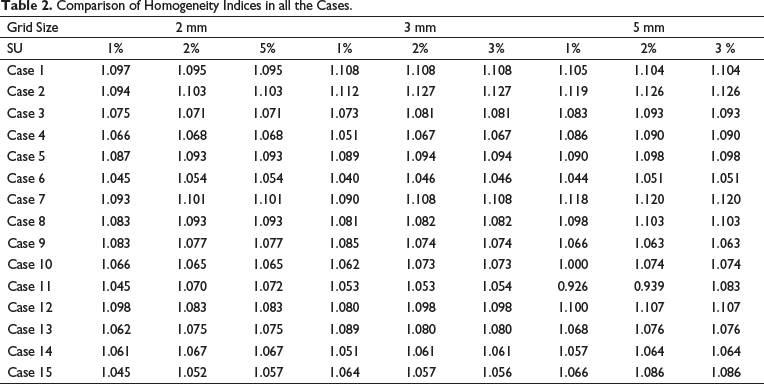
HI: (see Table 2)
Comparison of Homogeneity Indices in all the Cases.
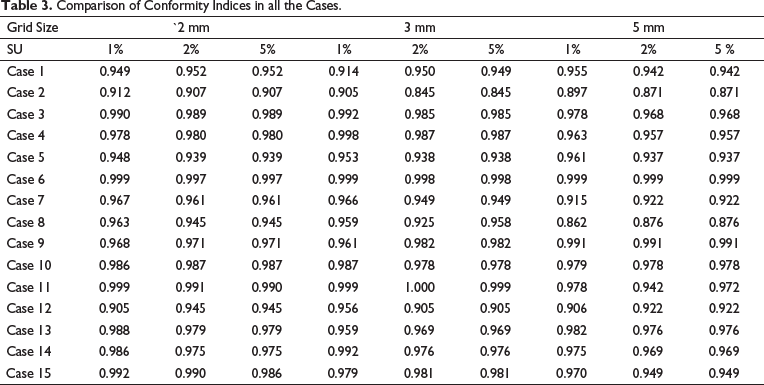
CI: (see Table 3)
Comparison of Conformity Indices in all the Cases.
Data Analysis
All the values of the OARs and PTV were obtained from the DVH and analysed with the help of the One-Way Analysis of Variance (ANOVA) test. This test helps us in finding out if there are any statistically significant differences between the means of two or more independent (unrelated) groups. The p value is a parameter used to determine if there is any statistical significance between the groups being tested. It is decided by the researcher, usually, it is taken as 0.05. If the p value measured comes out to be less than .05, we can say that there is a statistical significance between the groups being tested. If the p value measured is greater than .05 that means there is no statistical significance.
Results
All the plans were evaluated using parameters like the Homogeneity Index, the Conformity Index, V95%, that is, the volume receiving 95% of the prescription dose and Dose received by the OARs. No statistically significant difference was found in any of the dose calculation parameters. Table 4 shows the statistical comparison of the dosimetric parameters PTV in terms of Mean ± Standard deviation (SD) along with the p values. In all the plans, PTV coverage achieved was above 95% with the maximum coverage 97.009 ± 2.60 which was achieved with 3 mm/1% combination, except for 5 mm/2% and 5 mm/5% combinations which showed less than 95% 94.652 ± 3.76 and 94.84 ± 3.81, respectively. The dosimetric values showed very little to no difference between SU setting 2% and 5%, difference was noted in a few cases only; however, some difference was noted in all the cases when varying the three Grid Sizes, that is, 2 mm, 3 mm and 5mm. The mean ± SD for HI was found to be 1.068 ± 0.05 for 5 mm/1%, which was closest to the ideal value. The CI for both 2 mm/1% and 3 mm/1% were found to be 0.968 ± 0.03 which was better among all. The MU were lowest at 3 mm/2% with the value 684.59 ± 107.9.
Statistical Comparison of Dosimetric Parameters for PTV.
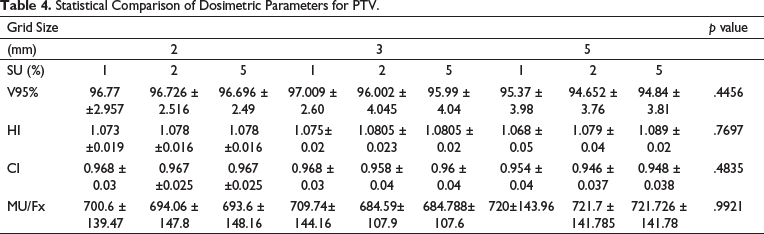
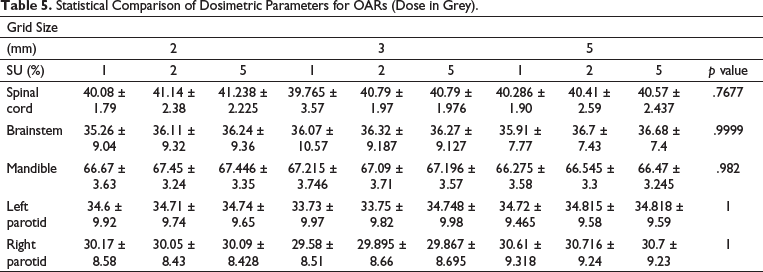
Table 5 shows the statistical comparison of OARs. Sufficient sparing was achieved with each Grid Size and SU combination. The maximum Dose of Spinal Cord was less than 45Gy in all cases out of which 3 mm/1% showed a minimum value, that is, 39.765 ± 3.57. The maximum dose of Brainstem also was within the limits with the minimum value 35.26 ± 9.04 found using 2 mm/1%. The Dmax for Mandible was the lowest, that is, 66.275 ± 3.58 for 5 mm/1% combination. The Mean dose of Parotids, however, exceeded the critical value, with the lowest values of 33.73 ± 9.97 and 29.58 ± 8.51 for the Left Parotid and Right Parotid respectively achieved using 3 mm/1 combination.
Statistical Comparison of Dosimetric Parameters for OARs (Dose in Grey).
It was also noted that the time taken for the optimization increased as the Grid Size decreased. But with change in SU, no major time difference was noted (Figure 2 & 3).
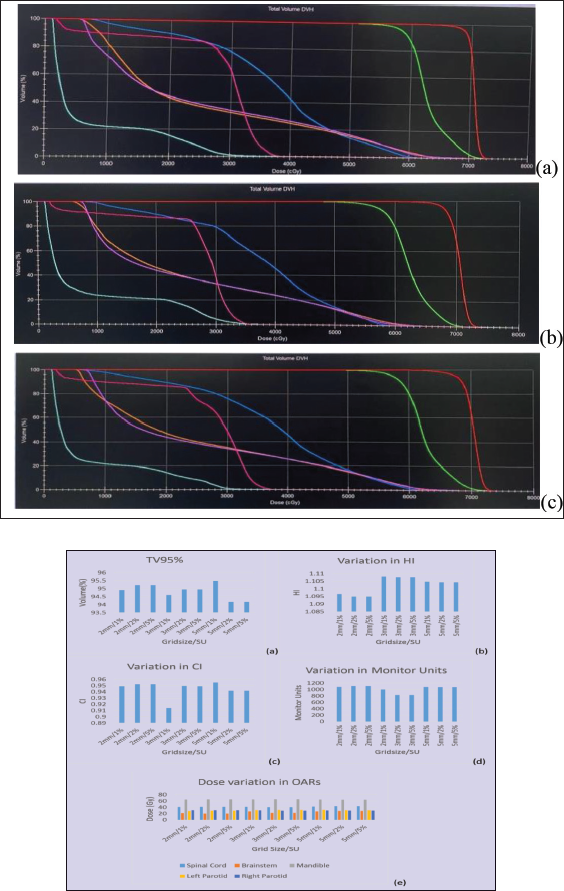
Graphs representing one patient data (a) Target Volume covered by 95% of dose. (b) Variation in HI (c)Variation in CI (d)Variation in Monitor Units (e)Dose Variation in OARs.
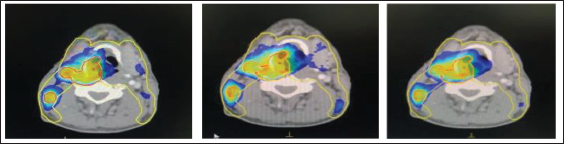
Representing Isodose Distribution in one Patient Keeping the SU set at 1% and Grid Size (a) 2 mm, (b) 3 mm and (c) 5 mm.
Discussion
In radiation therapy, the patient’s anatomy plays a vital role in deciding the type of technique that can be chosen. As we have already discussed above, Head and Neck cancers require intricate dealing since that region comprises the major organs of the body. With time, new technologies keep coming out which have decreased the fatality rate arising from these carcinomas to a great extent. VMAT is one such advanced technique which is employed for several regions including the HN. The TPS provides a wide range of options to vary the VMAT plan efficiency and accuracy as per our requirements. It is imperative to consider the PTV coverage and the OAR sparing while also making sure that the optimization time is not too much which can cause delay in the functioning of the entire planning process.
In our study, we have chosen two such parameters that are Grid Size and SU % and tried to see their effect on the treatment plans. The study showed that overall, there were no significant differences between the plans generated with the different Grid sizes and SU combinations. Any of the three Grid Sizes can be chosen, but considering the long optimization time with 2 mm, 3 mm could be chosen since it has the lowest value for MU/Fx (per Fraction). The low values of MU result in lower leakage from the Accelerator and less patient scatter. The radiation scatter within the patient can cause secondary malignancies which is something that should be avoided. Increased MU also leads to an increase in treatment time. Prolonged treatment duration increases the chances of patient movement and thus increases positional errors. Among the SU values, 1% showed better dose calculation results than 3% and 5%.
Conclusion
Although there was no significant difference statistically in the plans generated, there were little variations in the dose calculation parameters. For 2 mm/1%, 2 mm/2%, 2 mm/5%, 3 mm/1%, 3 mm/2%, 3 mm/5%, 5 mm/1%, 5 mm/2%, 5 mm/5%, the mean values of HI were 1.073, 1.078, 1.078, 1.075, 1.0805, 1.0805, 1.068, 1.079, 1.089 and the mean values of CI were 0.968, 0.967, 0.967, 0.968, 0.958, 0.96, 0.954, 0.946, 0.948, respectively. Among all the combinations, the results for 5 mm/1% yielded more homogeneity whereas 2 mm/1% and 3 mm/1% combinations resulted in better conformity among all. The 3 mm/1% combination gave maximum target coverage and quite fewer MU as well. Hence, 3 mm Grid Size and 1% SU is recommended for use in Head and Neck carcinomas planned using VMAT technique.