
Abstract
Narrow vein Au-Ag deposits have practical and academic relevance for mining operations research and geometallurgy. The restricted two-dimensional vein geometry is subject to inflexibility in the mining sequence and thus forces any feed imbalances into the metallurgical plant to be resolved through stockpiling and blending. The geometrical inflexibility simplifies the dynamic simulation of the mining system, allowing a decoupling of (1) the geospatial simulation of critical ore attributes from (2) the downstream operational decisions that govern the metallurgical process. Whereas sequential Gaussian simulation (SGS) is the most common geostatistical technique for conditional simulation of spatially distributed attributes, discrete rate simulation (DRS) is arguably the most basic approach to dynamic mass balance, capable of representing departures from stable metallurgical operating conditions and tallying the impact. Relevant impacts can include lost recoveries, lost throughput, and ineffective use of reagents such as cyanide, or combinations thereof. The current work is the first instance that directly combines SGS and DRS within a single framework, representing an industrially relevant context that is low-sulphidation epithermal gold-silver deposits. The framework is comparable to an inventory stockpile simulation, typical of a manufacturing context, except that the supply uncertainty is subject to geological complexity, e.g. a fault-laden paleo-phreatic surface separating overlying oxide ores from underlying sulphide ores, which complicates the downstream cyanidation process, as in the El Peñón Mine (Chile). Operating policies can be formulated and parametrised within the framework and tested against geological scenarios that are based on drill samples taken from the workface, and considering critical geological features such as structural transitions in mineral assemblies. Sample computations demonstrate that refined stockpiling and blending can result in a 14% decrease in cyanide consumption during a demanding stage of the mine life, while maintaining other key performance indicators such as gold and silver recovery, and throughput.
Keywords
Introduction
A mining system is distinguished from a generic industrial system by the geological character of its supply. A manufacturing plant receives raw materials and consumables, and pre-assembled components, which are supplied by other industrial systems that tend to include other manufacturing plants (Figure 1a), which is in contrast to a mine (Figure 1b) whose primary supply is the underlying ore. Therefore, the quantitative analysis of the mine's supply depends on particular techniques that are distinct from the more generic manufacturing context; specifically, the supply uncertainty of mines is not well explained through generic manufacturing-oriented Monte Carlo techniques, but instead by geostatistical techniques that consider spatial conditioning that is the result of geological processes. The most important and commonly used conditional simulation technique is sequential Gaussian simulation (SGS), arguably due to its flexibility and computational efficiency, as well as its historical importance as an extension of variography.1–3
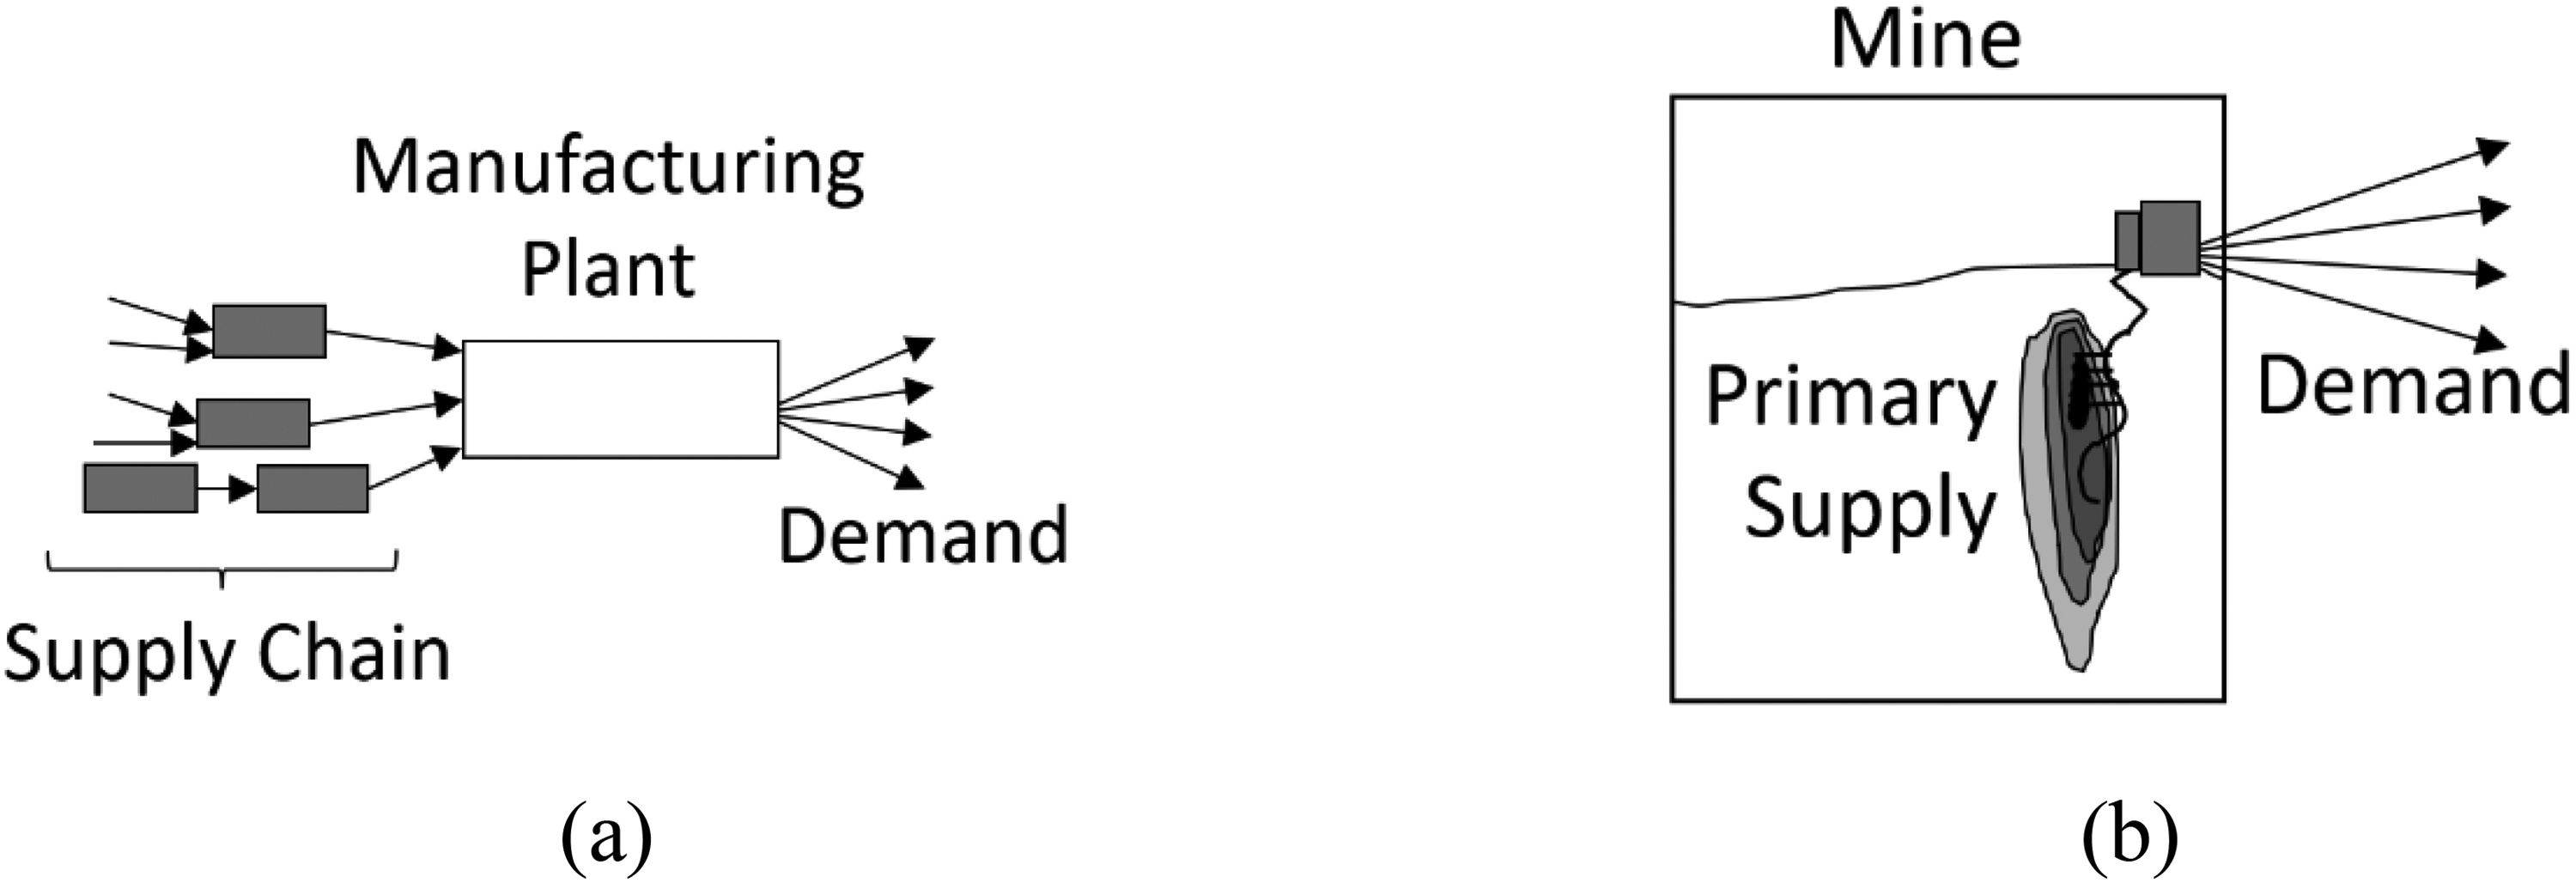
Generic industrial system versus mining system: (a) a manufacturing plant fed by an upstream supply chain, and (b) a mine that draws upon an orebody.
The approach presented in this paper is influenced by operations research originating in the manufacturing context, especially inventory theory,4,5 and is brought into the context of narrow vein gold mining. The (approximately) two-dimensional geometry of these orebodies renders this a canonical context, in a mathematical sense, allowing an effective decoupling of the geostatistical simulations from the downstream metallurgical simulation. Moreover, further simplification to one-dimensional excavation has theoretical significance, as well as practical significance in the early phases of a multiphase engineering project: the mining system can be represented as a mass balance in which feed stockpiles (i.e. inventories) receive incoming ore having a composition that fluctuates dynamically over time. This is effectively the generic manufacturing-oriented approach; indeed, the one-dimension advancement essentially corresponds to the advancement of time, yet it could also be imagined as a geometrical advancement into a ‘line’ of ore. Later within a multiphase project, critical aspects of the mining system must be represented in increasing levels of detail, through the incorporation of models, submodels, subsubmodels, etc, to quantify the phenomena that pose risk and can potentially stifle the project if not adequately addressed, as well as the opportunities that are driving the project. Specifically, the simulated coordination of downstream operations in response to geological features requires a geospatial representation to be coherently represented within the simulation, as well as the decision-making logic that governs the mining sequence. In many cases, the downstream modelling could include metallurgical phenomena (e.g. the efficacy of reagents), hence a connection between geometallurgy and operations research.
An explicit geospatial representation would typically require a three-dimensional model, as well as computationally demanding mine planning algorithms that control the excavation sequence. There is thus a difficult leap in extending the one-dimensional (time-oriented) dynamic representation of the mining system directly into the three-dimensional. Narrow vein gold mining is an exception, however, since the orebody geometry and by consequence the mining technique can be adequately represented in two dimensions. The narrow geometry reduces the sequencing decisions to a straightforward programming effort, rather than complex algorithms that are now the standard for the open-pit context, for instance, but are costly to incorporate within an operational simulation. 6 Given that the overall direction of excavation is dictated by the immovable vein, the natural approach to stabilising the mill feed composition is to establish standardised operating modes that integrate the stockpiling, blending, and downstream processing parameters.
This narrow vein context is indeed notable for geometallurgical operations research since, even with the restricted (hence simplified) representation of the mining sequence, there still remain highly relevant operational problems that are manifest by poor blending policies that do not respond to geological features, resulting potentially in lost recovery, decreased tonnages, or in the case of the El Peñón Mine (Chile), inefficient use of reagents, namely cyanide. The following section presents the geological context of El Peñón exploiting a narrow Au-Ag narrow vein deposit, wherein the geological complications that forced spikes in cyanide consumption to maintain recovery were not precisely evident and required careful description and interdisciplinary comprehension, in order to stabilise the hydrometallurgical operations. Furthermore, the El Peñón context is not unique, meaning that other narrow vein Au and Au-Ag deposits would also require site-specific analysis to perceive, model, and parametrise the critical geological features.
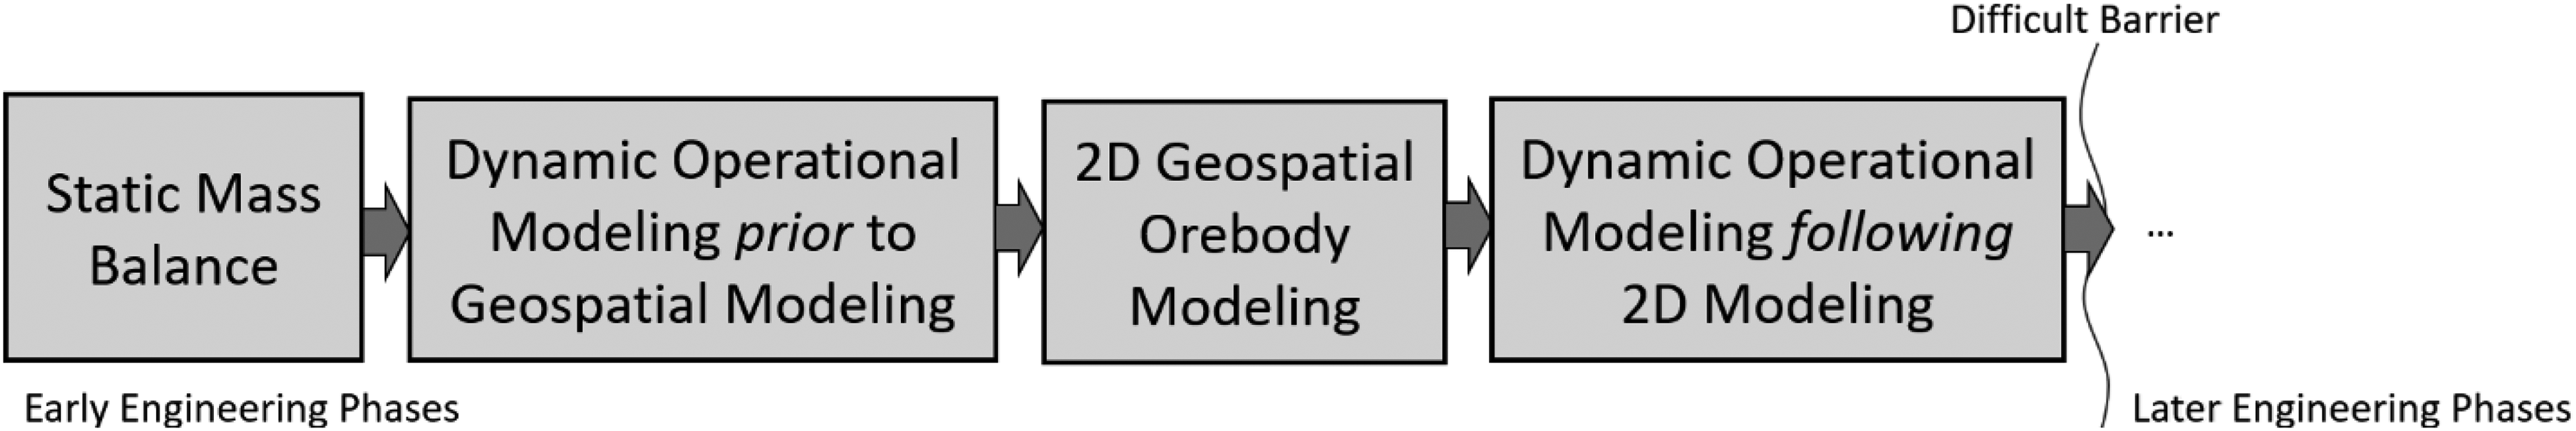
Previous writings 4 7–11 have sought to formalise the representation of mining systems for the purposes of multiphase engineering processes, starting from a static mass balancing and extending firstly into dynamic mass balancing (influenced by the manufacturing context), considering that it is the dynamic spiking that would cause a system to approach its limits, and possibly exceed those limits leading to operational complications in production and safety. These efforts employ discrete rate simulation (DRS), considering it to be a basic and flexible approach to dynamic mass balancing; it has supported the prototyping of machine-learning-enabled control strategies,7,10 for example. However, any detailed representation of influencing geological features would require a geospatial representation prior to further detailing of critical dynamic features. 11 Due to the significant additional effort required for an explicit multidimensional geospatial representation (Figure 2), this difficult leap is not practical in the early phases of an engineering project, so-called scoping, but only in later phases that benefit from larger budgets and specialised human resources. The specialised human resources could include a computational geostatisticians familiar with SGS and other conditional simulation techniques, as well as mining and metallurgical engineers.
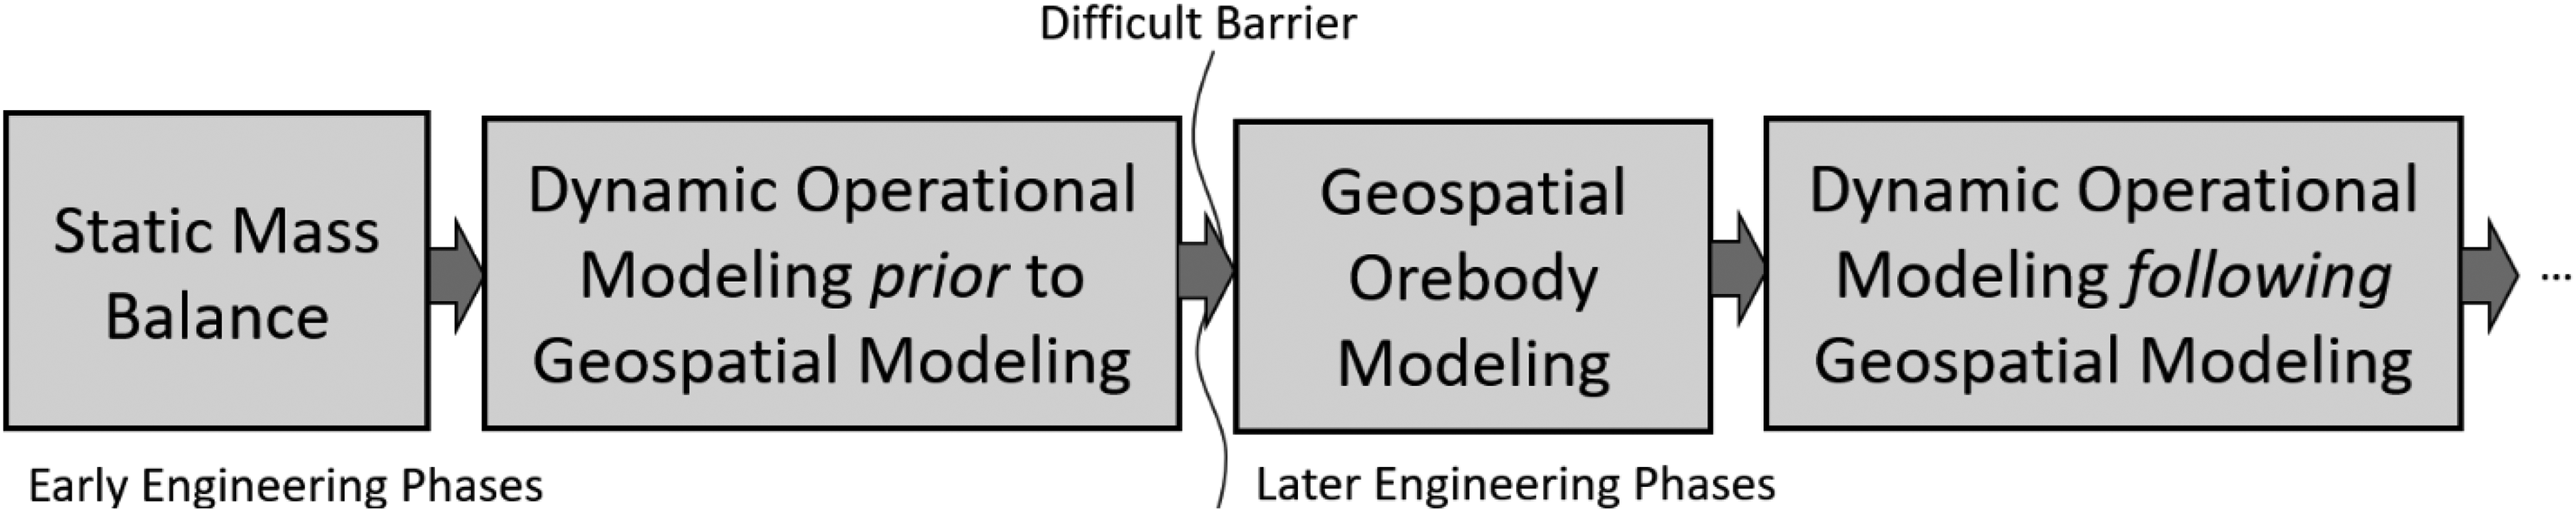
Development of dynamic mine system simulation, within the context of a multiphase mining engineering project, starting with a static mass balance and eventually incorporating geospatial aspects.
The demanding 3D requirements for representing and handling geological features, whether beneficial or detrimental to the mining operation, have previously hindered the dissemination of the broader approach of Navarra et al. (Figure 2) into academic contexts, notwithstanding narrow vein gold deposits that are now presented as an important exception. The current work combines an industrially relevant geological context with a defendable representation of the mining sequence and integrated coordination processing parameters. The resulting simulations are used to parametrise and test operating modes and the triggering conditions that would induce mode changes, thereby assuring steady overall performance of the mining system including the metallurgical extraction.
Geological setting
Low-sulphidation Au-Ag vein hosted epithermal deposits
Epithermal deposits are significant sources of gold and silver.12–14 These deposits are formed at low temperatures (< 300 °C), and at shallow depths, typically less than 1.5 km below the water table, in which mineralisation results from interactions between chemically distinct fluids. These deposits can be classified as high or low sulphidation, which refers to the oxidation state of sulphur in the mineralising fluids. 12 Low-sulphidation epithermal gold deposits are products of dilute fluids which have been reduced and have a pH of ∼7, developed by the entrainment of magmatic components within deep circulating groundwaters and characterised by sulphur species reduced to H2S. For low-sulphidation epithermal deposits, one of the most distinctive features are their open-space vein-fill textures. The mineral assemblage in low-sulphidation veins is quartz-adularia, or more broadly quartz ± calcite ± adularia ± illite. The main gold- and silver-bearing minerals are electrum, acanthite, silver sulphosalts, and silver selenides, and Au-Ag tellurides are in conjunction with variable amounts of chalcedony, pyrite, and/or rhodochrosite. Many such deposits with less than 1 ppm of gold are mined using surface mining methods, 14 although the current paper focuses on the underground mining of narrow veins in consideration of the narrow geometry.
Traditionally, the low-sulphidation category is also called ‘alkaline’, as opposed to the high-sulphidation called ‘acid’, 15 although the current paper will maintain the low- versus high-sulphidation terminology. Moreover, epithermal gold-silver deposits have been categorised into various subtypes based on their metal content, presence of various ore and gangue minerals, and inferred composition of hydrothermal fluids required for ore formation, as well as the degree of alteration.12–15 Different base metal sulphides are present in low-sulfidation deposits, the most common being sphalerite and galena accompanied with Cu-bearing sulphides such as chalcopyrite and tetrahedrite. 12 Post-depositional mineralogical changes can be the result of interaction between the orebody with geological features including the water table, emplacement at depth, uplift/exhumation processes, and earlier faults. These changes can lead to significant geological variability and related uncertainty for a particular orebody, which can significantly affect the mineral processing and metallurgical extraction.
Due to this geological interaction, supergene Cu-bearing sulphides (a.k.a. secondary enrichment copper sulphides, e.g. chalcocite, digenite, covellite) can occur in the portion of the orebody that interacts with the upper limit of the water table. Critically from the metallurgical point of view, these supergene Cu-bearing sulphides result in high-cyanide consumption when processed due to their high solubility in cyanide solutions 8 16–18 and can therefore be called cyanicidal. This is in contrast to chalcopyrite, for instance, which is not particularly reactive to cyanide. Also problematic is the Mn-bearing carbonate mineral, rhodochrosite, found at lower depths which is also cyanicidal. Further to post-mineralisation processes is the effect of weathering, such that a portion of the orebody located above the water table is fully oxidised. In this case, base metal ore minerals are absent because they are unstable under this redox condition, which subsequently is favourable for gold and silver extraction. 12 Even beyond the supergene Cu-bearing sulphides and rhodochrosite, which are notable at El Peñón, there can be several sin-genetic minerals with gold-silver deposition that can be deleterious to the cyanidation process, surrounding and below the paleo water table within the deposit, as depicted in Figure 3. Discontinuities in the paleo water table can be especially challenging for maintaining a stable process, unless well-defined operating modes and operational policies are enforced.
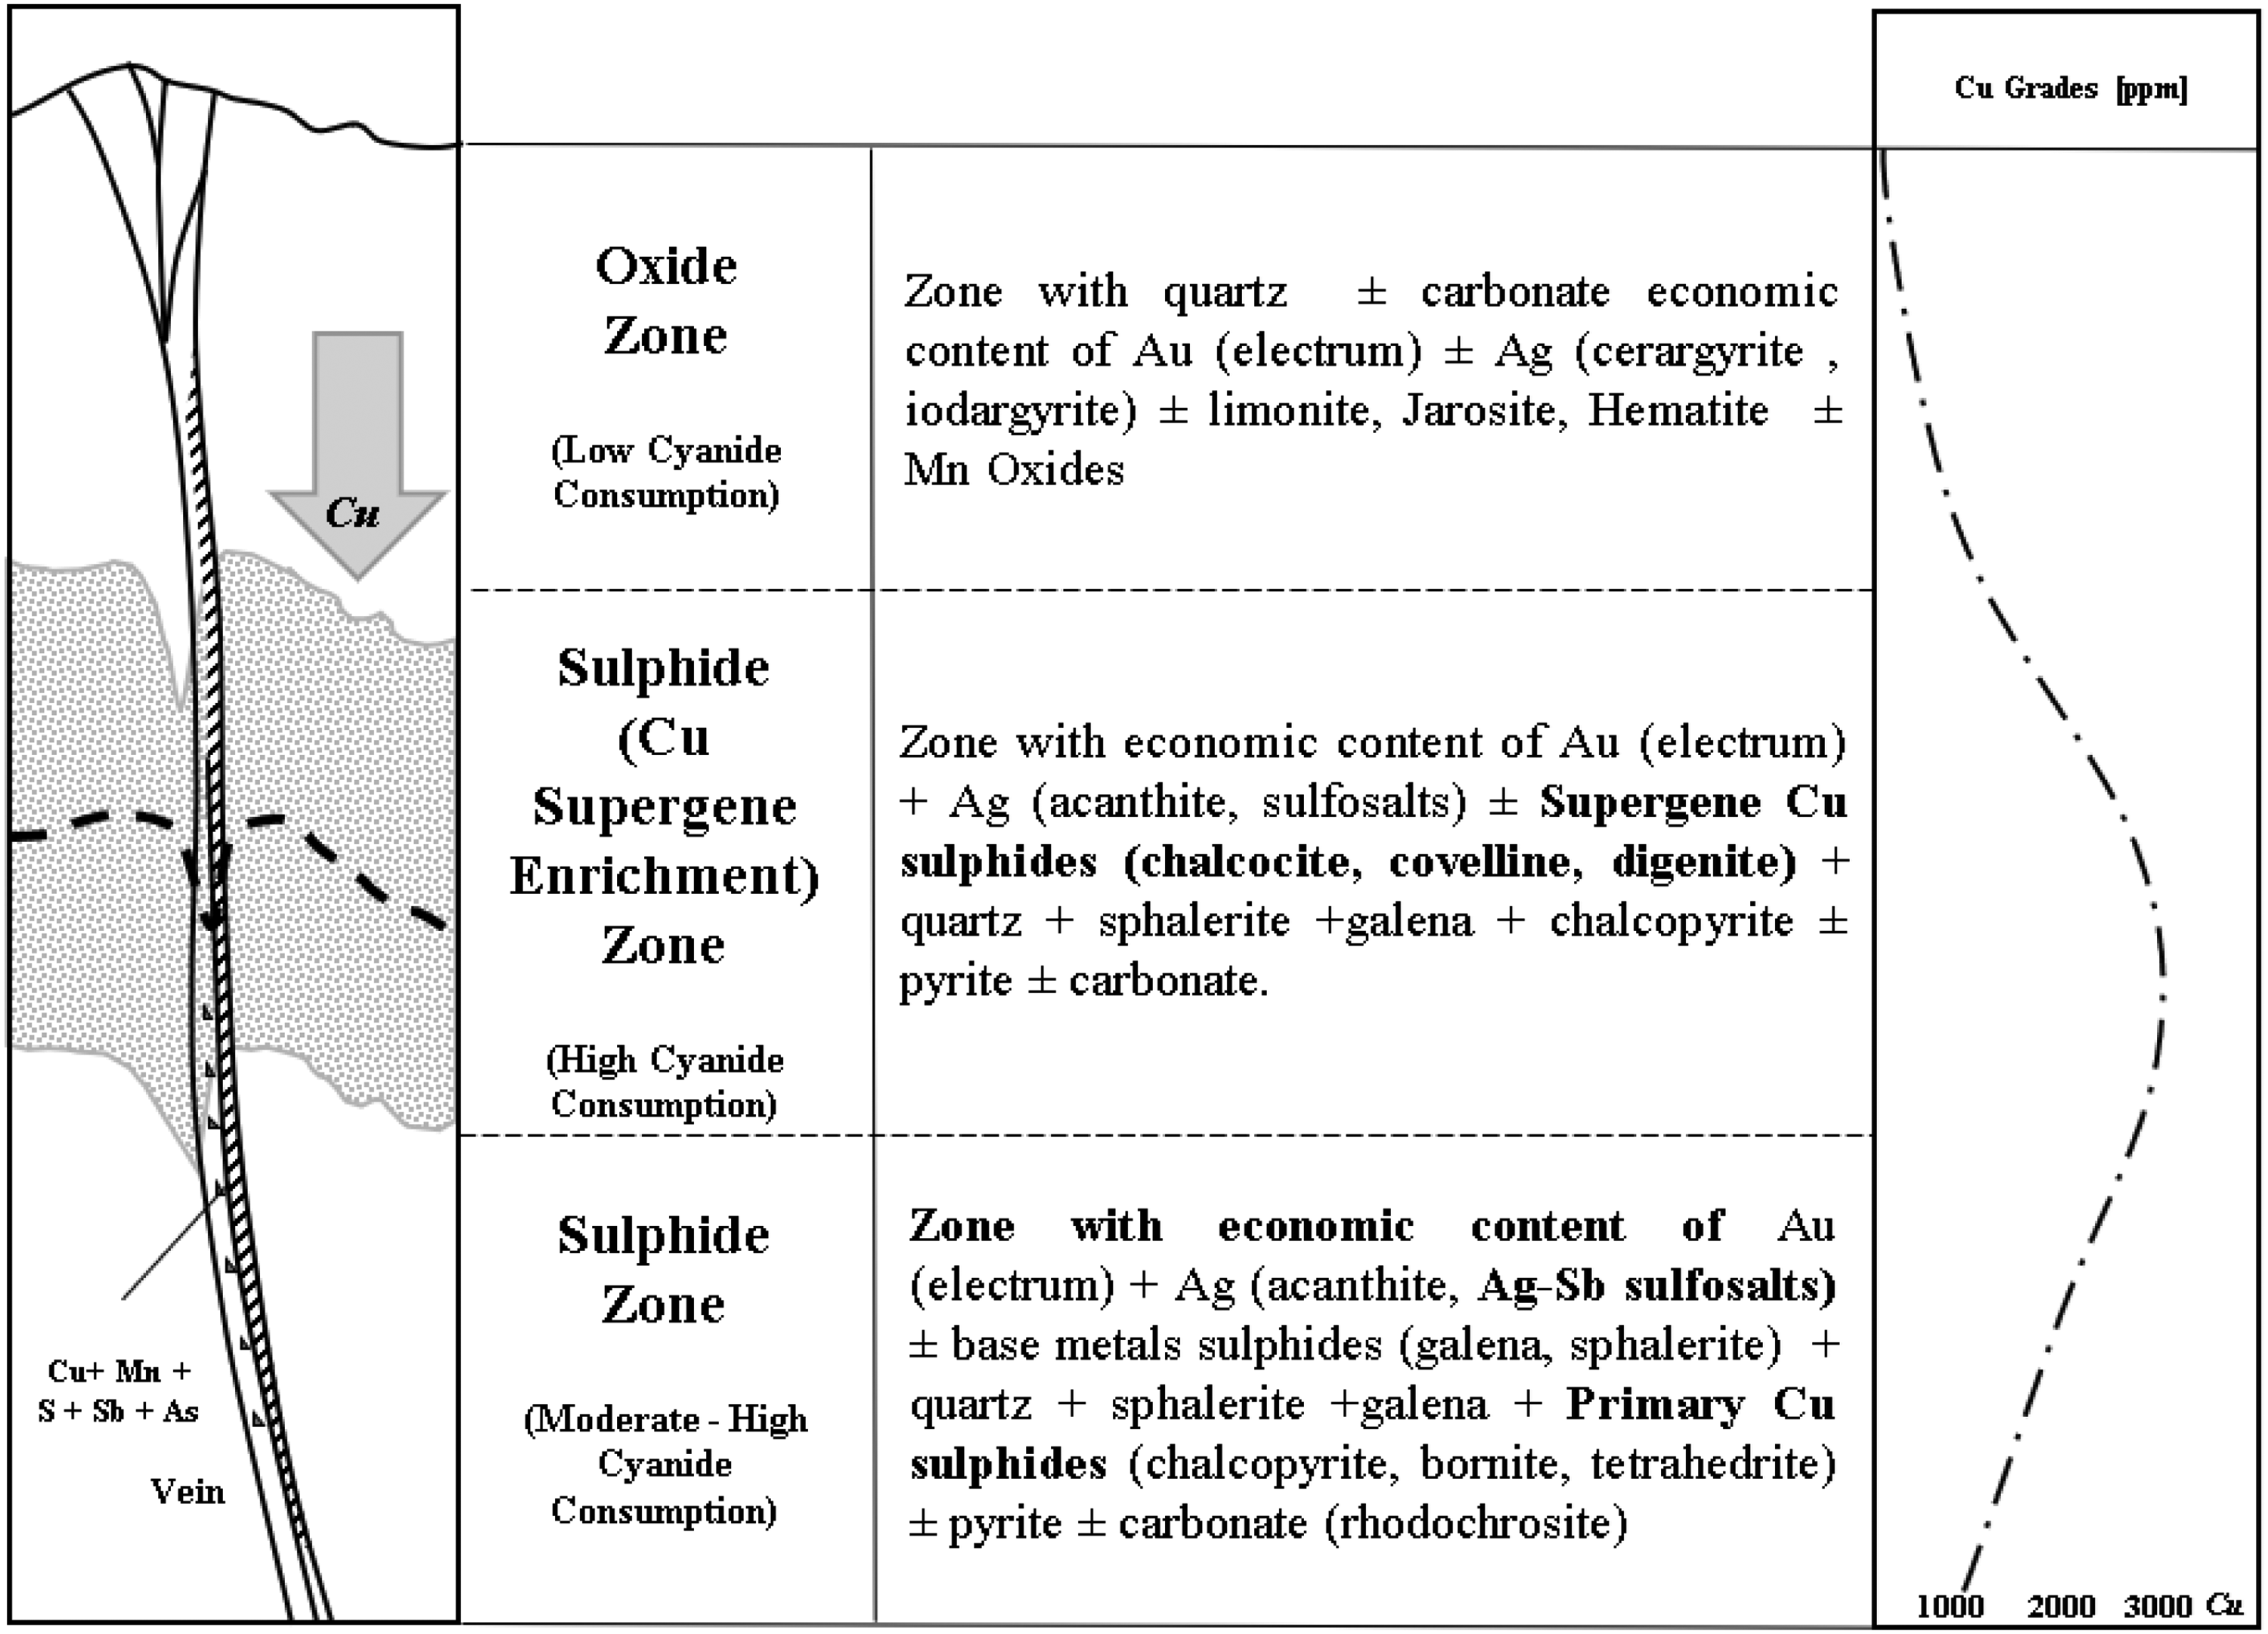
Schematic profile of the mineralogical distribution in low-sulphidation veins and their location with respect the paleo water table. Below this limit, the original mineralogical species are conserved following the initial formation of low-sulphidation system. However, copper from the oxide zone is transported to lower levels generating supergene Cu-sulphides (chalcocite–covellite–digenite).
The variability in the cyanicidal minerals that cause spikes in cyanide consumption is related to different zones. High-base metal sulphide concentrations may be subject to continual dose adjustments of cyanide, lost throughput, and the accumulation of large stockpiles of complex ore. The difficulties in the mineral process can be exacerbated if the resource is excavated using underground as opposed to surface methods, due to the inflexibility inherent in underground mining operations, as is the case at El Peñón. This inflexibility consists of tactical considerations such as the location of future and pre-existing mine developments, ventilation, drainage, communications, among others, in addition to site-specific complex logistics that exist in underground mining.
Geometallurgical challenges at El Peñón mine
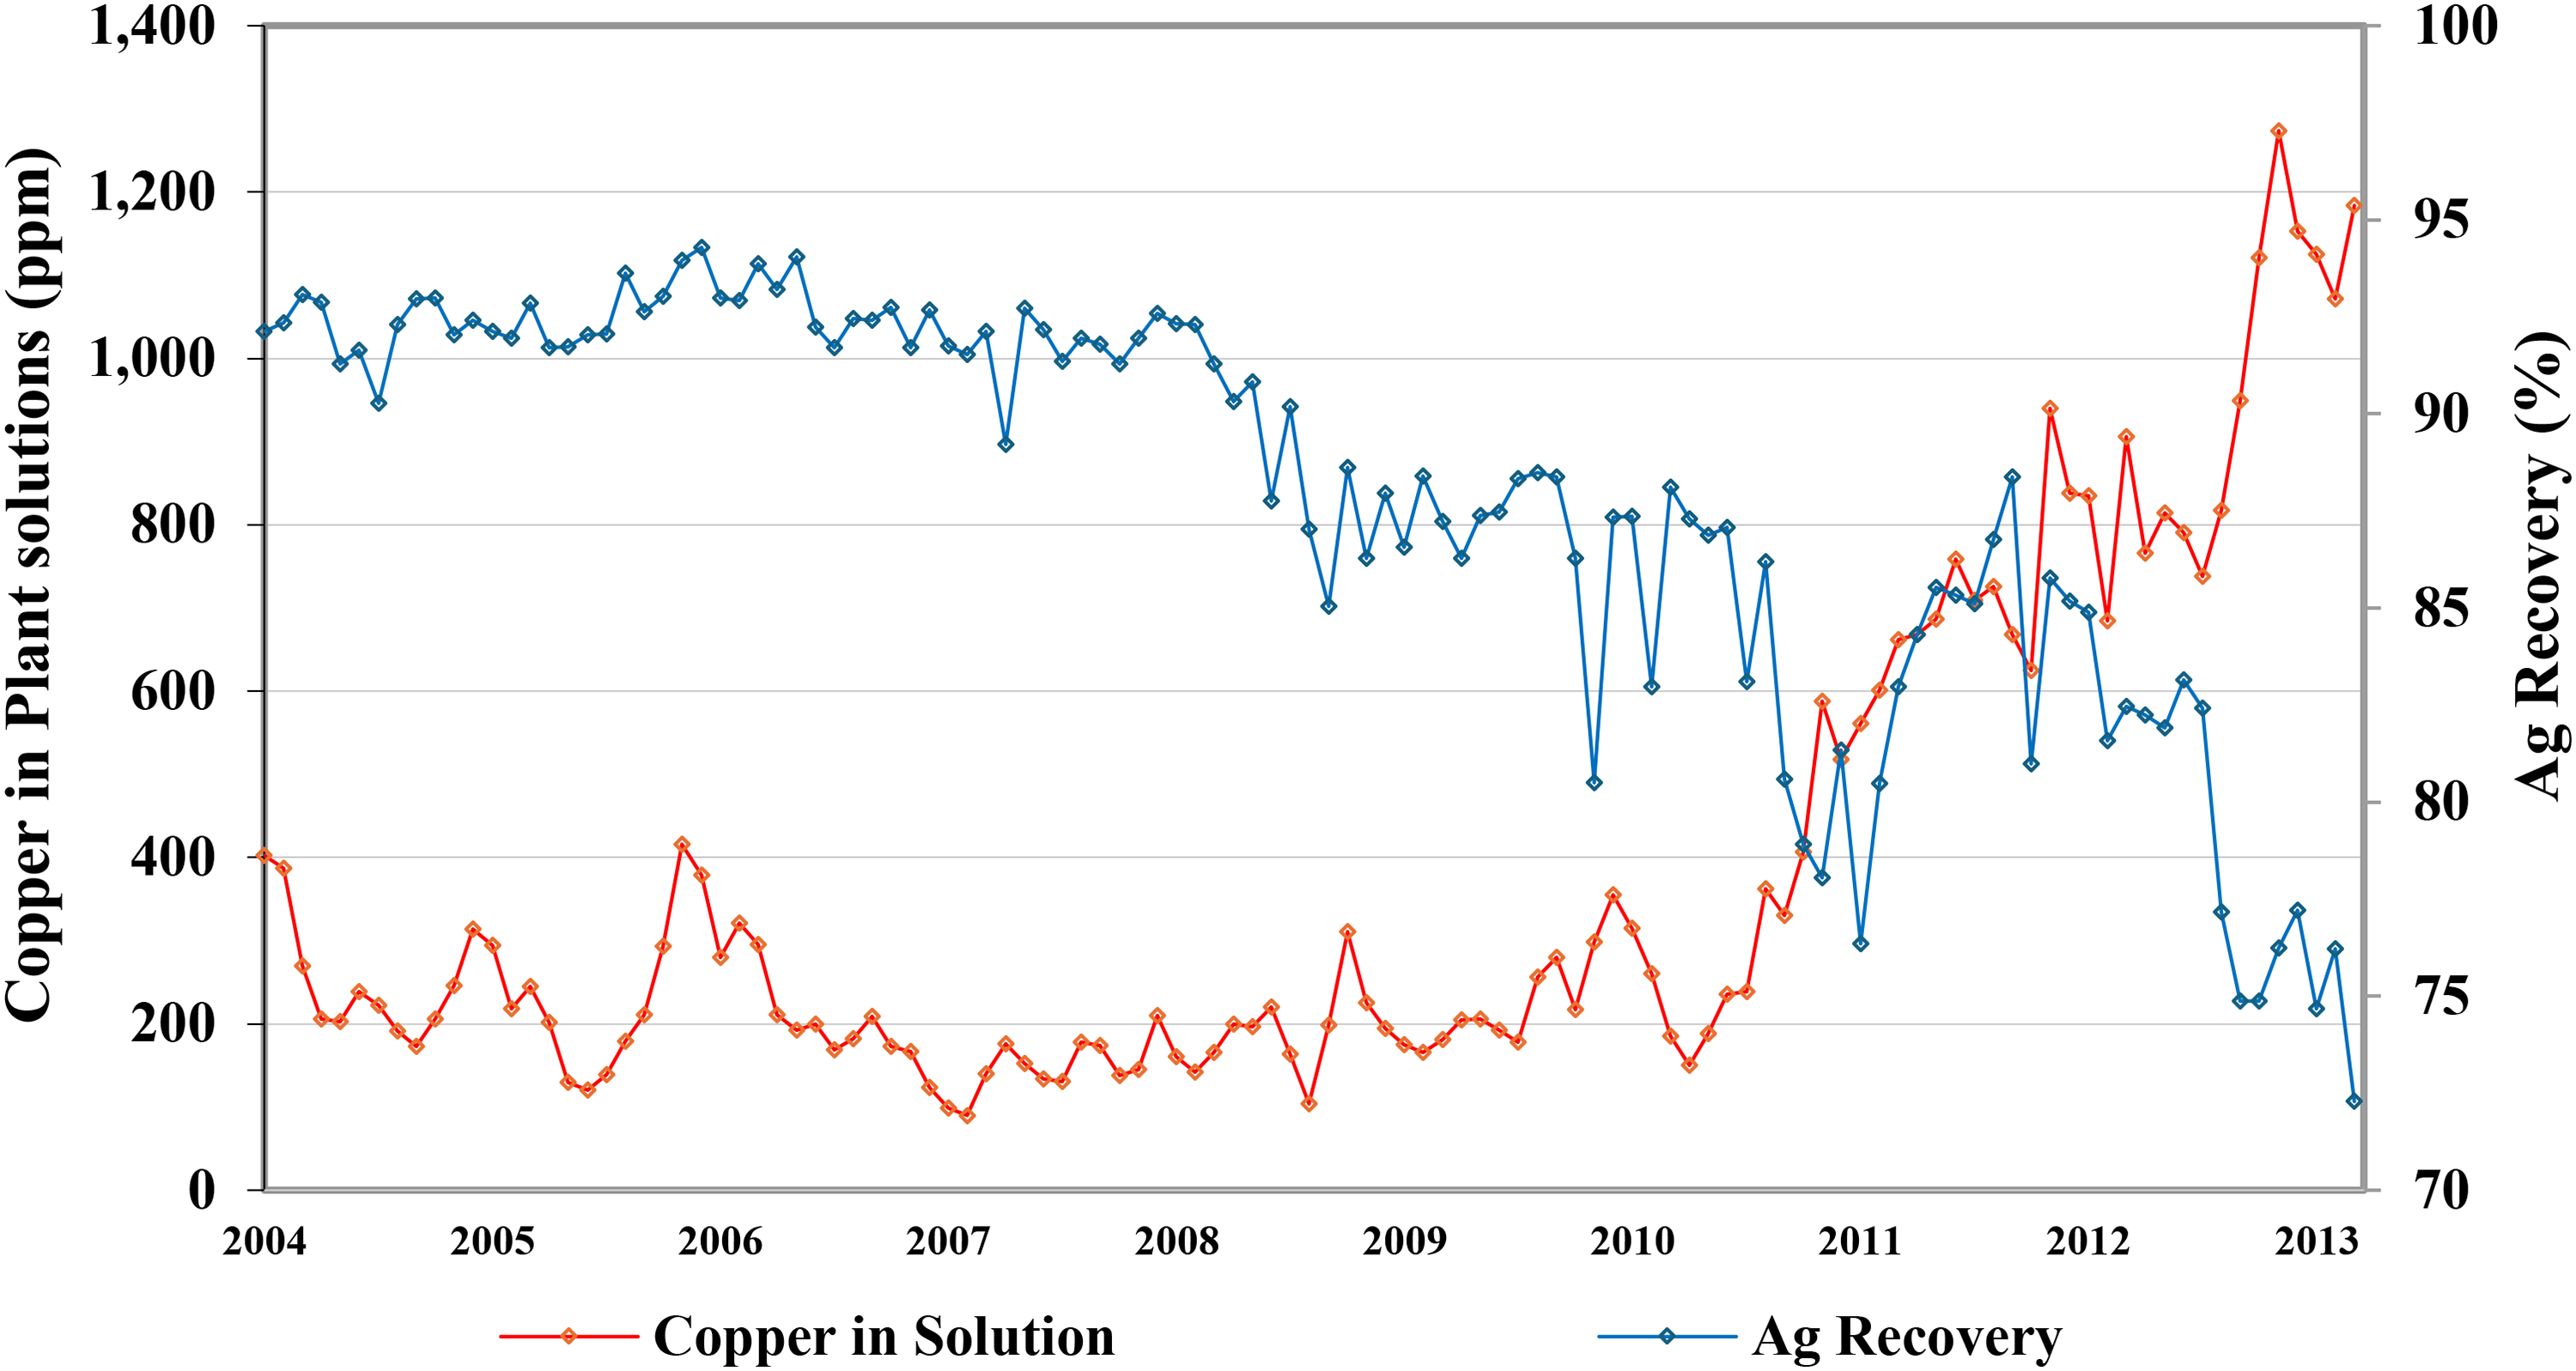
The impact of sulphide ore on the cyanidation of the El Peñón Au-Ag epithermal deposit was studied in. 17 Sulphide-rich veins contain refractory minerals and impurities that affect the Au-Ag leaching by sodium cyanide NaCN and had negatively affected gold and silver recoveries and increased cyanide consumption to historical levels. 17 Moreover, this increment was attributed to the higher concentration of process impurities in plant solutions, notably copper (Cu) and manganese (Mn). These impurities triggered undesired reactions, further reducing the overall process efficiency (Figure 4). To counteract the refractoriness of silver sulfosalts and stabilise Au-Ag recovery, cyanide concentrations were increased. However, this resulted in the solubilisation of more impurities that generated new operational problems throughout the process.
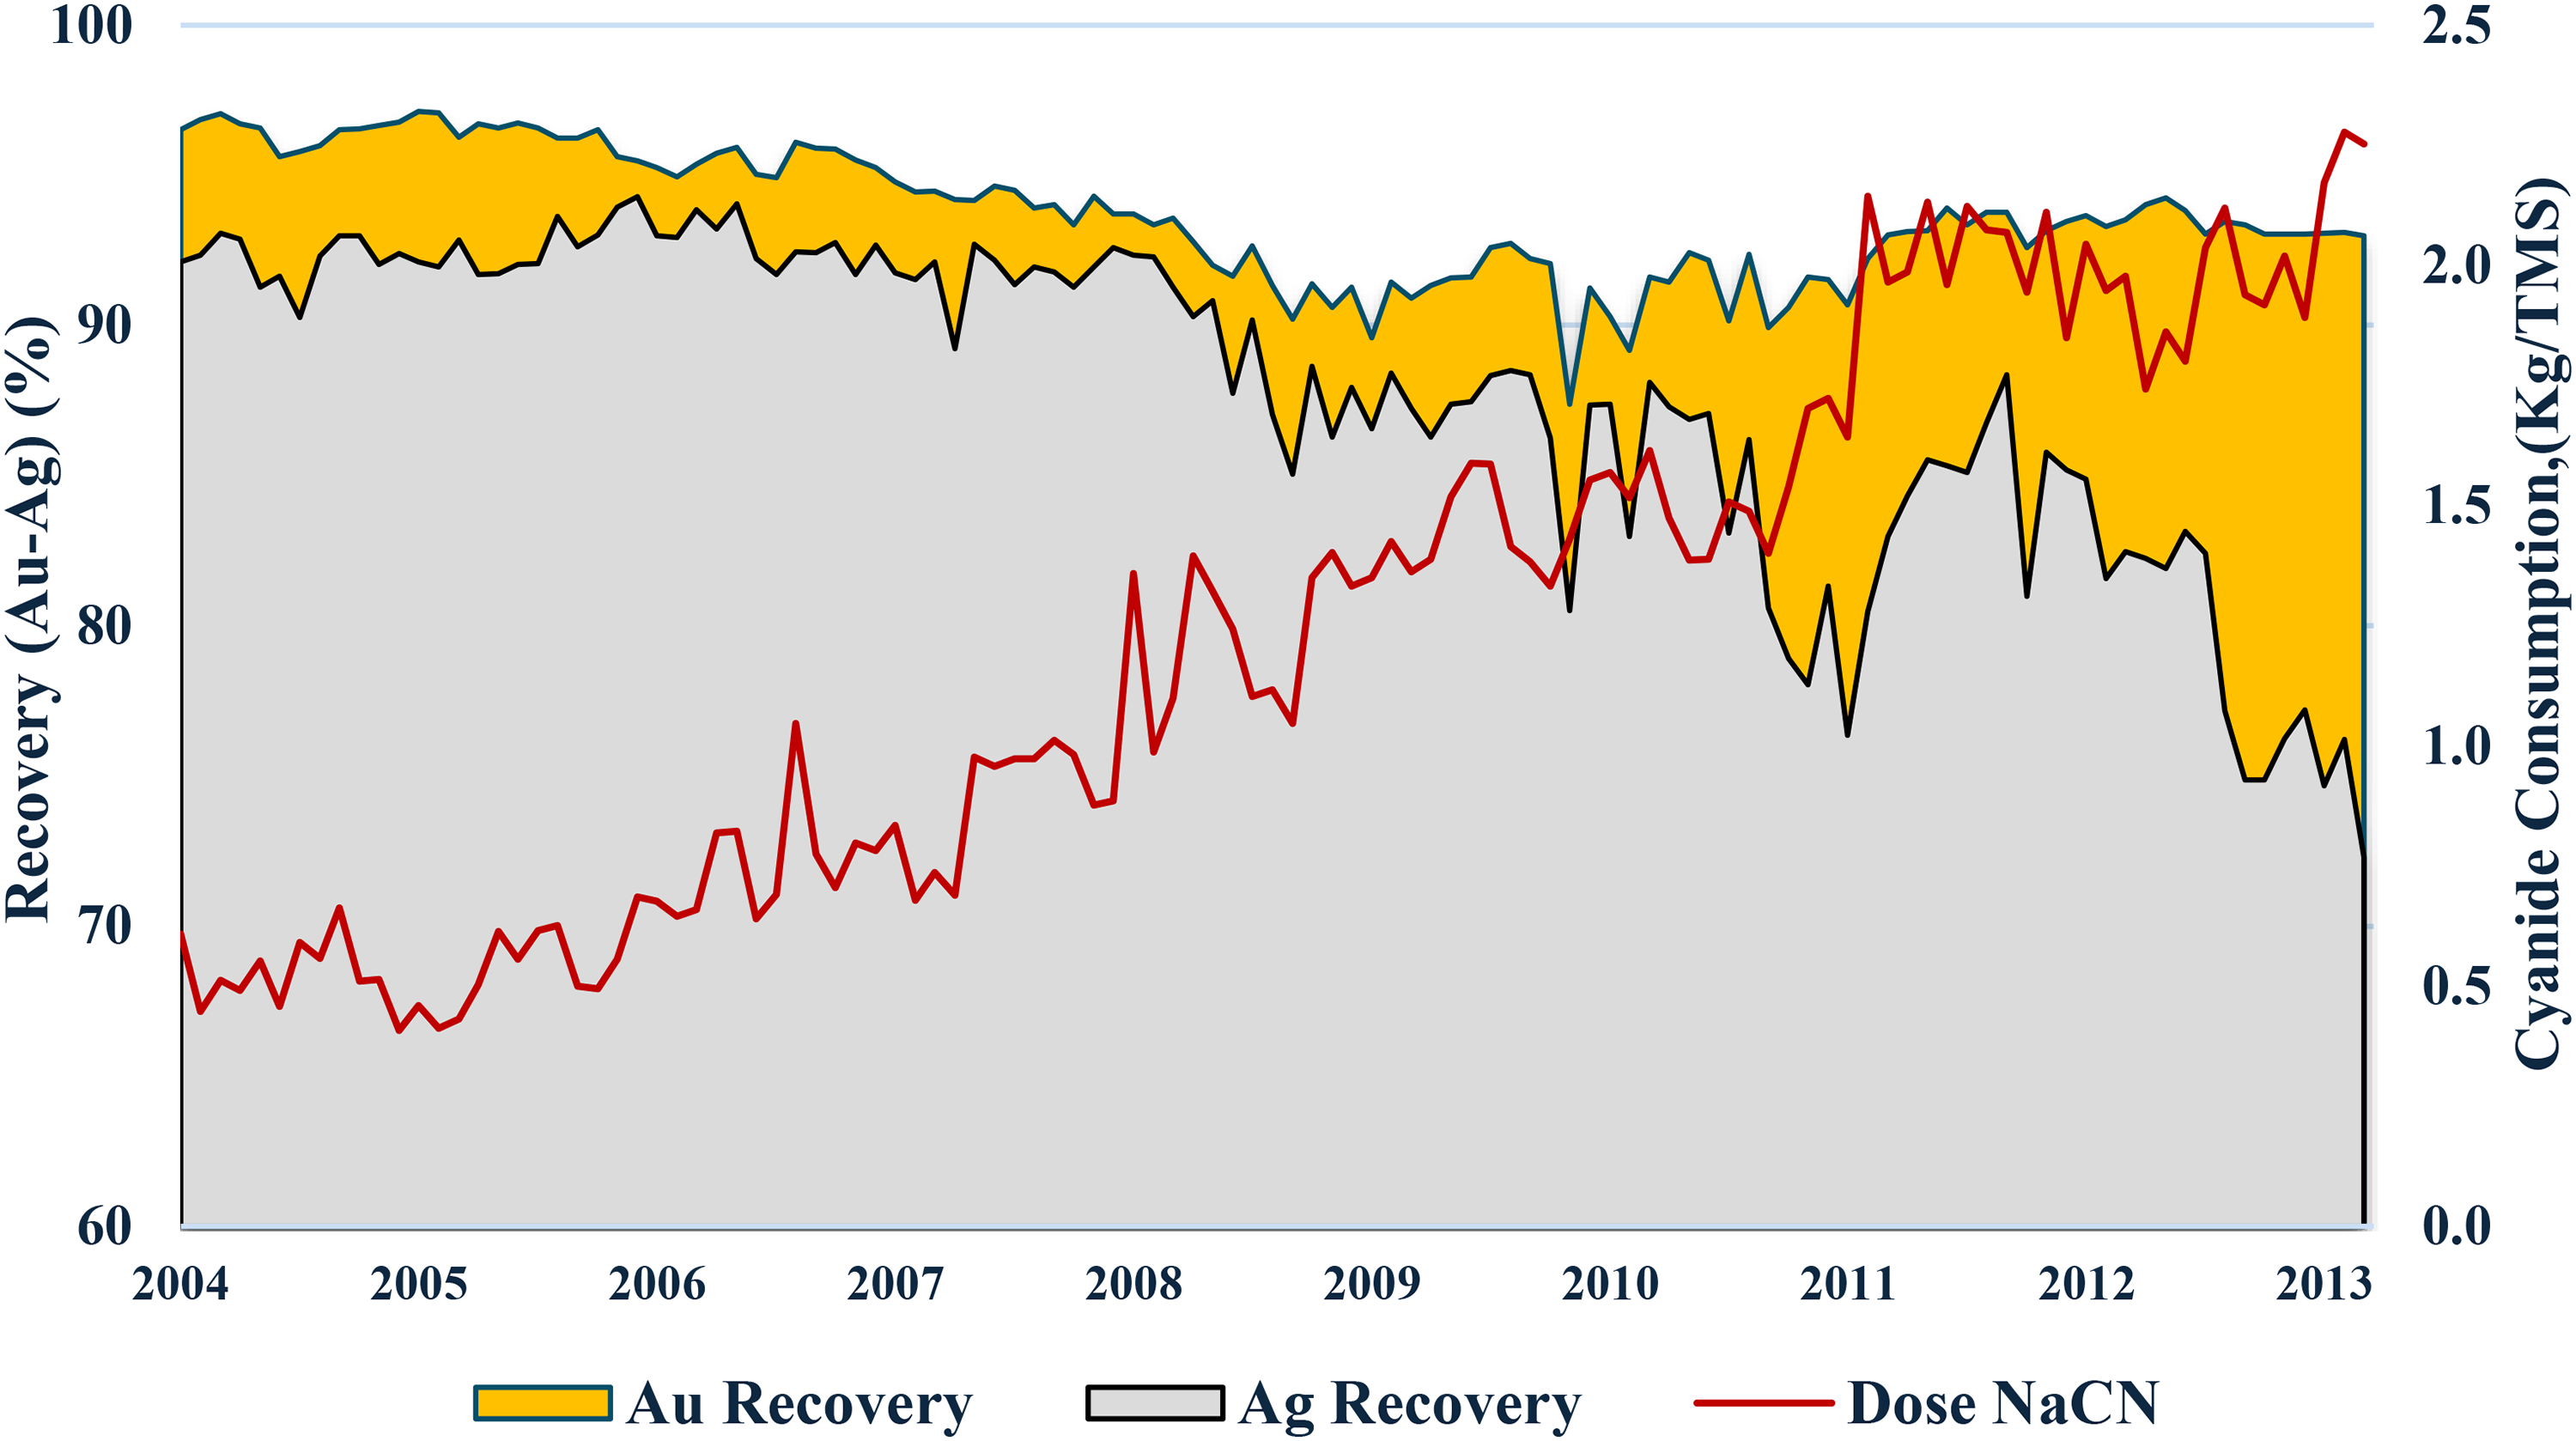
Gold and silver recovery and cyanide dosage between January 2004 and May 2013. The trend towards low recoveries is observed in September 2008 and from June 2010 onwards, which coincides with the entry into the production of sulphide-rich ore veins, and an overall increase in the NaCN dosage following 2010. 17 .
The losses in Ag recovery had become increasingly severe in 2010, as deeper veins were brought into production, containing sulphide ores with higher base metal content (Cu, Sb, Pb, Zn) than had previously been processed, as well as rhodochrosite that brought Mn. This radical mineralogical change led to a noticeable increase in impurities concentration of plant solutions, especially copper that reached a peak at roughly 1270 ppm, and significantly impacted silver recovery (Figure 5). Note that the gold recovery was nonetheless upheld (Figure 4).
Soluble copper concentration in plant solutions versus silver recovery in the period from 2004 to 2013. 17 .
As part of a reengineering effort, an industrial-scale test was carried out consisting of three stages, with results summarised in Table 1. The first was the 6-day feeding of ore from veins in oxidised zones, whose mineralogical and metallurgical characteristics for which the cyanidation leaching process had been initially designed; the Ag recoveries were restored to above 85% with NaCN average dosages of 1.38 kg/t, which is considered optimal and is also closer to results from previous years (Figure 4). In the second stage, the plant processed exclusively ore from the sulphide zones of the veins, which had unfavourable metallurgical characteristics. Consequently, Au-Ag recovery declined severely with a marked increase in cyanide consumption, reaching a consumption spike of 3.86 kg/t and a restriction in throughput. Finally, the ore blending was set to a nominal maximum limit for sulphide minerals of 30% (Table 1). Under these conditions, process performance stabilised, thus establishing what would be considered ‘normal’ given the new mineralogical context.
Results of the industrial test conducted at El Peñón processing plant in 2014, including a summary of the recoveries achieved and variation of the cyanide consumption (NaCN) during the three stages of the test. 17
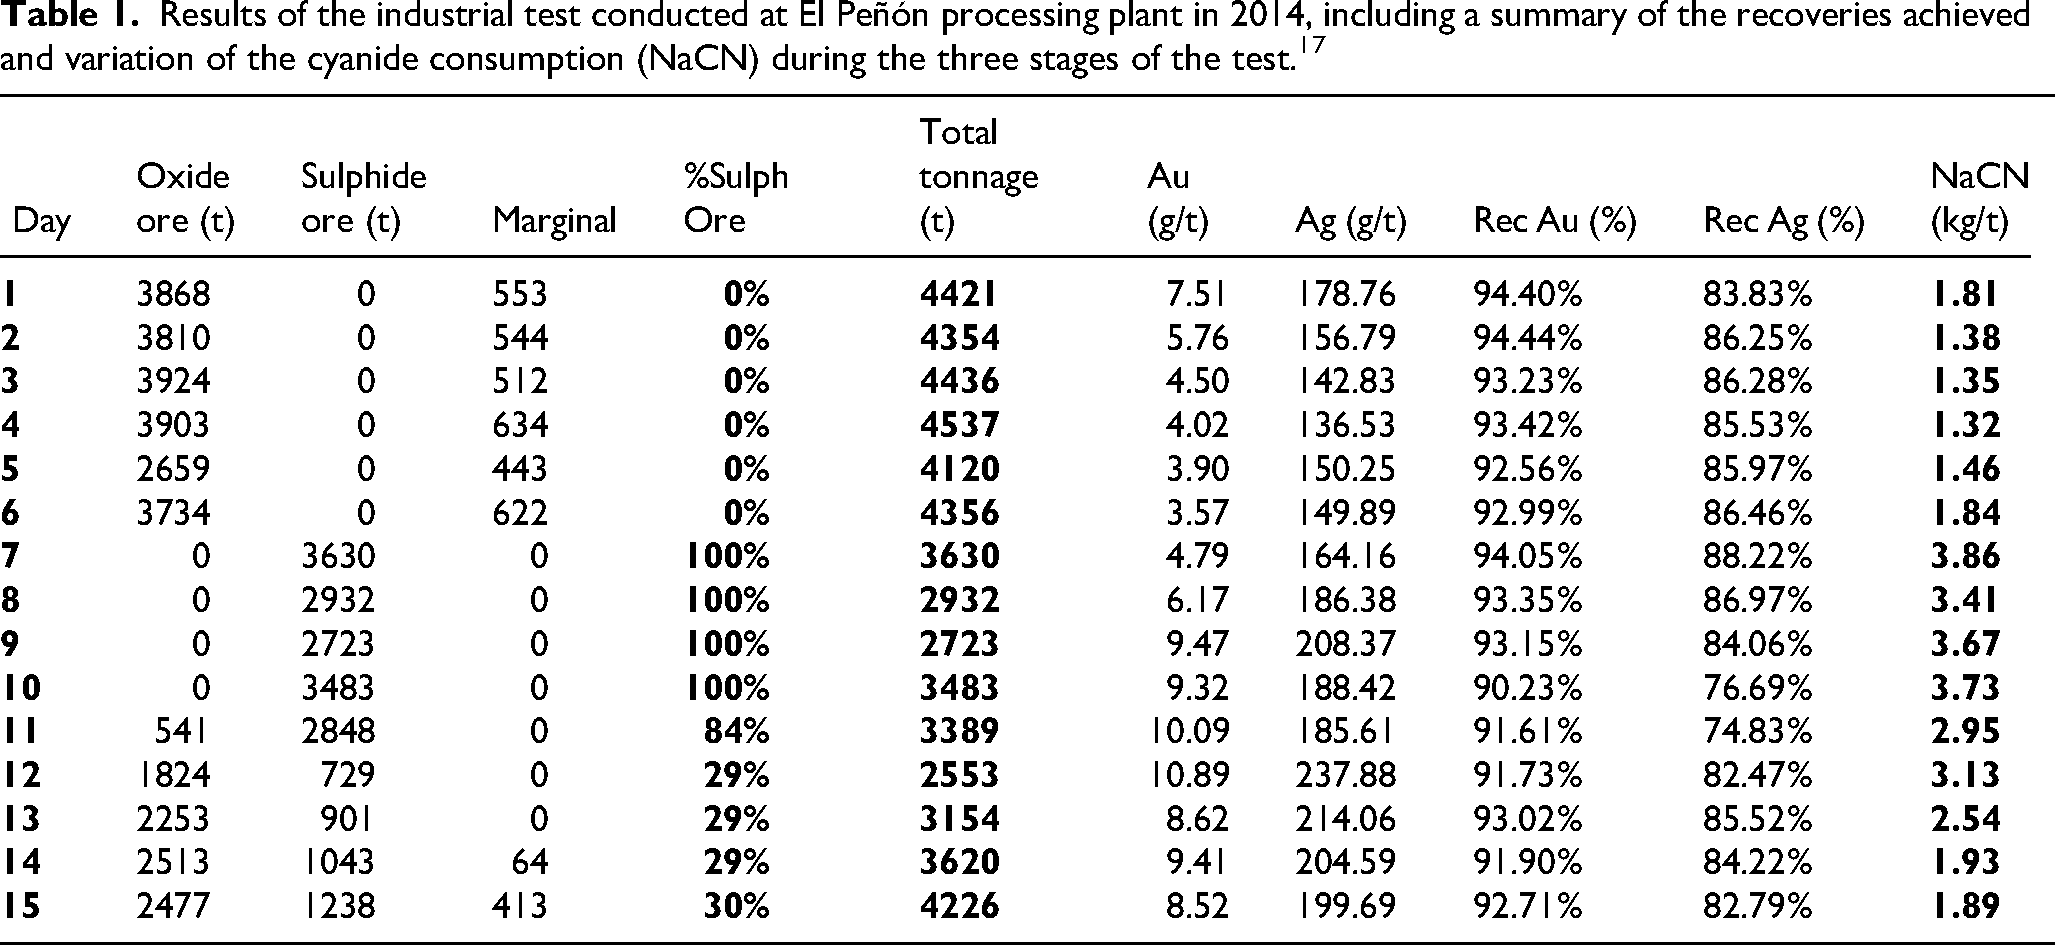
The 30% level of sulphide feed allowed progress into the deeper zones applying defendable cyanide dosages typically below 2 kg/t, but this would depend on the availability of further oxides supplies to constitute the other 70%; this restriction may not be easily compatible with the geometric limitations of narrow vein mining, unless tactical revisions of blending policies could become more prevalent. Beyond the 30% sulphide level, increased cyanide dosages would be required as a function of the exposure to cyanicidal minerals, but this function is difficult to ascertain.
On a simple level, the parasitic copper reactions result in complexes such as Cu(CN)2: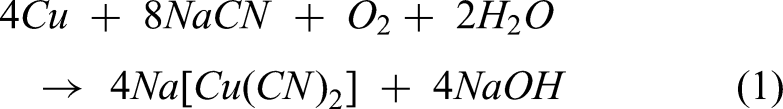
More broadly, cyanide complexes can be categorised into three main groupings, which are based on their thermodynamic stability constants k, from least to most stable:
Free cyanide (HCN, CN−). Weak acid dissociable cyanide (WAD) complexes, for which (log k) ≤ 30 approximately, including Strong cyanide complexes, for which (log k) > 30 approximately, including
Cyanide forms ionic complexes with metals,16,19 and indeed virtually all metal ions present in the El Peñón solution are associated with cyanide ions. Empirically, the presence of (strictly) free cyanide is not so relevant due to the occurrence of sulphide species in the mined ore (e.g. sphalerite, galena, and Cu-bearing sulphides such as chalcopyrite, chalcocite, and covellite). The low-stability cyanide complexes could behave essentially like free cyanide, albeit with slower reaction kinetics; the WAD complexes of category (2) having log k ≤ 30 are grouped together with the free cyanide, in what can be called ‘available cyanide’.
Yet the ever-deeper zones depicted at the bottom of Figure 3 expose the process to a combination of complicating Cu-bearing sulphides and Mn-bearing rhodochrosite. The micrographs of Figure 6 depict cyanide consuming mineralogy from these deeper zones, noting that chalcopyrite is itself resistant to the cyanide, i.e. is not cyanicidal, but the interwoven bornite is cyanicidal, as are the supergene copper sulphides such as covellite (Figure 4a) that can exhibit 90% solubility of their copper as they consume cyanide.
16
The rhodochrosite (Figure 4b) causes an additional portion of the otherwise available cyanide ions to be diverted into unrecoverable cyanates such as NaCNO−, as per the reaction: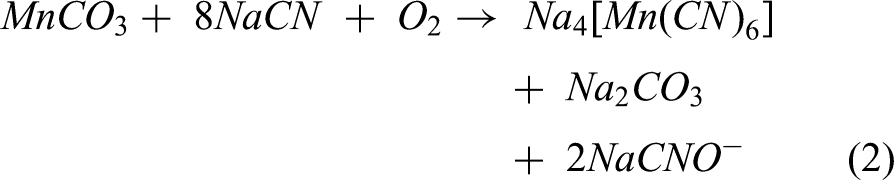

Cyanide consumer mineralogy (a) chalcopyrite (Cpy) intergrowth with sphalerite (Sph) and bornite (Bn) and showing chalcopyrite (Cpy) replaced by covelline (Cv) and chalcocite (Cc) (b) rhodochrosite (Rd) intergrowth with hydrothermal quartz (Qz). 17 .
This deeper ore is prone to operational problems, such as the precipitation of manganese-containing gels within pipelines (triggered by the undesired dissolution of different metallic ions due to spikes in the cyanide dosage and reacting with the lime of the process water), and it affects the physical and/or chemical quality of the doré bars in the refinery. 17 Even though rhodochrosite has only a moderate solubility in cyanide solutions, it can in some areas of the orebody be highly concentrated (Figure 6b) and is in proximity to copper sulphides that include non-cyanicidal (i.e. chalcopyrite) and cyanicidal minerals (Figure 6a). The form of rhodochrosite, bornite, covellite, etc affects the degree of cyanide consumption, including the grain size distribution and orientation, inasmuch as it is the exposure of soluble copper and manganese to available cyanide (free cyanide + WAD cyanide) that leads to unwanted cyanide consumption.
Through drillcore sampling of the incoming ore at the workface, as well as downstream performance monitoring, cyanide dosages can be adjusted, as well as other operational parameters. But an overriding factor in the deeper zones is the sudden discontinuities in the mineralogy due to post-mineralisation processes, and the sliding that would have occurred along fault lines. Within one single drift, over a matter of meters, part of the ore can be of one combination of minerals, dominated by oxides say, followed by a different strand that is dominated by a different combination of minerals, that is then followed further by return to the original oxides. Figure 7a is from the shallower oxide portion of the orebody, in which the discontinuities in mineral combinations are not as problematic for the cyanidation process as in Figure 7b taken from the deeper zone. Surrounding the paleo water line, the discontinuities can be from oxides to sulphides and back to sulphides, or vice versa. Furthermore, the mining method requires that the excavation adheres to the narrow vein, without the directional freedom to strategically plan the exposure to different zones, hence a reliance on stockpiling and blending to stabilise the feed.
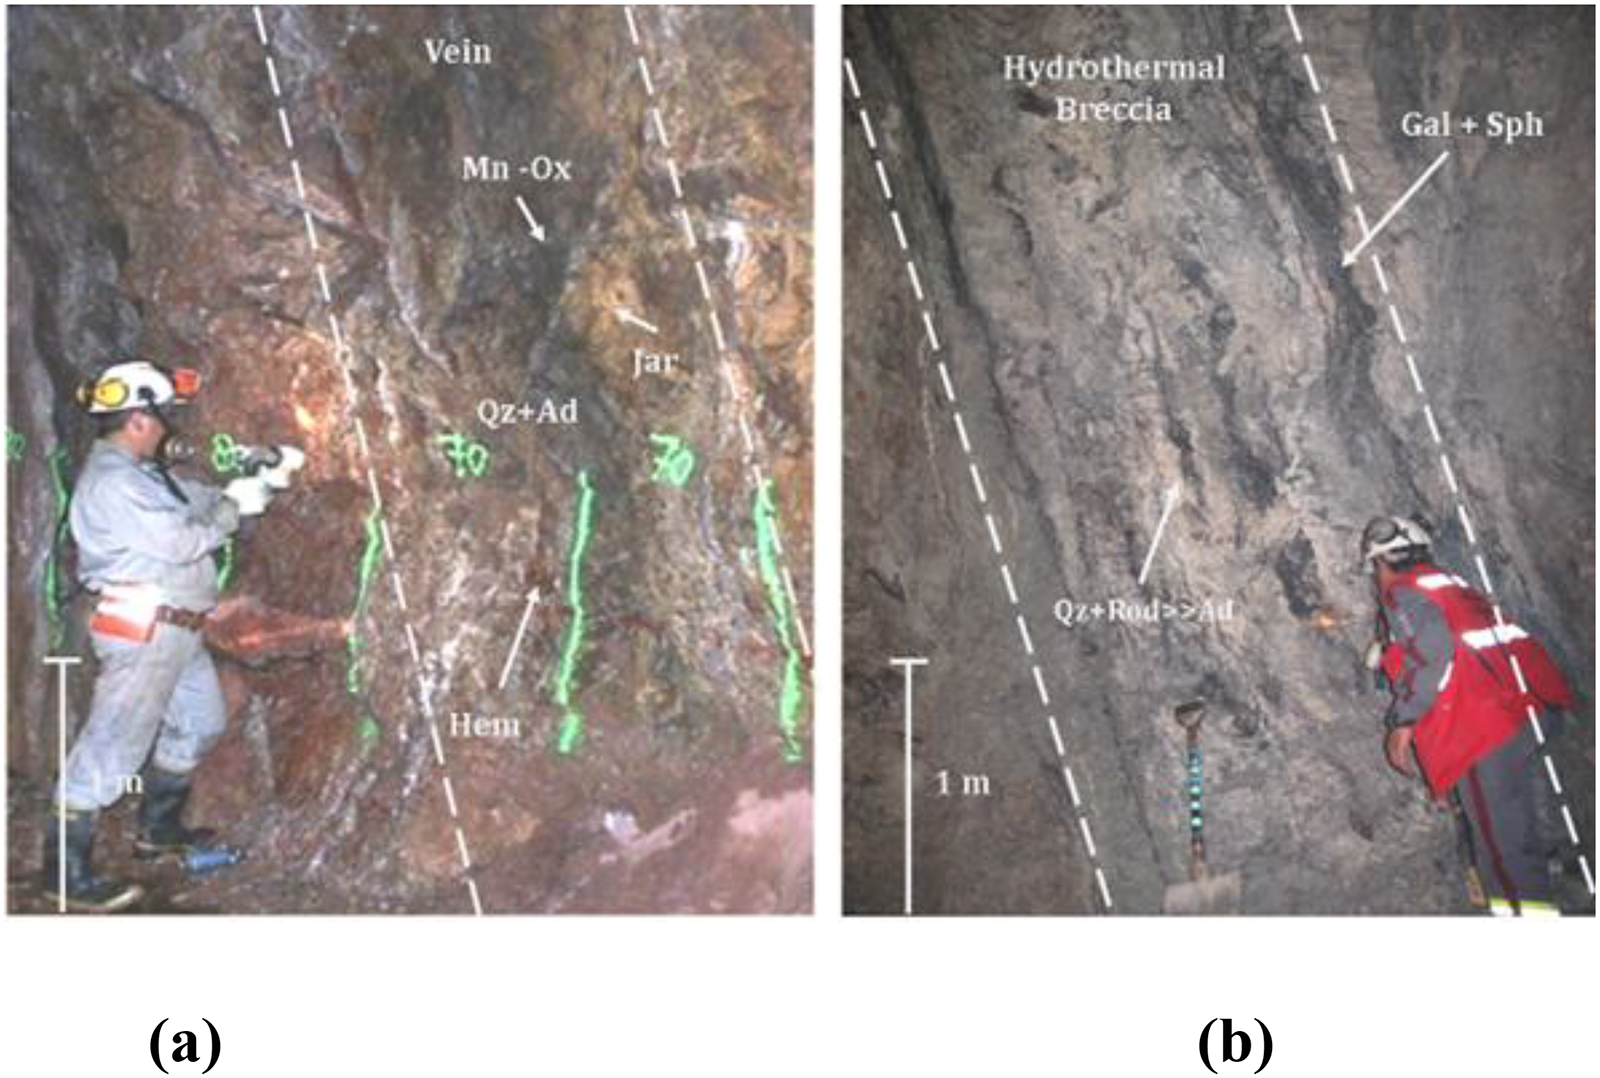
(a) Workface in oxide zone with quartz (Qz), adularia (Ad), and oxides such as jarosite(jar), haematite(hem) and manganese-oxide (mn-ox). (b) Workface in sulphide zone with quartz (Qz), adularia (Ad) mixed with and rhodochrosite (Rod), and sulphides such as galena (Gal), sphalerite (Sph).
The increasing knowledge of the deeper regions through sampling, and the experience in processing new combinations of contaminating base metals, becomes moot unless the overriding geospatial aspect is managed. In practice, the spiking of cyanide consumption can be modelled empirically or semi-empirically, leading to gold mines experimenting with different feed and reagent blends, in the formulation of different operational modes. However, depending on the nature of a continuous improvement or reengineering project, there can be an engineering phase in which the further operational modelling will be ineffective unless critical geological features are adequately represented and managed. The experiences at El Peñón17,20 have depended on operational modes in which the blending and stockpiling practices that stabilise the cyanidation are specifically in response to the spatial discontinuities in mineral types. The resulting simulation framework supports stochastically sourced dynamical mass balances, which can be developed incrementally, with increasing levels of modelling detail. Indeed, within a multiphase engineering project, the critical limitations of a simulation model in one phase become prioritised within the next phase of model development, thus guiding that next phase. As depicted in Figure 2, the representation multidimensional geospatial aspects can be a challenging leap. Decision-makers must be made aware of the limitations of any simulation model, at one level, to decide if the simulated results provide sufficient confidence to commit to operational changes or, at another level, to indicate which parts of the model should be further developed before any operational or design changes could be justified. The narrow vein context is notable because the two-dimensional geometry greatly diminishes the entry barrier for critical features, such as impactful mineralogical discontinuities.
Simulation methods
Sequential Gaussian simulation
Monte Carlo simulation frameworks use random number generation to relate input probability distributions to output probability distributions. While a single deterministic run relies on specified input parameters and results in one set of outputs, the Monte Carlo approach applies numerous replicas, each with different parametrisation that is the result of random number generation, thus leading to a collection of results of all the individual replicas, which form output distributions. In summary, Monte Carlo simulations convert input distributions into output distributions. SGS is indeed a kind of Monte Carlo simulation, in which the input distributions condition the geological attributes throughout the simulated volume of rock that extend from the sample measurements (‘hard data’), and the output is the distribution of possible geological scenarios. Each SGS replica is therefore an equiprobable image of a geological scenario that is consistent with the input measurements.
The SGS method and variations thereof have long been utilised in resource estimation communities20–23 and has been pivotal within modern resource estimation. From an epistemological perspective, it is the merger of geospatial modelling with the principles of Monte Carlo Simulation applying Normal (a.k.a. Gaussian) distributions to condition the simulated attribute values. There are computationally efficient methods for randomly generating data using a Normal distribution N[μ, σ], such as the Box–Muller transform and the Ziggurat algorithm,24,25 which are incorporated into SGS. The current discussion is intended to be a concise overview of SGS, noting that more rigorous treatments are available such as. 3
Suppose there are nS sample points located in space {(xi,yi,zi)| i = 1, 2, …,nS} where numerical measurements have been made resulting in the so-called ‘hard data’, and an additional nU unsampled points located at {(xi, yi, zi)| i = (nS + 1), (nS + 2), …, (nS + nU)} at which measurements have not been made. SGS creates nG equiprobable geological scenarios by utilising the nS measurements of a geological attribute to simulate values at the remaining nU sample points. The hard data is maintained within each of the nG scenarios, while the nU randomly generated data will each be different for each of the scenarios. The steps for SGS are as follows: Normalize the sample data Model the variogram using the normalized data For j = 1 … nG Construct a random sequence to visit the nU unsampled points For i = (nS + 1)…(nS + nU) Use the variogram model to extend and solve the kriging system of equations Use kriging interpolation weights to compute the mean μ
i
and variance σ
i
2 Randomly generate a value from N[μ
i
,σ
i
] and assign it to the point (xi,yi,zi) Include the newly simulated point value into the conditioning data Denormalize the data, hence completing scenario j
In this context, ‘normalize’ implies redistributing the data with respect to a standard Normal distribution N[0,1] and, after each of the nU data have been generated, ‘denormalize’ implies distributing the data back into the original scale. Moreover, the generated data is sensitive to the sequence in which the points are visited, as each generated value successively conditions the subsequent values; therefore, rather than having a fixed order in which the nU points are simulated, a different random sequence (permutation) is used in each of the nG scenarios, by applying a permutation method such as the Knuth shuffle. 26
SGS depends on kriging which, in turn, depends on variography (Figure 8), i.e. the plotting of inter-sample variation versus inter-sample distances a.k.a. lags. The SGS algorithm requires a variogram model which parametrise how a value at a specific location is conditioned (influenced) by neighbouring values. For instance, in an anisotropic field the value at a point may be more influenced by neighbours along a particular direction, hence favouring neighbourhoods having an ellipsoidal character rather than spherical. For certain geological structures such as veins or domes, a variogram model may be more representative if the inter-sample distances are quantified within a geometrically transformed (‘folded’) space, rather than the natural Cartesian space. A more complete discussion on variography is presented by 1 for example, but in general a variogram includes (1) an innate localised variation which constitutes the so-called nugget effect, (2) a range of inter-sample lags beyond which two sample points are deemed independent, and (3) a concave-down curve used to model the transition from the localised variation towards the far field variation. The concave-down curve is typically composed of 1–3 component functions that have spherical or exponential shapes.
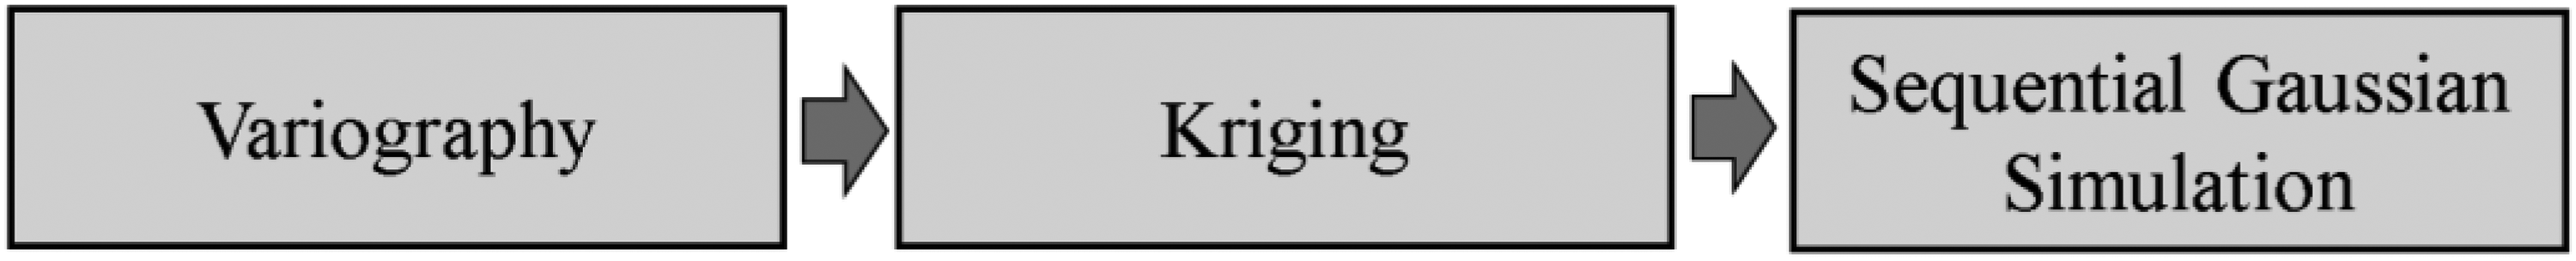
Sequential Gaussian simulation in relation to kriging and variography.
In practice, sample drilling is rarely uniformly distributed, often clustering in high-grade or high-value areas, which can bias global statistics, hence the need for declustering. This is an important pre-processing step that is applied to the initial sample data that counteracts the sample bias by assigning weights to data points based on their spatial density. Variogram modelling is something of an art form; nonetheless a proposed variogram can be validated through SGS if the data within the resulting scenarios capture the essential features of the orebody. In practice, this validation includes a visual assessment of the geological scenarios, and an inspection of histogram plots and other numerical and graphical aids. A quantitative comparison of the output histogram plots to the input histogram can be accomplished through goodness-of-fit measures such as χ2 or Komolgorov–Smirnov. 9
There are two main forms of kriging that are commonly used within SGS, namely simple kriging (SK) and ordinary kriging (OK), both of which rely on least-squares optimisation to attain an interpolated attribute value μi at a point (xi,yi,zi) that, if appended to the previously available values (i.e. the conditioning data) at points {(xi’, yi’, zi’)}|i’=1, 2… (i-1)}, will yield minimal variance σi2. Both SK and OK produce a system of linear equations in order to establish the kriging weights; however, OK enforces an additional constraint that these weights should sum to 1 and is thus a constrained least-square optimisation (which features a Lagrangian multiplier). More details for the SK, OK, and other kriging formulations are described in. 1 The current paper applies OK which is more robust to localised variations in the mean, i.e. so-called departure from non-stationarity.
Given the kriging weights, the interpolated value μi is a weighted sum of the neighbouring conditioning data. As indicated in the preceding algorithm, these results (μi, σi) are used to parametrise a Gaussian random generation, and the resulting randomly generated value is considered as conditioning data for each of the remaining points {(xi’, yi’, zi’)}|i’=i + 1, nS + nU}. An important nuance within the SGS algorithm is that the system is extended by one linear equation for each newly simulated point that is incorporated into the conditioning set. By applying specialised matrix techniques, only a marginal amount of computational effort is required to solve the ith kriging system as partial results from the preceding (i-1)th kriging system are successively utilised. These partial results constitute a lower triangular matrix known as a Cholesky factor Ki, and for SK, the ith Cholesky factor contains the (i-1)th Cholesky factor Ki−1 as a submatrix, which in turn contains the (i-2)th Cholesky factor Ki−2, and so on. As described by, 27 Cholesky decomposition is a particular form of the so-called LU decomposition (a.k.a. Lower–Upper decomposition) that allows efficient solution of symmetric linear equations, such as the SK and OK systems which are present within the SGS algorithm.
Practical implementations of SGS depend on computationally efficient approaches to solving the kriging system. Notably, generalised sequential Gaussian simulation (GSGS) arranges the kriging systems according to groups of points, 28 which reduces the computation time by a factor of 10, but also biases the sequence and results in a visual artefact known as the screening effect. SGS can additionally be extended to incorporate correlated measures, e.g. there could be relatively high-density mineralogical samples which are correlated to the comparatively less dense cyanidation (geometallurgical) sample points; hence the mineralogical samples through their correlation with cyanide consumption potential contribute the geospatial modelling of cyanidation consumption potential. This involves a modification of the Figure 8 to include cross-variograms, correlating the sampling of one variable at a set of locations to the measurements of another variable at a different location, to then apply so-called co-kriging, 29 which parametrises the means and variations for Gaussian distributions sequentially within sequential Gaussian co-simulation.
SGS is part of a subclass of Monte Carlo simulation named conditional simulation (Figure 9), specifically two-point conditional simulation. Conditional simulations are conceived to maintain local measurements (hard data) as well as local spatial means (first-order condition) and local spatial variation (second-order condition), and potentially higher order cumulants in the case of higher order conditional simulation. Other than SGS, which is appropriate for parametric (i.e. Gaussian-transformable) attributes, the next most important two-point technique is sequential indicator simulation (SIS) which can be appropriate for non-parametric attributes including discretized and categorical attributes.11,22 Standard implementations of SGS, SIS, and other two-point techniques require that the spatial continuity be described by variograms. Alternatively, multiple-point techniques can be constructed to capture progressively complex macroscopic patterns. Multi-point and higher order conditional simulation techniques are described in books such as30,31; as with SGS these more advanced techniques also have not been incorporated into dynamic mass balancing frameworks such as those based on DRS and could be featured in future work. Within the current work, the novelty is in the application of the DRS-SGS framework to the geometallurgy of narrow vein gold mine, utilising the restricted geometry for a defensibly simplified representation of mine sequencing.
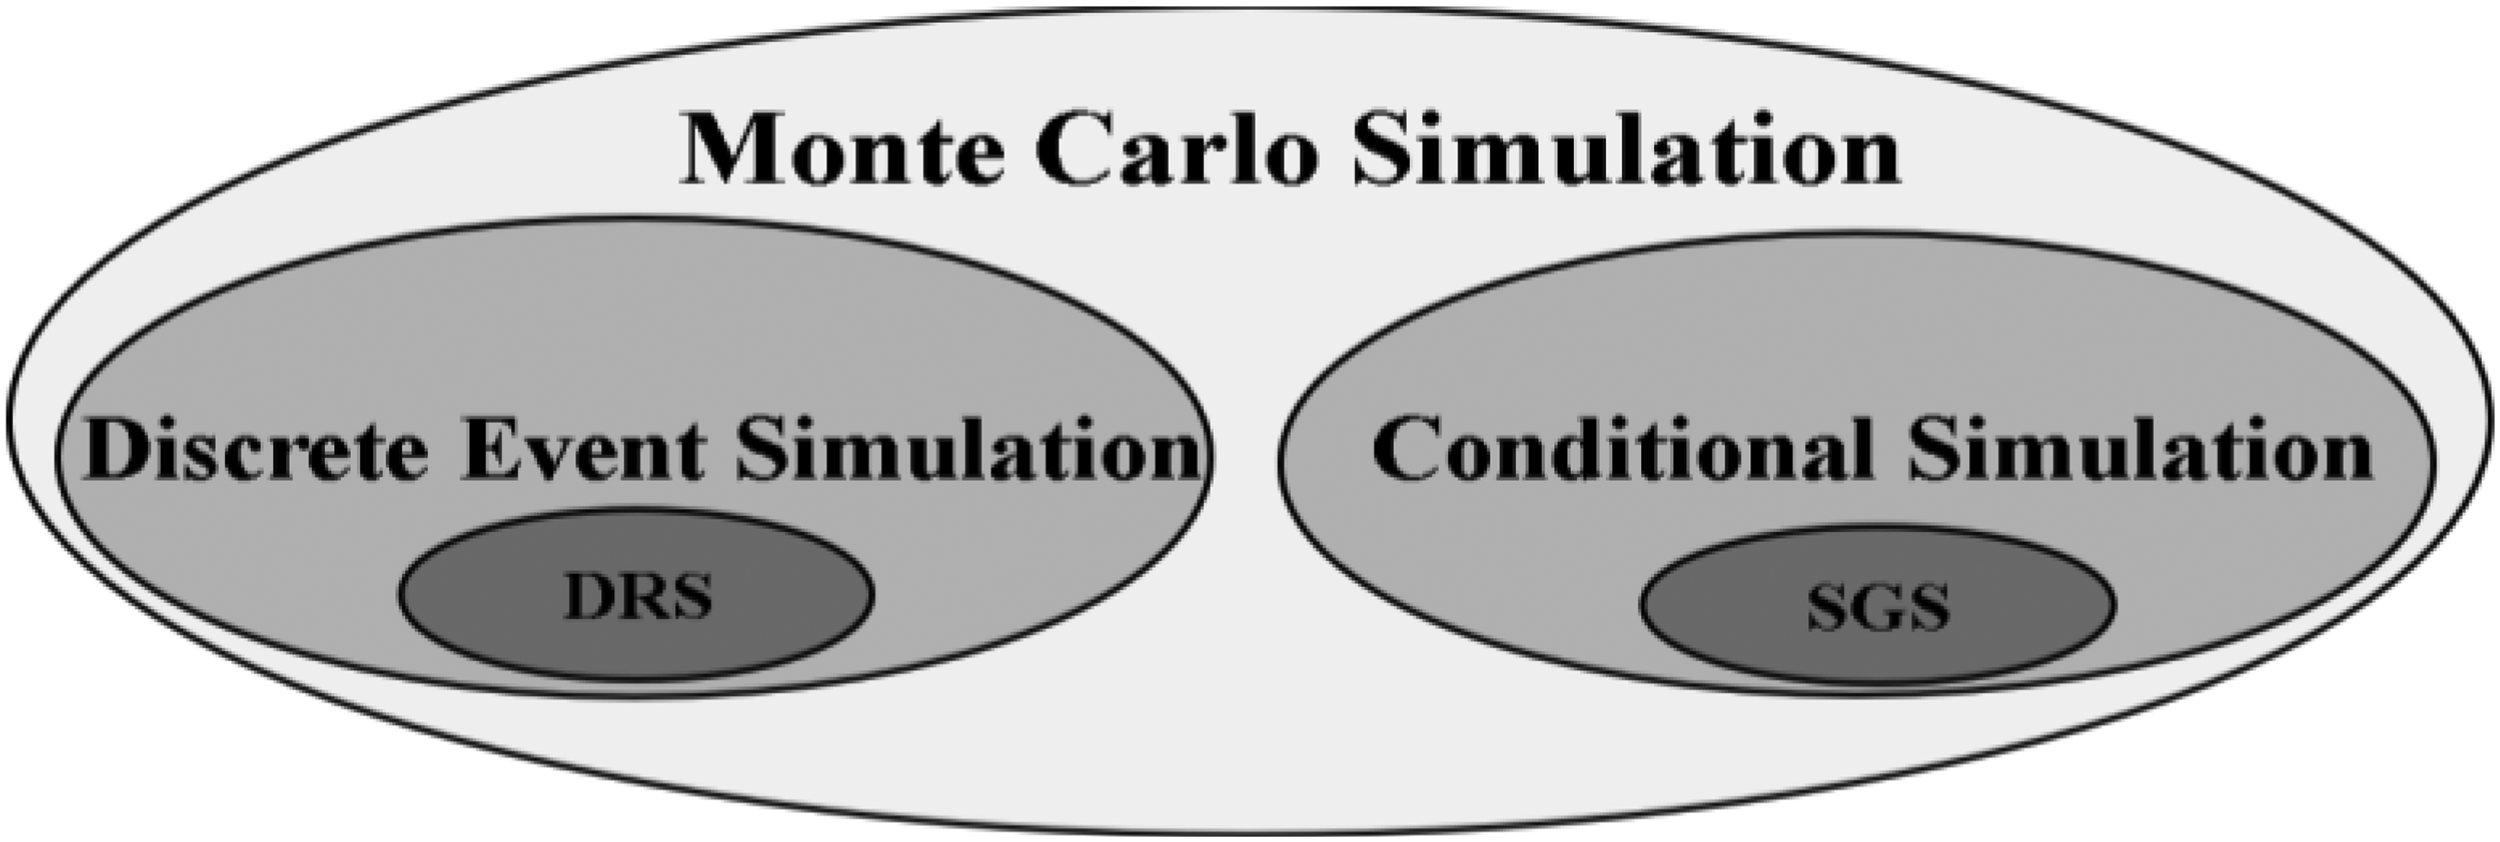
Monte Carlo frameworks. On the left side, discrete event simulation contains discrete rate simulation as a subcategory, and on the right side, conditional simulation includes sequential Gaussian simulation as a subcategory.
Discrete rate simulation
This work is an adaptation of the DRS framework that was initially developed by Navarra et al. 4 and later applied to gold extraction, 8 and finally an initial attempt at a geospatial representation that had been based on SIS. 11 This first incorporation of two-point conditional simulation overlooked the foundational relevance of SGS and DRS within the 2D context, as a step towards generalising the approach respectively towards (1) advanced techniques in geostatistical simulation, (2) hybridised simulation paradigms including discrete events and rates, and agents, with various level of hierarchical modelling of operational and non-linear physicochemical phenomenon, and (3) full three-dimensional representations of the orebody and mining technique.
DRS is a kind of Monte Carlo simulation that represents dynamic systems whose state variables have piecewise linear dynamics (Figure 10a) and is arguably the most basic approach to dynamic mass balancing. The state variables are represented over time by pairs of levels and rates (lj, rj), for j = 1, 2, … nSV in which nSV is the number of state variables. The simulation progresses through a series of discrete events, whereby the ith event causes an updating of the levels in accordance with continuous piecewise linear dynamics,

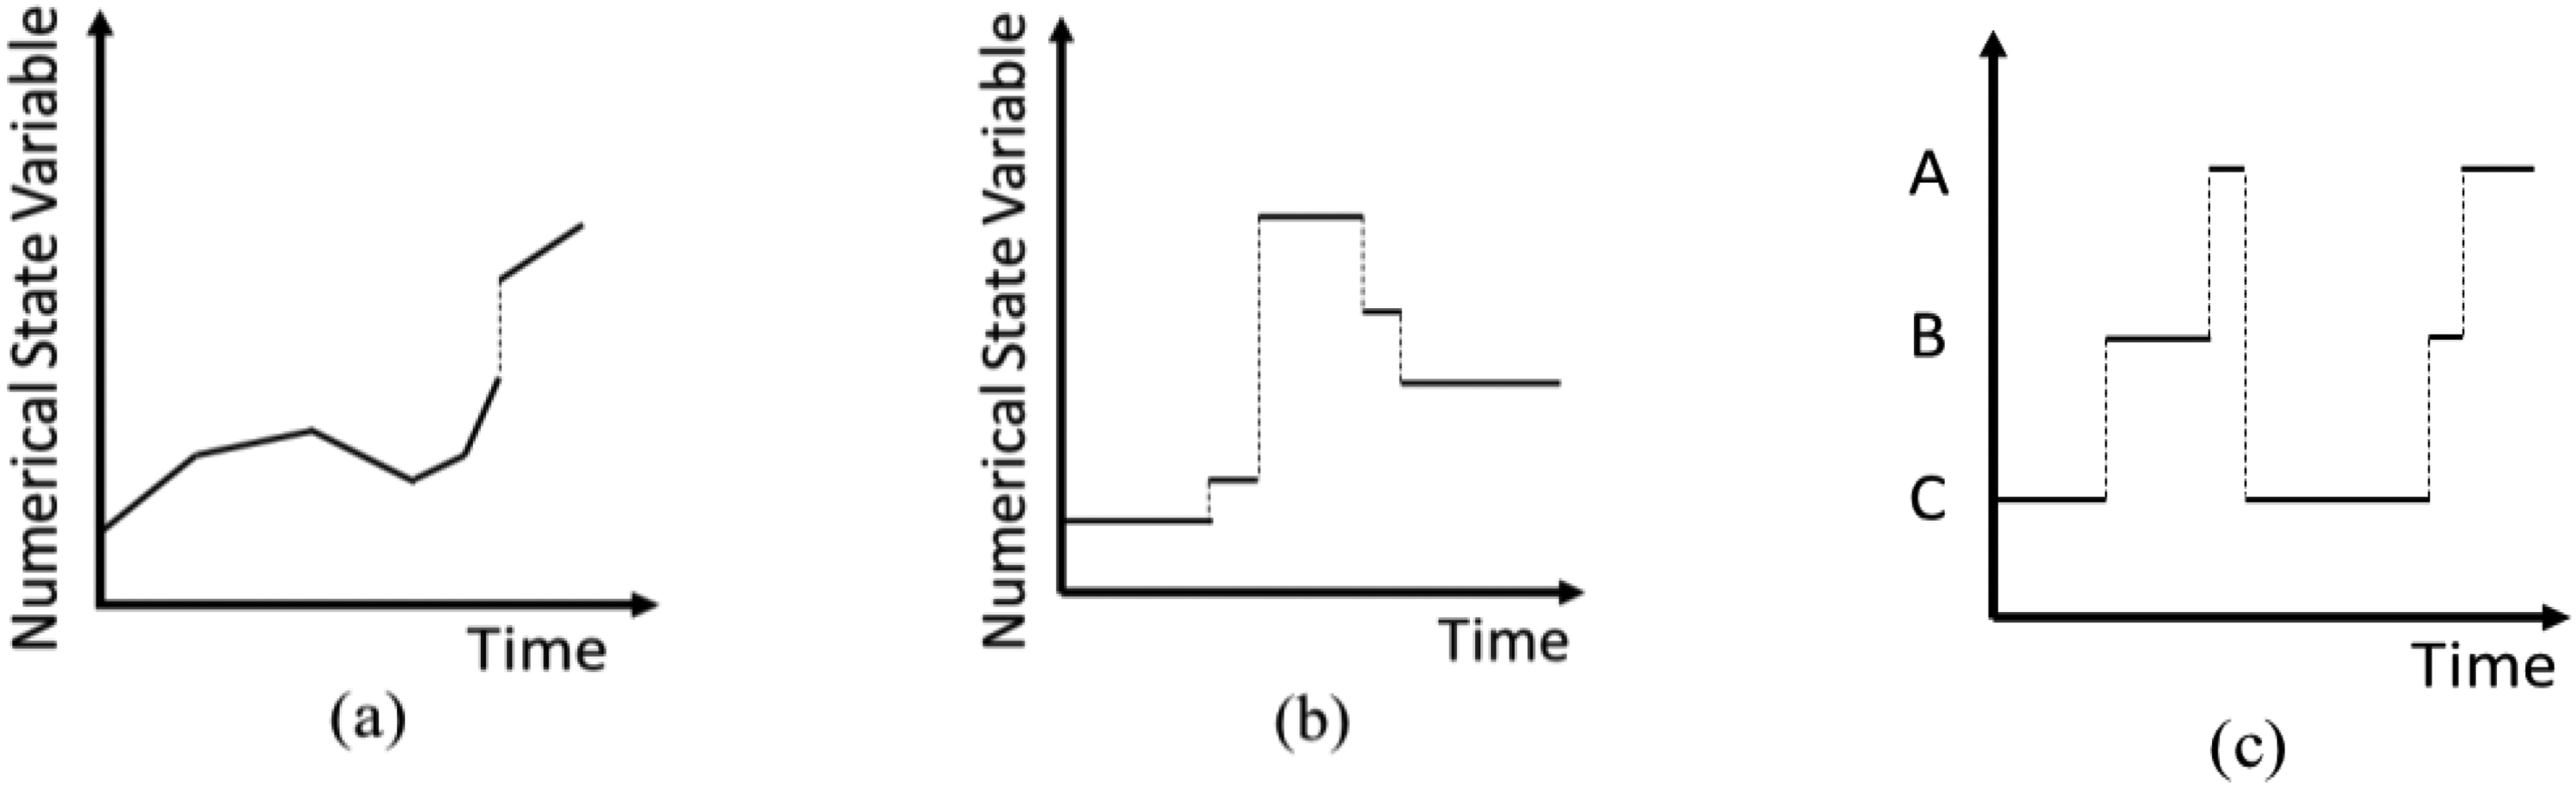
(a) State variable with linear evolution during simulation, (b) discrete numerical state variable evolution during simulation, (c) categorical state variables evolution during simulation.
Within Equations 3 and 4, ti denotes the time of event i, whereas ti−1 represents the time of the preceding event. In general, the time between events (ti – ti−1) can be the result of random number generation. The 2019 formulation 4 places particular emphasis on threshold crossing events, e.g. when a certain type of feed is exhausted, and the cyanidation process is therefore adjusted to accommodate a different blend. The original formulation 4 and subsequent work7–11 used threshold crossing events to model the geological variation of the incoming portions of ore entering the mineral process.
This modelling was done in the form of ‘parcels’. Each parcel may be considered to represent a composite of several excavation zones, whereby at any given time a single ‘parcel’ is being excavated containing a combination of waste rock and various types of ore. The depletion of this so-called parcel corresponds to a threshold crossing event (i.e. there is zero tonnes remaining in the current parcel), at which point the next parcel is randomly generated, containing a new blend of waste rock and ore. If the new parcel consists of the same blend of waste rock and ore, then the change in geological character is in comparison to the previous parcel based on local statistical variation, otherwise the contribution of new facies is generated using a parcel that is generated using global statistics (Figure 11). Now, this current paper presents simulations in which the generation of the parcels is informed by the predetermined mine plan in conjunction with the corresponding block model constructed from SGS generations (Figure 12). Each SGS replica produces a different scenario of what the orebody might be, which is then used within a DRS replica to simulate the operational response. Previously, the parcels had been generated by elementary random number generation, without reference to an explicit orebody model and mine plan (Figure 11).
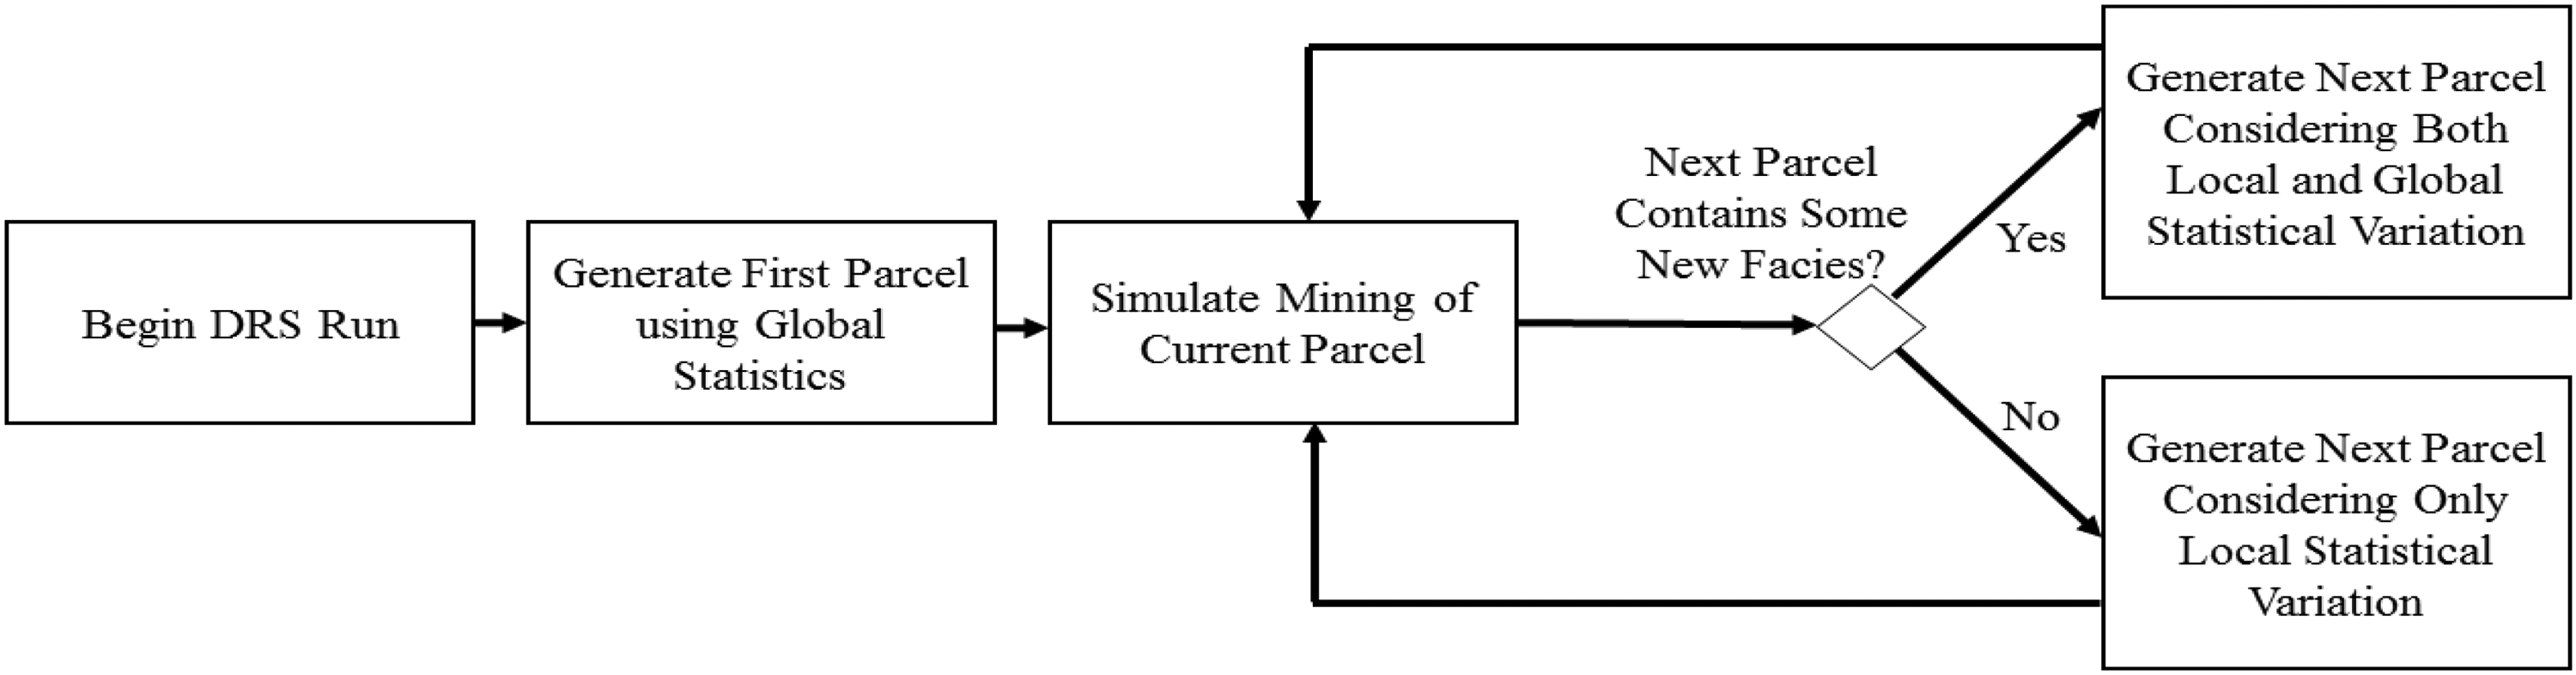
Simple Monte Carlo approach, which does not explicitly consider the spatial distribution of geological data. Within this approach, subsequent incoming tonnages (parcels) are generated during each DRS. DRS: discrete rate simulation.
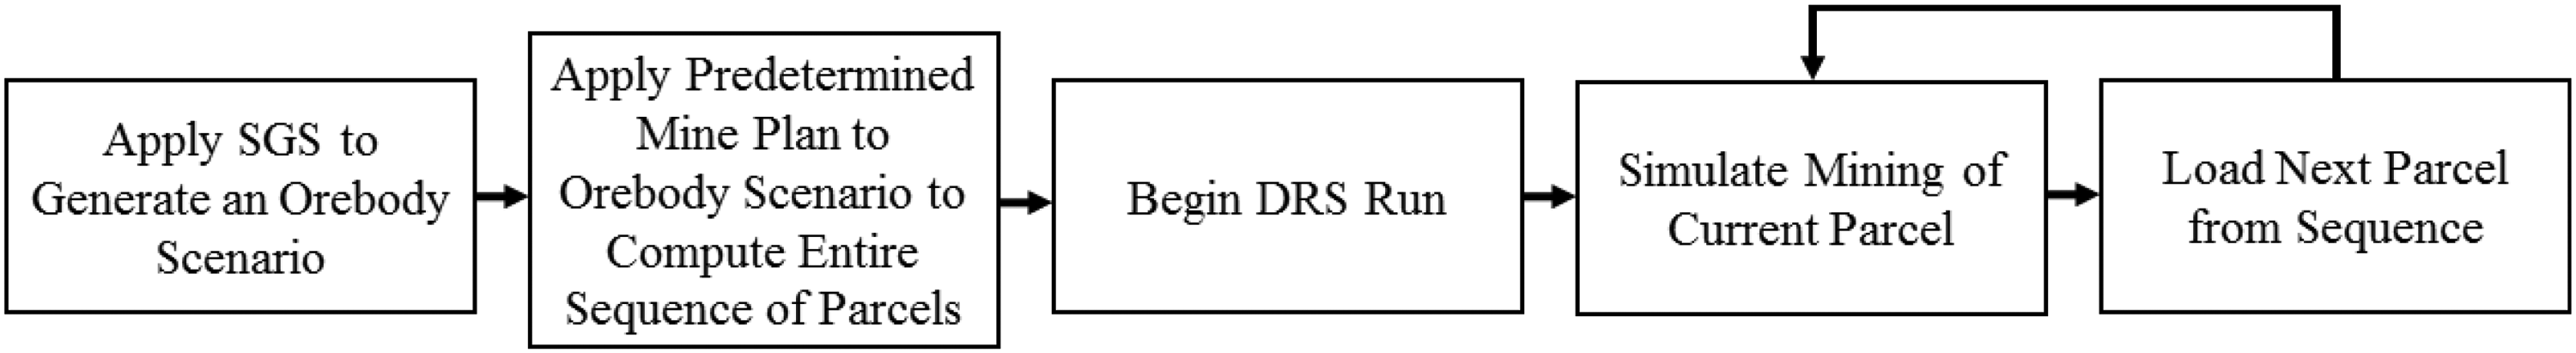
Geostatistical approach, in which geological data is generated prior to the execution of the DRS, through sequential Gaussian simulation. DRS: discrete rate simulation.
Within the current model, the loading of a subsequent parcel immediately changes the mass balance and is observed as slope changes (i.e. changes in rates rj) in the progression of feed stockpile levels. A high-resolution representation would consider parcels containing low tonnages, e.g. 1000 t, which would be rapidly excavated to allow a frequent succession of randomly generated parcels while retaining the ability to represent the geospatial aspects of the orebody as the excavation progresses from one zone to another and may be set up to inform or verify the mining sequence. This approach can be used to model mine phases starting from even the earliest stages of orebody development to examine approaches for minimising grade variability and/or deleterious element variability.
In previous works, a lower resolution representation having greater tonnages, e.g. 10,000 t, was sufficient to evaluate cyanidation operating modes in the context of Minera Florida, 9 as a higher resolution is more computationally demanding. The previous work7–11 included simulations which ran to completion in under 1 hour on standard laptops, using low-resolution parcels. Although the previous approach is able to detail alternate modes of operation of the processing plant, it was not sufficient to maintain the integrity of the geospatial aspects of the orebody. A scheme similar to Figure 12 using SIS was applied recently in, 11 again within the Au-Ag narrow vein context, although with an emphasis to relate global economic indicators such as Net Present Value and Internal Rate of Return to operational policies, rather than geometallurgically relevant indicators such as cyanide dosage to operational policies as in the current paper.
Two-dimensional representation of narrow orebody mining
The representation of mining operations within a geostatistically sourced dynamic mass balance (e.g. a DRS framework that incorporates SGS) would generally require a mine planning algorithm that controls the sequence of excavation. Nonetheless, the narrow vein 2D context afforded allows a simplified approach to sequencing blocks that is straightforward to program, because it is mined using stoping techniques that have little degrees of freedom, such as cut-and-fill mining. The narrow vein context is itself industrially relevant, has geometallurgical complexity, and also indicates a viable path for other underground methods that could be defendably simplified to two dimensions. These cases include tabular deposits that are vertical and subvertical subject to typical stoping techniques, or are horizontal subject to room-and-pillar or drift-and-fill. 32 In these cases, the multiphase approach of Figure 2 is more tractable, taking the form of Figure 13, as a further 3D representation may only be necessary in later phases, or likely not at all, depending on the project.
In comparison to the typical development of dynamic mine system simulation (figure 2), cases in which the geospatial model can be reduced to 2D and support restricted mining sequence can incorporate geospatial aspects even in the early phases of engineering projects.
Cut-and-fill mining is a selective stope method that is often applied for steeply dipping high-grade deposits found in weak rocks (which is an advantage for dilution control). However, the ore typically needs to be of high grade to offset the backfilling costs. 32 Additionally, the method is labour intensive, requiring extensive ground control and ventilation.32,33 A variation of cut-and-fill that is applied at the El Peñón mine is the so-called bench-and-fill method depicted in Figure 14. The main parameters for the method are the cross-section of the production tunnels, taken to be approximately 4 × 4 m, and the stope height taken to be 16 m, to approximate El Peñón for the subsequent computations.

Schematic profile of the bench-and-fill mining method considering the order of the stopes, 1–6.
After the tunnels are excavated on one level, the stopes are blasted, according to the sequence depicted in Figure 14. Overlaying this pattern of tunnelling and stoping onto the geospatial results obtained by SGS provides the data to simulate incoming ore entering the feed stockpiles. Implementing this mining technique is a relatively simple extension of the programming efforts required for a two-dimensional SGS. Moreover, the interface with the DRS functionality is unidirectional, meaning that SGS influence the DRS, but not the reverse. In practice, this means that the influence that downstream state variables (stockpile levels, configuration of the plant, etc) have on the short-interval control of the mining operations is being neglected; that is reasonable in the context of narrow vein gold mining, depending on the phase and the objectives of an engineering project, and potentially for other approximately two-dimensional contexts that lack spatial degrees of freedom. From the programming point-of-view, this allows the sequence of feeds to be generated from each of the SGS replicas, and saved, prior to beginning the DRS run, as depicted in Figure 12.
The following computations refine the downstream operational practices, to confront mineralogical variation and their potential effects on key performance indicators (KPIs), specifically cyanide consumption and throughput. The control of cyanide dosage is managed through ore blending strategies and stockpile management policies, as represented within a DRS framework implemented in Rockwell Arena ©. In such a case, all the mineralogical data can be computed from the SGS results and structured into an ASCII file, independently of the functioning of the DRS framework; the Arena model simply loads data from the external file one parcel at a time. Thus, an industrially relevant context, with geometallurgical complexity, is captured within a comparatively simple dynamic simulation platform, representing the orebody, the mining operations and the critical aspects of the metallurgical process. In the case of El Peñón, the results contribute to evaluating process alternatives and improving production planning, and reducing uncertainties in the prediction of cyanide consumption.
Application of the simulation framework
Sequential Gaussian simulation
Geometallurgical data for the El Peñón mine was utilised for the SGS to compute one hundred equiprobable sodium cyanide consumption scenarios, given a fixed mining excavation sequence. This database contains 338 ore samples, classified in situ (Figure 15). The samples were analysed to determine the cyanide consumption by a roll test and the data was grouped by ore type (oxide vs sulphide) based on in situ observations where the main classification criteria were the mineral assemblage in the workface where the sample was obtained.

Geological profile showing the location of the geometallurgical sampling data in a low-sulphidation vein. The boundary between the two mineralogical zones was constructed by oxide-sulphide classification made from the in situ mineralogical assemblage in each sampling point.
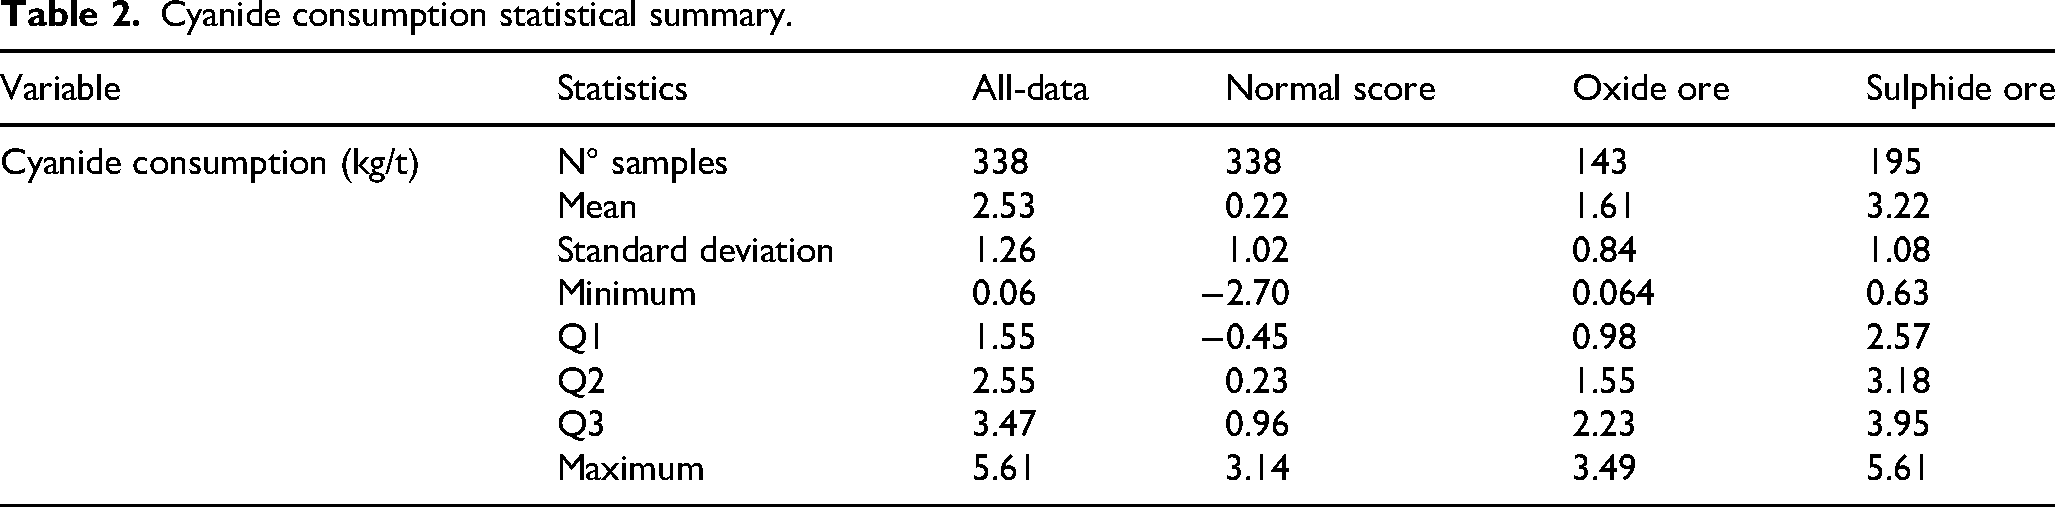
The geometallurgical sample database is statistically described for the cyanide consumption variable for the entire data set and by ore types. The average cyanide consumption for the ore body is 2.53 kg/t, with a declustered average of 2.26 kg/t. The result revealed that there is a strong influence from the mineralogical zone, with a notable difference in the cyanide dosage based on the significant disparity in the average consumption of this reagent between the two geometallurgical units (1.61 kg/t in the oxide ore vs 3.22 kg/t of the sulphide). The result is summarised in Table 2.
Cyanide consumption statistical summary.
For the blending strategy established following the 2014 trials (see Table 1) to be represented within the DRS framework originally developed in, 4 the short-term measurements must be able to distinguish between the two main ore categories, i.e. high- and low-cyanide consumers. Within the generic 2019 terminology, the high- and low-cyanide consuming ores correspond to Ore 1 and Ore 2. This level of time-related granularity may not be available for longer term mine planning, but ideally is available for short-term interval control (A point of caution is that laboratory analyses may be able to hyper-classify ore samples, but blasting volumes render such a level granularity impossible to link to what is actually fed into the plant; this type of hyper-classification inevitably leads to a discord between what is supposedly mined, and what is actually received in the stockpiles, and should be avoided). Routine analysis of the stockpile samples should be able to verify the extent to which the piles are true to their intended mineralogical composition. The current computations are modest, considering only two main ore types, but is nonetheless representative of the actual operations. Ongoing progress into the deeper sulphide zones may eventually require more complex strategies, considering the cyanicidal mineralisation depicted in Figure 6, which includes bornite in conjunction with the non-cyanicidal chalchopyrite, as well as the cyanate-forming rhodochrosite.
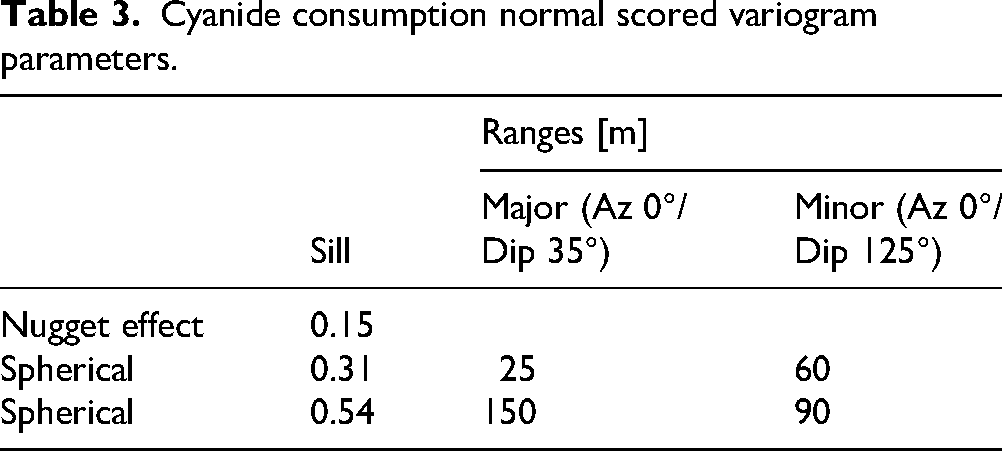
The variogram analysis of the Figure 15 sample points is depicted in Figure 16, first as the normalisation that transforms the cyanide consumption data (Figure 16a) into a Gaussian distribution (Figure 16b). The SGS procedure requires that the variograms be of the normalised cyanide consumption data, as described in Section Sequential Gaussian simulation, resulting in Figures 16c and 16d, in the minor and major ranges. Table 3 summarises the variogram model, including the Nugget effect, and two spherical components. The SGS were carried out in the SGEMS software, resulting in 100 replicas, considering block that the spatial resolution is on the order of meters, hence a parent block size of 1 m × 1 m. Successfully completing the 100 simulations within a matter of hours on a consumer-grade laptop demonstrates the practicality of the approach, considering that the closer sample locations are never closer than 3 meters (Figure 15). From previous studies, 100 is understood to be a viable starting point for the number of replicas4,5,9; however, it can provide further assurances in practice to include a convergence analysis, comparing confidence intervals as a function of the number of replicas. Figure 17 shows a typical replica, which has reasonable agreement with the initial data, i.e. visually comparing Figure 17b to Figure 16a. A quantitative comparison of Figure 17b and 16a gives the χ2 statistic of 11.22 and corresponding p value of approximately 19% (failing to reject the Null Hypothesis that the distributions are similar), which is similar for other realizations. Unlike estimation, where a single best map can be generated under some quality parameter definition (e.g. minimisation of the mean square error in the case of kriging), realizations are accepted or rejected based on their ability to honour the data, geology, histogram, variogram, and any secondary information. 2 The histogram of each scenario shows that each realisation respects the distribution of the sample set, and, in addition, its statistical parameters are also very similar to those of the cyanide consumption test database. Subsequently, these SGS results are then re-blocked to 4 m × 4 m to be compatible with the bench-and-fill parameters of Figure 14.
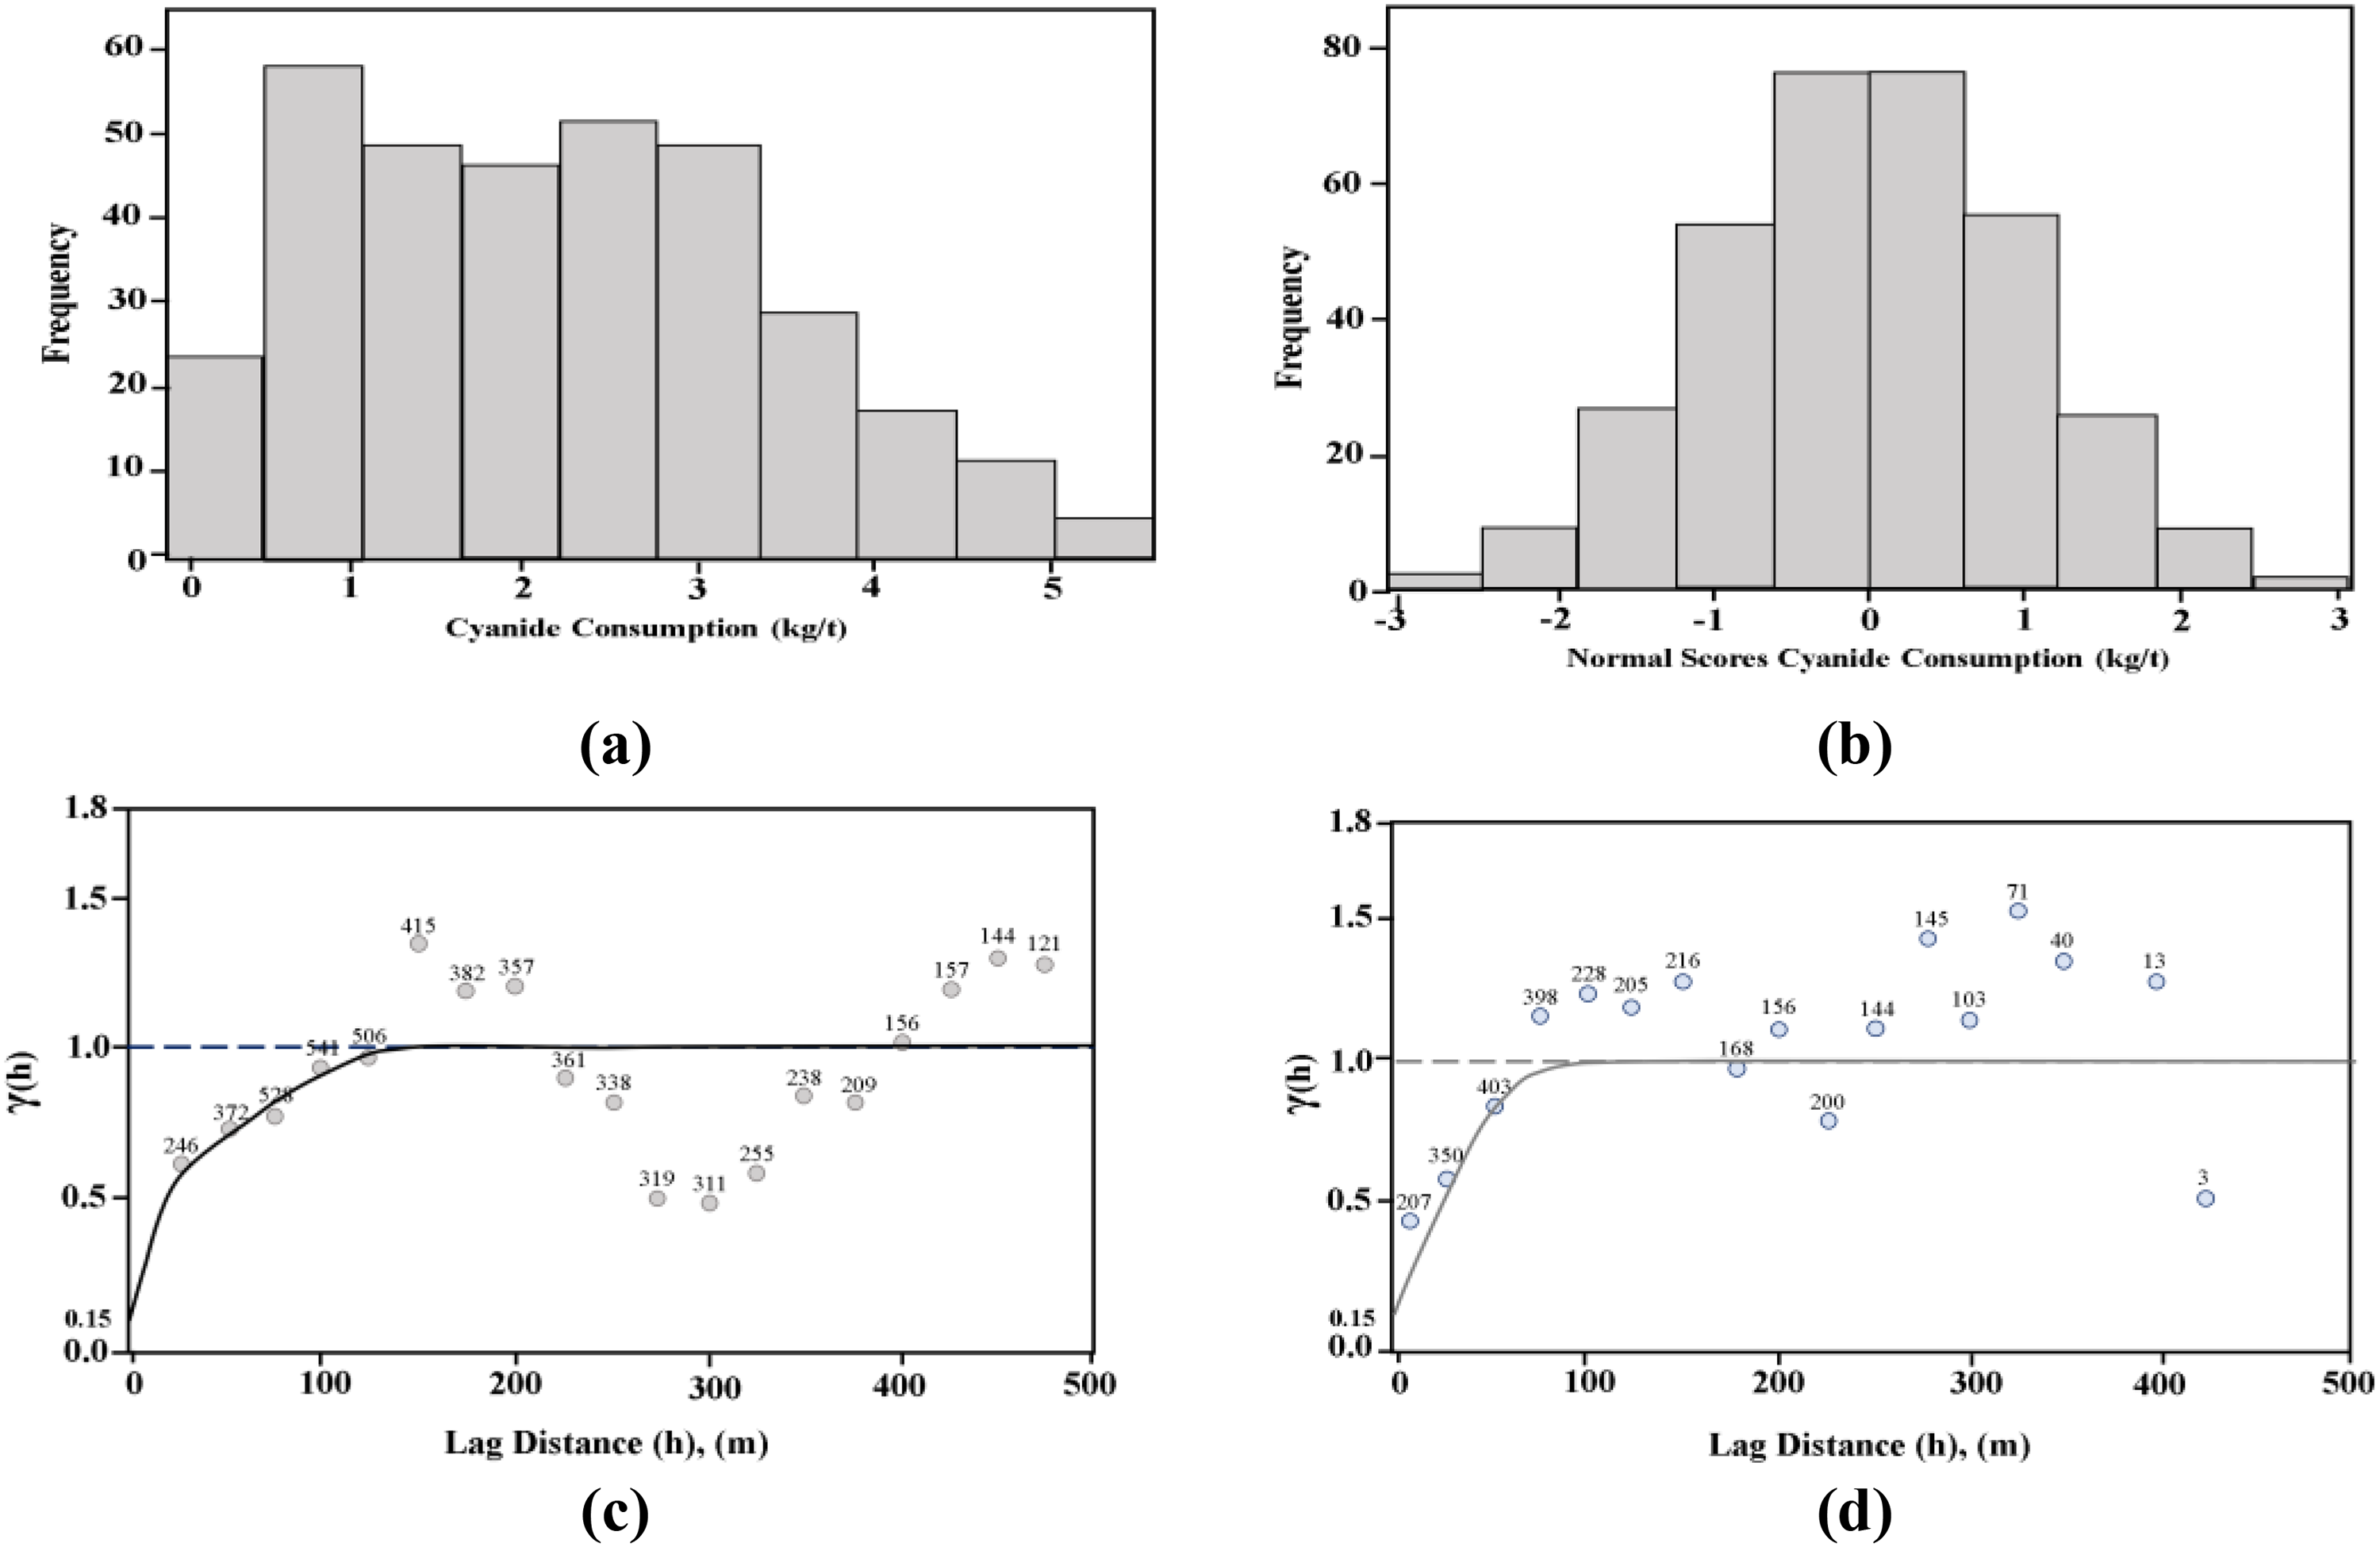
(a) NaCN consumption raw data histogram. (b) Normal scored NaCN consumption. (c) Normal scored NaCN consumption major range direction variogram. (azimuth 0°, dip 35°) (d) Normal scored NaCN consumption minor range direction variogram (azimuth 0°, dip 125°).

(a) Cyanide consumption back transformed simulation 39 histogram and summary statistics; (b) simulation 39 histogram and summary statistics.
Cyanide consumption normal scored variogram parameters.
An important aspect of the narrow vein context is that the SGS results can be directly mapped into ore feeding data (parcels) independently of the subsequent dynamic simulations. As described in the previous section, this corresponds to a neglecting of the short-interval control, i.e. that the mining sequence is predetermined regardless of the incoming operational data. This simplification is reasonable for the narrow vein context, in which the feed variations are controlled (mainly) through blending and stockpiling. Thus, the result from each SGS replica is individually converted into a sequence of parcels, as depicted in Figure 18. Considering the relatively high operating costs for bench-and-fill, the cut-off grade is taken to be 2.8 Aueq/t., wherein the gold equivalent grade is taken to be Aueq = Au + Ag/60. The tunnel segments and stopes that fail the cut-off grade are labelled as ‘W’ within Figure 18 and are excluded from processing. The gold and silver grades are taken to be deterministic, and rather it is the cyanide consumption that is stochastically modelled; therefore, the blocks that do not meet the grade cut-off are decarded as ‘W’ deterministically for all replicas, a priori, which is in accordance with the practices as El Peñon. 14 Ultimately, the result is a 50-month feeding plan, during mining periods where the oxide-sulphur ratio varies depending on the mineral zone being mined. Based on the hundred SGS replicas, Figure 19 depicts the cyanide consumption profile with the median represented by the solid line, and the lower and upped dashed lines as the 10th and 90th percentiles, respectively.

(a) Mining stopes measured in the block model (Aueq = Au + Ag/60) are considered waste if the grade is less than 2.8 g/t Aueq. (b) Schematic deterministic mining scheduling based on bench-and-fill method, in which cells 19, 21, 24, 27, 30 and 33 represent the access.
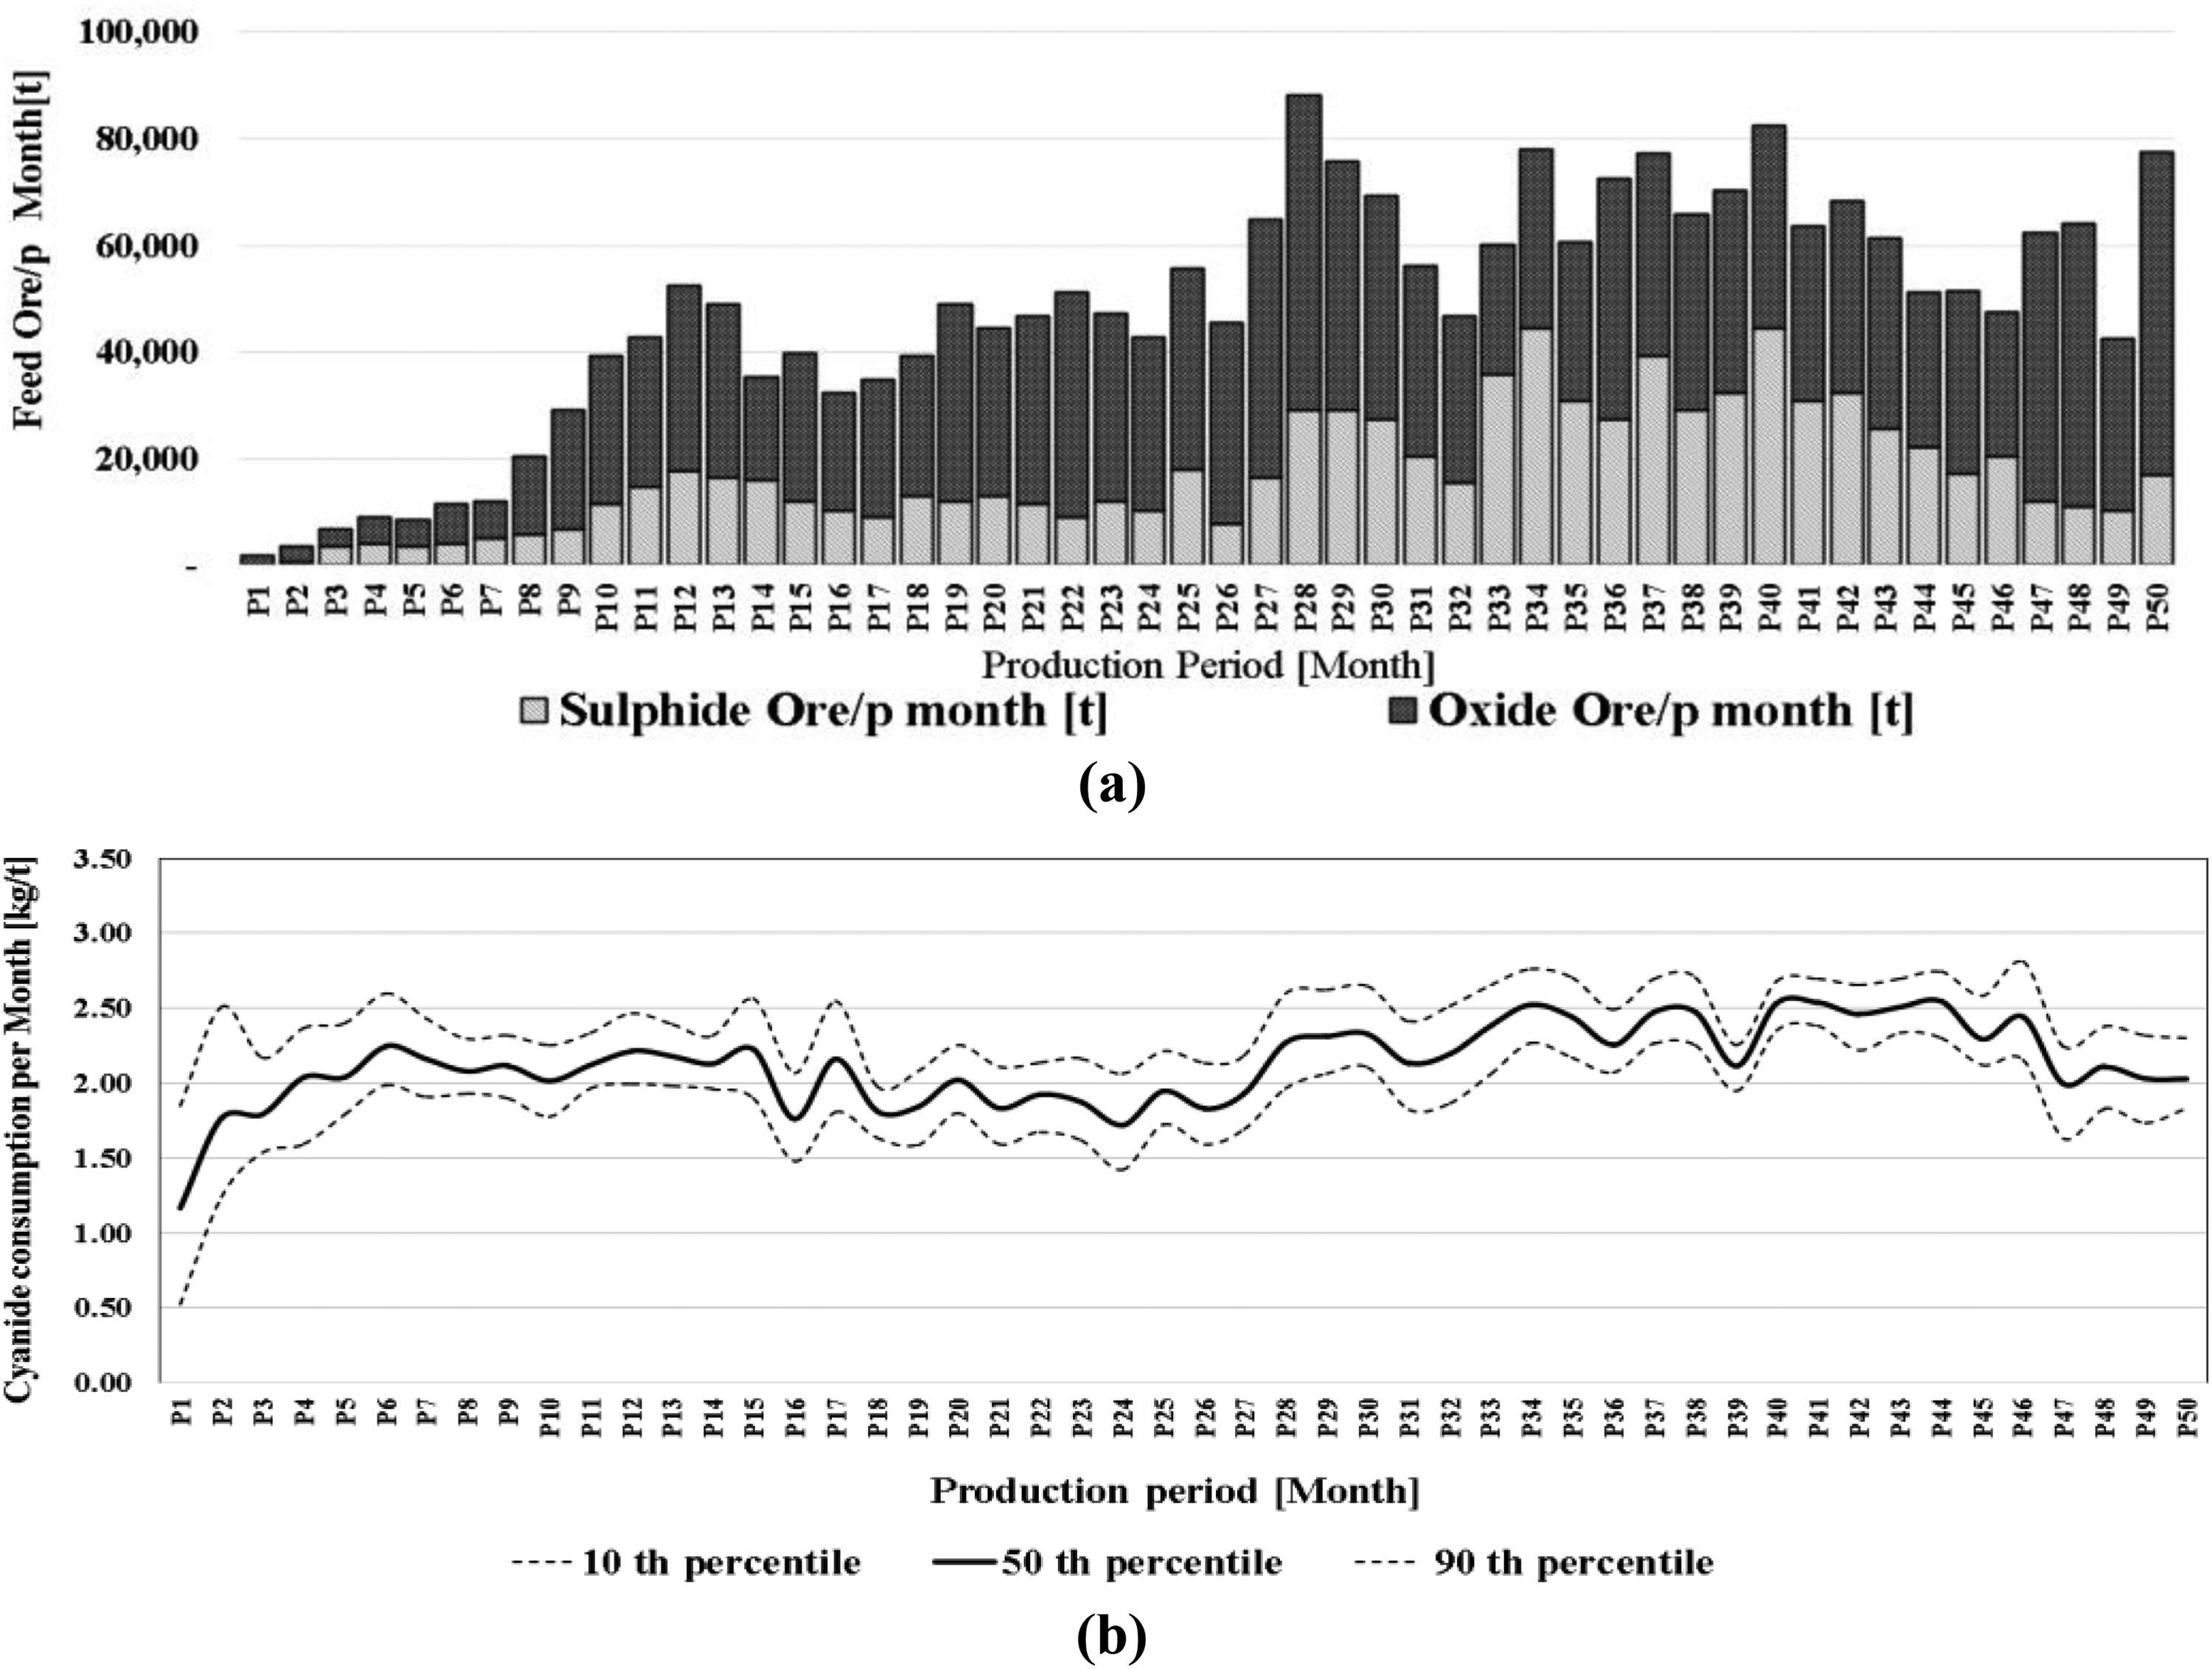
(a) Ore feeding profile with 50 periods and their oxide-sulphide ore type ratio variation. (b) Stochastic cyanide consumption simulated results.
Representation of operating policies with the discrete rate simulation framework
The current methodology uses DRS, a relatively simple approach to dynamic mass balancing, in which spikes in cyanide consumption can be represented. The resulting framework demonstrates how these spikes can be mitigated by balancing the feed from zones with supergene Cu-bearing sulphides or other cyanide consumers with oxides, although this had already been possible using the Simplified Monte Carlo approach of Figure 4.8,9 Nonetheless, these previous attempts had not explicitly represented the geospatial simulation. Especially relevant in the context of narrow vein Au-Ag deposits is that large-scale features such as the paleo-phreatic surface can be identified early to some degree of resolution, but the specific instances of low- and high-cyanide consumption potential at the individual workfaces may be known only on shorter time scales. As explained in earlier sections, the transition from oxide to sulphide ore assemblages can severely affect the cyanide leaching process, so this short-term variation typically must be buffered through stockpiling and blending. Furthermore, the limited degrees of freedom characteristic of underground narrow vein mining render stockpiling and blending essential to the only robust approach.
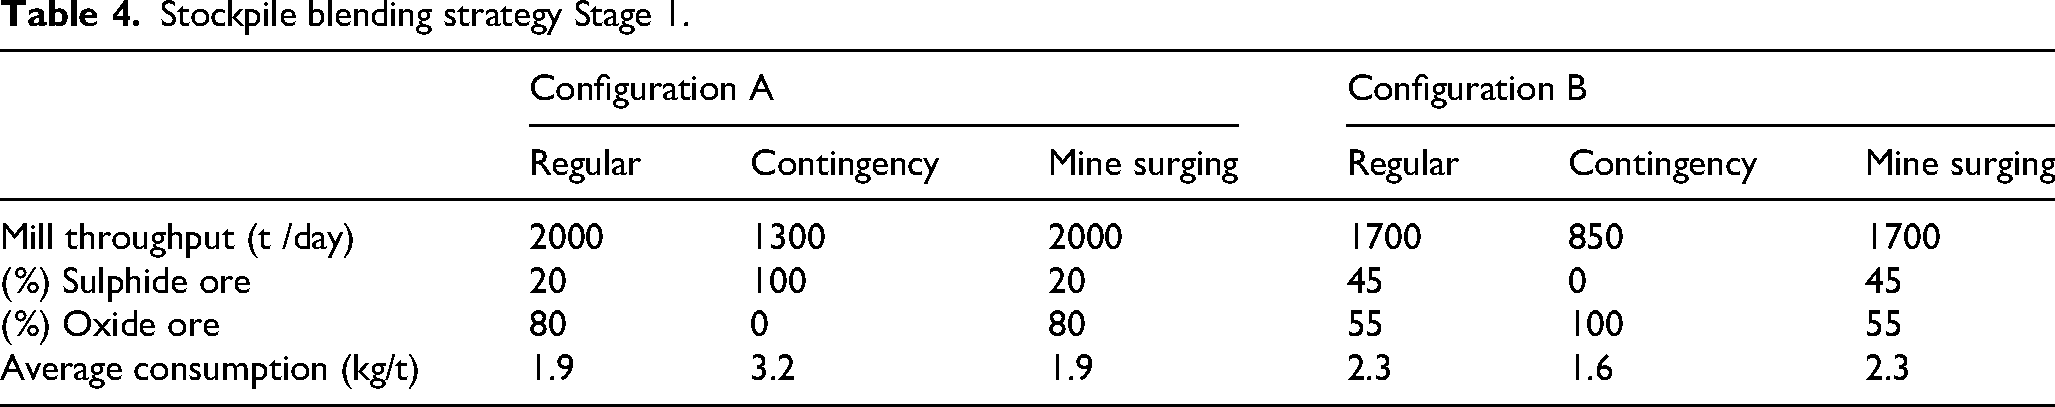
Given a definition of ore stockpiles that is practical, and enforceable, it is possible to establish stable processing modes that depend on fixed feed blends. The plant trials at El Peñón established the notion of high- and low-cyanide consuming stockpiles, which for the purposes of these calculations, will be taken as sulphide and oxide, hence Ore 1 is sulphides and Ore 2 is oxides; however, this simplification is most reliable surrounding the copper supergene enrichment zone (See Figure 3). The plant trials from 2014 established that with a feed blend of 30% Ore 1, the cyanide consumption could be stabilised with 1.9 kg/t of cyanide. Nonetheless, this had been a compromise, and a superior trade-off between silver recovery and cyanide consumption can be obtained with 20% Ore 1, while still maintaining a moderate advance into the sulphide zone. As the low-cyanide consuming minerals (oxides) are depleted, however, there is an increasing risk of stockout of this Ore 2, which can be managed by having alternating configurations, supporting different modes of operation. Such a stockout is to be avoided, since the process would be forced to proceed with ore that is rich in supergene copper sulphides hence a spike in cyanide consumption to maintain throughput and recovery. Therefore, an operating policy that alternates between a productive configuration, i.e. Configuration A that is designed to rely on 80% Ore 2 (oxides) in the feed, and the alternate Configuration B that is less productive, but allows the replenishment of Ore 2 stockpile as a higher portion of Ore 1 is processed, with a correspondingly controlled increase in cyanide dosage.
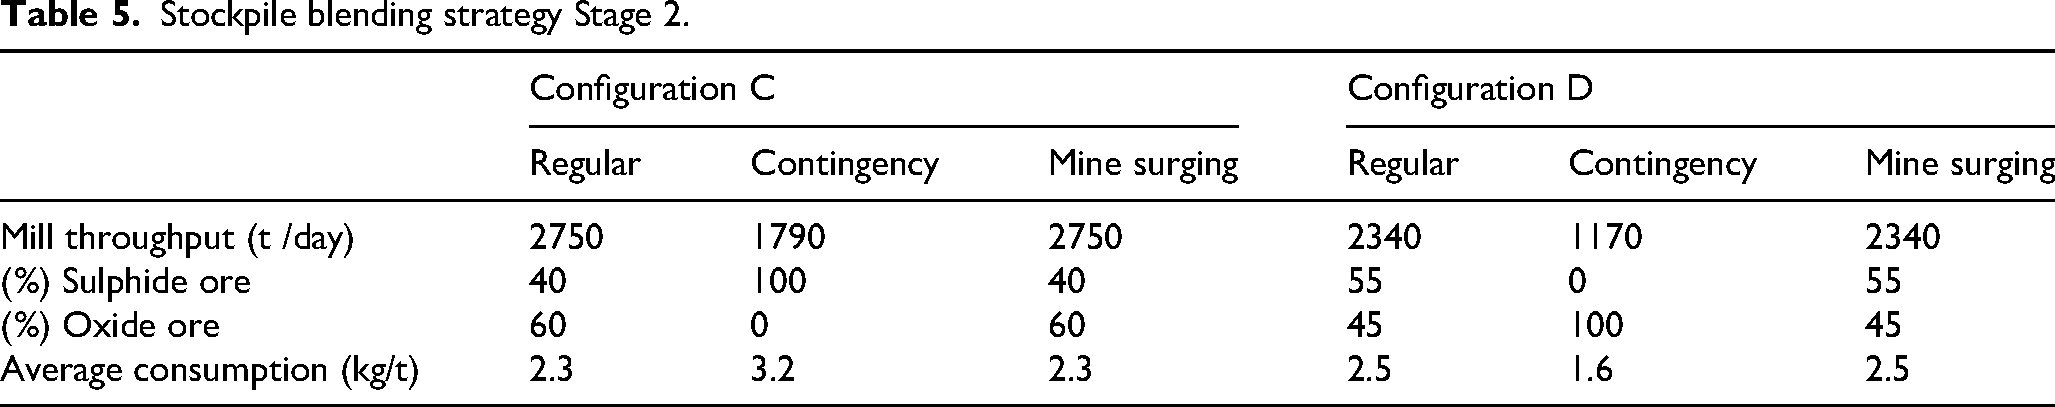
The computations of the next section consider the parameters of Configurations A and B given by Table 4, which are applied within Stage 1 consisting of periods P1 to P26 depicted by Figure 19. Subsequently, for Stage 2 consisting of P27 to P50, Configurations C and D are applied, with C now as the productive configuration and D as the recuperative configuration described in Table 5. Each of these configurations has a Regular mode of operation, as well as a Contingency mode that is applied in case the more likely ore stockout occurs. For the productive configurations, A and C, the likely stockout is the oxides (Ore 2), causing increased cyanide consumption and decreased throughput. For the recuperative configurations, B and D, the likely stockout is sulphides (Ore 1), which causes a pure oxide feeding that is amenable to lower cyanide dosage; however, the throughput is decreased by 50% so as to preserve the oxides for blending with sulphides. In case of the statistically unlikely stockouts, sulphides in the case of A and C and oxides in the case of B and D, the mining rate is increased to whatever level ensures regular downstream processing; this is referred to as ‘mine surging’ for which the column of Tables 5 and 6 is set equal to the corresponding regular column.
Stockpile blending strategy Stage 1.
Stockpile blending strategy Stage 2.
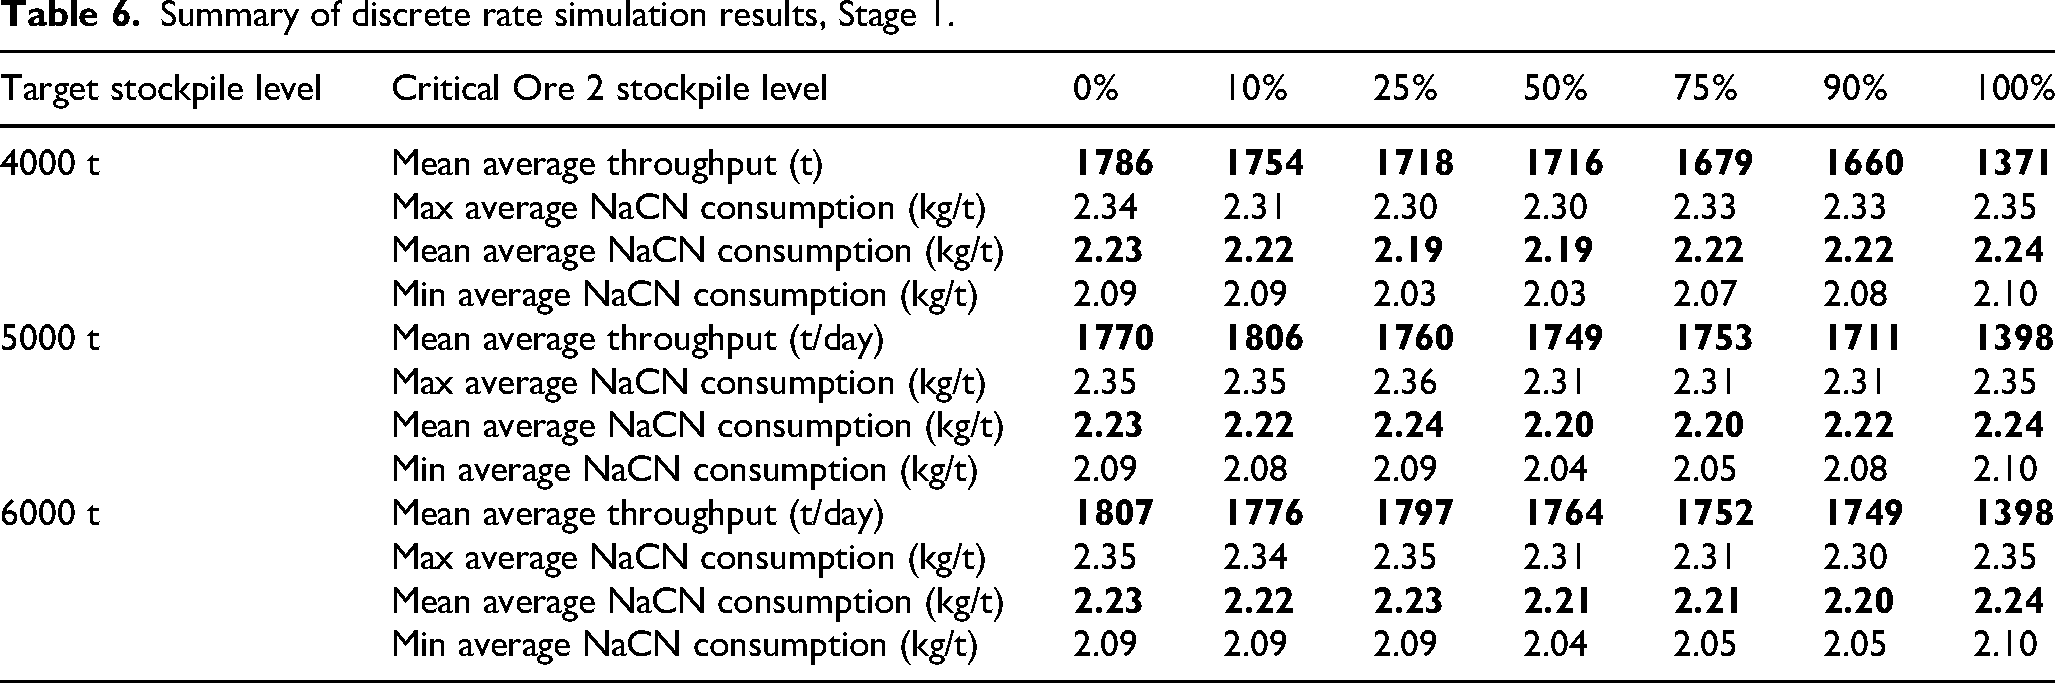
Summary of discrete rate simulation results, Stage 1.
The reconfiguration of the plant, from A to B and vice versa during Stage 1, and similarly in Stage 2, is effectuated during plant shutdowns which occur once every 30 days. More precisely, there are production campaigns lasting 29 days, followed by a 1-day shutdown, at which point either the current configuration is maintained or switched, and is then applied throughout the following 29-day campaign. If leading into a shutdown, the level of Ore 2 (Oxides) is low enough to present a stockout risk, then the recuperative configuration will be applied, i.e. B for Stage 1 or D for Stage 2. The following computations experiment with two control parameters for each of the stages X
i
: Total Target Ore Stockpile Level in Stage i Y
i
: Critical Ore 2 Stockpile Level that Triggers the Recuperative Configuration in Stage i
Throughout the simulations, a constant ore mining rate maintains a constant total between the two stockpiles, Ore 1 and Ore 2, and it is the relative proportions of the Ore 1 versus Ore 2 that fluctuates dynamically. There are however some brief intervals in which the statistically less likely stockout occurs, which triggers a mine surge to maintain the designated feed blend; in this case, the remaining ore stockpile temporarily exceeds the target level X, but soon returns to that level as a more typical rockface configuration is encountered. As discussed in, 4 this two-parameter (X,Y) policy form is an adaptation of the classic (R,Q) problem from inventory theory. 5 The simulation framework could be adapted to consider more elaborate operational strategies, having more stockpiles hence more parameters and operating modes, which may be appropriate for the deeper levels of the mine, that may cross structural controls that are as impactful as the paleo-phreatic surface.
Sample computations
As a computational demonstration, the new operating modes were tested against the 100 geological scenarios created using SGS subjected to the bench-and-fill extraction sequence described by Figure 18, and applying the data described in Tables 5 and 6, associated with Stage 1 and Stage 2, respectively. Within Stage 1, the target total ore stockpile level (X) was tested at values of 4000 t, 5000 t and 6000 t; for all cases, the critical ore level for the oxides (Y) below which the transition to the recuperative configuration (Configuration B) is implemented was varied between 0% and 100% of X. Note that (Y/X) = 0% implies that the recuperative Configuration B is never applied relying solely on the productive Configuration A, and conversely (Y/X) = 100% implies that only the recuperative Configuration B is applied. Considering the expected increased production for Stage 2, total target stock level values (X) tested at 6000 t, 8000 and 10,000 t, and again the Y values were varied between 0% and 100% of X, with (Y/X) = 0% exclusively favouring Configuration C and (Y/X) = 100% exclusively favouring Configuration D.
Each scenario was simulated for approximately 1500 days of operation using the SGS-generated reagent consumption profile depicted by Figure 19. The two KPIs examined are the throughput and cyanide consumption, depicted in Figures 20 and 21, for Stages 1 and 2, respectively. It can be observed that the higher throughputs of Stage 2 offer significant opportunities in cyanide control, in comparison to Stage 1, if the trigger point (Y) is kept within the 50% to 90% range of the total (X). Setting Y to above 90% of X creates an overly likely criterion to apply the recuperative mode, causing losses in throughput in both stages (Figure 20a and Figure 21a), and increased cyanide consumption in Stage 2 (Figure 21b).
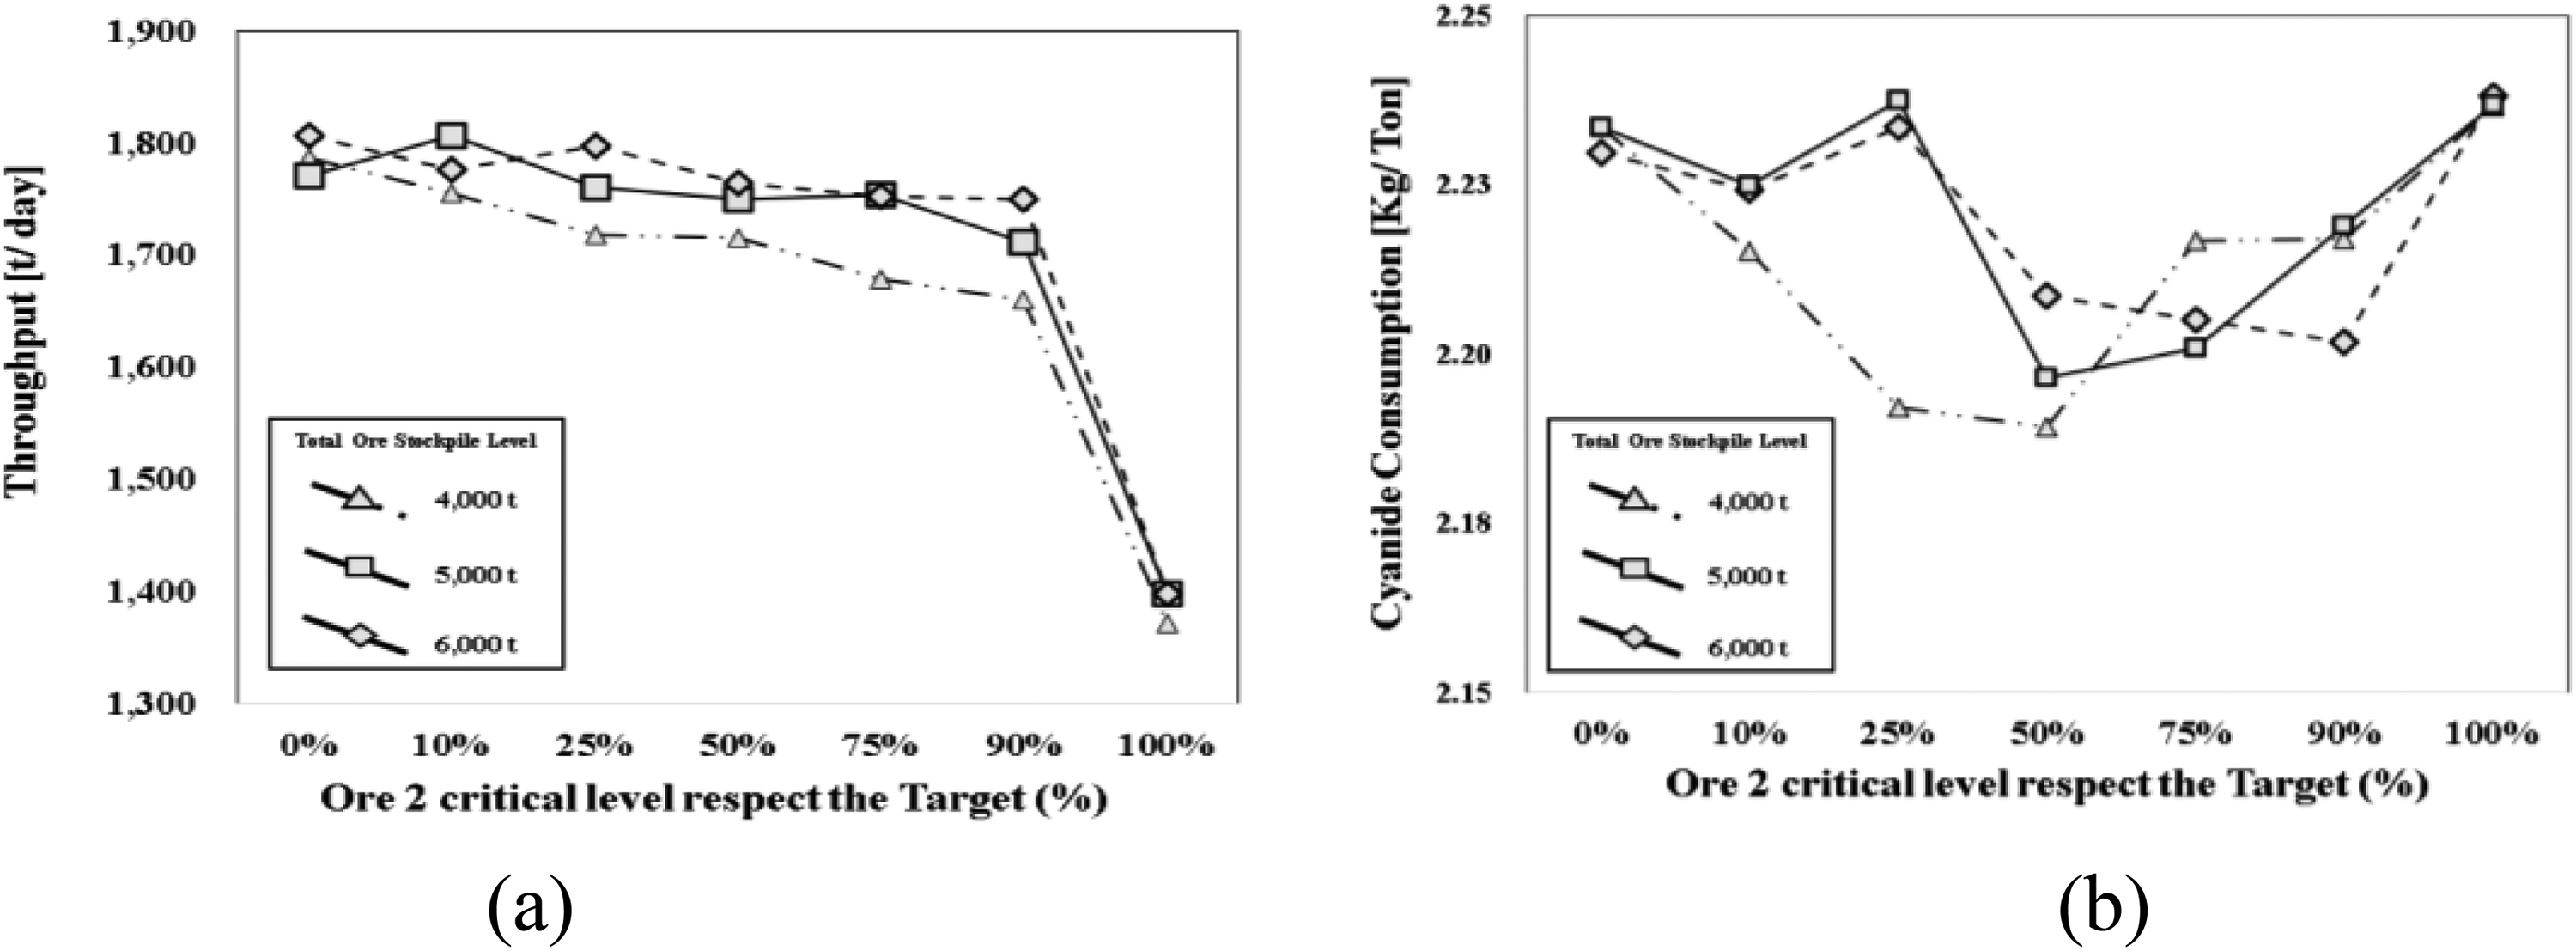
Operational performance of Stage 1 as a function of critical ore 2 level below which recuperative configuration is triggered (a) average daily throughput and (b) average daily cyanide consumption.
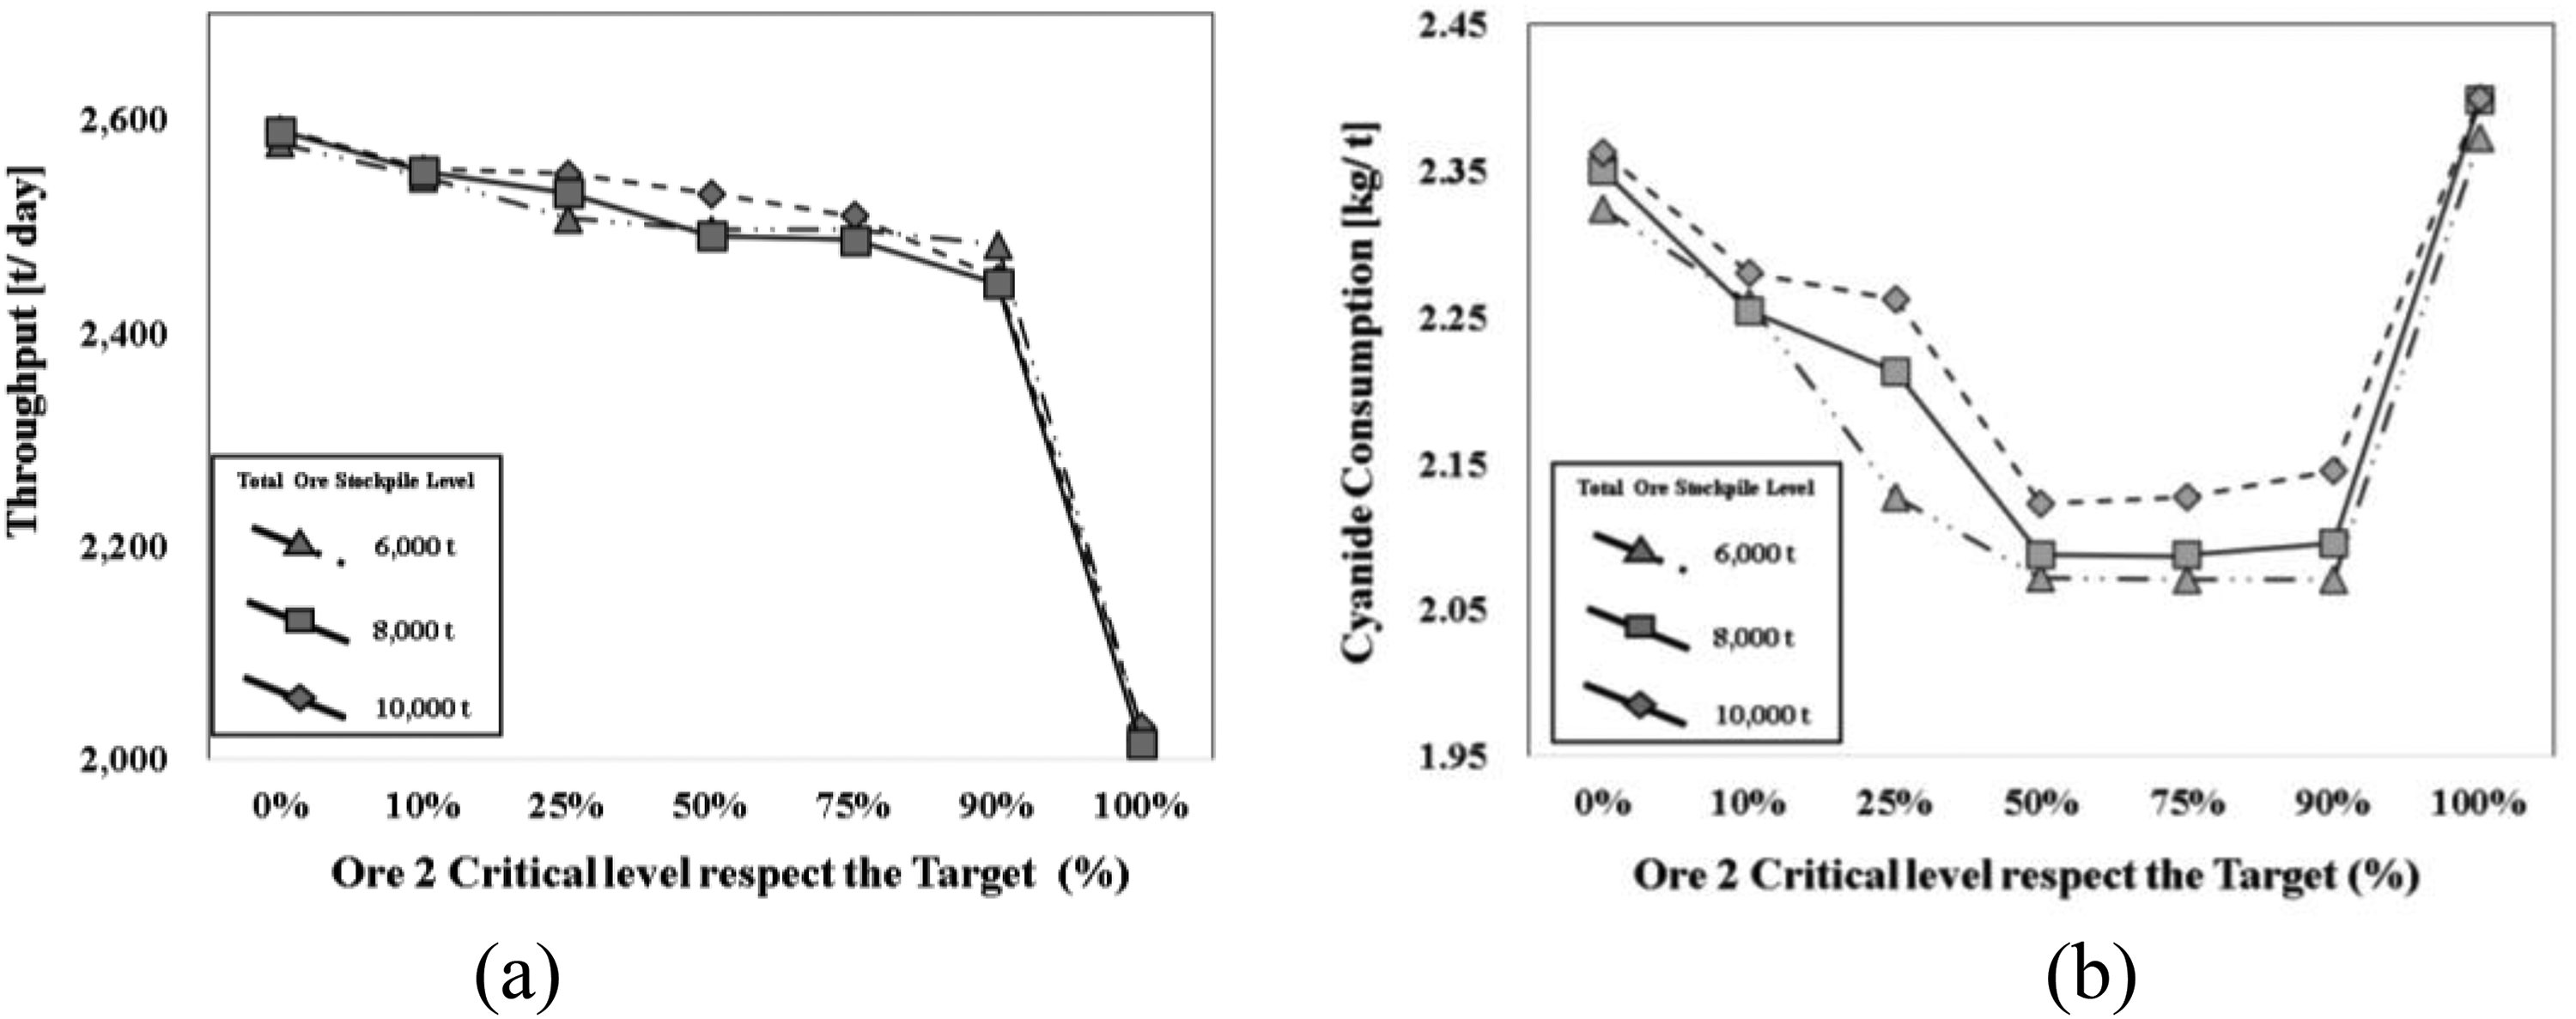
Operational performance of Stage 2 as a function of critical ore 2 level below which recuperative configuration is triggered (a) average daily throughput and (b) average daily cyanide consumption.
The analysis of Stage 2 reveals that unnecessarily high-cyanide consumption approaching 2.4 kg per tonne of ore processed would be obtained if the recuperative configuration is overly applied (see rightmost points of Figure 21b) or is underutilised (see leftmost points of Figure 21b). A proper utilisation of the recuperative Configuration C allows the system to better utilise the oxide ores, attaining 2.1 kg/t of cyanide consumption. Comparison of the upper-middle range (Y/X) values of 50%, 75%, and 90% show that the additional impact of higher total stockpile level is likely negligible, as shown in the corresponding columns of Table 7; for instance the 50% column gives the ranges of [1.94, 2.16], [1.97, 2.17], and [1.97, 2.23] for X values of 6000 t, 8000 t and 10000 t, respectively, which are virtually unchanged. For completion, Table 6 provides the values in Stage 1, in which there is no such risk of increased cyanide dosages to maintain a throughput of roughly 1.7 kt/day, provided that the stockpiling policies are applied.
Summary of discrete rate simulation results, Stage 2.
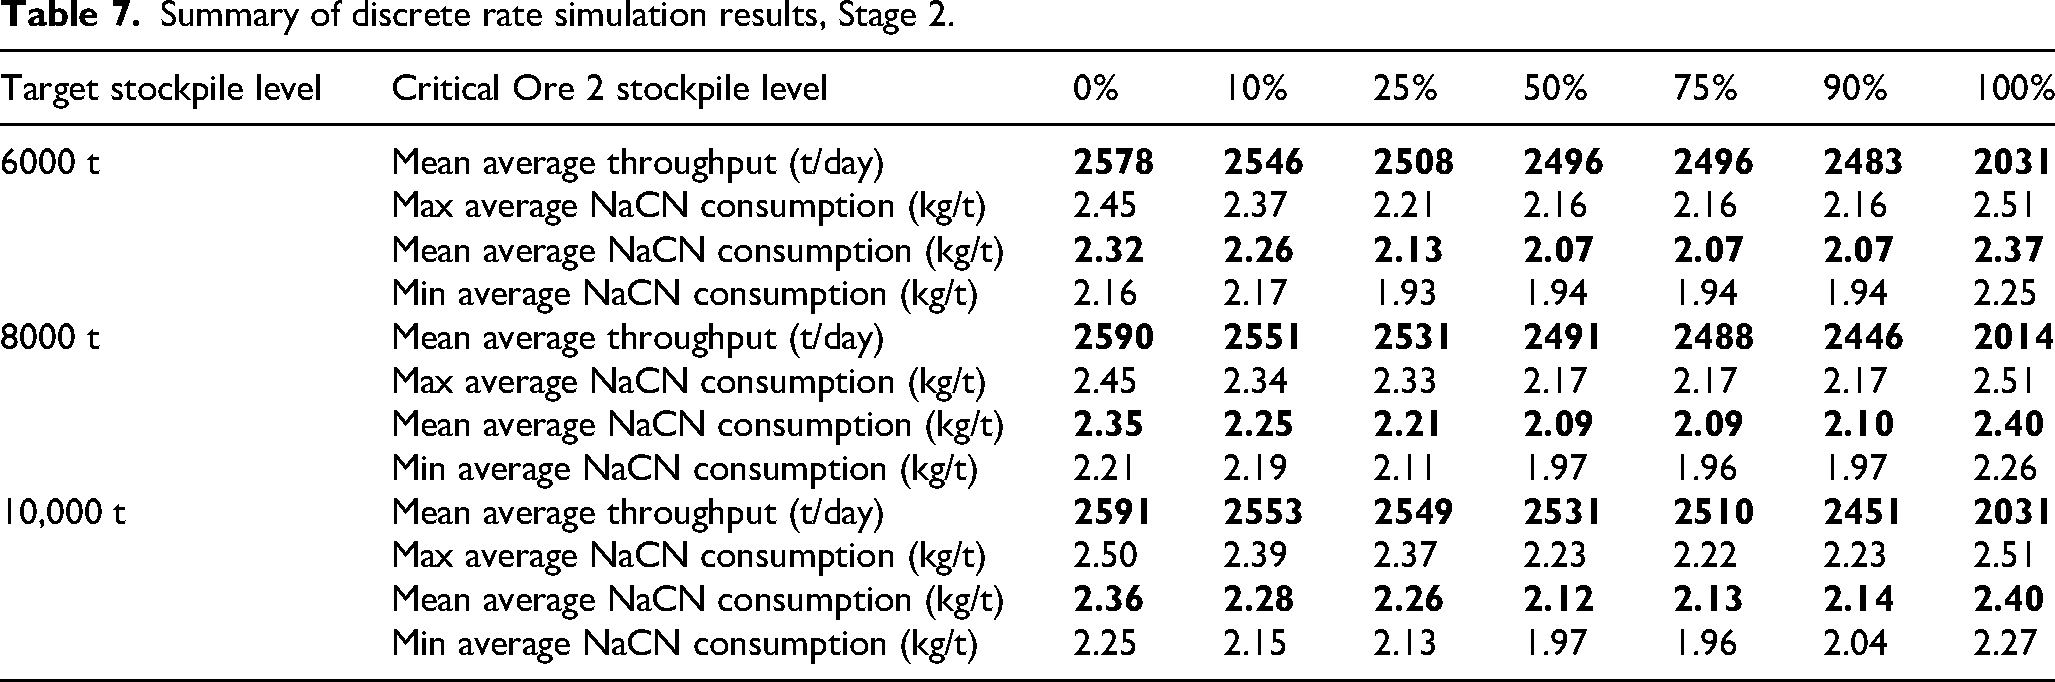
Figure 22 summarises the proportion of time in productive configuration versus recuperative configuration, A versus B, in Stage 1. Figure 22a has a lower critical level Ore 2 level (oxides) below which the recuperative configuration, such that A is applied in the intended high-productivity mode 57% of the time, and an additional 3% under conditions of increased mine production. When the recuperative mode is less easily triggered (Figure 22b), there is a considerable time in which the mining equipment is under strain in order to assure sufficient sulphides, i.e. 10% of the time, which may not be sustainable. Thus, for Stage 1, given that not so much overall variation is observed in regard to throughput and cyanide consumption (Figure 20), avoiding overworking the mine equipment may be a deciding factor that favours the lower value Y = 1500 t (Figure 22a). However, Stage 2 exhibits considerable periods of mine surging for both the high and the low threshold values, 16% at Y = 2500 t (Figure 23a) and 24% at Y = 7500 t (Figure 23b). The decrease in cyanide consumption described by Figure 21b may then be at the expense of periods of high-intensity usage of mine equipment.
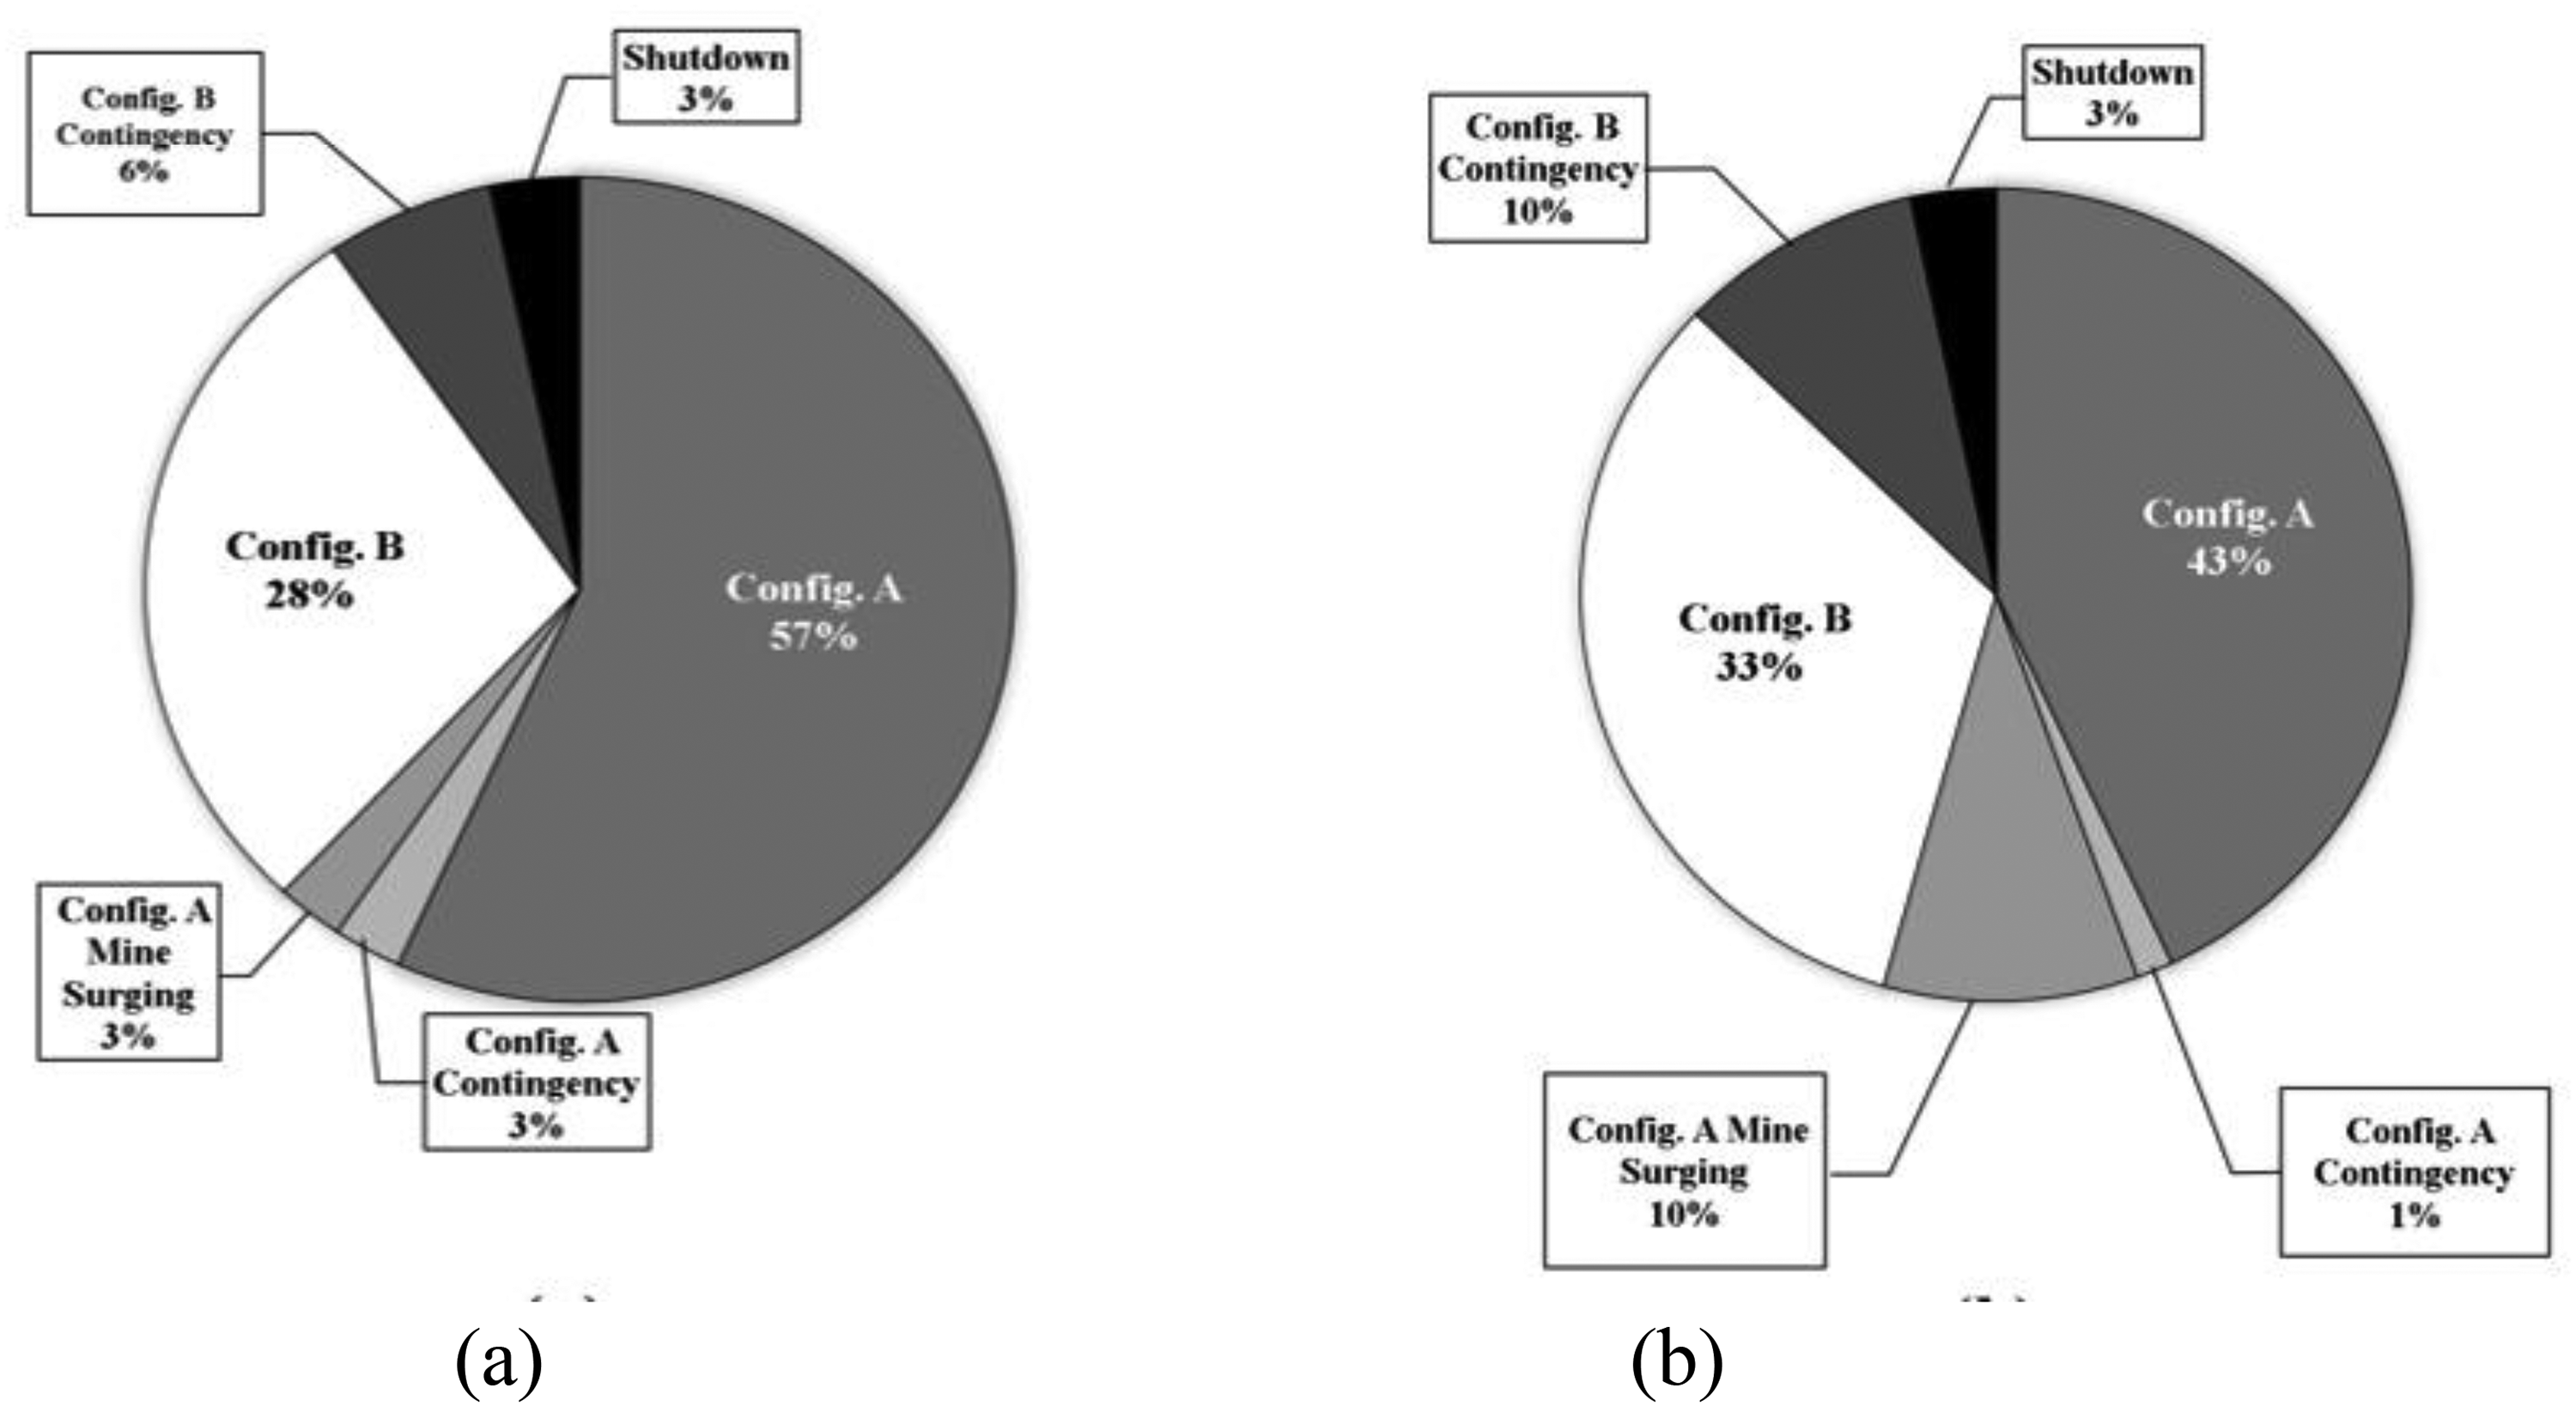
Time distribution of operational modes in response to mineralogical changes during Stage 1 considering a total stockpile target capacity of 6000 t with (a) critical ore 2 stockpile level threshold of 1500 t (25%), and (b) critical ore 2 stockpile level threshold of 4500 t (75%).
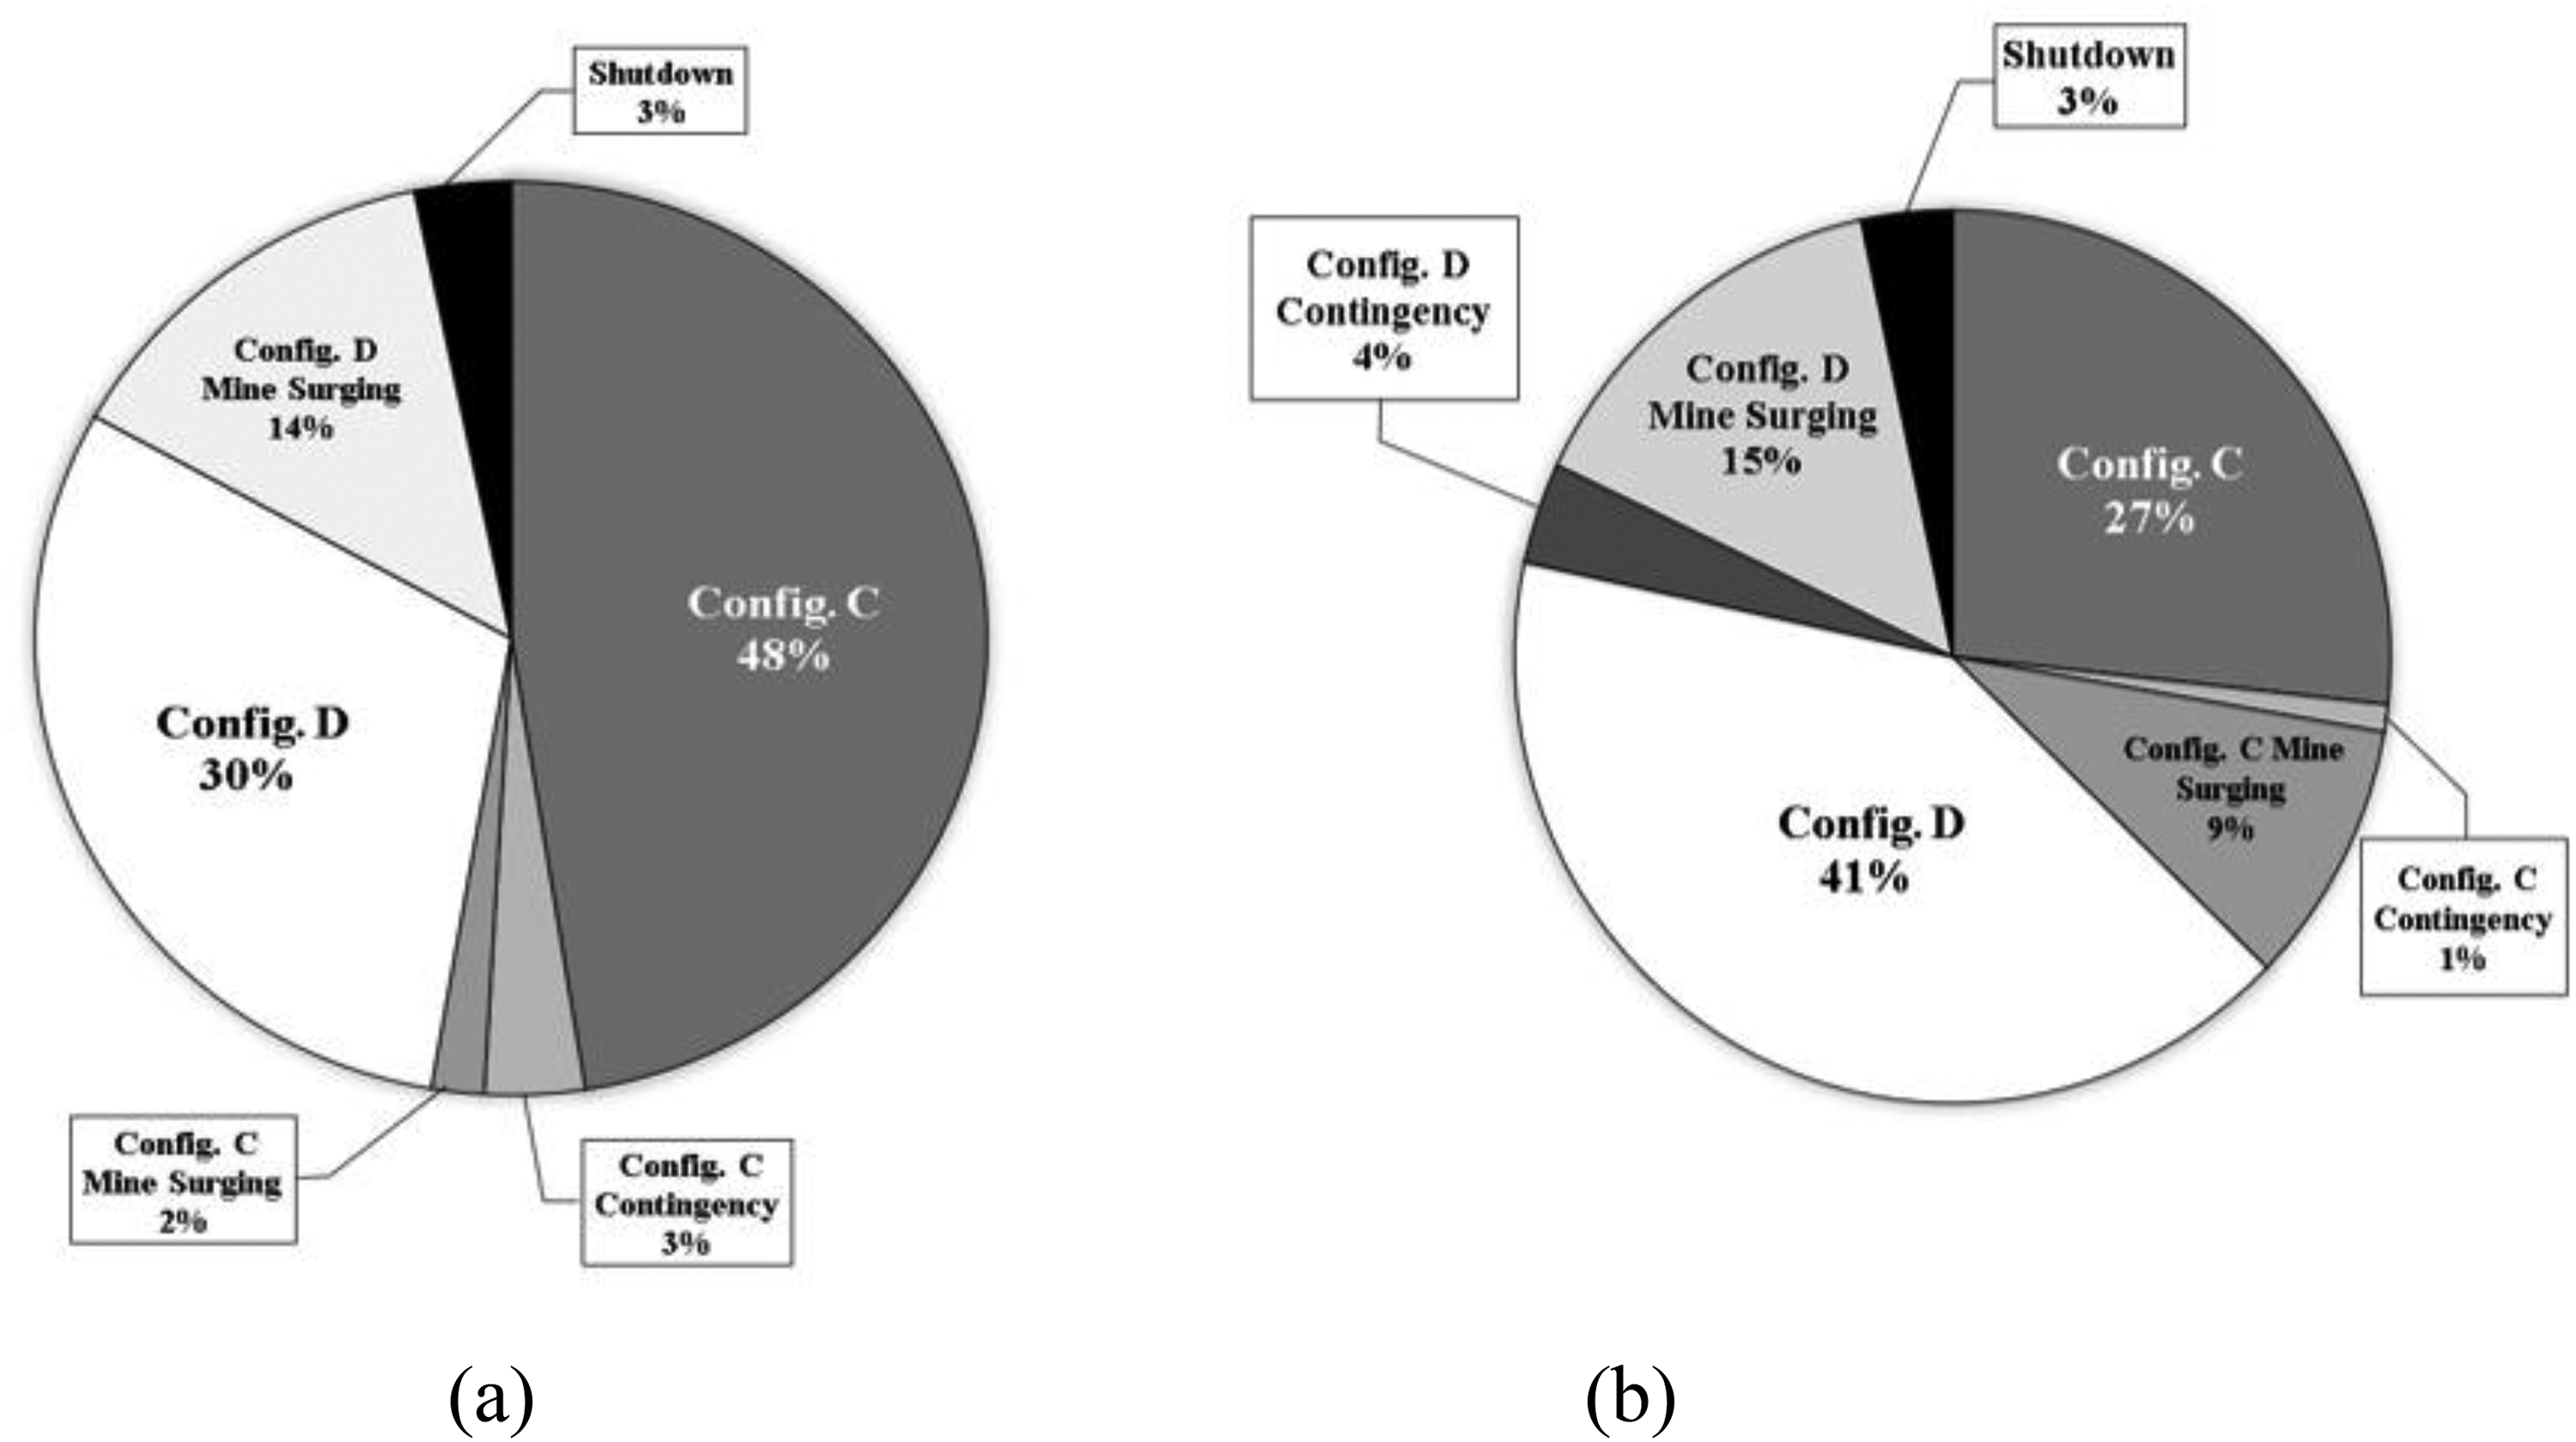
Time distribution of operational modes in response to mineralogical changes during Stage 2 considering a total stockpile target capacity of 10,000 t with (a) critical ore 2 stockpile level threshold of 2500 t (25%), and (b) critical ore 2 stockpile level threshold of 7500 t (75%).
Proper definition of operating modes and triggering conditions assures a stable operation, which in turn has economic implications that affect the competitivity of the mine. For example, the potential to enhance cyanide efficacity in Stage 2, while maintaining the throughput, can imply significant net savings, considering the saddle-point region of Figure 24, setting (Y/X) to between 50% and 90%. This figure is produced essentially by multiplying the data of Figure 21a with 21b, and assuming a cost of $2500/t of NaCN in USD. Without the recuperative Configuration D, the cyanide costs are determined by a mass balance of the regular and contingency modes of Configuration C (See Table 5) giving annual cyanide costs of roughly $5.5 M observed in the left-hand side of Figure 24. But at a (Y/X) value of roughly 75%, there is a balance between the two Configurations, which is a better utilisation of the oxide ores, resulting in costs of approximately $4.7 M per year meaning savings in the range of $800k per year, or roughly 14%. The rightmost point of Figure 24 could suggest further saving by setting (Y/X) = 100%, but this would be to fully rely on the recuperative Configuration D, causing a significant decrease in throughput as observed by Figure 21a; this extreme should therefore not be applied.
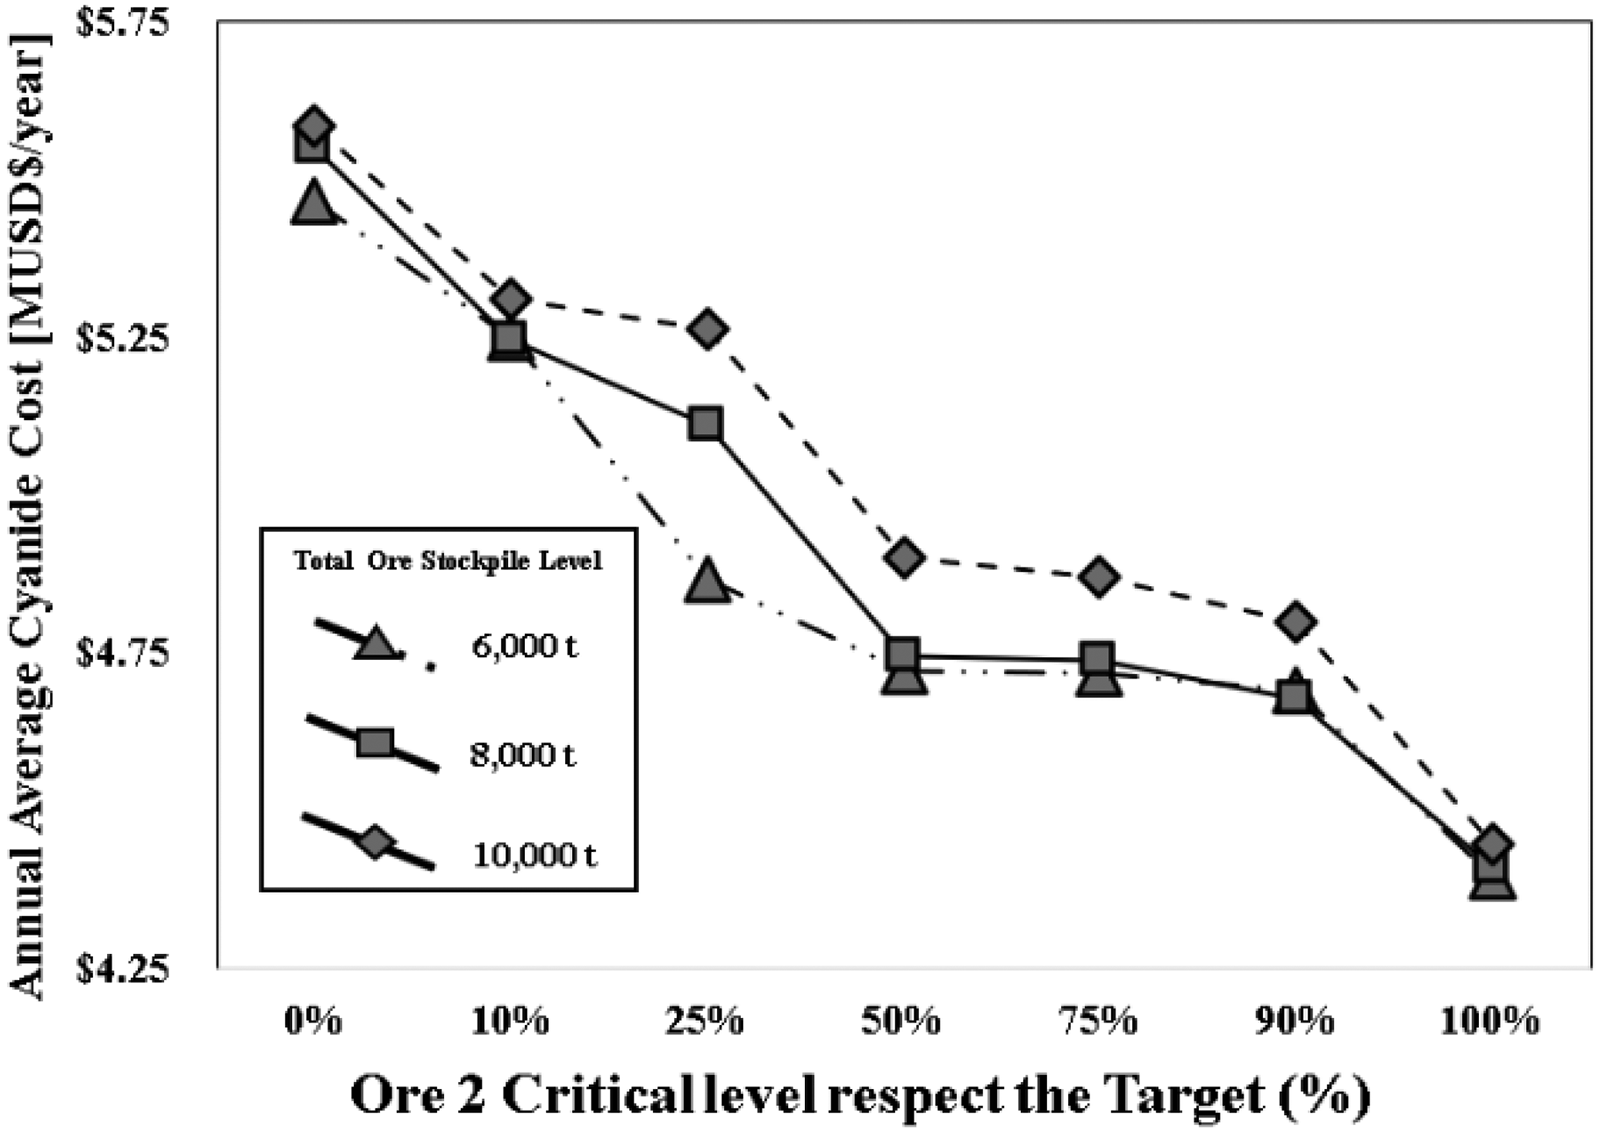
Cyanide costs during Stage 2, revealing potential benefits setting Ore 2 critical level at 50% and beyond.
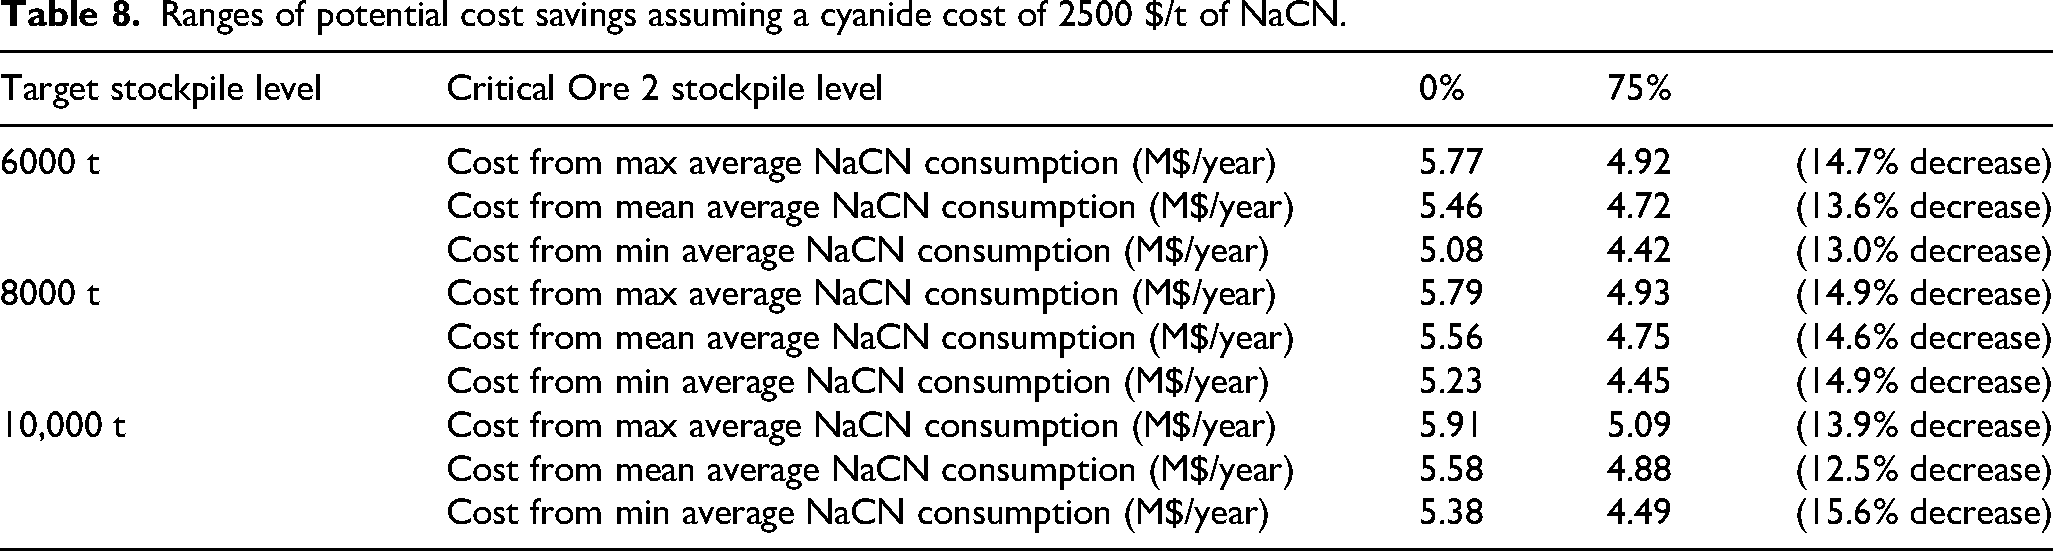
Some caution is necessary when considering the potential cyanide cost savings that are roughly 14%. Table 8 gives the ranges considering the target stockpile levels that were considered, which suggests some confidence in the savings, but these are predicated on assumptions that there are overriding factors, e.g. the reliance on mine surging (Figure 23b), and whether or not the modes described by Tables 5 and 6 can translate from the laboratory or pilot setting into daily operations. This type of result is helpful in a scoping study, however, and would help support a budget for a following effort within a next phase of engineering, since the potential magnitude of the savings is considerable. Another part of the argument could be the strategic importance of better managing the incoming ores that may be increasingly complex as new zones are accessed, for which simulation-based control may have an important role.
Ranges of potential cost savings assuming a cyanide cost of 2500 $/t of NaCN.
Discussion
Monte Carlo frameworks can be used to test operational policies governing how a system should confront specific sources of uncertainty. The simulations in this particular study consider a predetermined mining sequence which confronts an uncertain balance of two incoming ore types that are separated into two piles. A potential risk of a stockout is signalled when the corresponding level falls below a critical threshold, which triggers that there should be a change in the configuration of the process, to temporarily draw less from the vulnerable stockpile, thereby allowing this stockpile to be replenished prior to reverting to the preceding mode. Different configurations of the critical stockpile levels will offer different trade-offs between productivity and risk of stockout, which in practice should undergo periodic revision. Depending on the implications of a stockout, e.g. irregularities in cyanide consumption or loss in gold recovery, some stockout risk should be tolerated, and may be inevitable depending on the extent of the geological variation.
Ultimately, the new contribution for this work is to generate stochastic operational profiles, merging the results from variography (Figure 16) and geostatistical simulations (Figure 17) with an excavation sequence, to obtain operational profiles of key process variables, in this case cyanide consumption and throughput (assuming that recoveries have been maintained high). The context of narrow vein gold mining is particular because a respectable excavation sequence can be fixed due to the restricted geometry (Figure 18), while a less restricted geometry would require an explicit representation of short-interval control, and possibly a strategic mine planning algorithm. Thus, the narrow vein context is both industrially relevant and academically relevant due to its simplified geometry. Previous work had not explicitly represented the geospatial aspects at all7–10; this earlier approach is what can now call the Simplified Monte Carlo approach (Figure 11).
There are several directions for future work. Underground mining contexts described by thin tabular deposits may demand only slightly more sophisticated approaches to block sequencing than what is applied for the narrow vein context, including planning algorithms. Such a case may be an academically relevant advance that is tractable within a next paper, showing the confrontation of geological features through alternations in plant configuration (as in the current paper) in combination with mine sequence alterations. In this case, the geospatial simulation should not be decoupled from the mine system dynamics, as in Figure 12, since the incoming geological information affects the short-term operational decision-making, rather than being predetermined. However, it can still be a modest advancement from the current work if the orebody can be reasonably represented through 2D geostatistical simulation. SGS seems to be an attractive starting point to represent the (dynamically evolving) supply uncertainty, if there can be a computationally efficient approach to expand the Cholesky factors with new incoming samples. Conversely, there can be cases in which the mineralogical content of the vein is relatively certain in comparison to the geometrical variation in direction of the vein; in such a case SGS may not be as relevant as a Monte Carlo approach to represent the detection and adherence to the layout of vein.
Efforts that have been simultaneous to the current work have included, on one hand, application of SIS within the context of narrow vein mining with an orientation to bridge 2D conditional simulations to economic evaluation, 11 and on the other hand the linking of stochastic open-pit strategic planning to the dynamic short-term variations that can be supported through DRS. 6 There is indeed an interest in experimenting with a range of conditional simulation techniques, reporting on the respective practical advantages that they may have in regard to the basic two-point techniques SIS and SGS. Establishing a wider range of examples linking drill core samples with laboratory, pilot-scale and in-plant experiments to establish new operating modes, under geological uncertainty, can lead to advances in mining engineering methodology. This can include parametric studies on the number of geological scenarios and operational scenarios (the tendency would be to have several DRS replicas per simulated orebody, since the latter is more computationally demanding). For an extension into a full 3D representation orebody representation, the open-pit context may be more tractable than underground massive deposits, due to the advances in open-pit strategic mine planning. Existing stochastic open-pit mine planning techniques represent operating modes through static time-averaged mass balances. These approaches could be complemented by dynamic simulations that support increasing levels of details, whereby the strategic mine plans become better parameterised through the multiphase engineering processes.6,34 Addressing the life-of-mine economic aspects early within a multiphase engineering effort, in relation to equipment configurations and operating modes, provides the justification for which studies will be sought in the following phases.
An important contrast can be made between (1) the shortcomings of a particular DRS model, and (2) the inherent strengths of the underlying conceptual framework. Within an industrial context, the decision whether or not to further develop a model depends on whether or not the current model is sufficient to support the potential operational adjustments, and what the priorities would be in a hypothetical next phase. In certain contexts, the desired enhancements would be in tandem with substantial engineering efforts. Within the geological context of El Peñón, the oxides are diminishing, precisely as deeper zones are brought into production that increasingly are hosting primary copper sulphides; the most problematic feeds would likely remain from the copper supergene zones surrounding the paleo water table, and increasingly it may be certain deeper zones (with the non-cyanicidal chalcopyrite as the dominant copper species) that moderate the cyanide consumption. Indeed, the underlying conceptual framework (i.e. stochastically sourced dynamic mass balance) would support such new operating modes, utilising the increased experience with these deeper ores. The framework itself would be part of the justification to attain the budget and human resources to study new subcategories of the ore. Sample computations could demonstrate to project leaders that the simulation developers would know what to do with new laboratory or pilot plant data if they had it, and therefore should be granted the support to extend the geometallurgical models.
There can be additional ‘ground-floor’ aspects to consider, such as whether the incoming feed is properly homogenised, and if the operator responses are sufficiently well represented. While the accounting of cyanide consumption may be managed on a weekly or monthly basis, the actual operational responses occur within an hourly timeframe. This hourly variation is not represented within the computations shown in the current work, which instead only considers the time-averaged rates that are characteristics of Configurations A through D. Neglecting hourly-scale feed variability likely leads to an underestimation of predicted cyanide consumption by 5%–10%, as plant operators in practice compensate for short-term concentration spikes through conservative (excess) cyanide dosing that is not captured in the monthly averaged model dynamics. These short-term operational phenomena could be represented within the framework, in conjunction the geometallurgical challenges.
Conclusions and future work
The simulation of realistic operational scenarios requires collaboration between simulation developers and experienced professionals to properly describe critical issues. Reengineering efforts such as at the El Peñón Mine in the mid-2010 provide invaluable guidance for academic developments, which in turn provide further insights hopefully for future projects. Nonetheless, the conclusions for the current paper are summarised as follows:
The predetermined mining sequence typical of narrow vein gold and silver mining allows the simulation of operating policies similar to that of inventory systems, given a precomputed set of equiprobable geological scenarios. Although the limitation imposed by narrow vein geometry does not immediately carry into general treatments, it motivates treatments for other simplifying geometries as topics for future papers. Alternating configurations of the cyanidation process, assuming enforceable operating modes, is an effective means of confronting variation in the orebody mineralisation that would otherwise lead to diminished metallurgical performance, including unfavourable compromises between throughput and cyanide consumption. Challenging the assumption of enforceable modes, i.e. case-specific situations in which operating modes may be difficult or impossible to enforce, is a likely direction for future simulations. Simulation-based control provides a means of systematizing early experiences with incoming complex ores (e.g. cyanide consuming ores) within multiphase engineering projects that result in adjustment of operating policies. The current work did not implement simulation-based optimisation, which is a logical next step to progressively refine the mode-changing conditions, and is the topic of current work that further develops the narrow vein gold cyanidation context.
Footnotes
Acknowledgements
This research was partially funded by a scholarship granted by the Chilean National Agency for Research and Development—ANID, grant number 219972210087. Further funding was provided by the Natural Science and Engineering Research Council (NSERC) of Canada, the Discovery Grant program, grant number 253075.
Funding
The authors disclosed receipt of the following financial support for the research, authorship, and/or publication of this article: This work was supported by the Agencia Nacional de Investigación y Desarrollo, Natural Sciences and Engineering Research Council of Canada, (grant number 219972210087, 253075).
Declaration of conflicting interests
The authors declared no potential conflicts of interest with respect to the research, authorship, and/or publication of this article.