
Abstract
Investigation on the occurrence of magnetite ore minerals in Emure – Ekiti, Southwestern Nigeria was carried out by integrating magnetic and very low frequency electromagnetic (VLF-EM) methods on the suspicion that the major part of the magnetite ore being sought lies in the subsurface. Eight traverses in total were established with five traverses occupied in the northeast–southwest direction and the other three in the northwest–southeast direction. Six traverses were established across the exposed part of the pegmatite (magnetite) veins to serve as a control. Inter-station spacing of 1 m was chosen, so as not to miss any significant ore occurrence. The VLF-EM profile is a plot of the real and filtered real components. The KH-filter geophysical software was used to invert real data into a two-dimensional subsurface map that revealed variations in conductivity. The results of the geophysical interpretation for both methods indicate anomalous signatures observed on the exposed section of the pegmatitic veins, which are indicative of magnetite ore. These anomalous signatures align with certain zones along the Tr4 and Tr8 transects. Some of the high magnetic anomalies observed on traverse 5, 6, and 7 coincide with low conductivity suggesting the concentration of minerals such as quartz, microcline, plagioclase, and biotite, which are commonly associated with magnetite. The study has not only enhanced the mapping of the subsurface characterisation of the deposit but also confirms the reliability and suitability of using magnetics and VLF-EM geophysical methods for mapping magnetite deposits.
Introduction
Resources occurring naturally are critical for modern economies to function properly, as well as for all nations of the world to achieve and maintain high living standards. The way a country handles its natural resources has a big impact on its economic long-term viability. 1 Mineral resources have been known to play a crucial role in the development of any nation or state. Although numerous natural resources on the surface have been identified and focus is given to their exploration, a number of them occur in the subsurface and are yet to be discovered. There is no doubt that most ore bodies, mineralisation, and discovery outcrops were discovered by early prospectors. 2 The discovery and exploration of these resources can put considerable measures to the rate of concentration given to the exploration of surface resources and also create an increasing prospect of income. 3 Certain geophysical methods have been proven to be good tools for investigating subsurface ores minerals. 4 Some of these methods include electrical resistivity, gravity, electromagnetic, magnetic, seismic refraction, spontaneous polarisation, and induced polarisation methods. The theoretical formulation of these physical methods, their application for mineral prospecting, and their limitations have been discussed by authors such as Dobrin and Savit, 5 Robinson and Caruh, 6 Telford et al., 7 Burger 8 and Blakely. 9 The suitability of these geophysical methods for mineral prospecting and in solving other geophysical problems lies in the strong physical contrast existing among the earth materials. 7
Many researchers have successfully employed the magnetic method in search of ore deposits.10,11 Studies have further revealed more applications of the magnetic method to involve the mapping of geological structures and better delineation of targets via inversion.12,13 The VLF-EM method has been applied successfully in previous studies on ore prospection.14,15 They are often applied in ore prospection due to their association with high conductivity and chargeability characteristics. These methods have been widely employed in the prospection of different minerals.16–18 Babu et al. 19 modelled magnetic and VLF-EM data to spatially map the distribution of geologic structure associated with the mineralisation of brannerite and uranium.
Ilevbare and Orisamika 20 reported the occurrences of the mineralised veins and dykes of pegmatites around Emure - Ekiti using geochemical and mineralogical analyses. Also, no author has applied geophysics in the quest to define potential targets for ore mineralisation in the study area, this has resulted in less or no detailed results of associated geologic structure and mineralisation in the subsurface. The integration of geophysical methods has become an enhancing tool in ore mineral prospection leading to some successful mines. Therefore, it is highly imperative to carry out a detailed geophysical exploration study in the pursuit of economic mineral deposits of interest in the study area. It is in this regard that the magnetic and VLF-EM methods are employed to investigate the occurrence of the magnetite deposit in the study area. The geological mapping carried out in the area revealed the presence of some minerals associated with pegmatitic veins in the area. The properties of these associated minerals are distinctly different from the surrounding rocks, providing a good premise for the application of geophysical exploration. We, therefore, integrated VLF-EM, and magnetic methods to investigate the mineral deposit in this area. The results of this research would not only enhance the understanding of the deposit's subsurface characteristics but also confirm the reliability and suitability of geophysical methods in mapping magnetite deposits.
Location and geology of the study area
The research area is located in Emure Ekiti within Emure Local Government Area of Ekiti State, Southwest Nigeria (Figure 1). The town is located in the southeastern part of the state. The study area lies within latitudes 05° 29′ E and 05° 29.5′ E and longitudes 07° 25.5′ N and 07° 26.5′ N. It is found about 25 km southeast of Ado Ekiti. Accessibility in the study areas is through some main routes from Ise-Ekiti and Akungba-Akoko and other seasonal roads and footpaths. Due to the farming activities in the area, many routes are accessible by motorcycle and foot. The study areas cover some parts of the town, making accessibility to the outcrops easier.
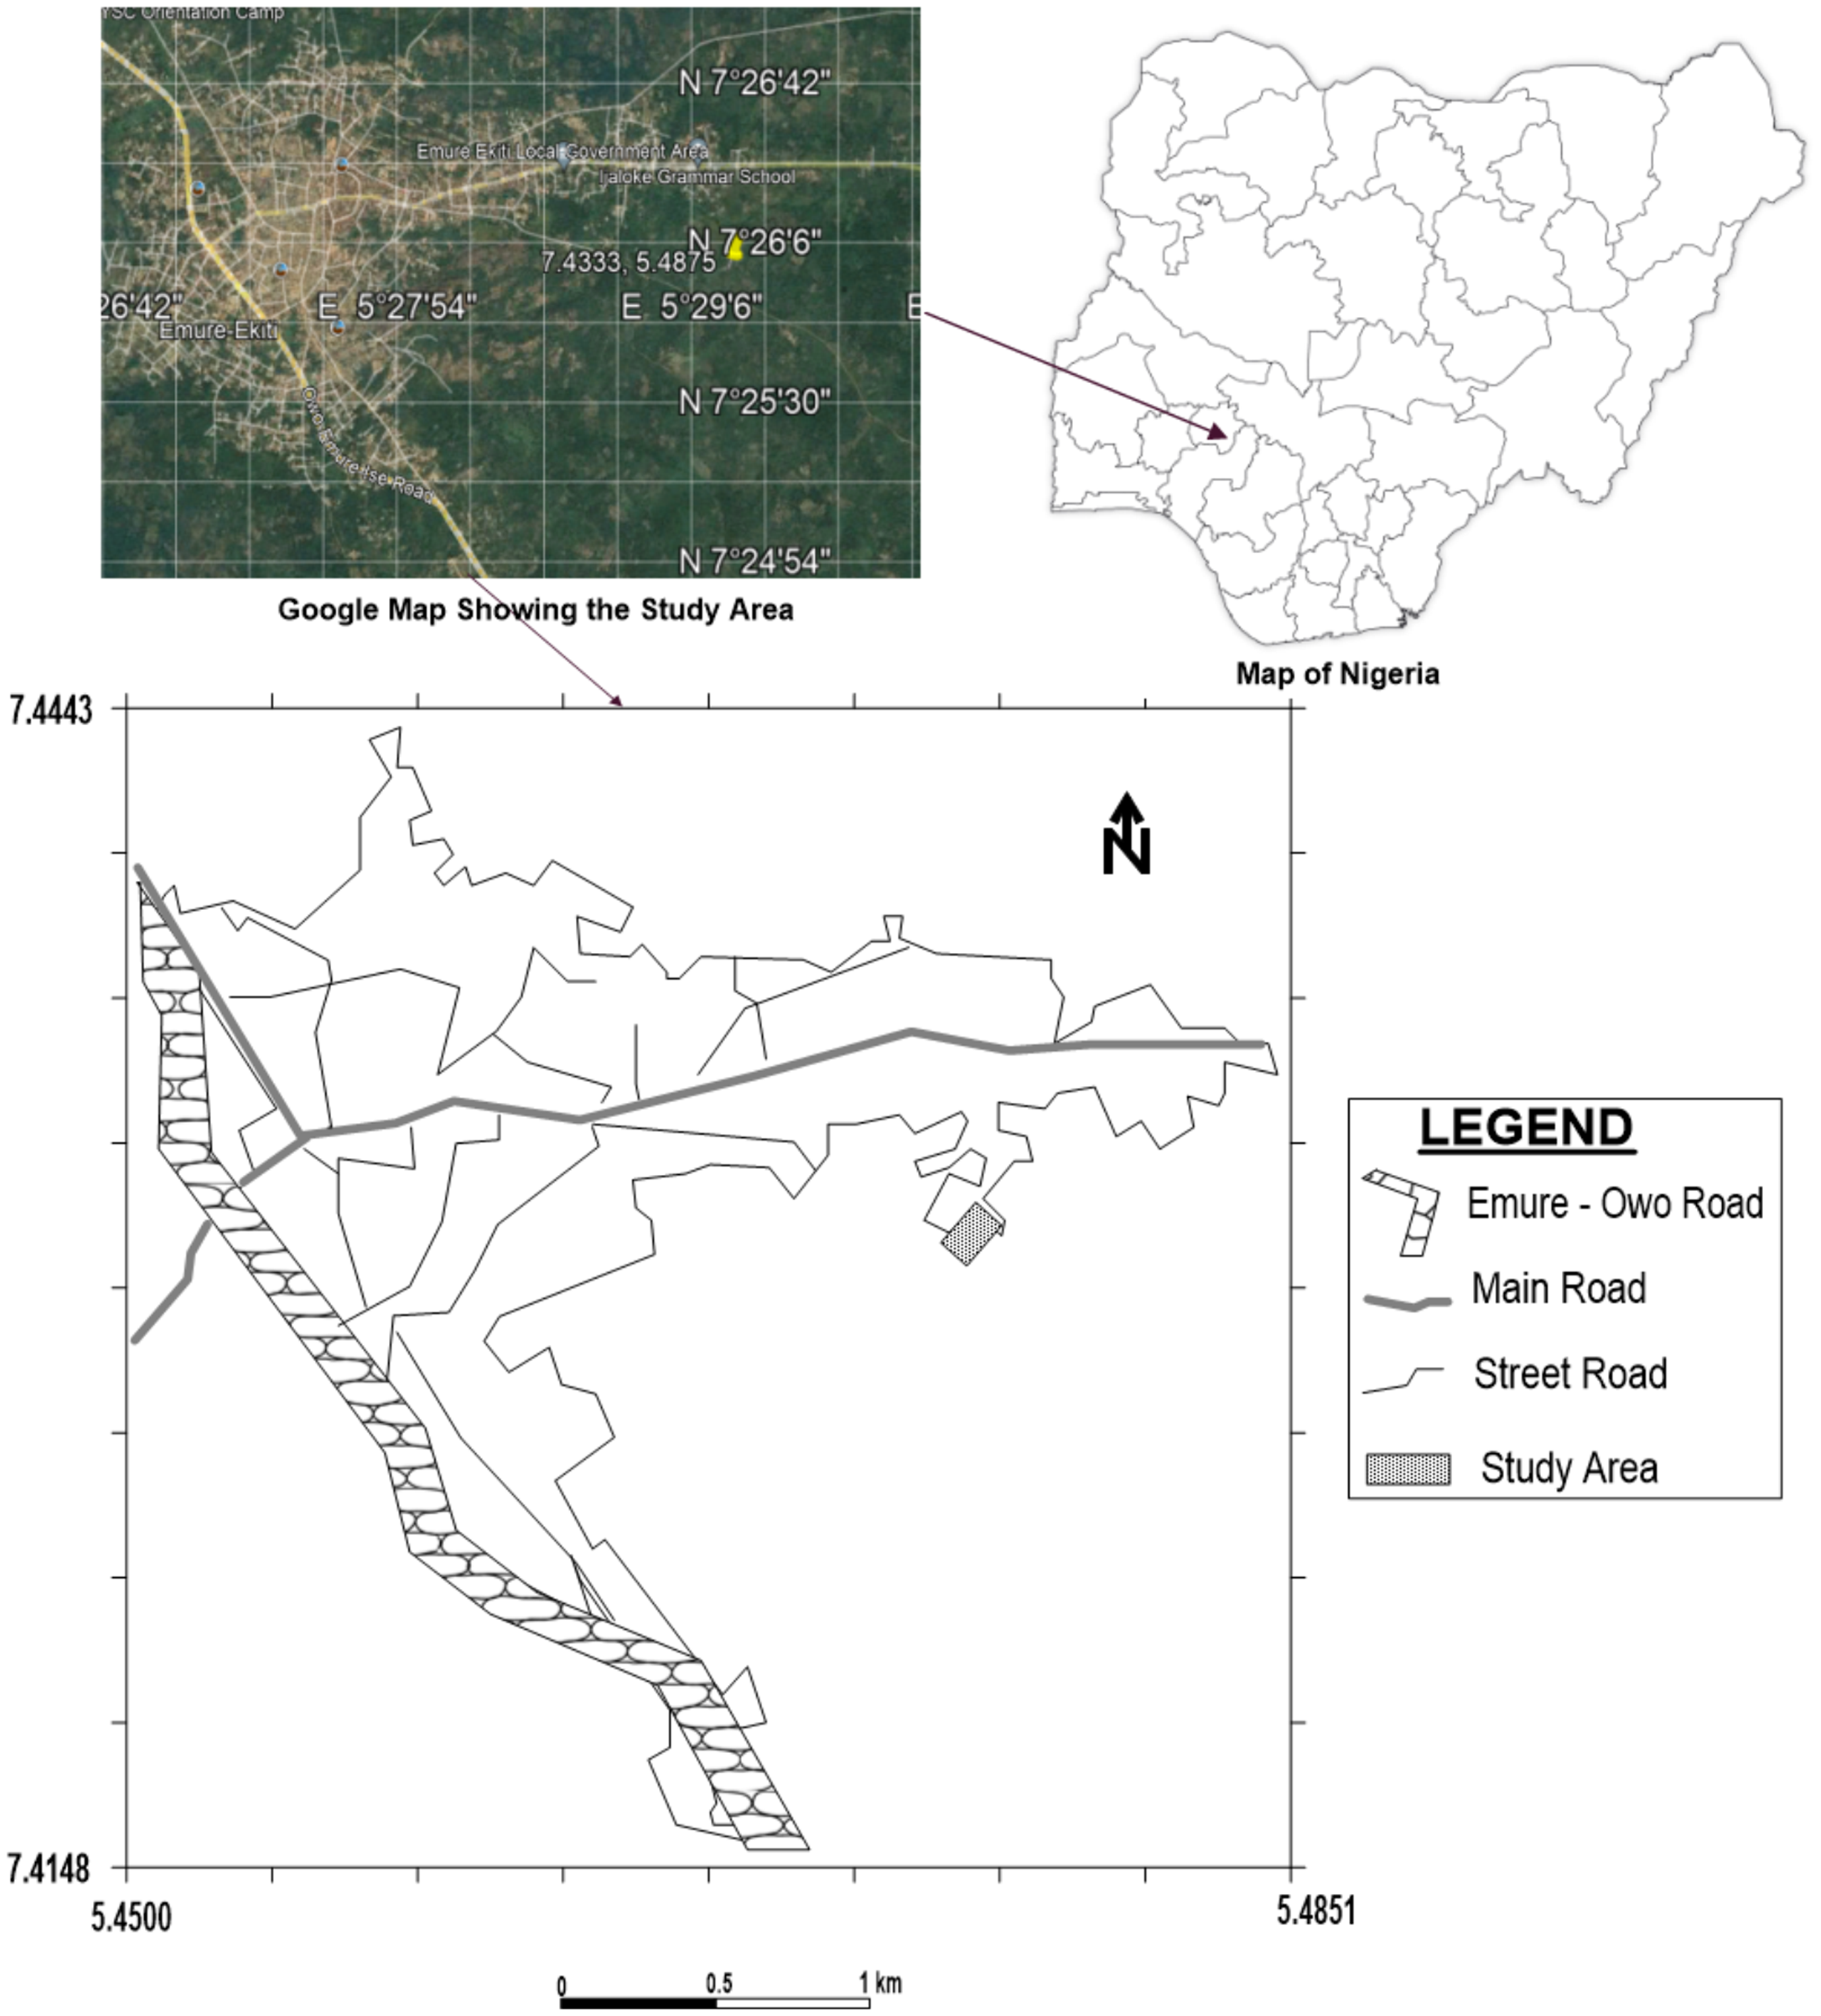
Map showing the study area.
Geologically, Nigeria falls into two main geologic terrains known as the basement complex and sedimentary environment. The former consists of hard rocks such as igneous and metamorphic rocks and the latter consists of soft rocks such as sandstone, limestone, etc. The study area occurs within the basement complex of southwestern Nigeria which consists of four broad groups of rock viz, gneiss–migmatite–quartzite complex; schist belts; Pan-African granites (older granites) and associated granitic rocks; and minor felsic and mafic intrusives. 21 It is made up essentially of high-grade metamorphic rocks, which comprise schists, gneisses, migmatites, marbles, and quartzites of the Precambrian age (over 2 billion years). The schist belts consist of approximately north–south trending narrow zones of low to medium-grade metamorphic rocks of mainly sedimentary and minor igneous origin which were deposited previously on the preexisting gneiss–migmatite–quartzite rock. 22
The rocks of the schist belt are composed of phyllite, schist, quartzite, amphibolites, and flaggy gneiss of the Paleoproterozoic age (about 2 billion years). The minor felsic and mafic intrusives consist of concordant and discordant dykes, veins, and irregular bodies of pegmatite, aplite, quartz, dolerite, gabbro, pyroxenite, and serpentinite. 22 They intruded all the preexisting rock groups namely the gneiss–migmatite–quartzite complex, the schist belts, and the Pan-African granites. Thus, they are the youngest members of the basement complex of Nigeria. However, Emure – Ekiti is underlain by the migmatite–gneiss complex and granitic rocks (Figure 2), which have been intruded by various generations of pegmatite swarms (Figure 3(a) to (c)), especially in the eastern half of the community.
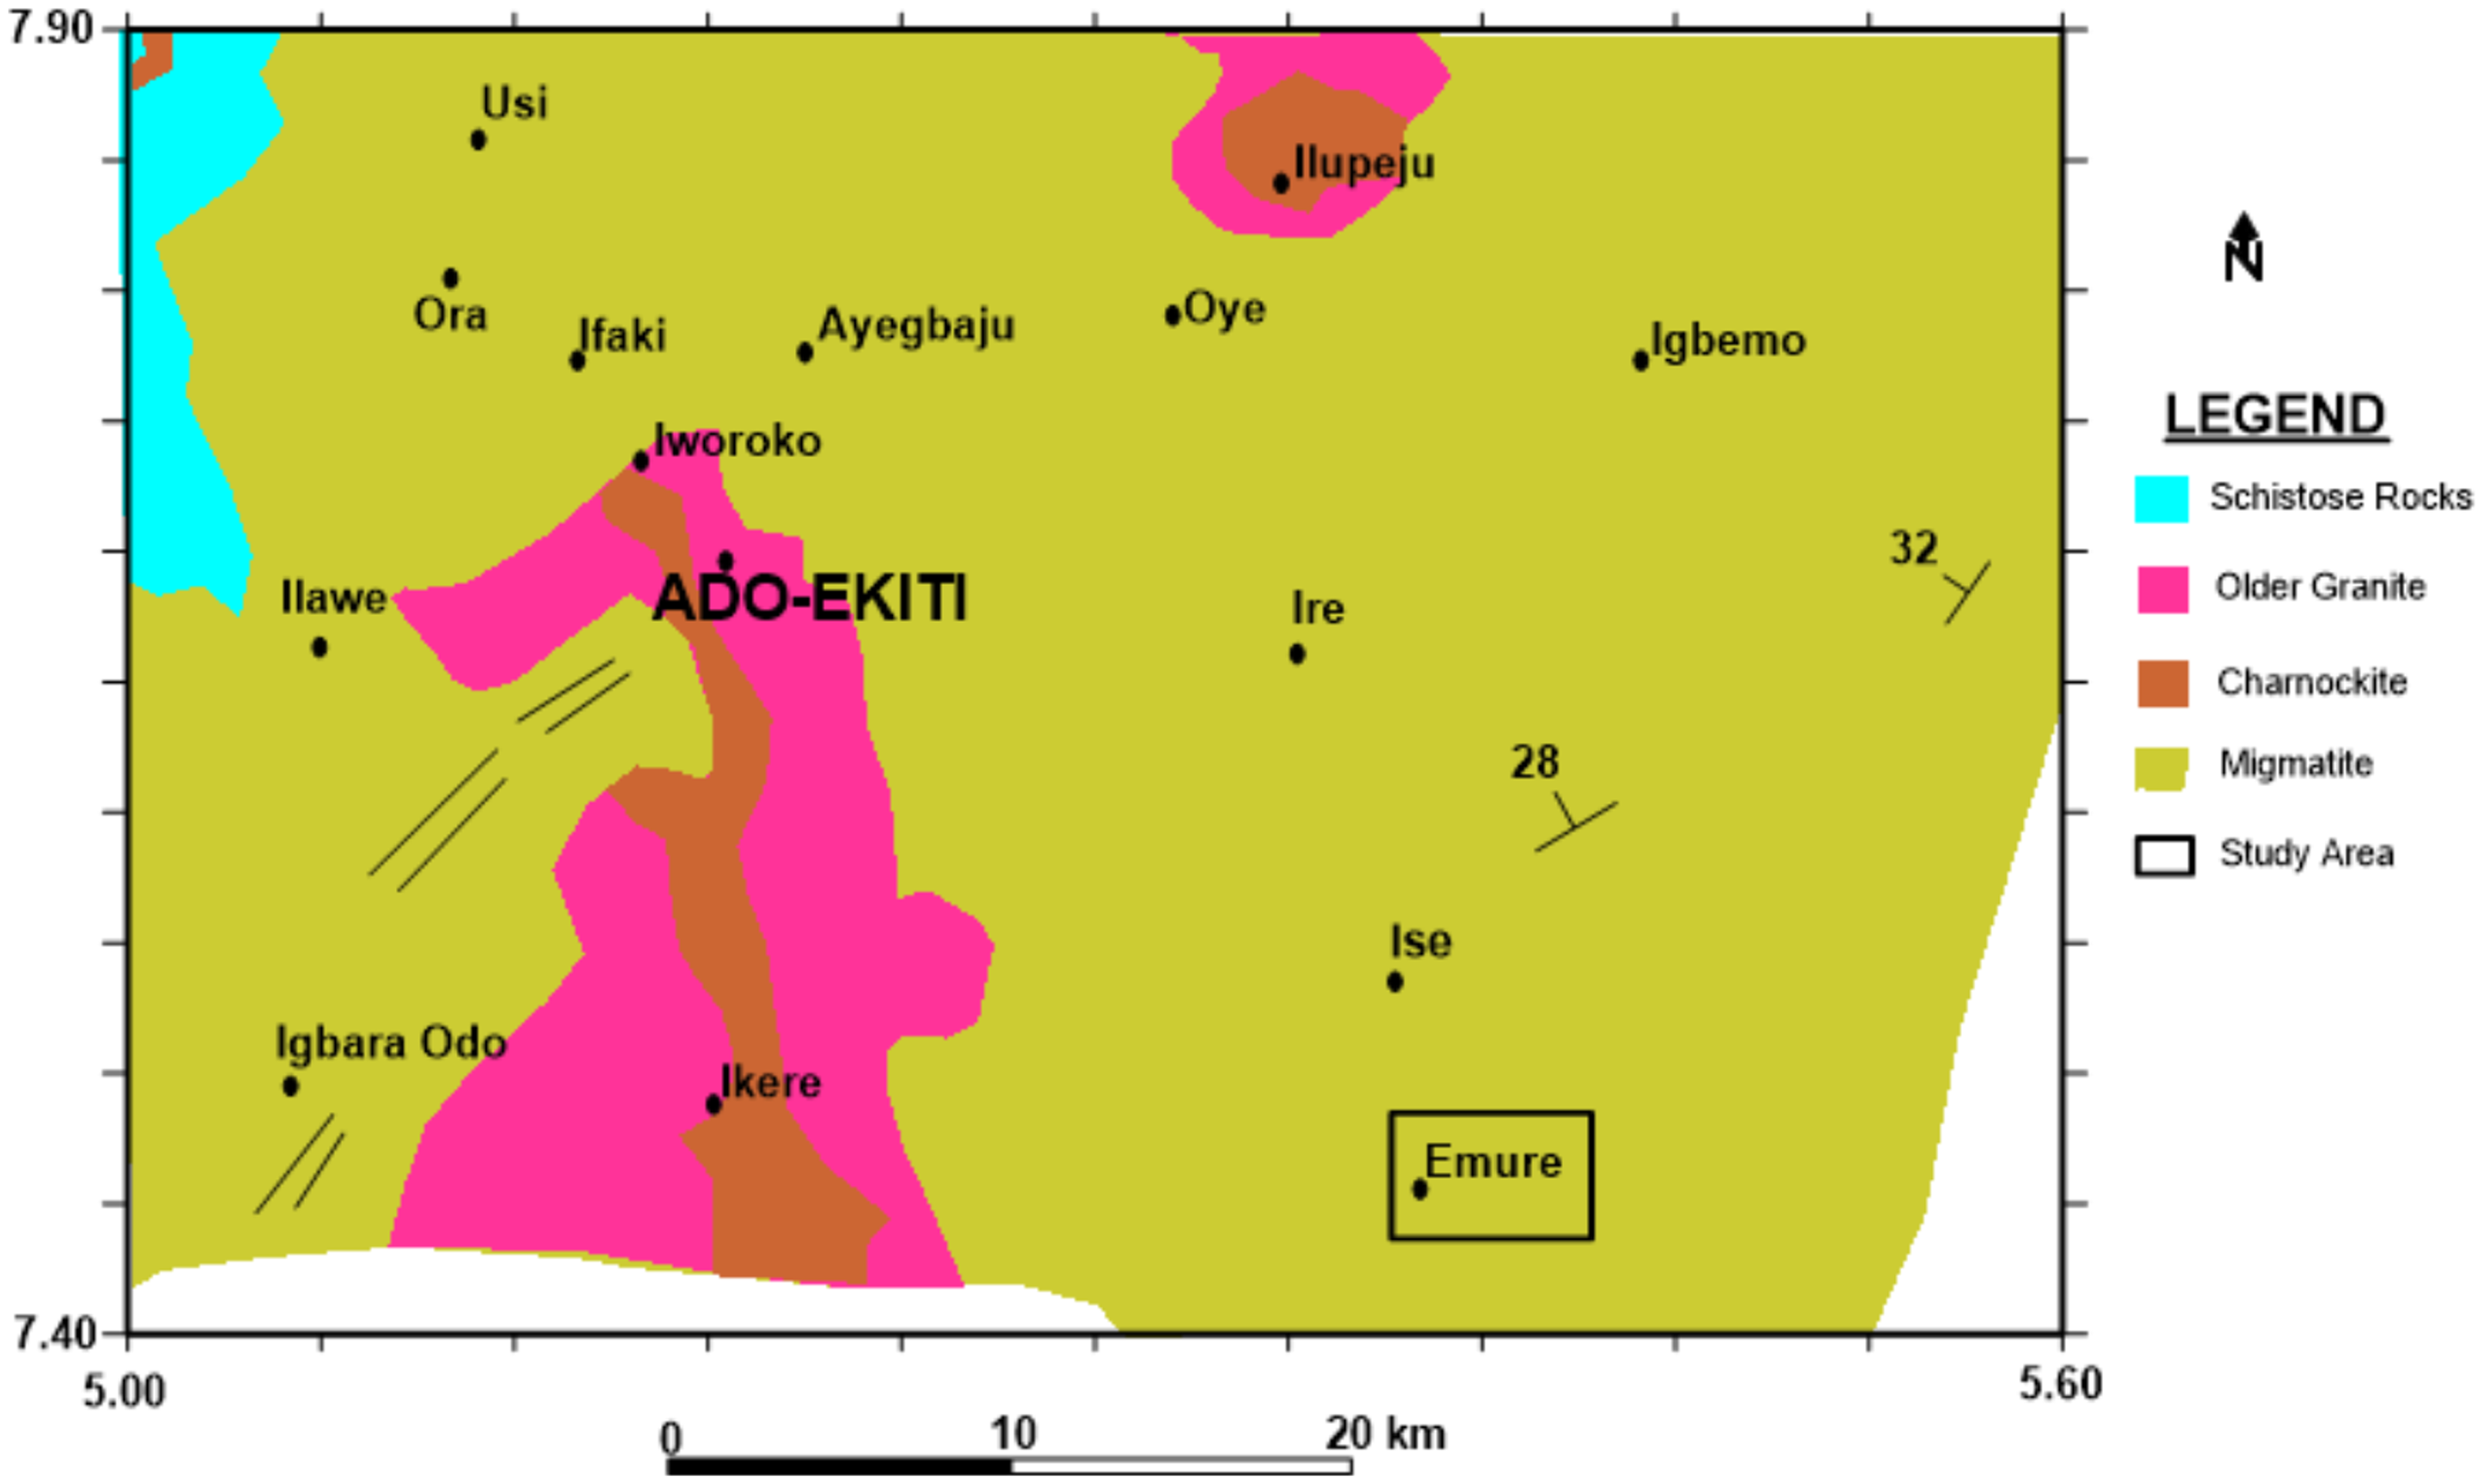
Geological map of the study area. 23
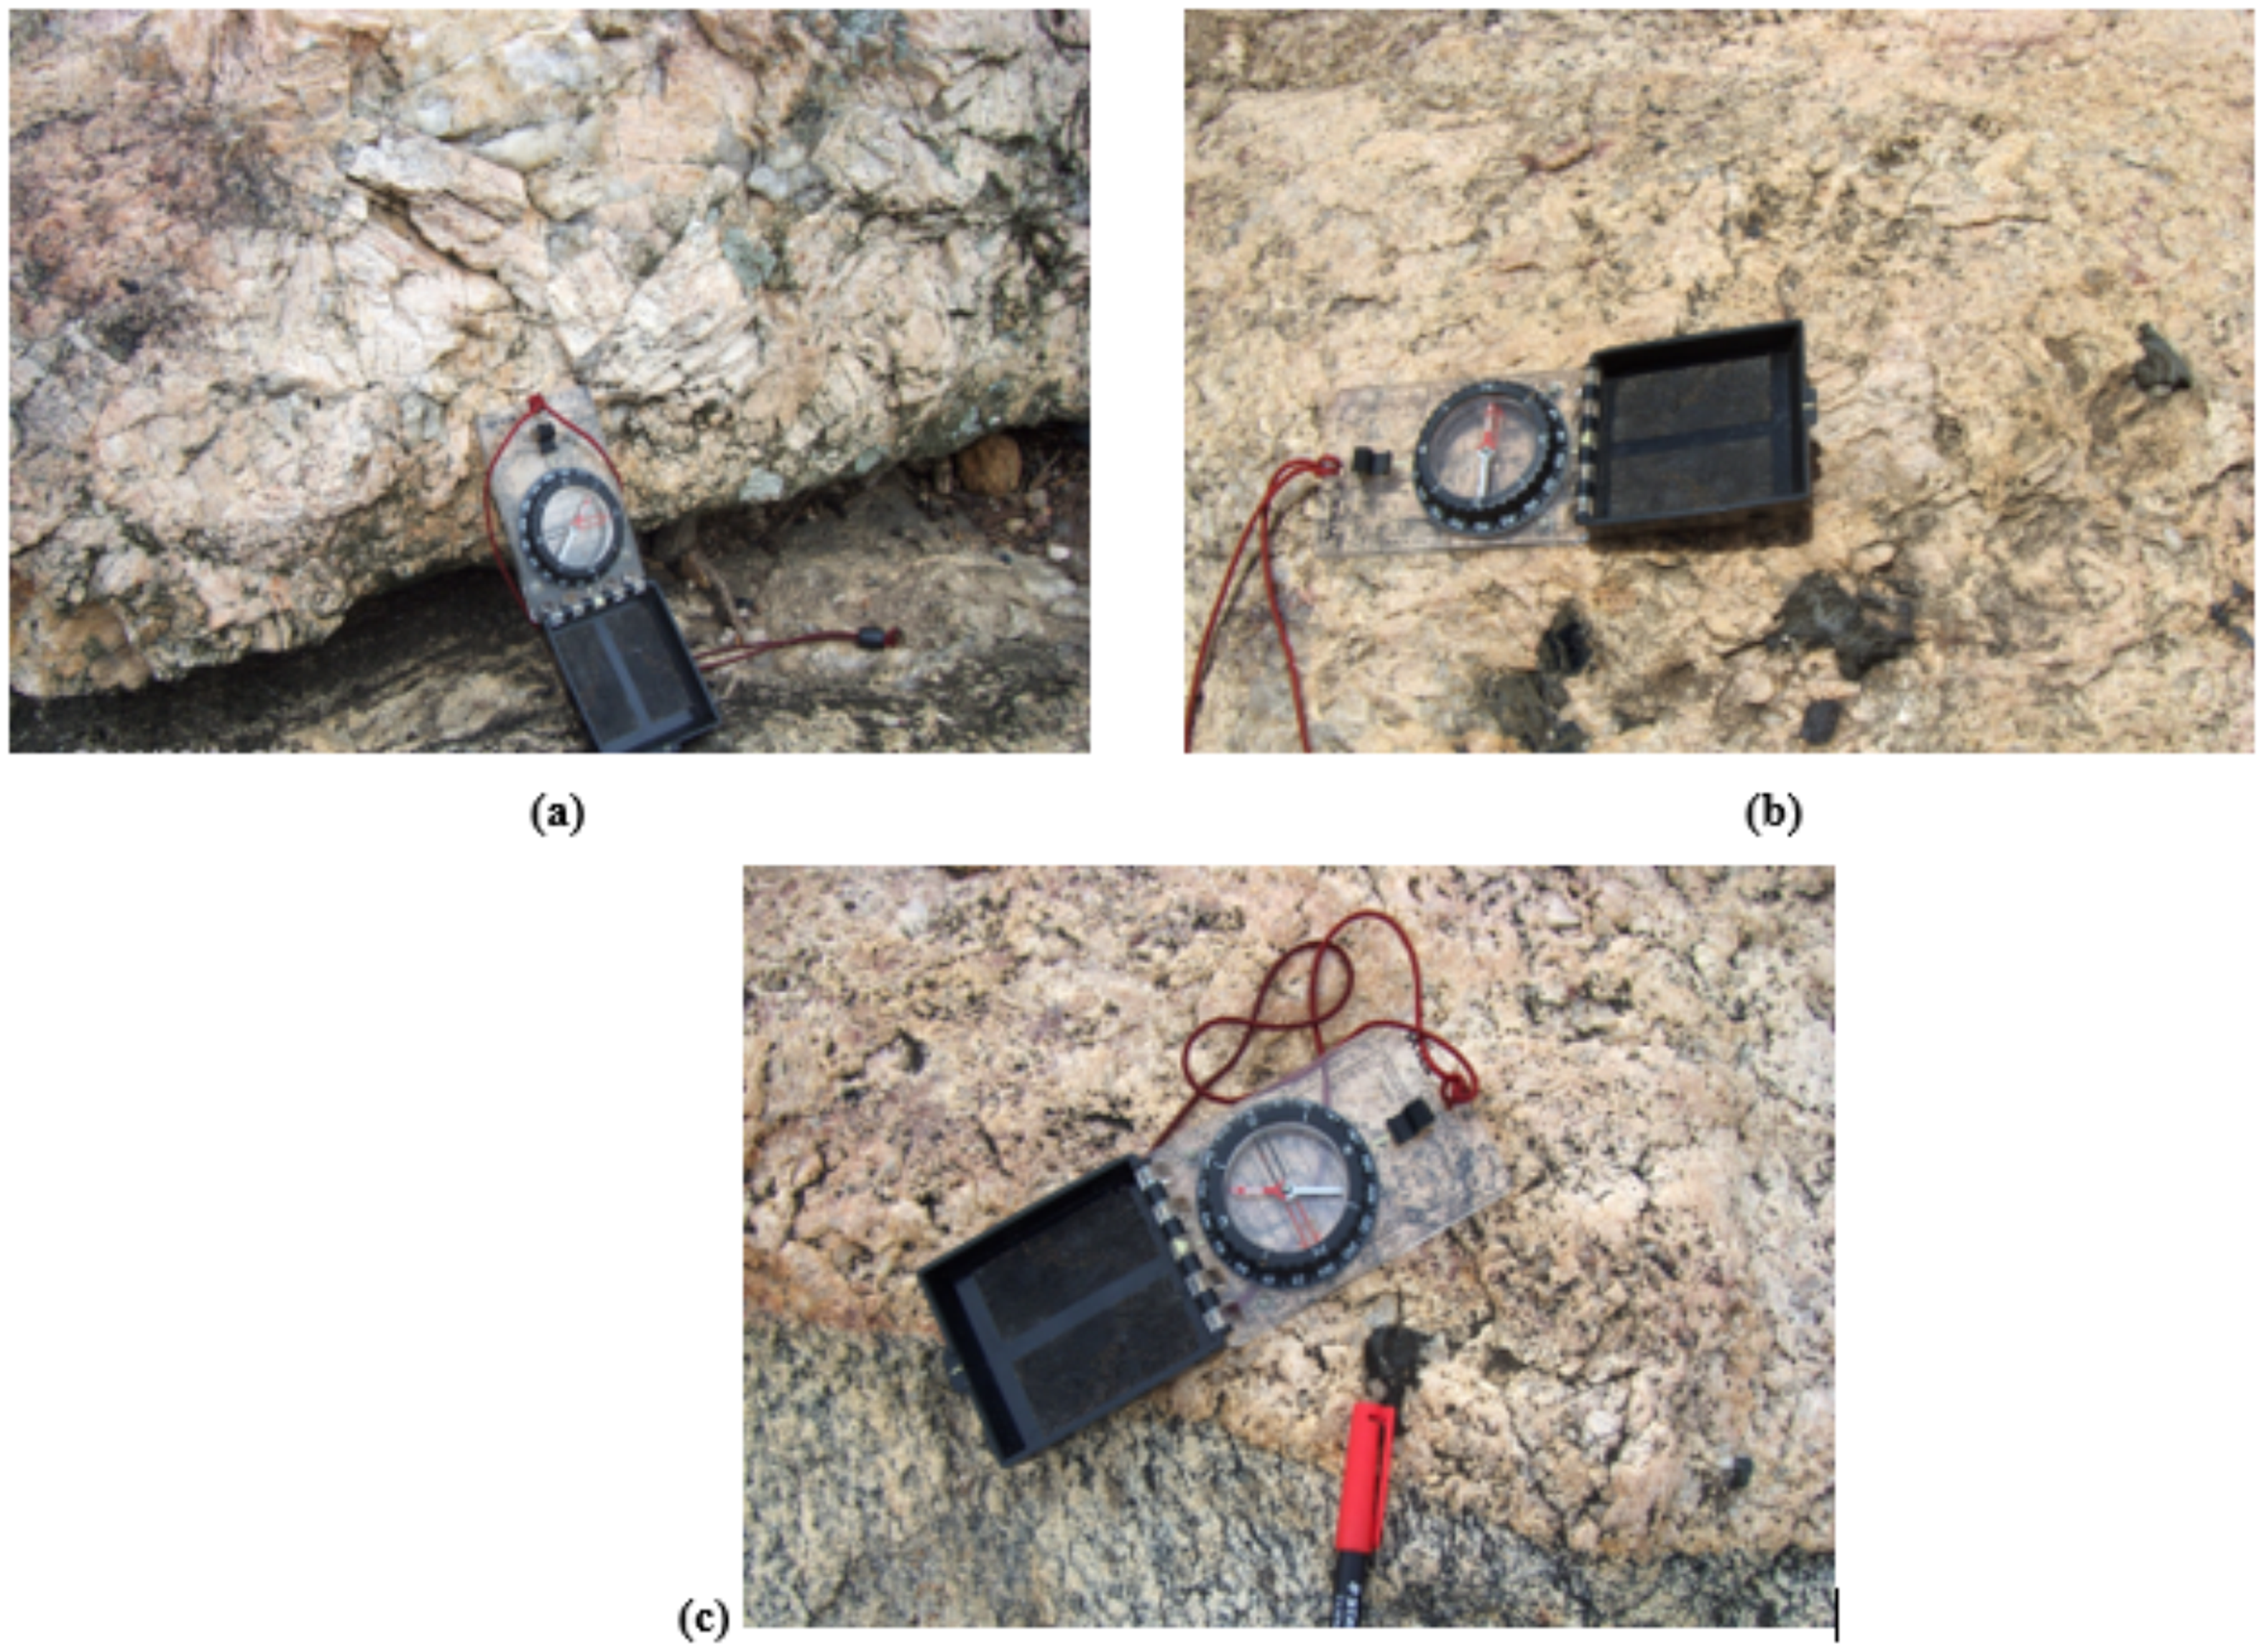
(a) Pegmatite with quartz vein and feldspar margin. (b) Magnetite minerals (black) in the pegmatite-rich vein. (c) Presence of ore mineral (black) in a pegmatite vein.
Methodology
Data acquisition
Very low frequency electromagnetic (VLF-EM)
The VLF-EM data were acquired using ABEM WADI VLF equipment. A total of eight traverses (Tr1, Tr2, Tr3, Tr4, Tr5, Tr6, Tr7, and Tr8) were established for this study. Five traverses (Tr1, Tr2, Tr3, Tr4, and Tr8) were occupied in the northeast–southwest direction while three traverses (Tr5, Tr6, and Tr7) were occupied in the northwest–southeast direction. The spread length was 56 m for Tr1, Tr2, and Tr3, 50 m for Tr5, Tr6, and Tr7, and 41 m for Tr4 and Tr8 due to the accessibility level in the study area. Two traverses (Tr4 and Tr8) were established on the unexposed part of the pegmatite veins while the remaining six traverses (Tr1, Tr2, Tr3, Tr5, Tr6, and Tr7) were established on the exposed part of the pegmatite veins which serve as a control to other traverses (Figure 4). The reason behind this is to observe whether the anomaly signature for the unexposed part of the pegmatite vein corresponds to that of the exposed part. The electromagnetic field's filtered real and raw real components were measured.
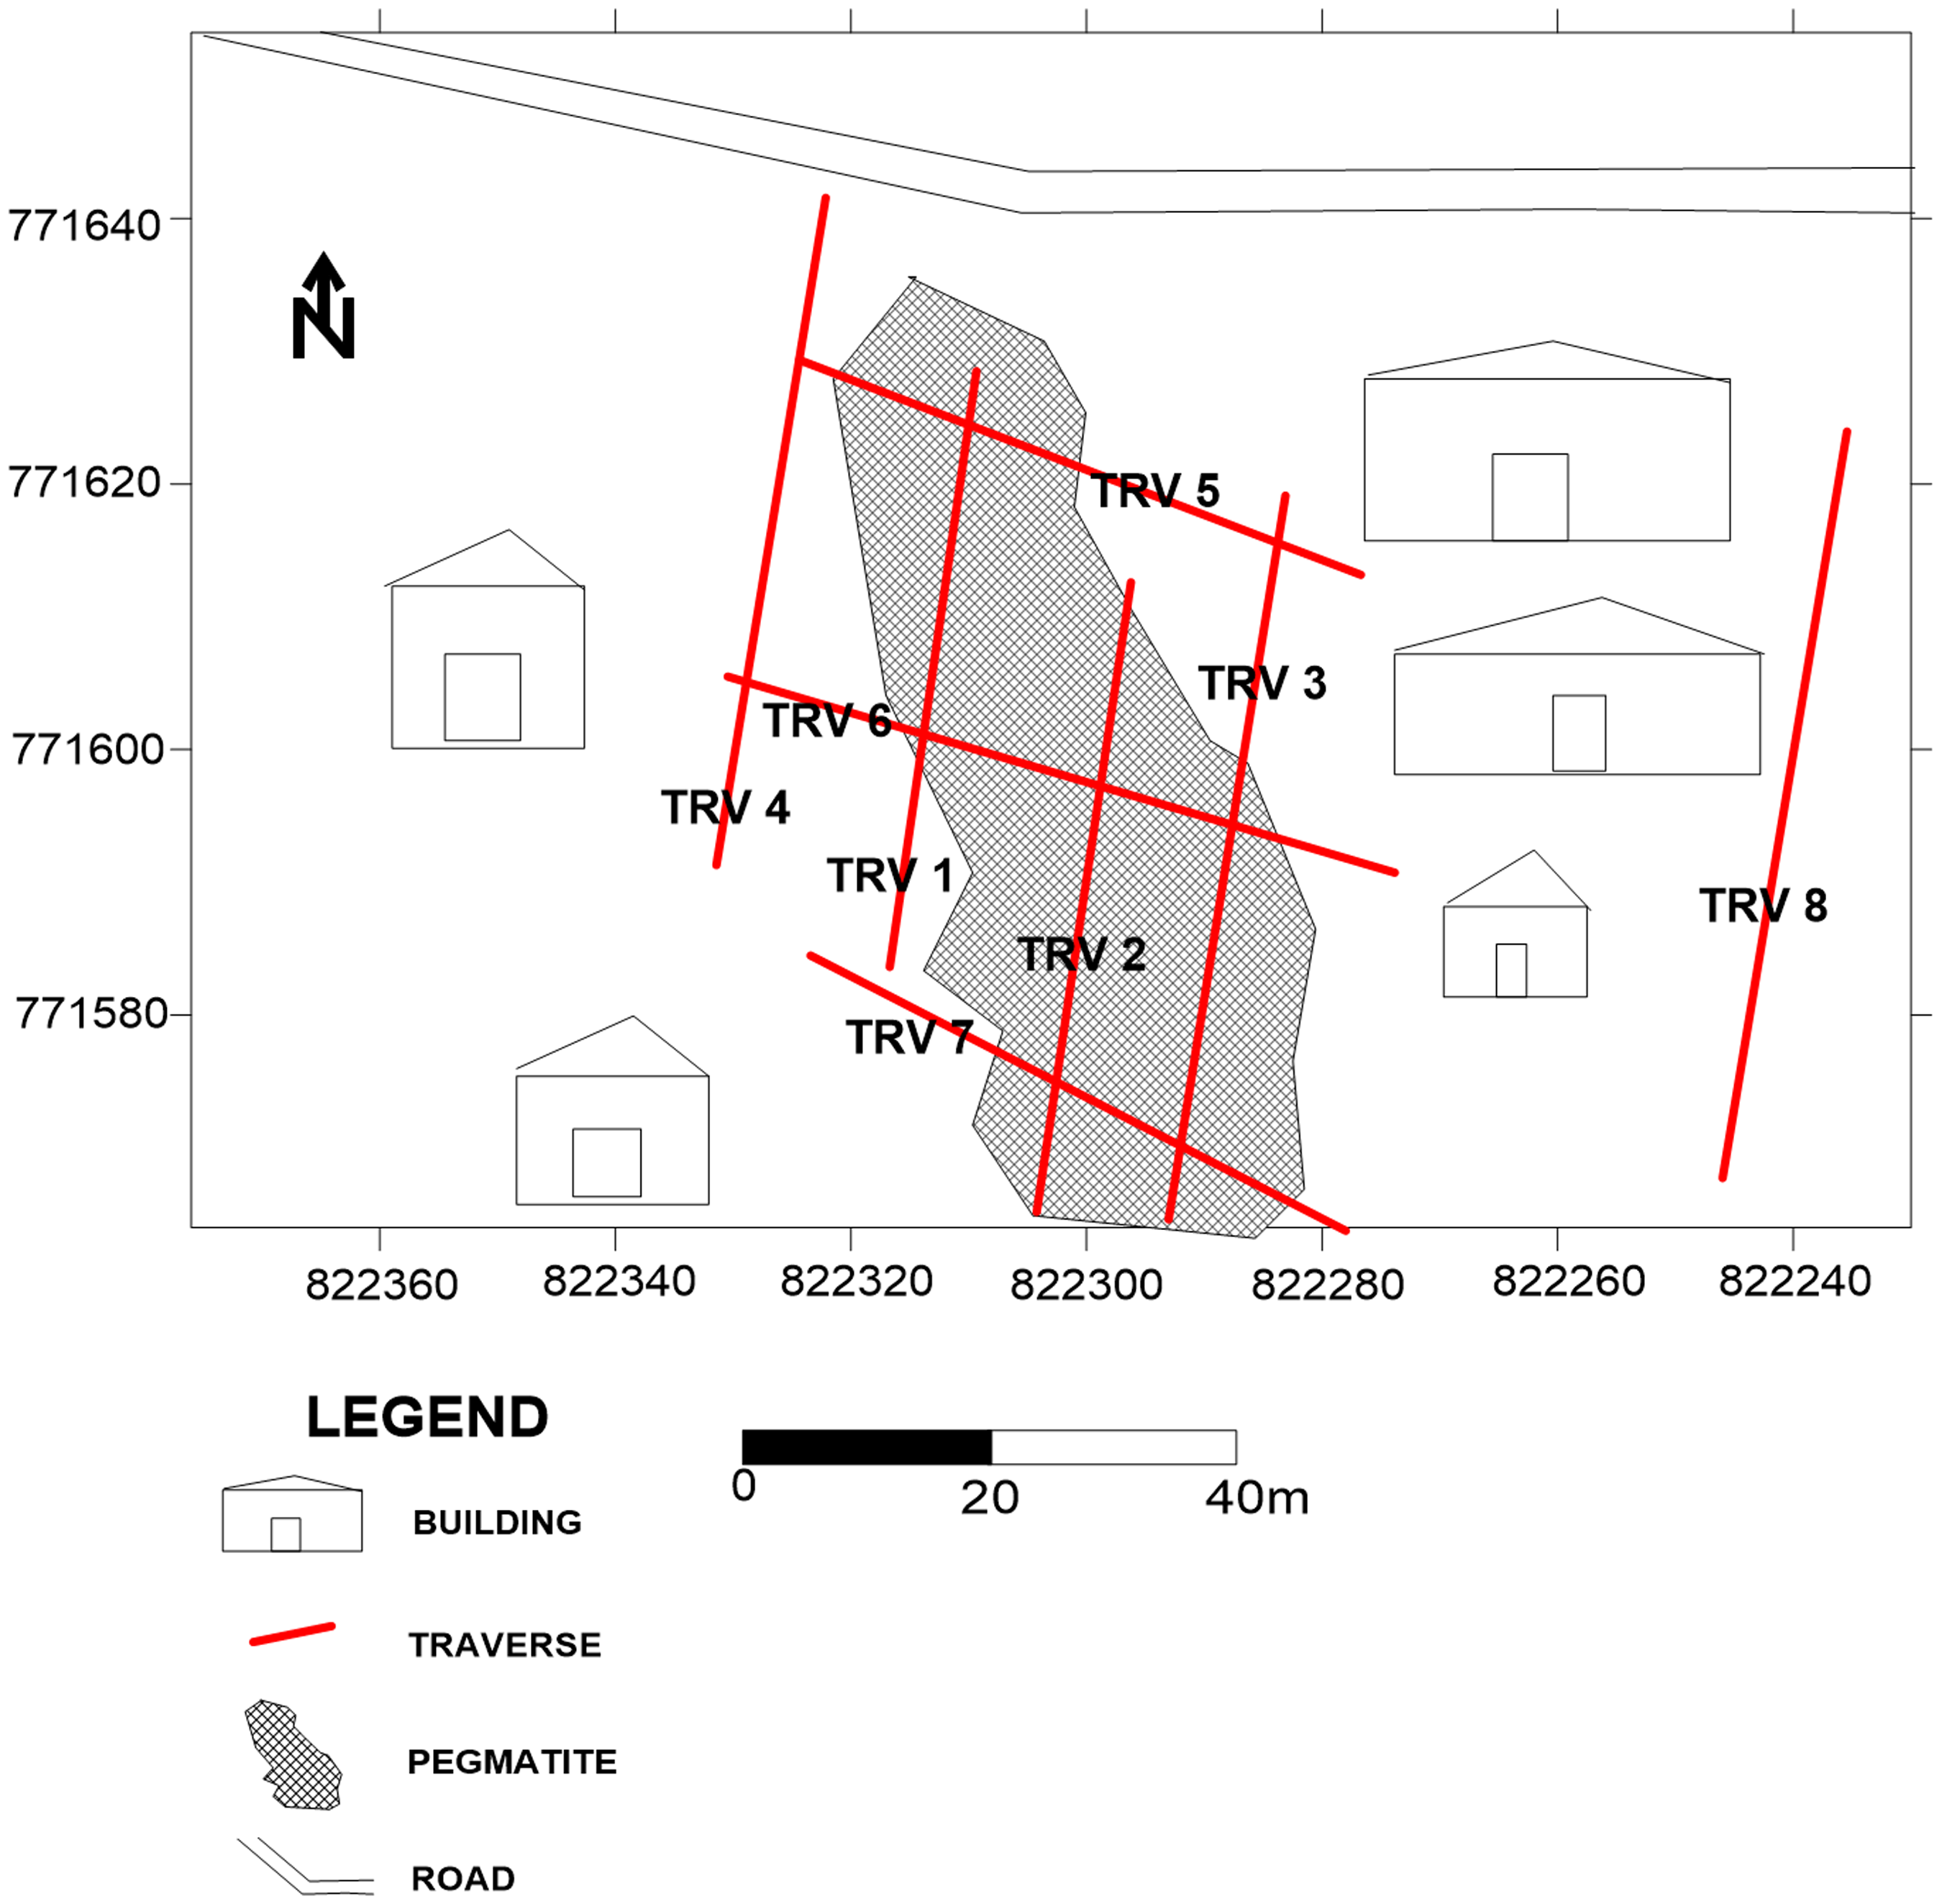
Location map of the study area.
Magnetic method
The ground magnetic survey was carried out along the eight already established traverses using a proton precision magnetometer (GSM-8). The survey began with the establishment of a base station and the time was recorded while two magnetic measurements were taken at regular station intervals of 1 m in which the average value was computed. The base station was re-measured at time intervals of about 2 h and its magnetic readings were recorded.
Data processing
Very low frequency electromagnetic (VLF-EM)
The VLF-EM data was processed using Karous-Hjelt software. KH and Fraser filtering were used for data analysis for VLF-EM data along the traverses and their profiles were generated.
Magnetic method
Before interpretation, the act of processing magnetic data is critical. A diurnal correction was applied to the magnetic data as diurnal fluctuation causes changes in magnetometer readings across time. Corrected magnetic readings were then plotted against the station positions as magnetic profiles. The residual magnetic anomaly profiles were generated after the magnetic data collected in the study area have been corrected for time-varying magnetic (diurnal) variations, and the international magnetic reference field was removed from the regional anomaly.
Data interpretation
The interpretation of VLF-EM and magnetic data in this study involved only qualitative interpretation of resulting anomalies. In qualitative interpretation, conclusions are drawn via visual inspection of VLF-EM and magnetic profiles for patterns that are diagnostic of targets and yield information about the subsurface conditions of the study area.
Results and discussion
The measured geophysical data after the initial application of necessary corrections and processing are presented as profiles. The VLF-EM data for the eight traverses are presented as profiles by plotting raw real against station position while the ground magnetic data obtained over the eight traverses in the study area are presented as plots of relative and residual magnetic against their station numbers (Figures 5–20).
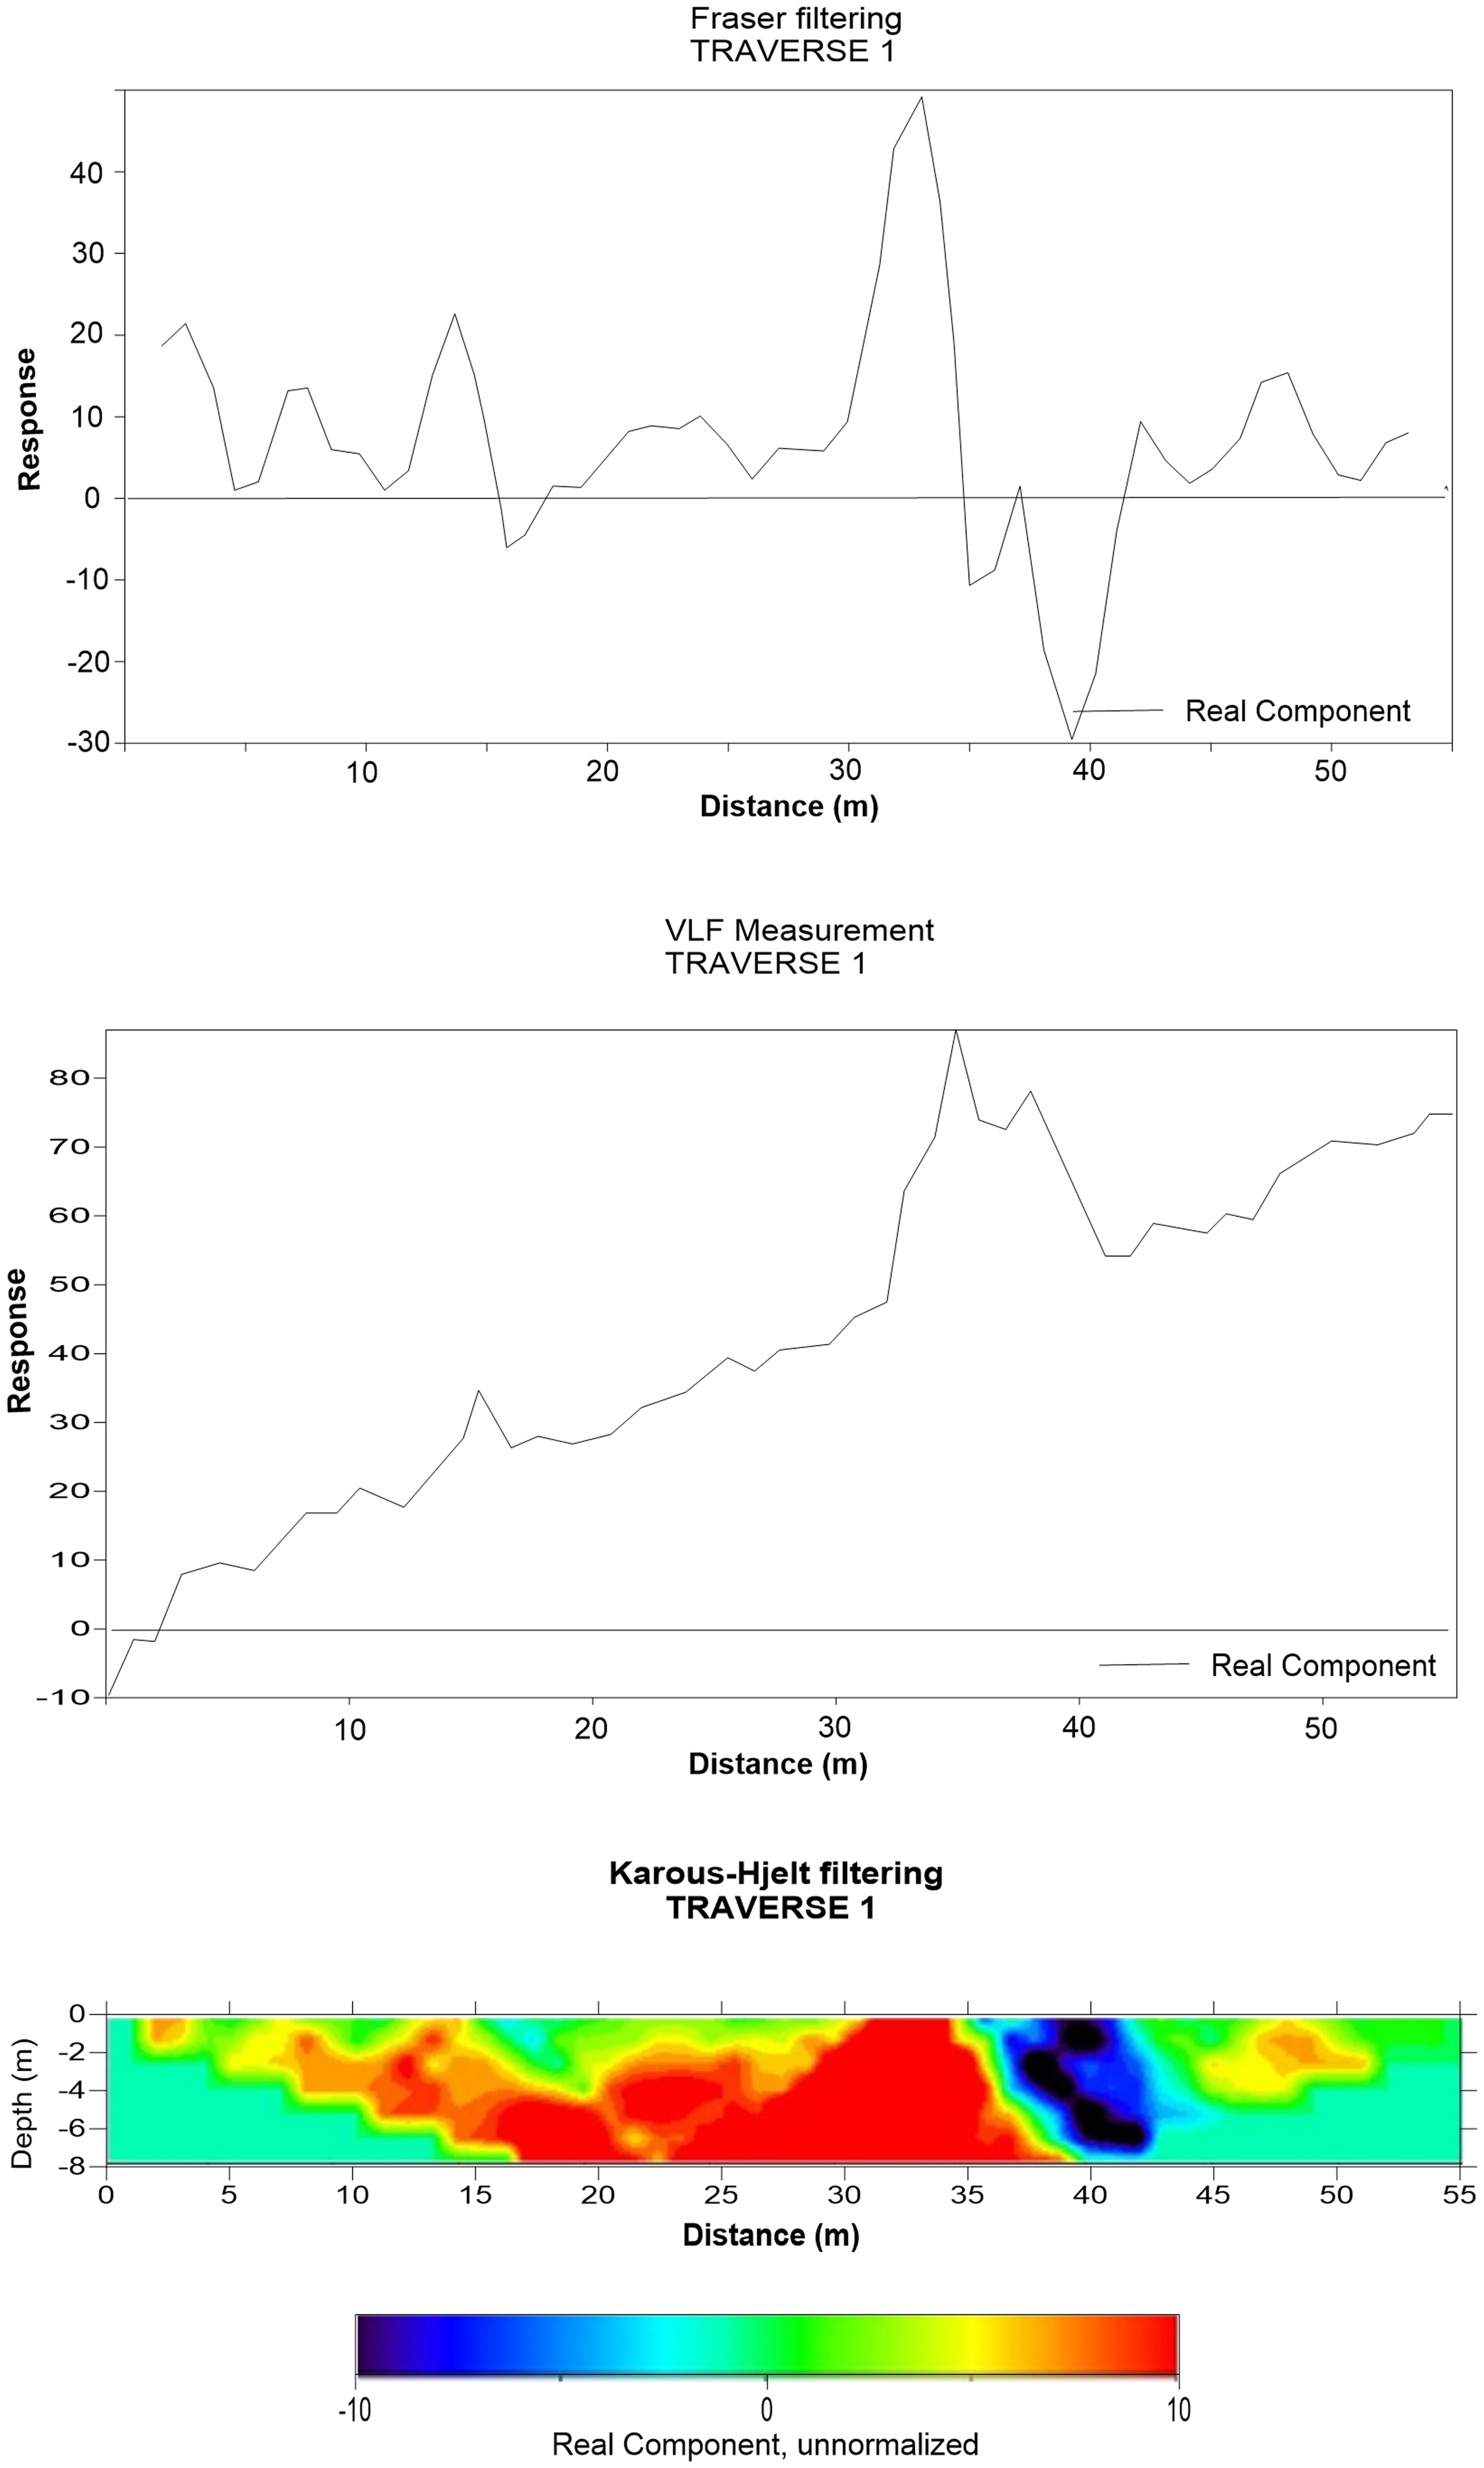
Very low frequency electromagnetic (VLF-EM) profile along traverse 1.
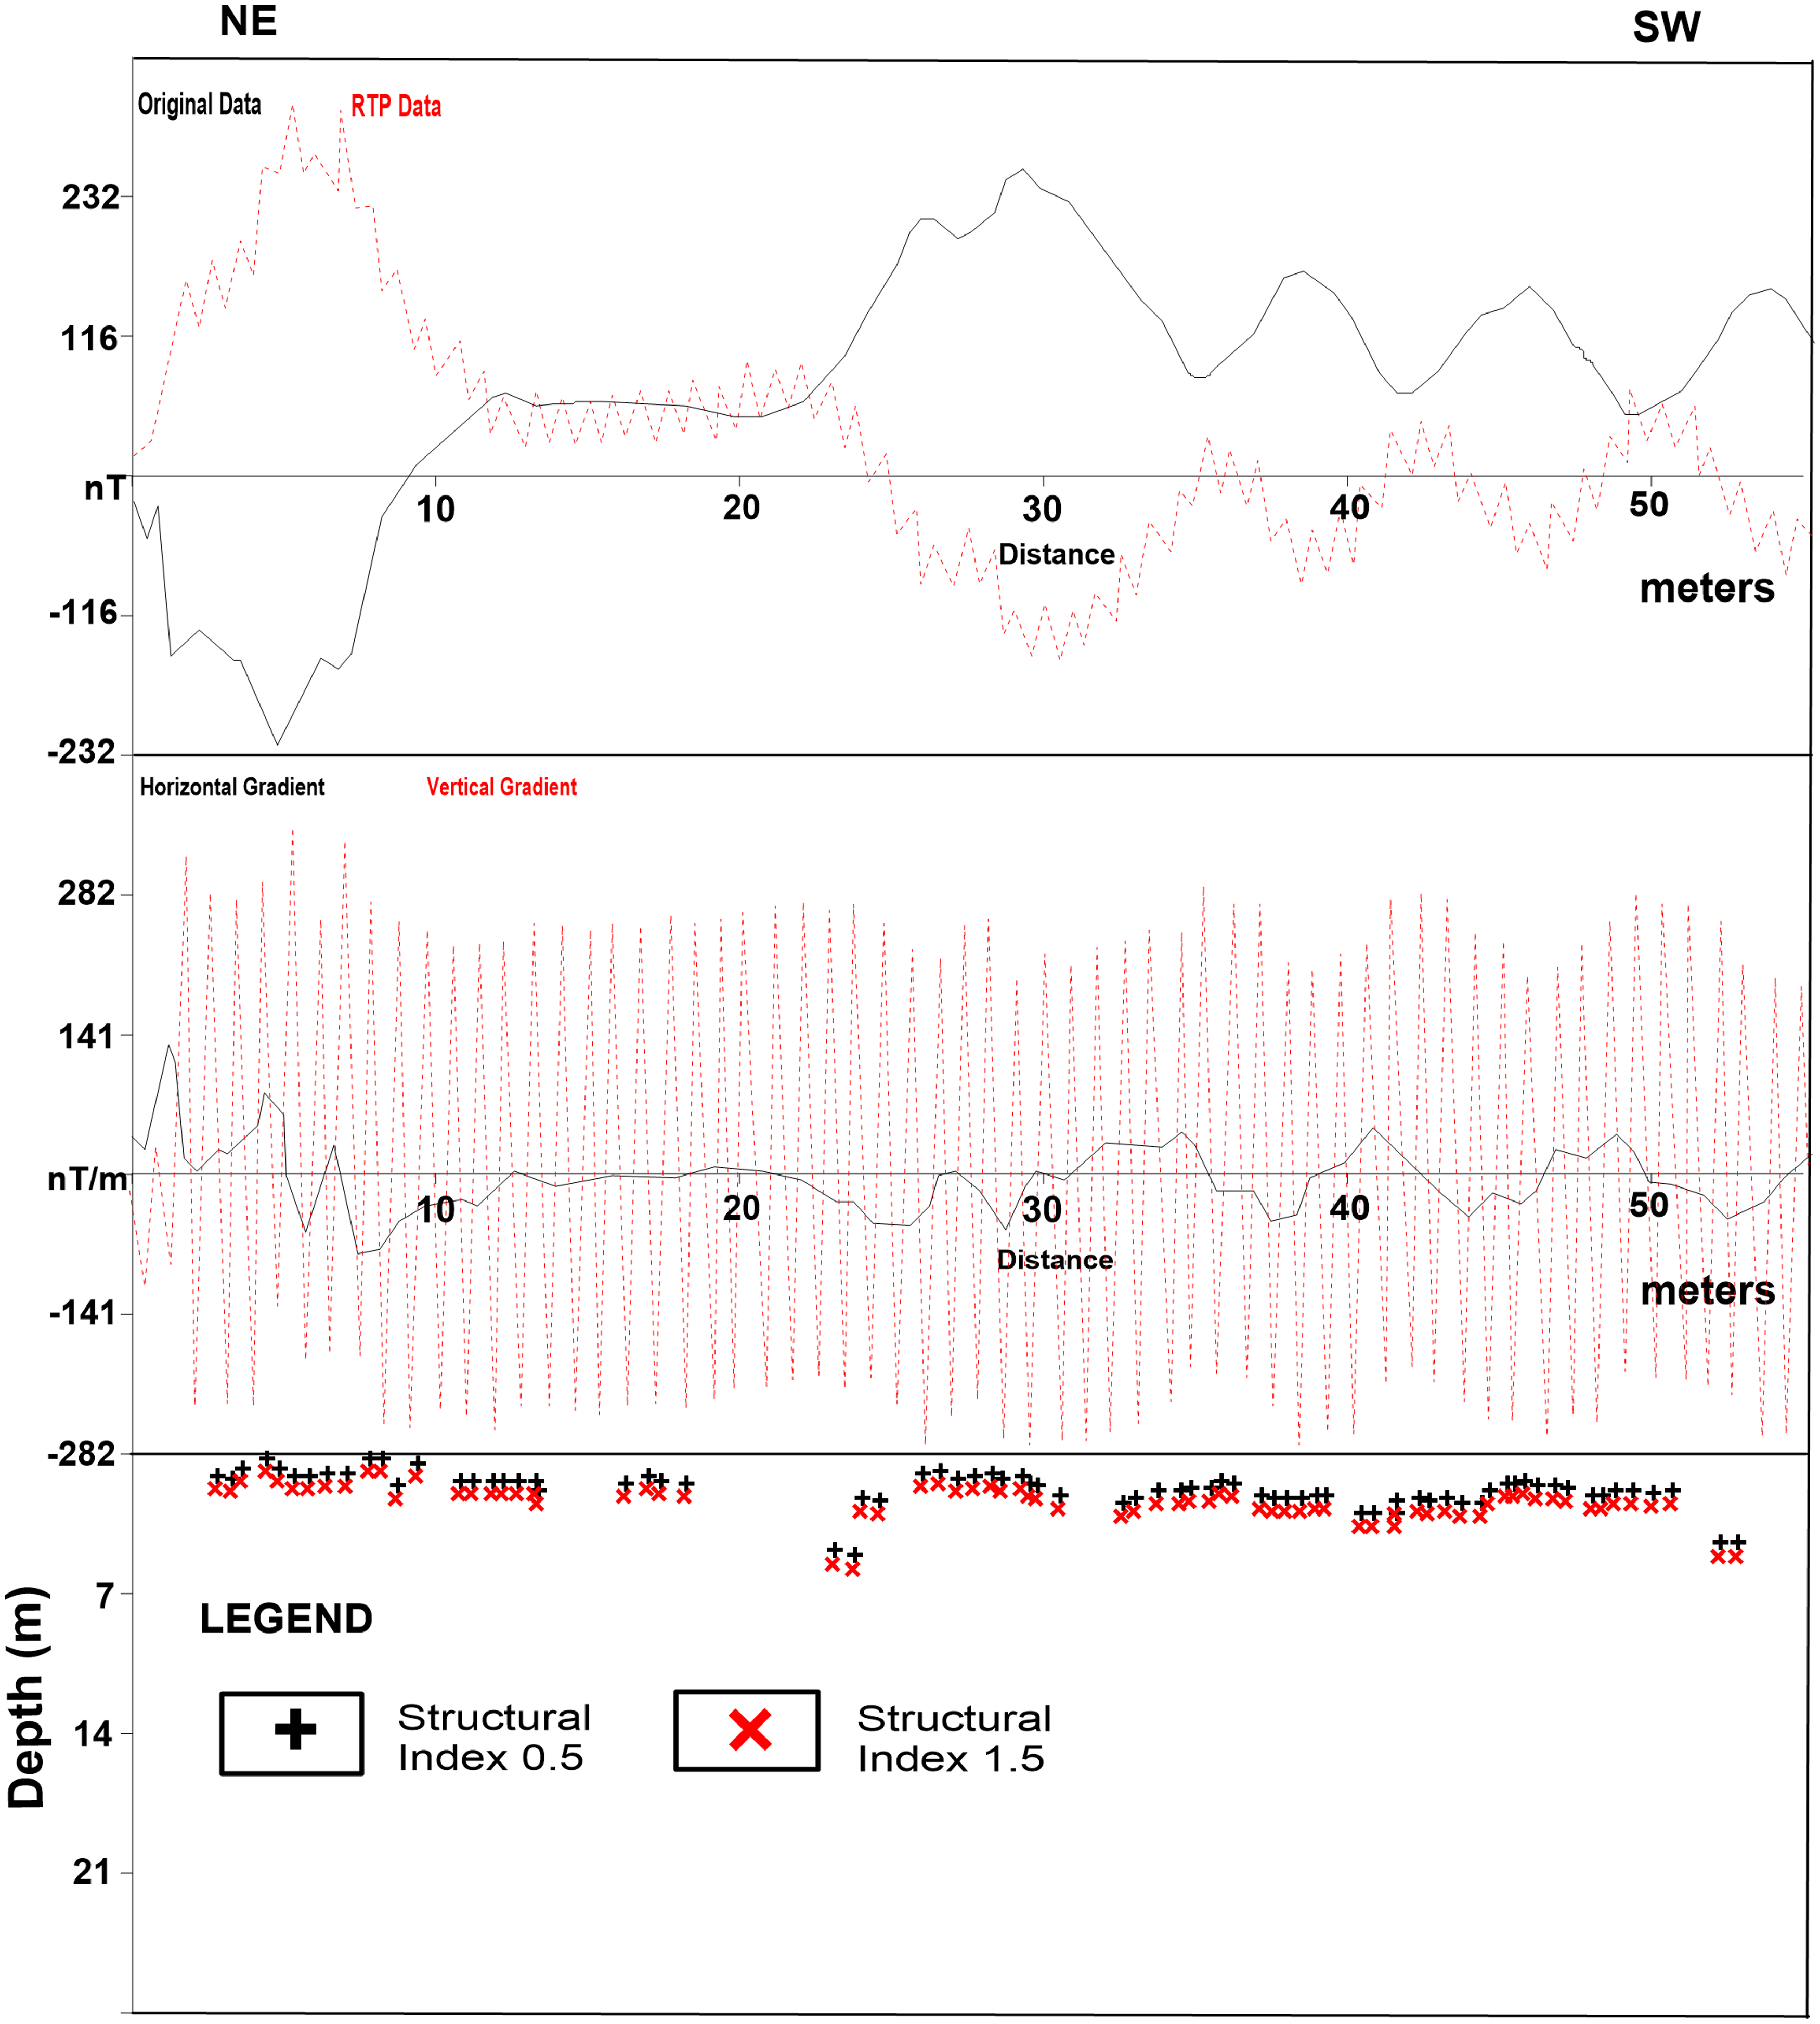
Magnetic profile along traverse 1.
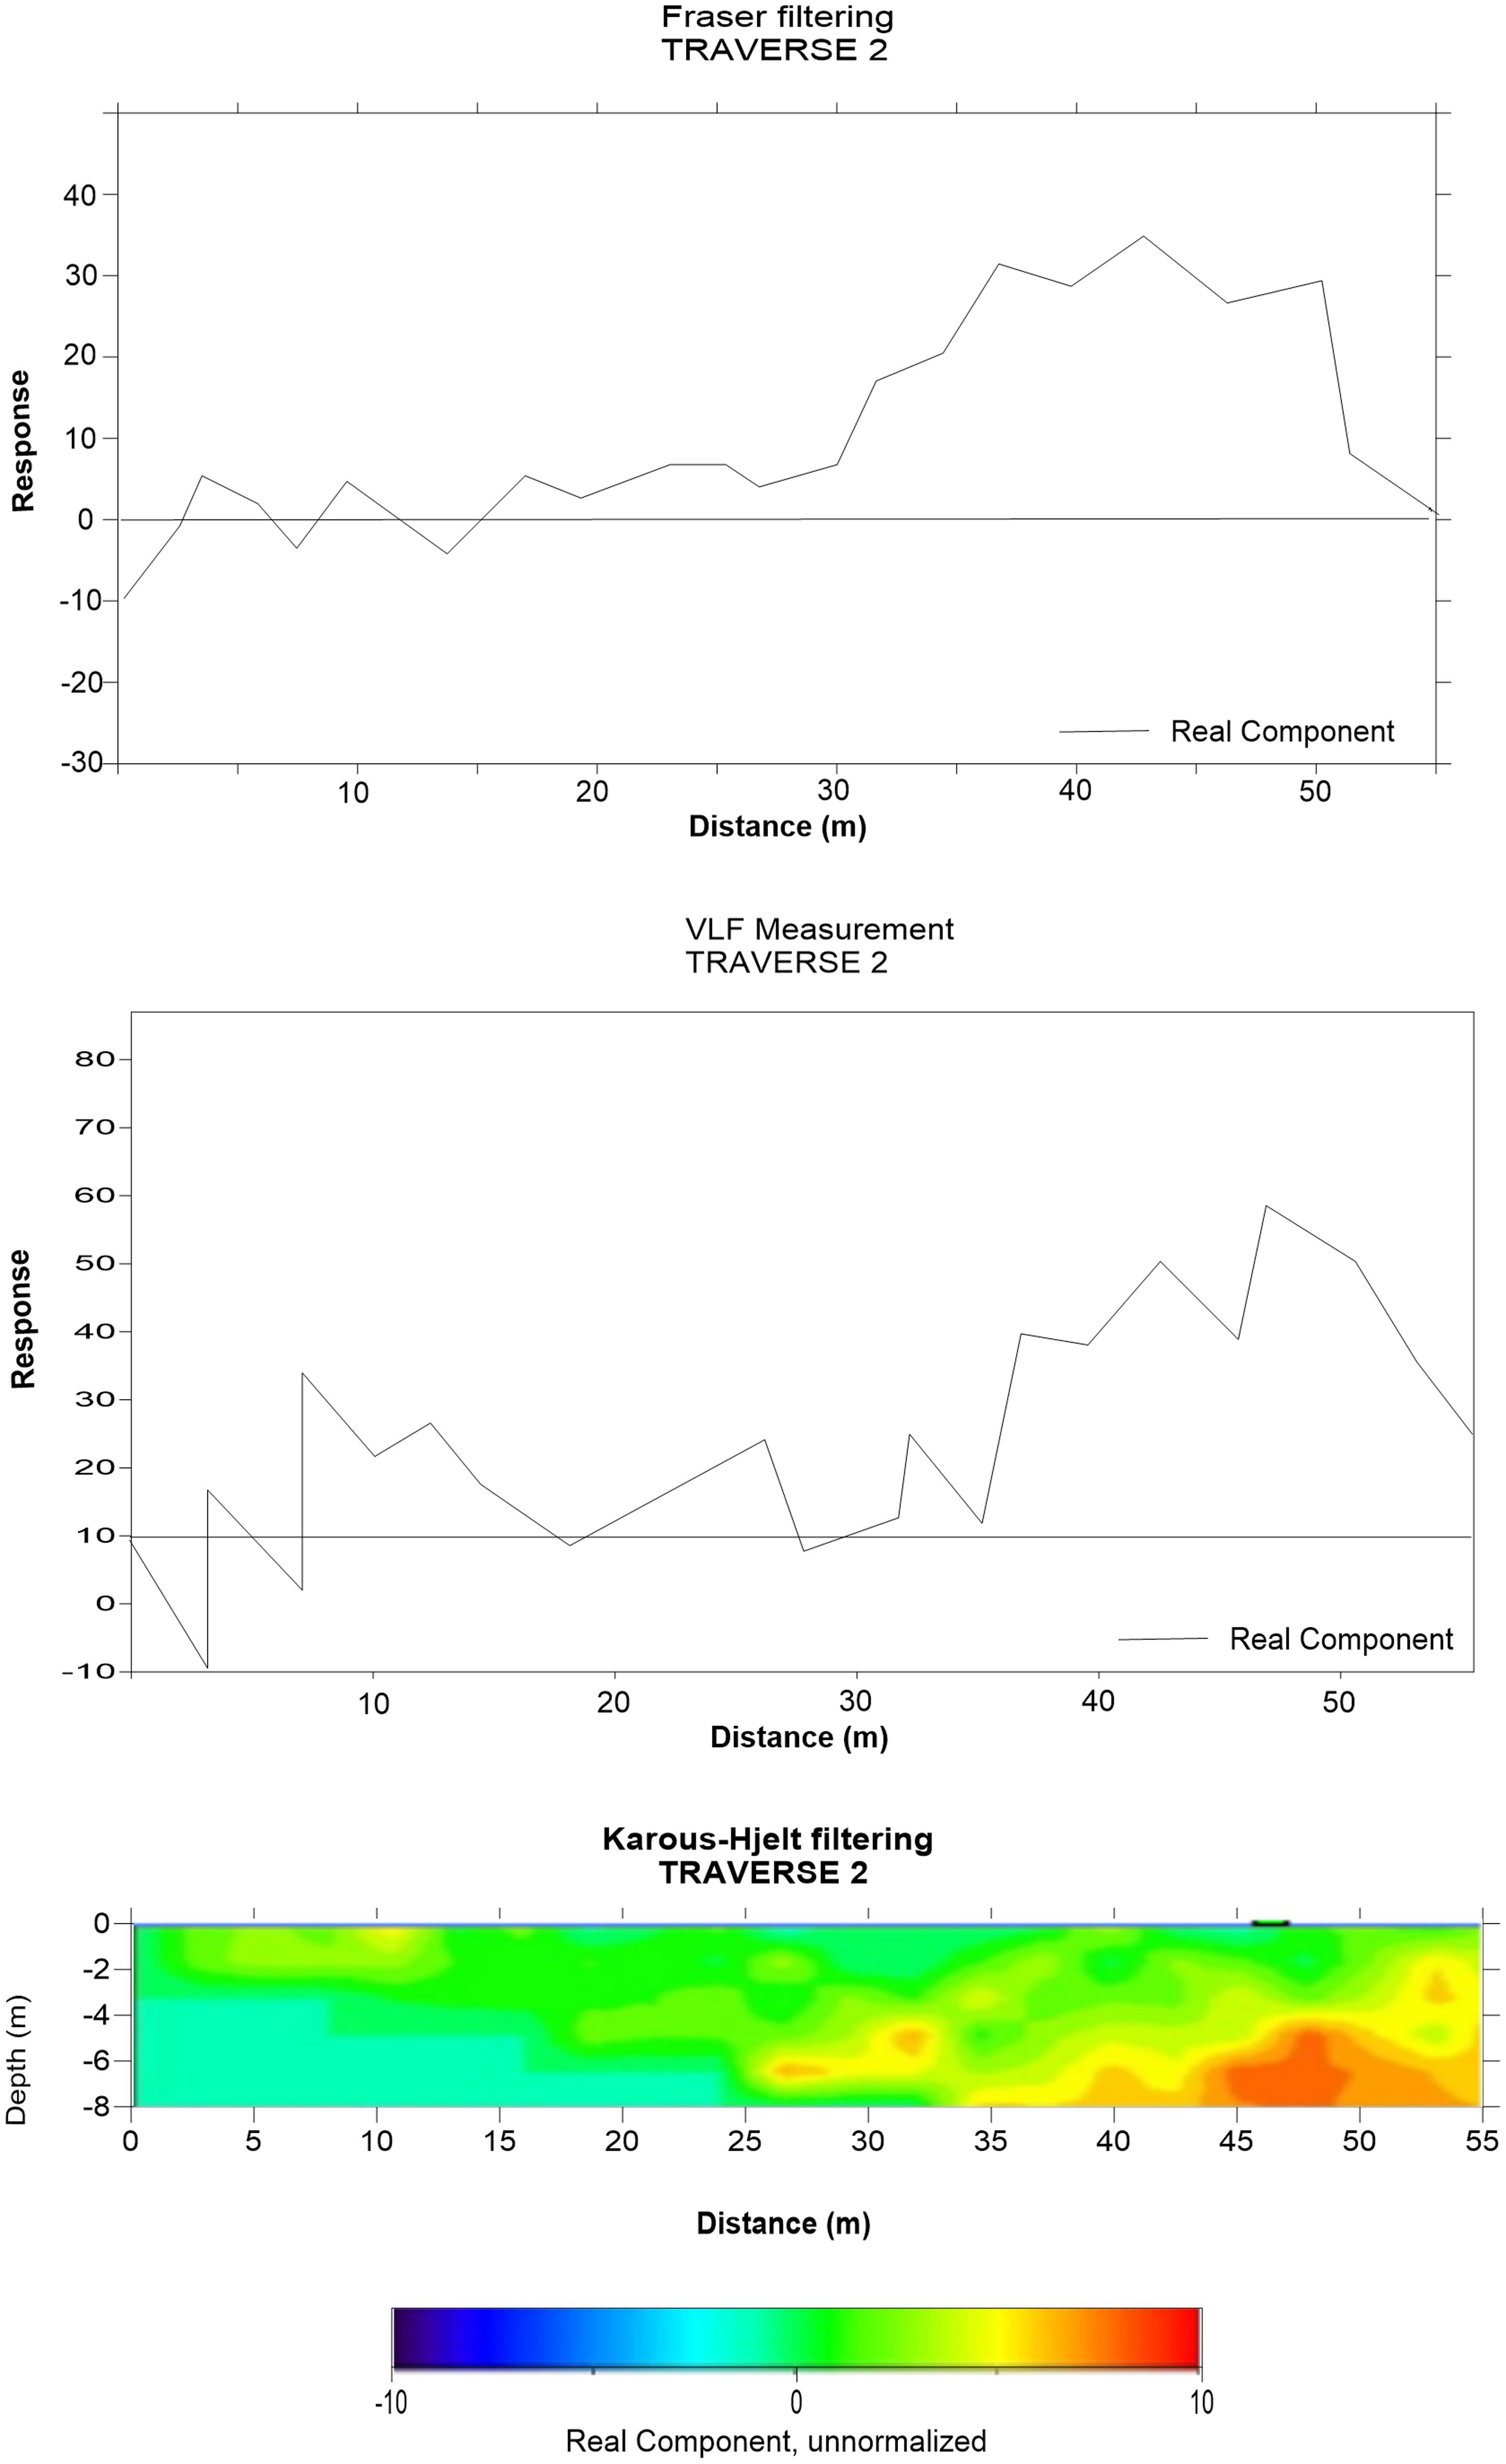
Very low frequency electromagnetic (VLF-EM) profile along traverse 2.
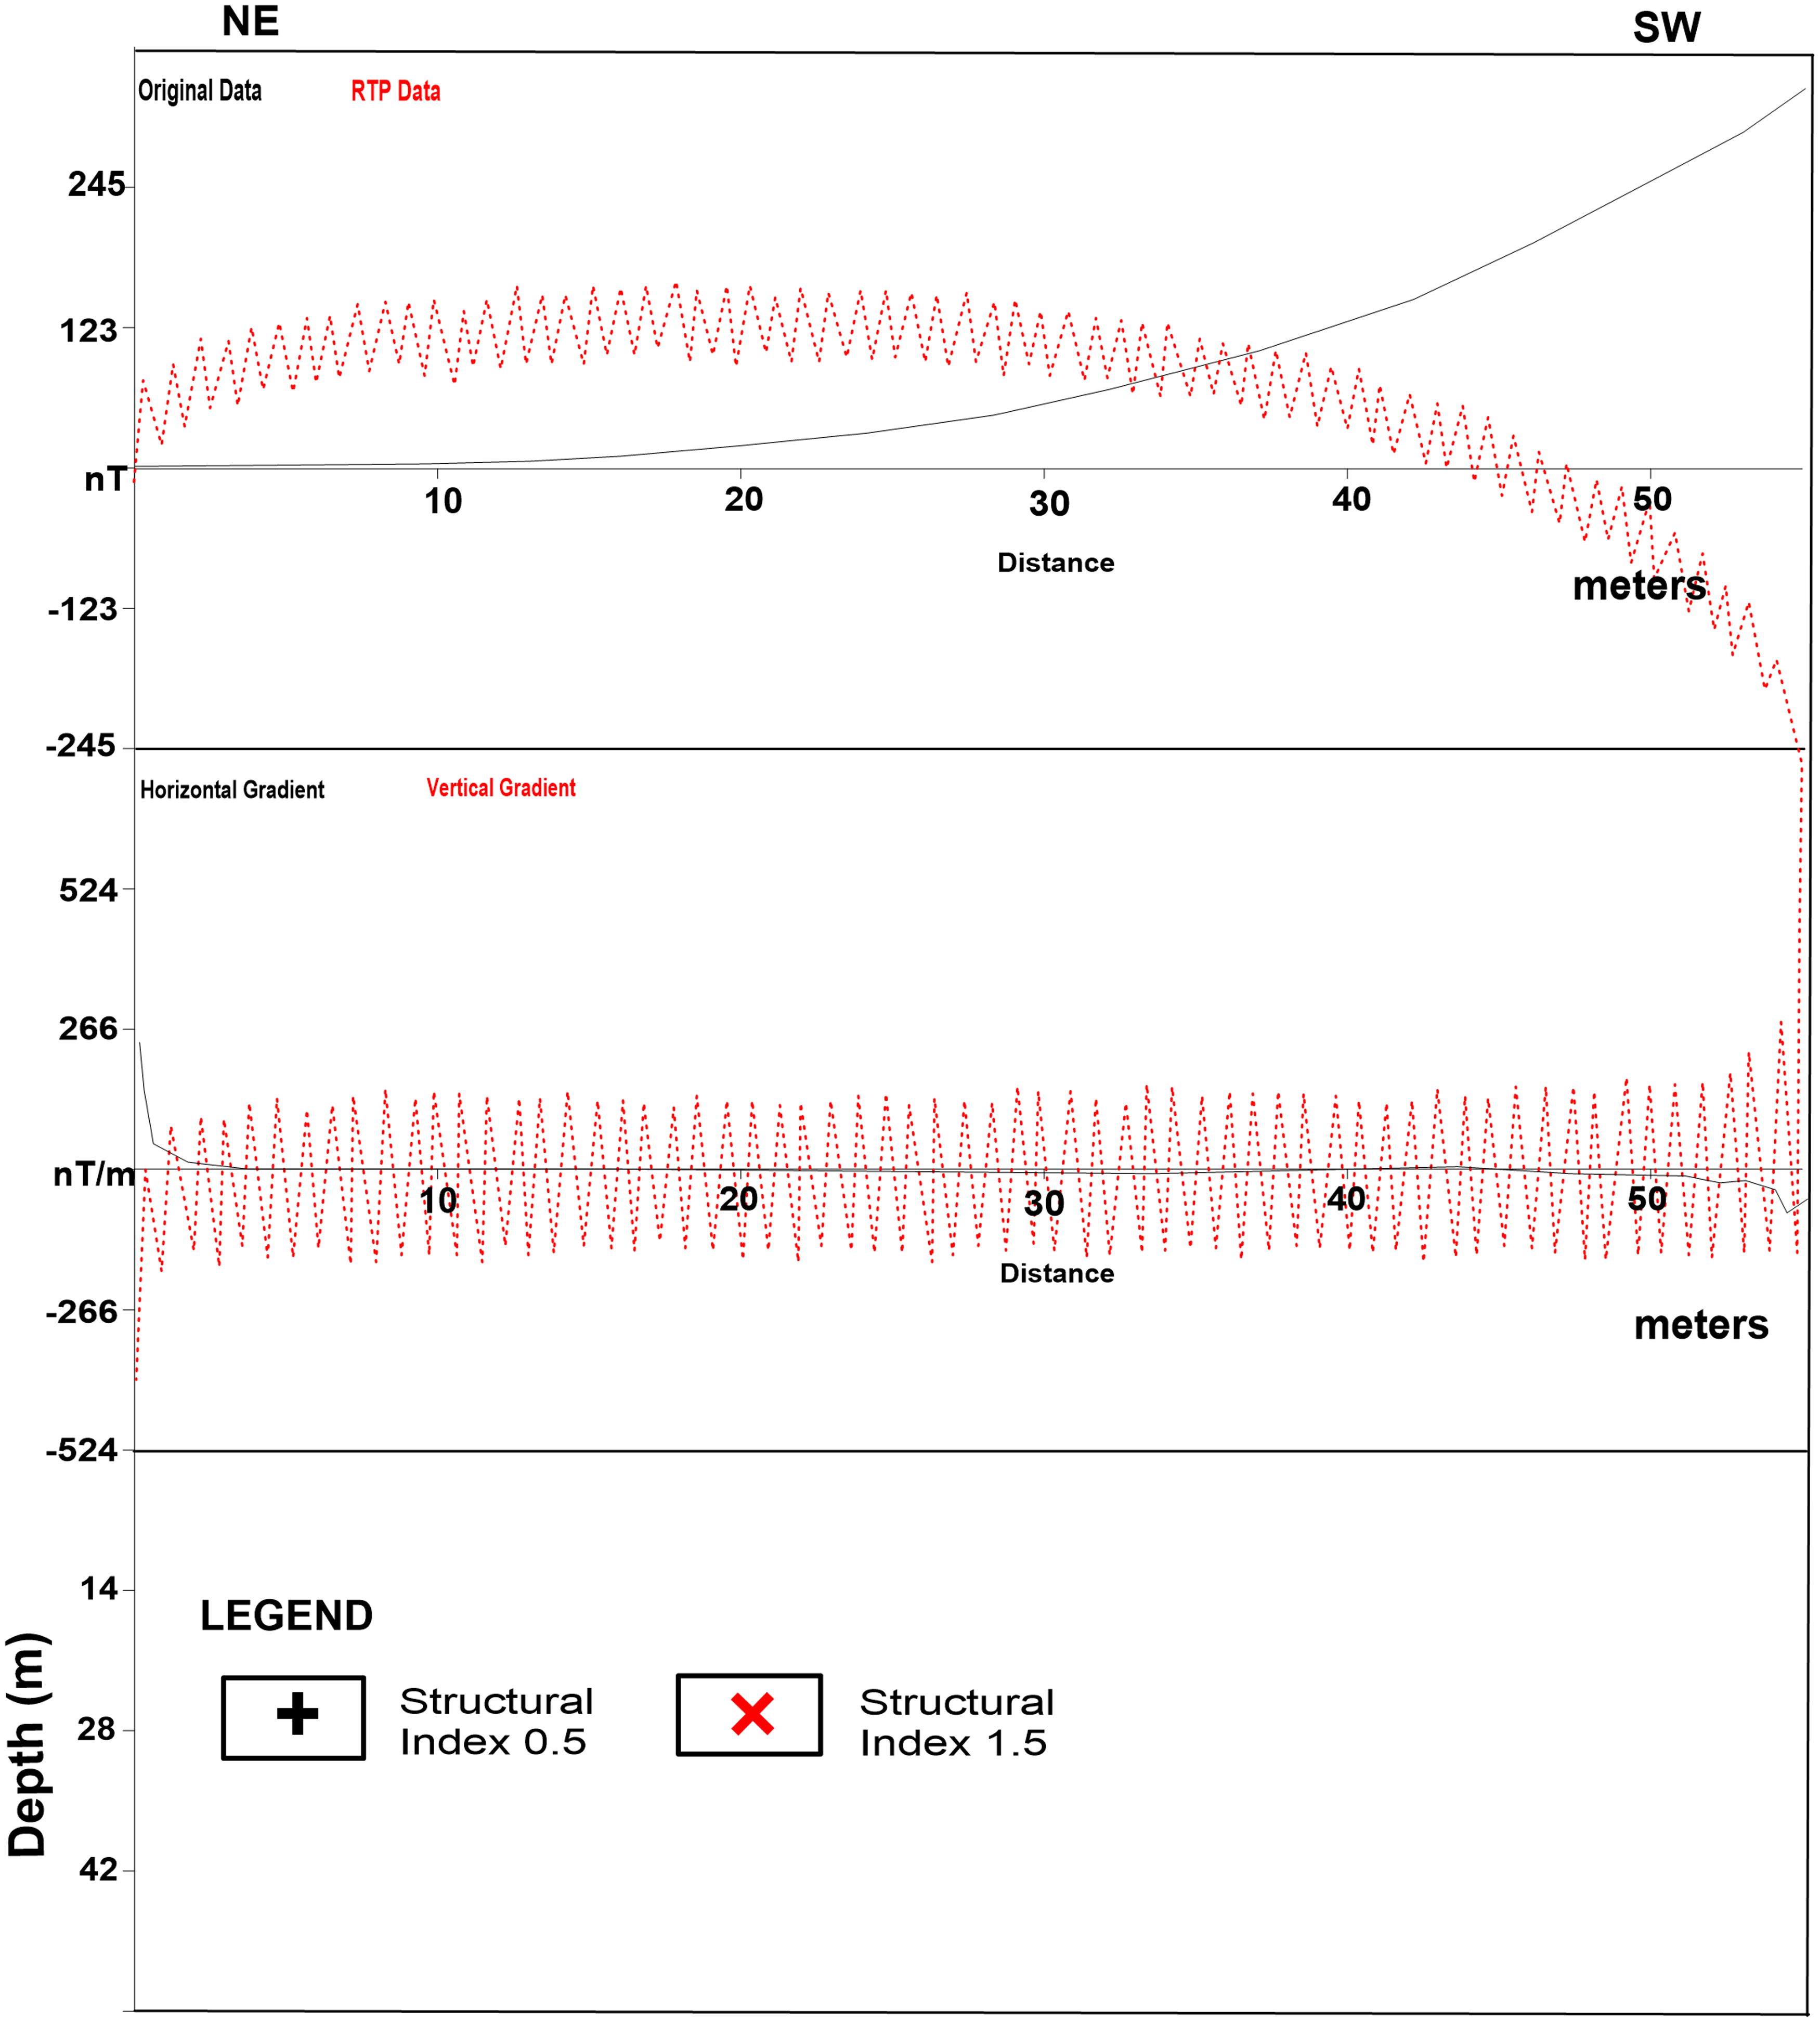
Magnetic profile along traverse 2.
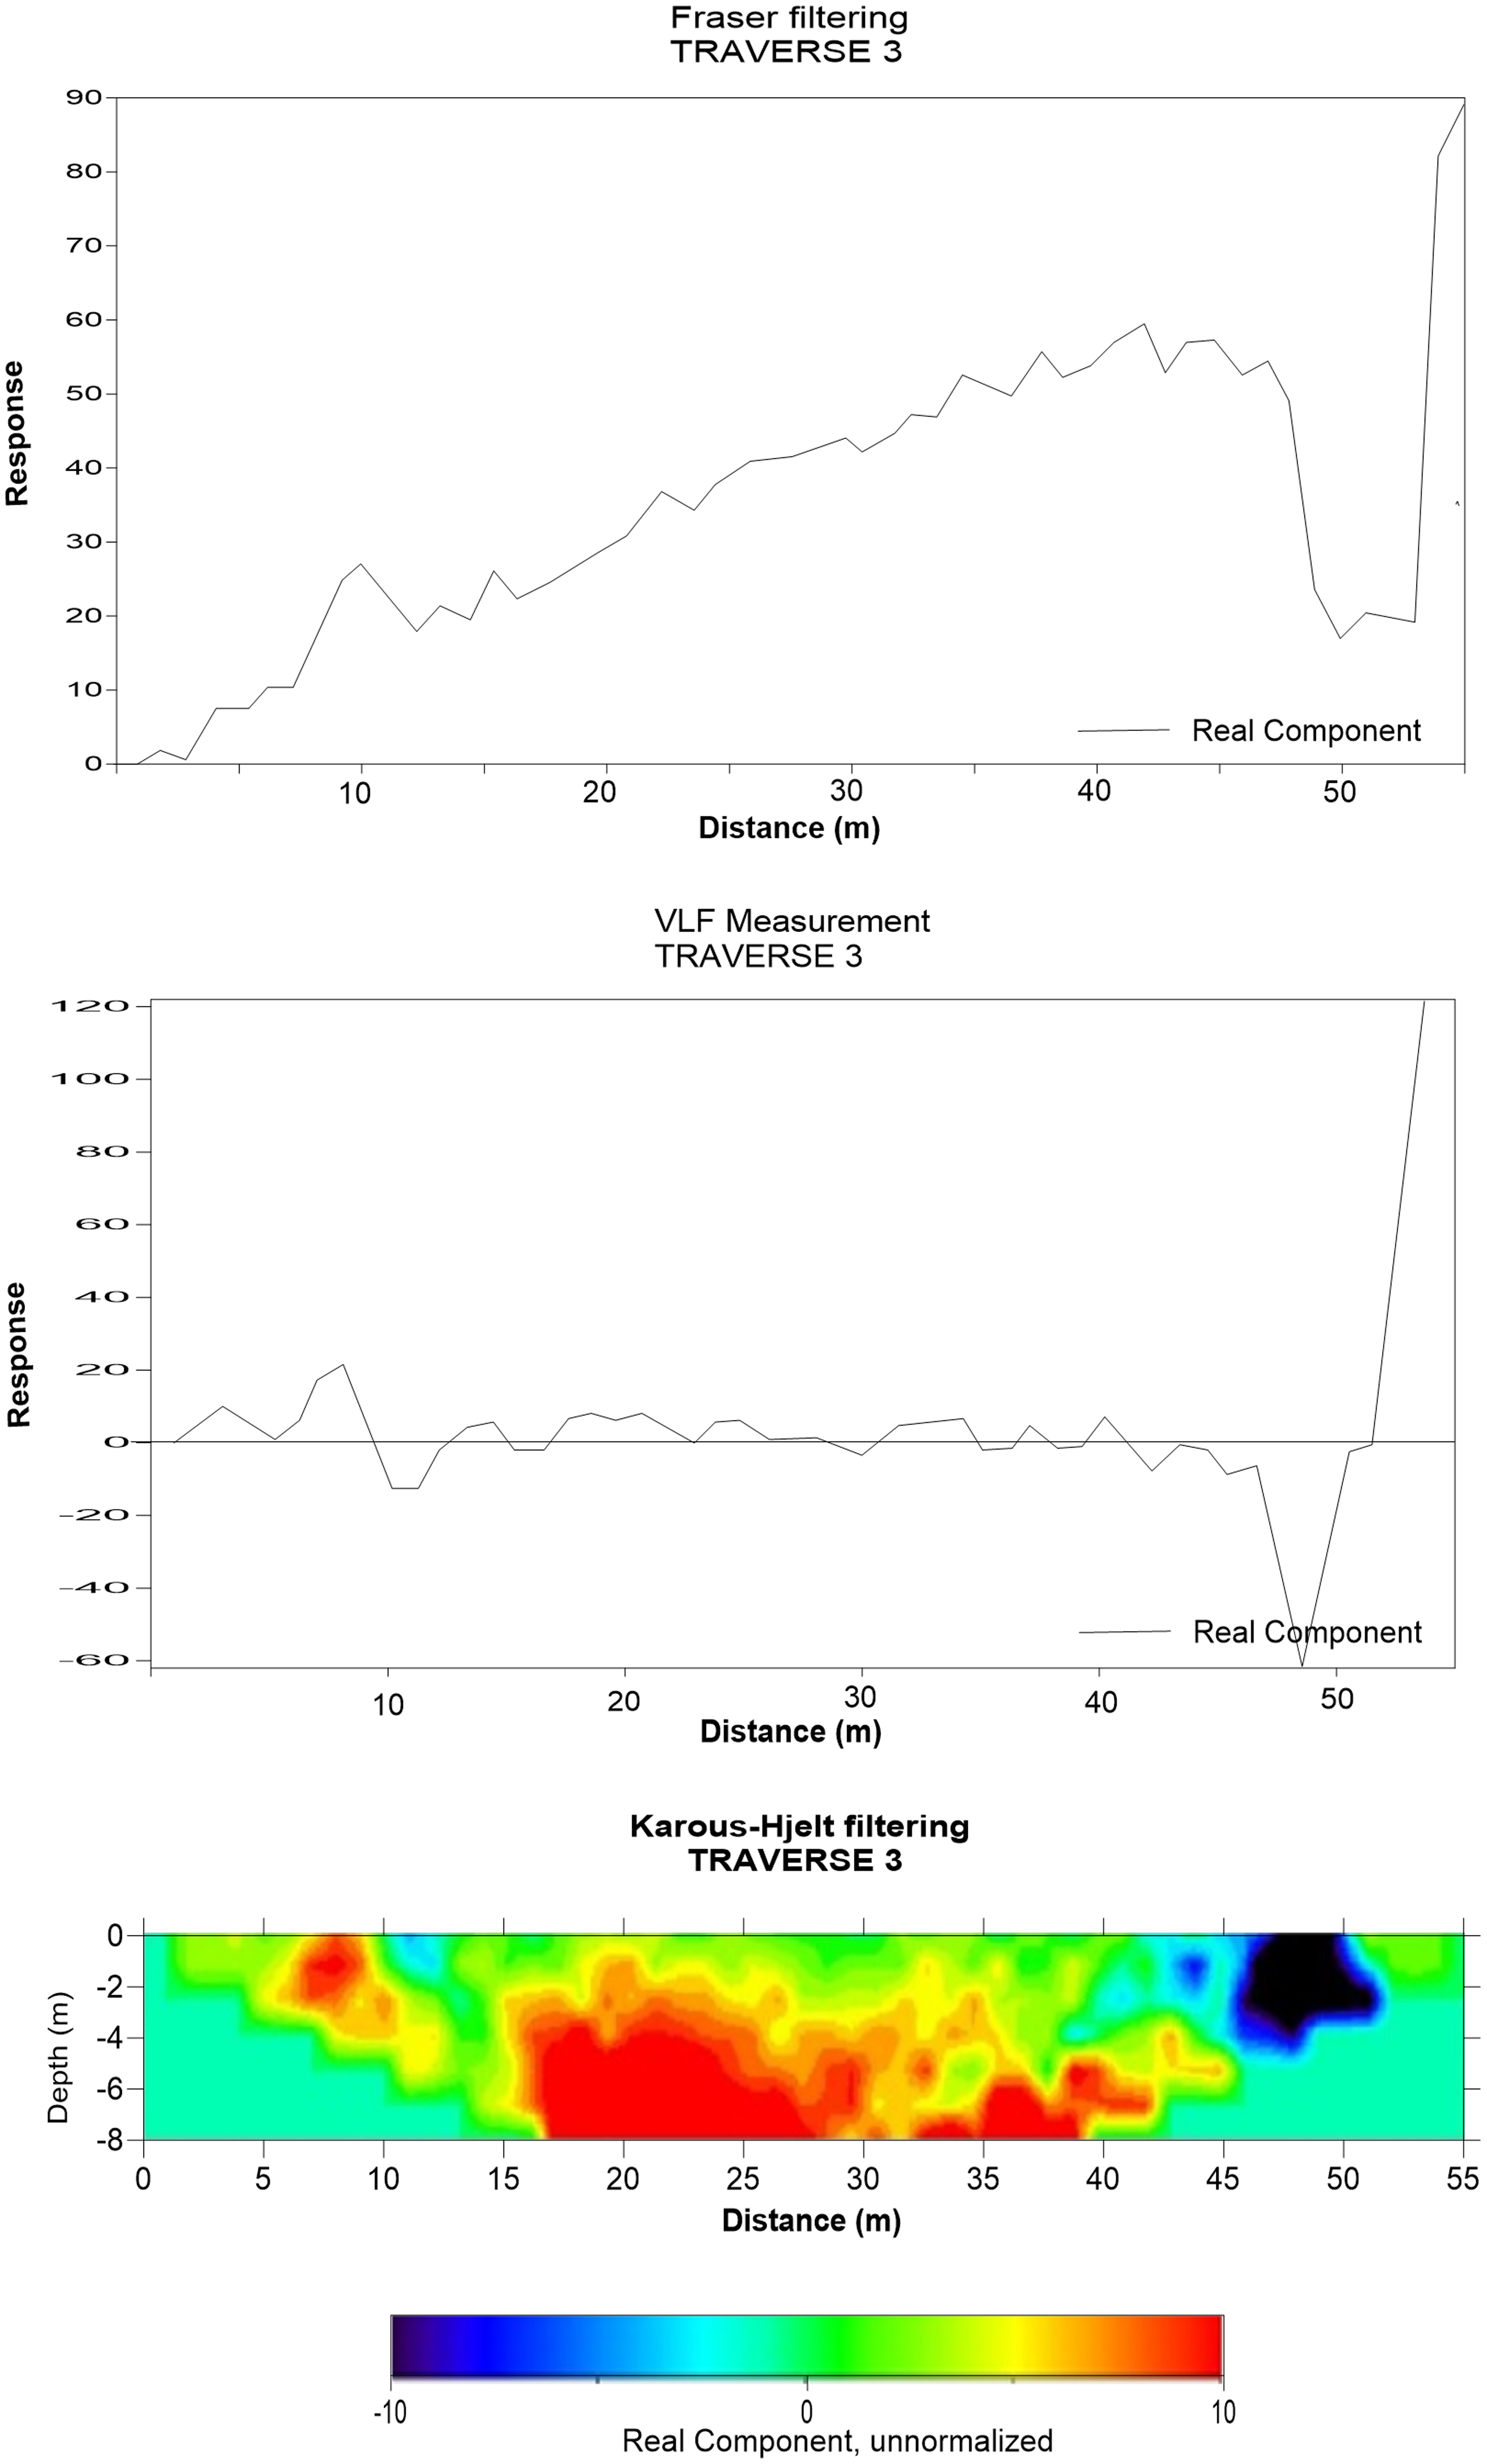
Very low frequency electromagnetic (VLF-EM) profile along traverse 3.
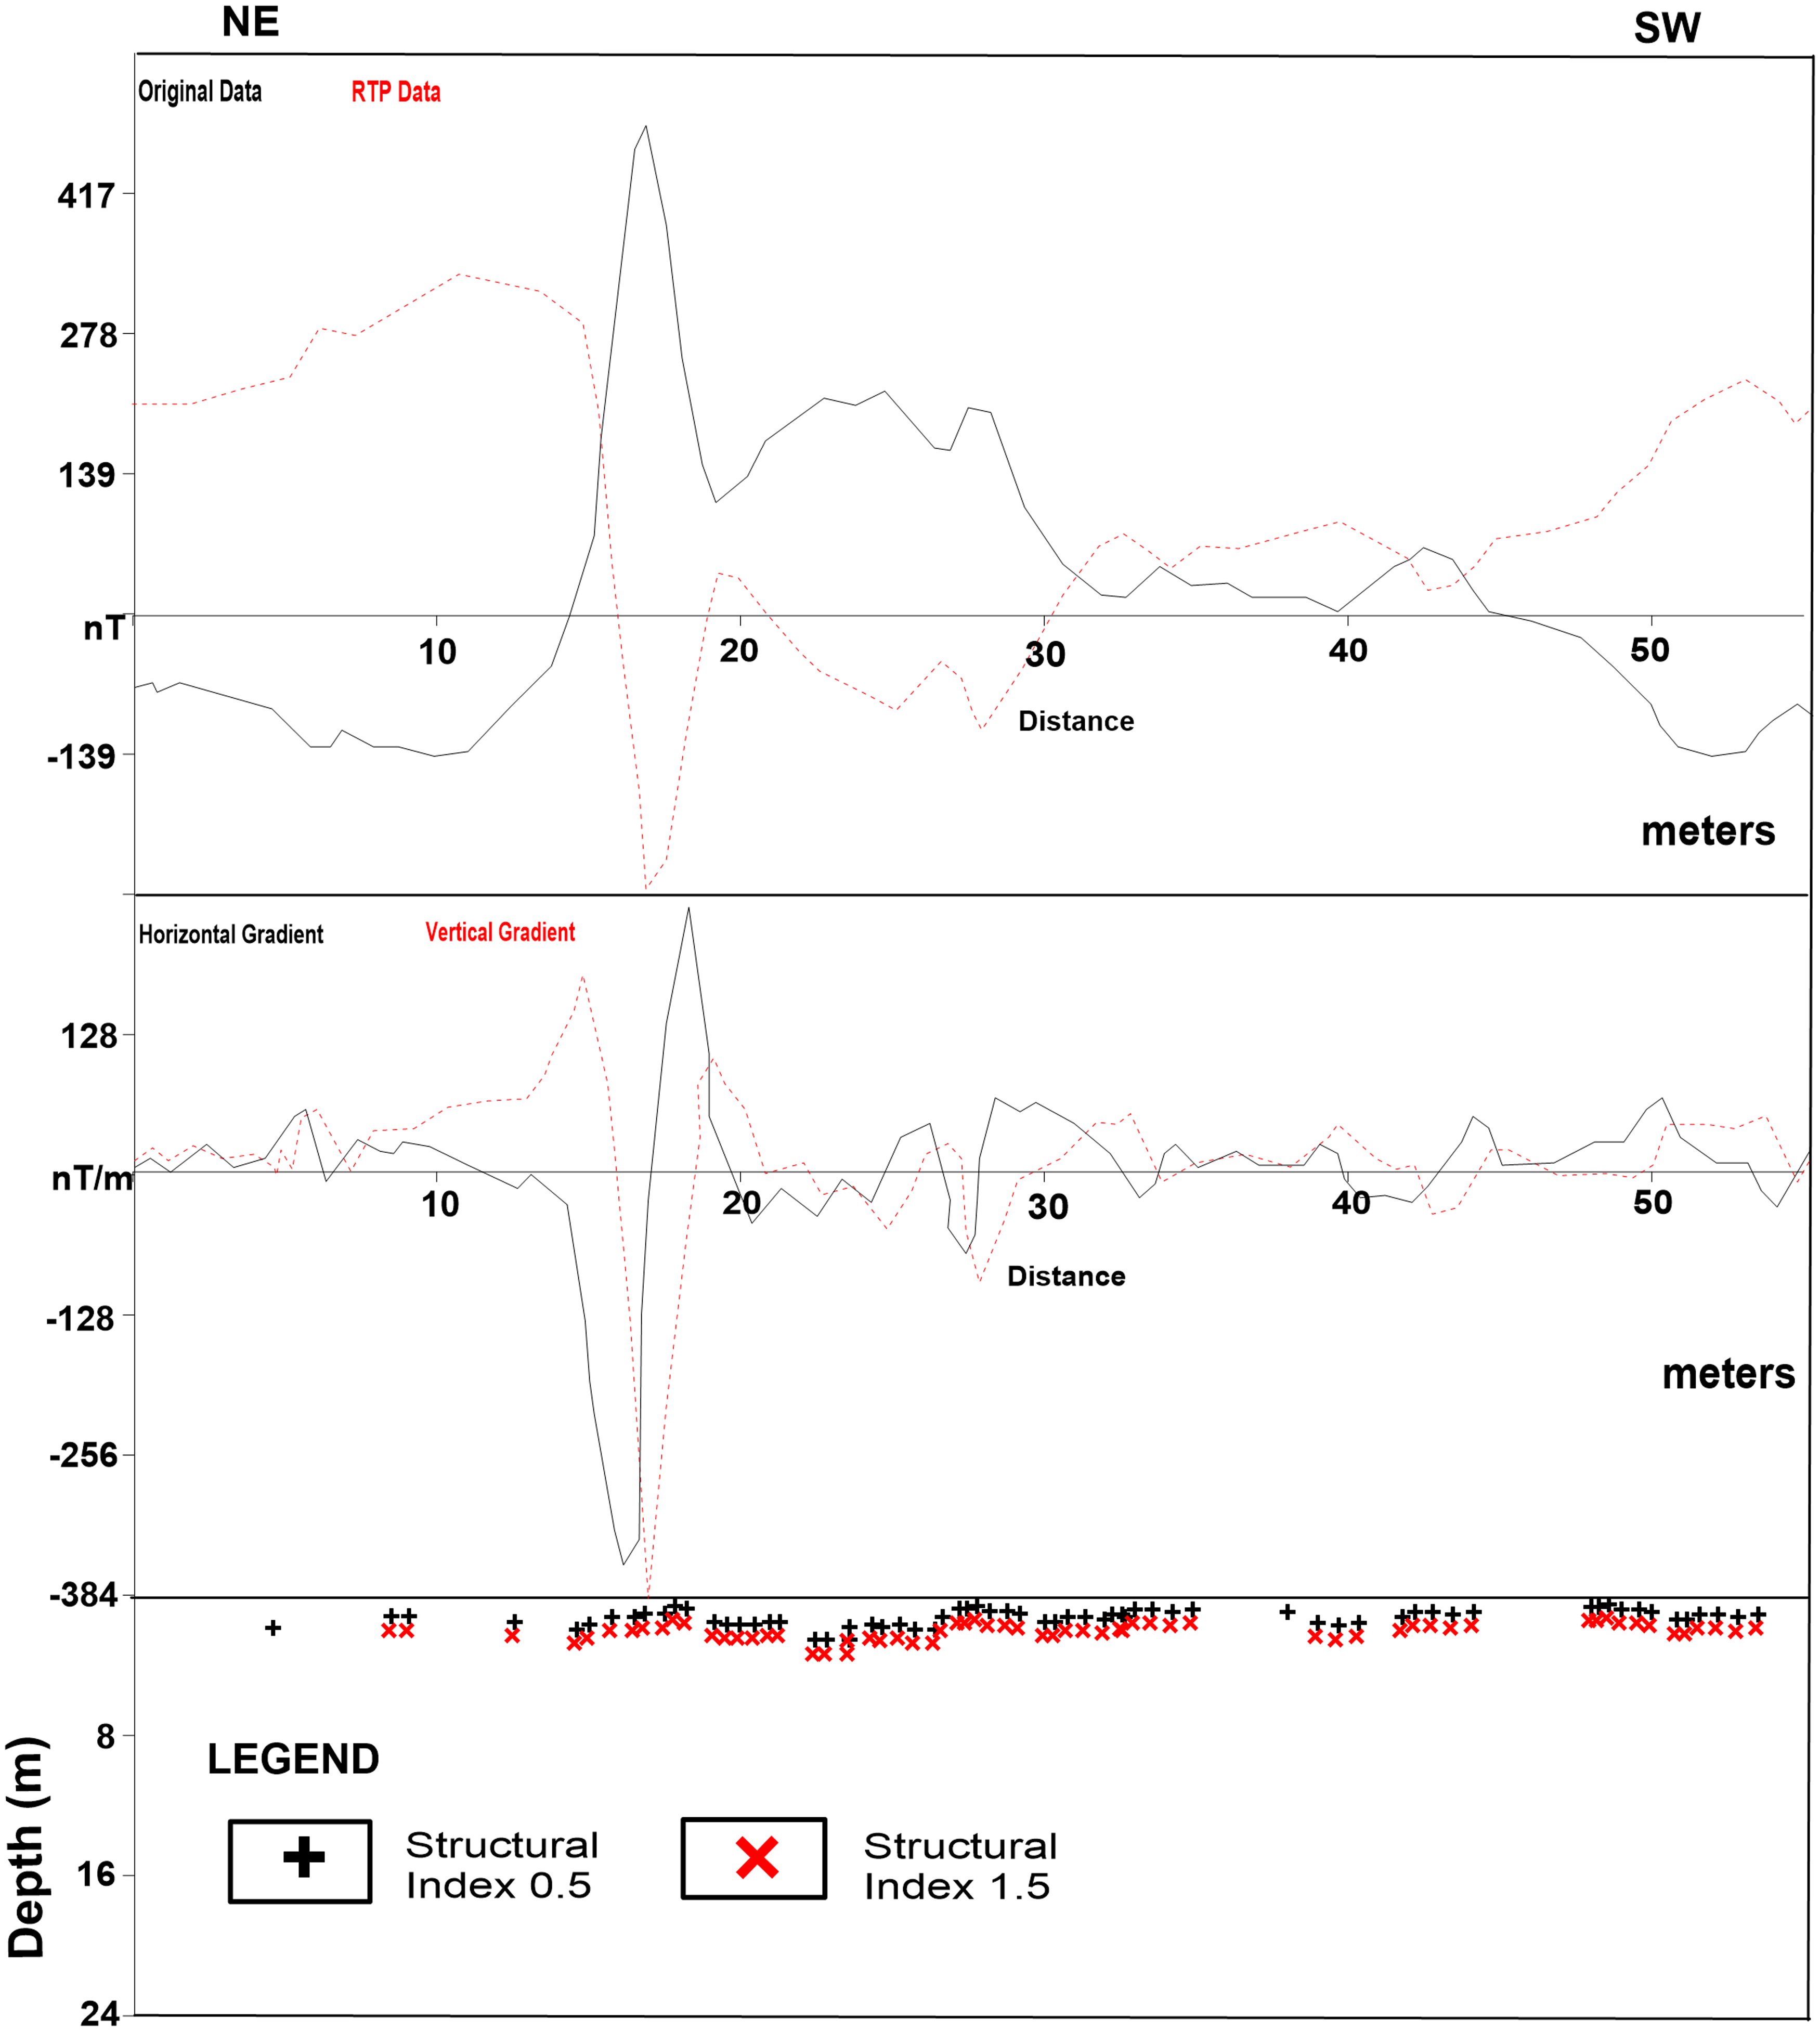
Magnetic profile along traverse 3.
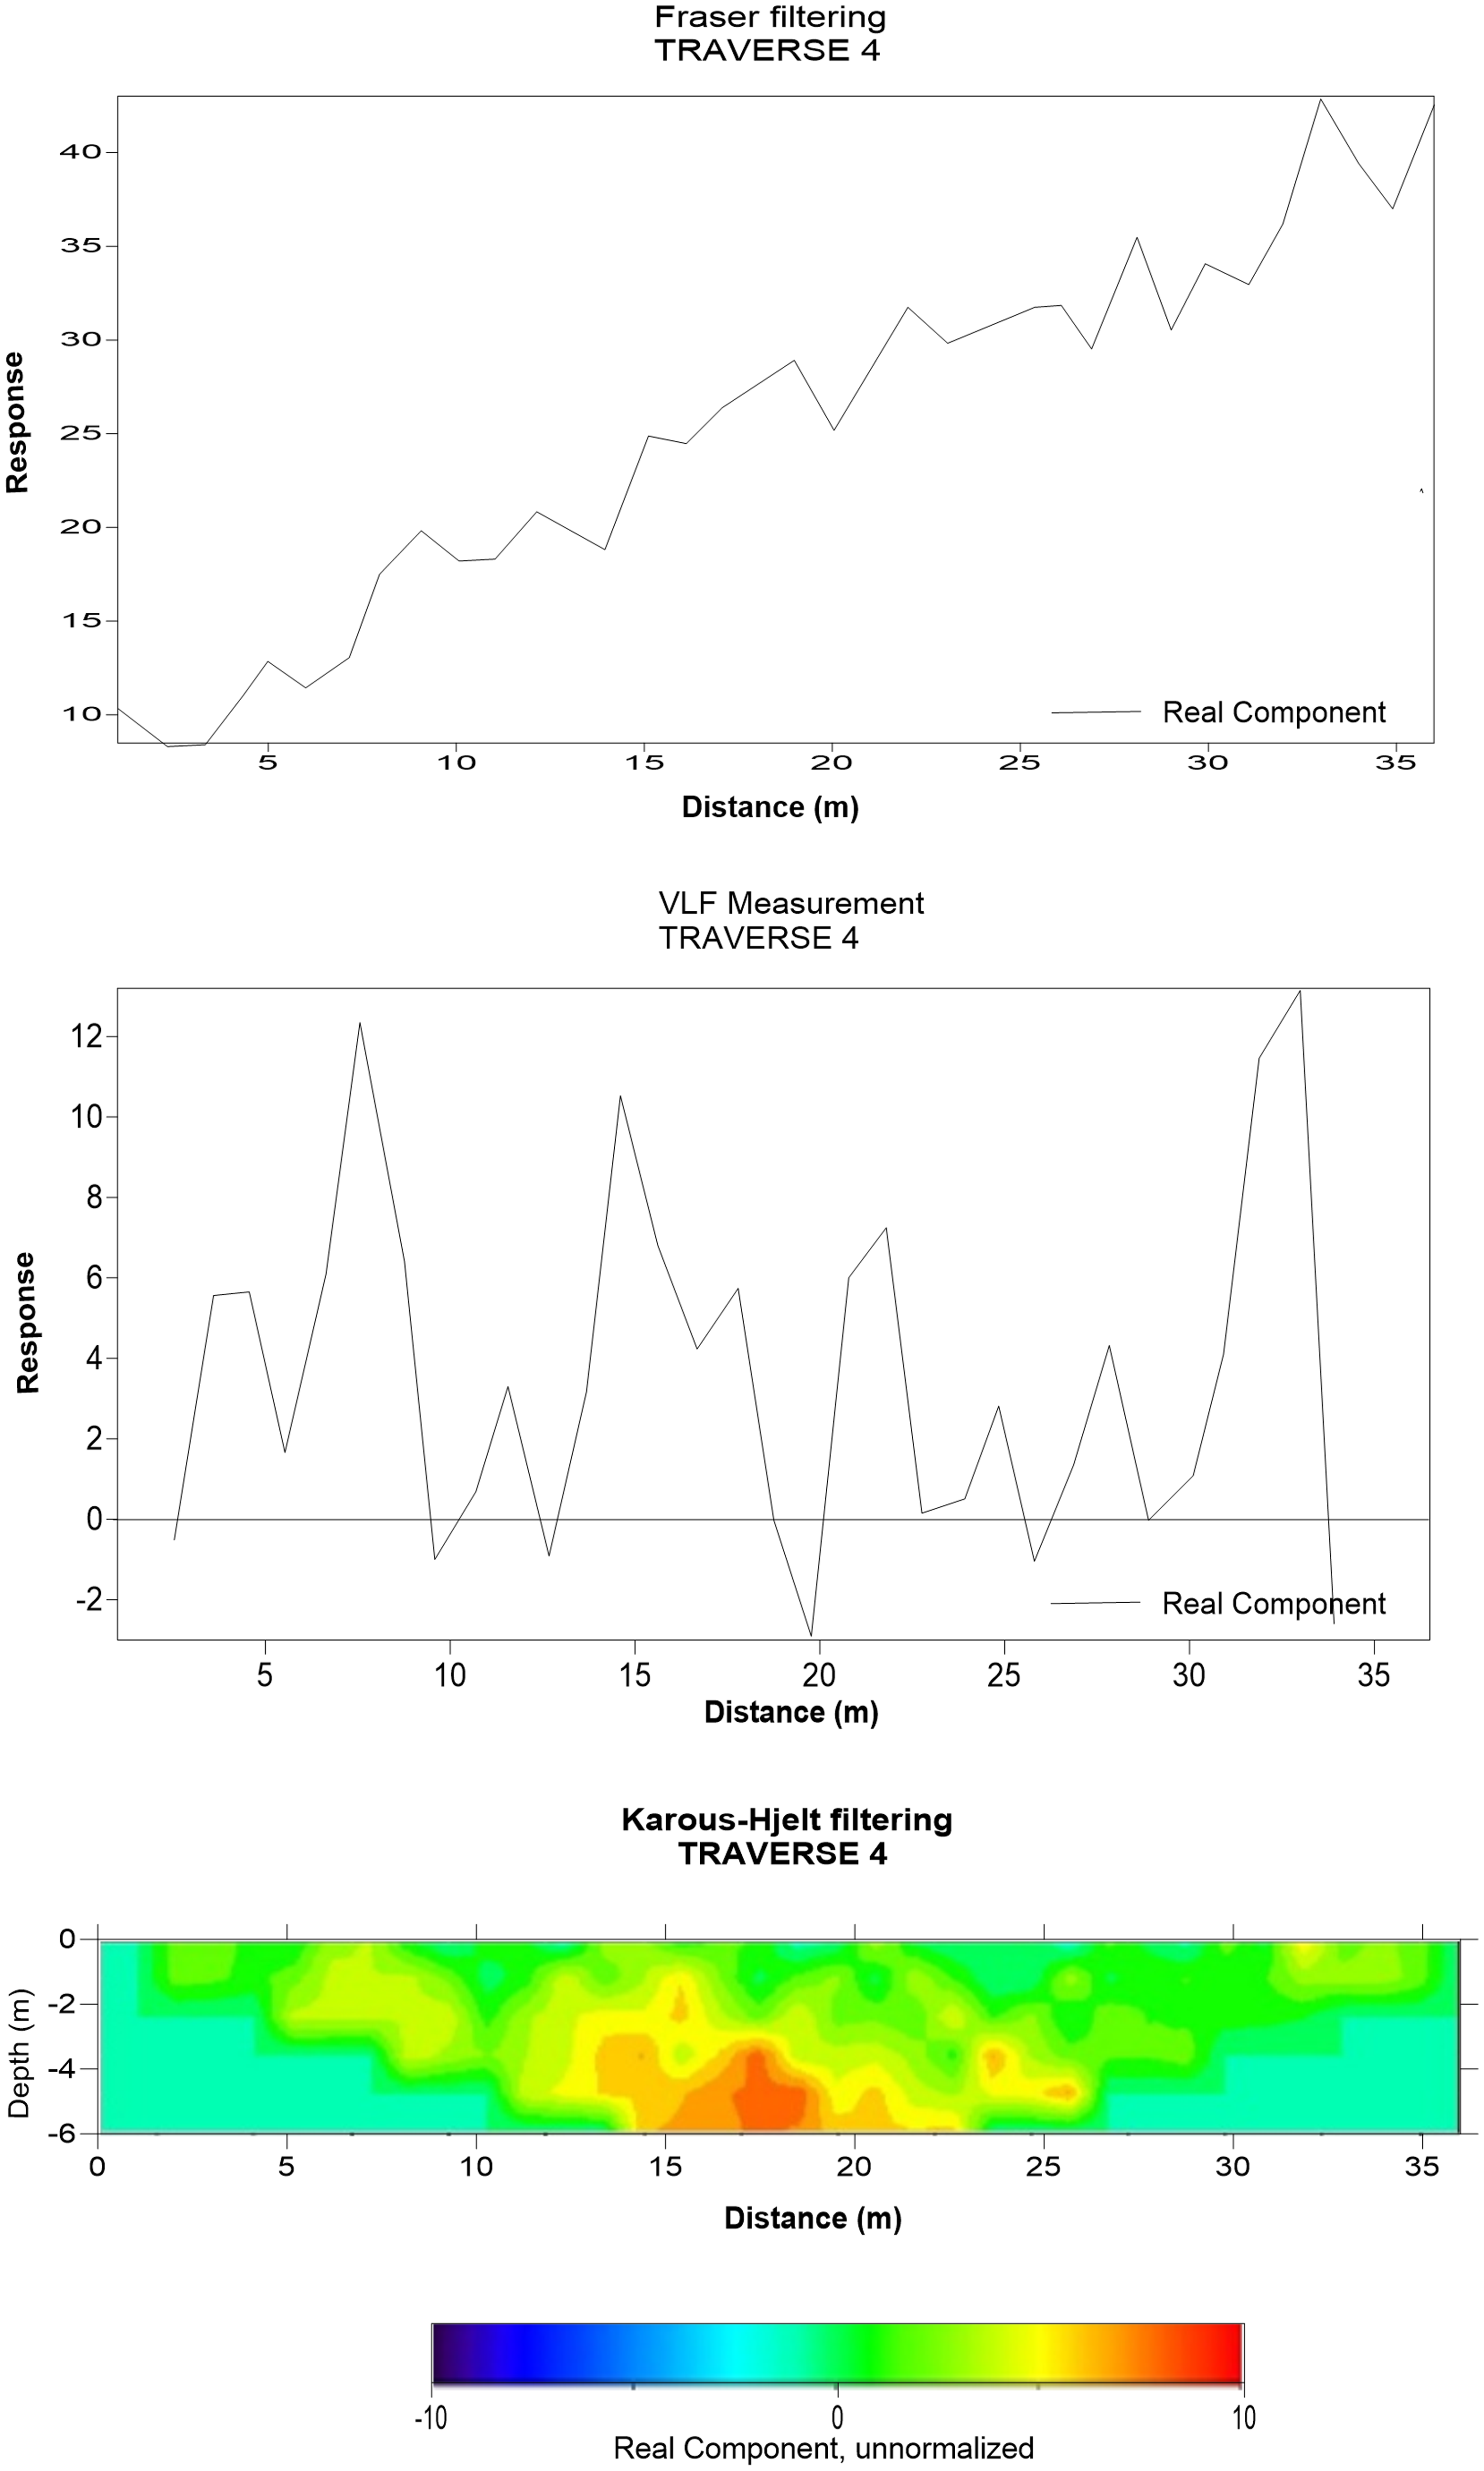
Very low frequency electromagnetic (VLF-EM) profile along traverse 4.
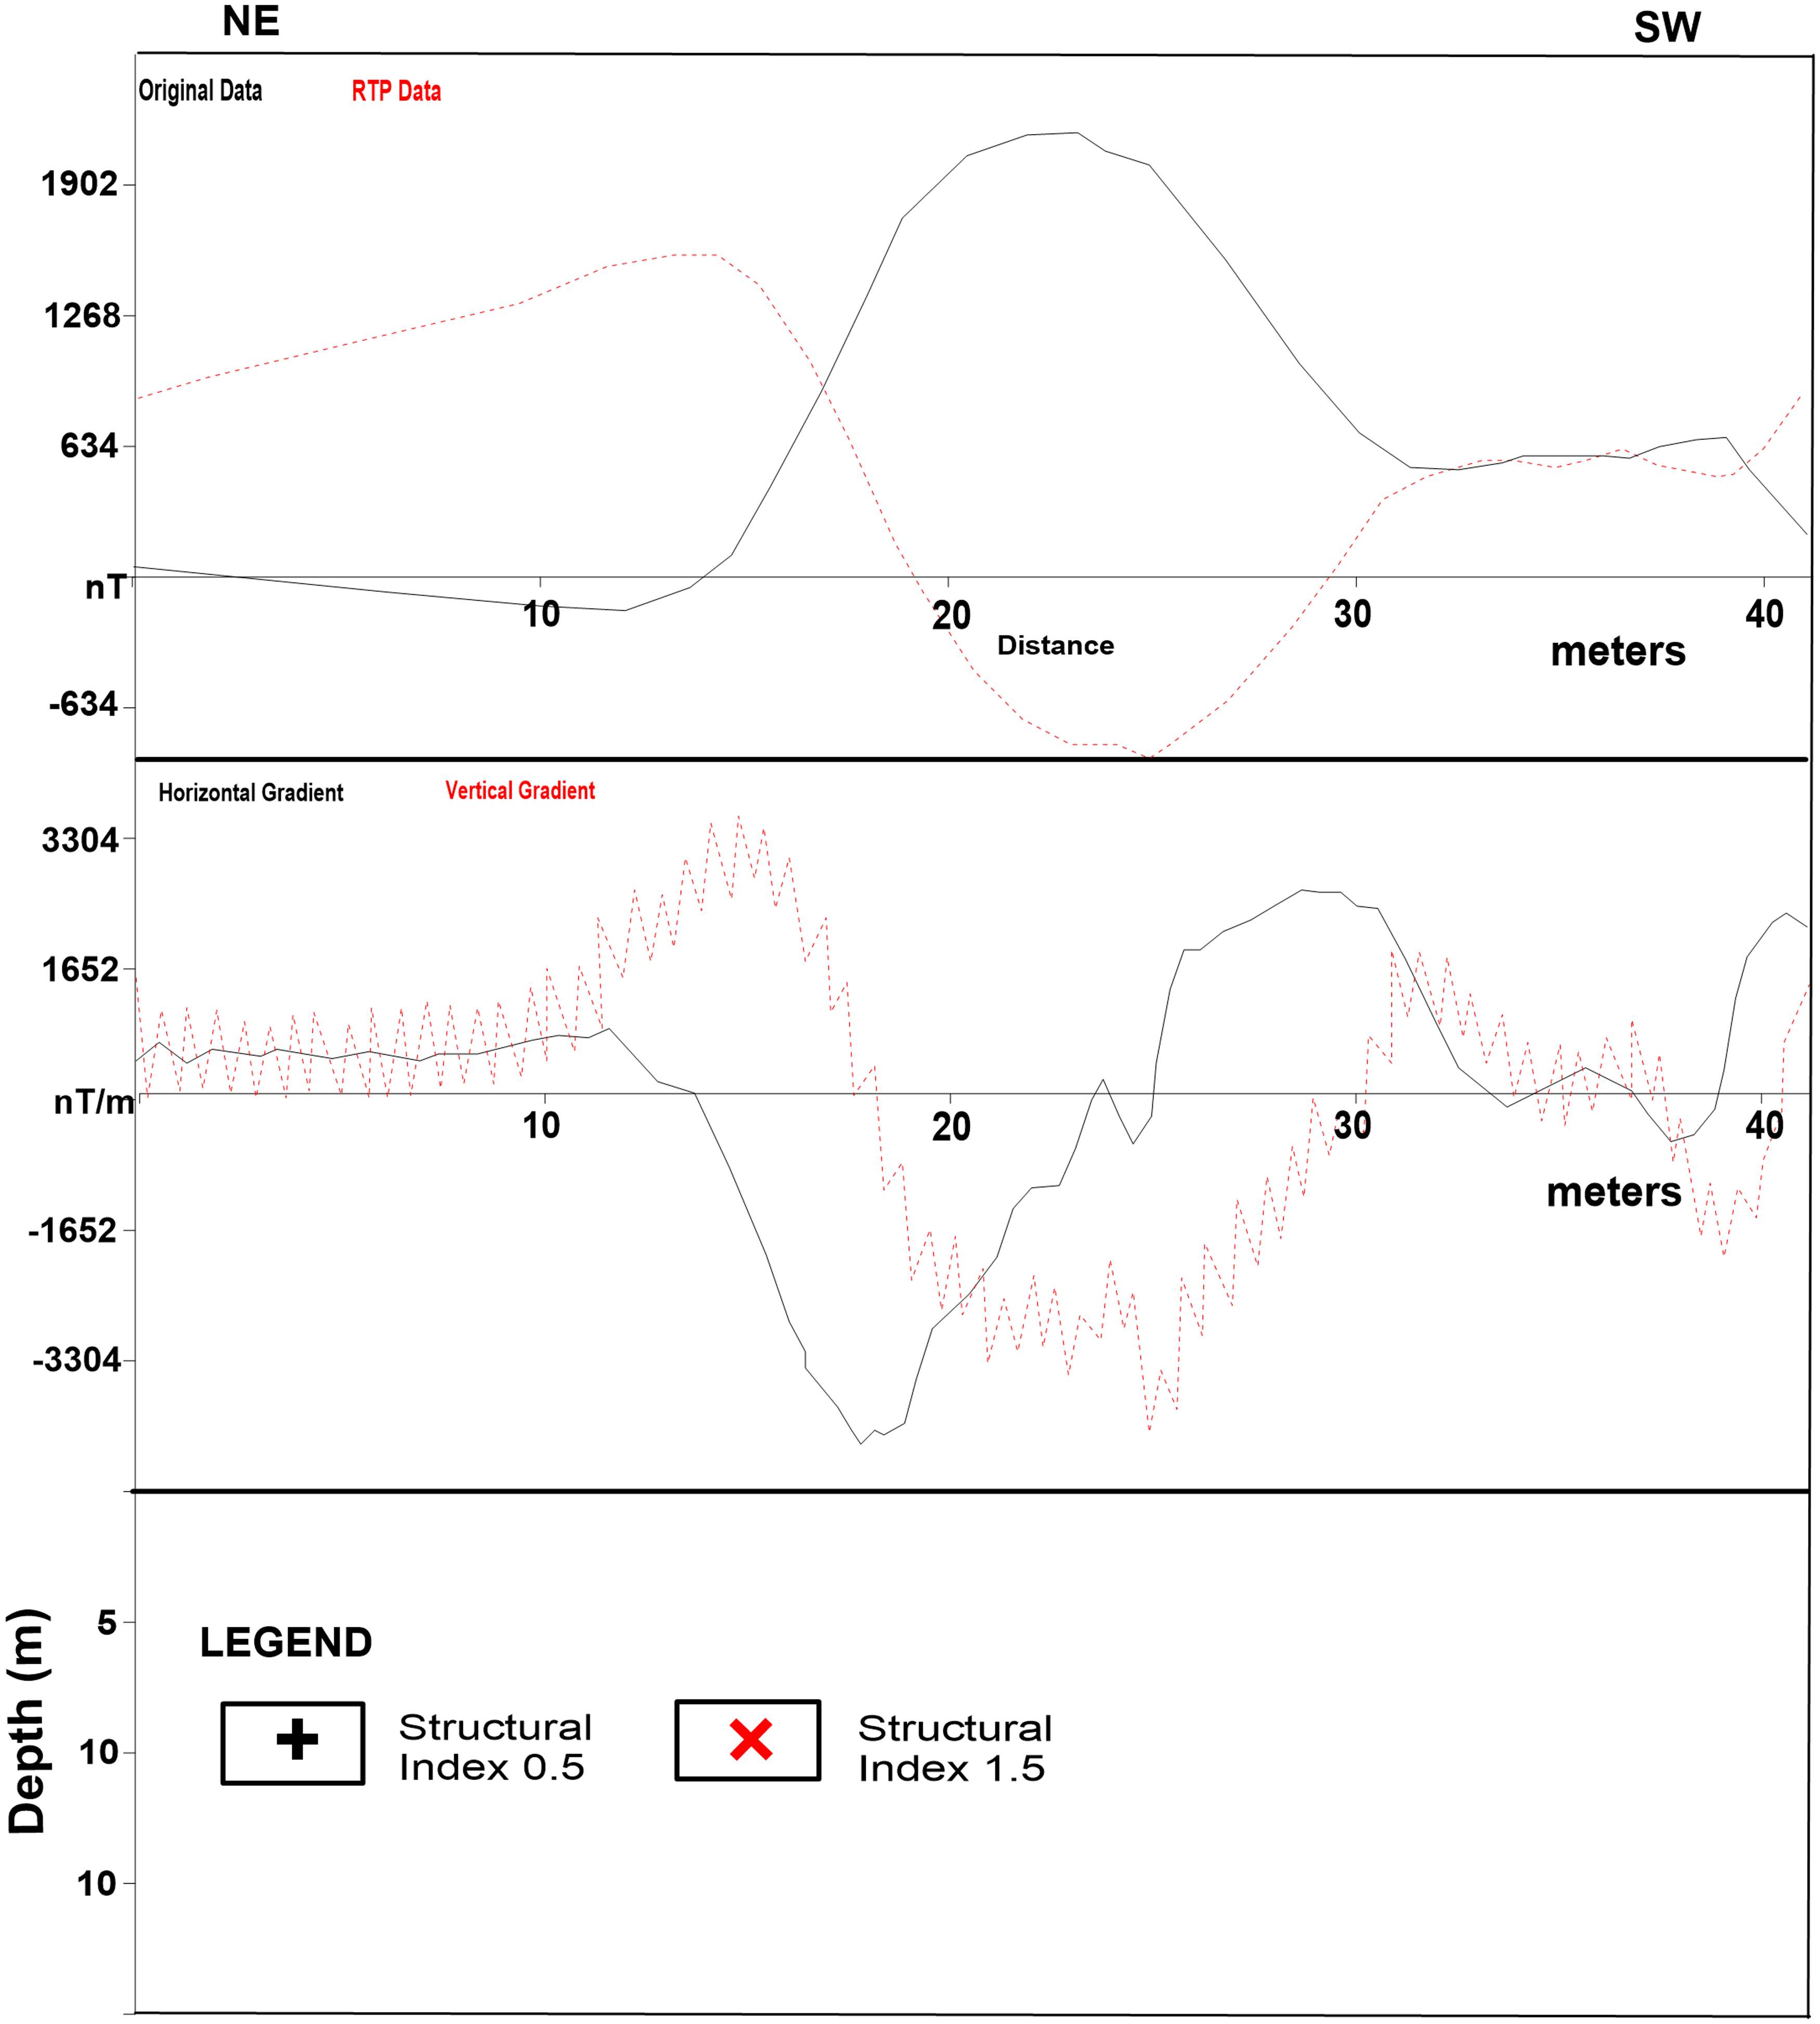
Magnetic profile along traverse 4.
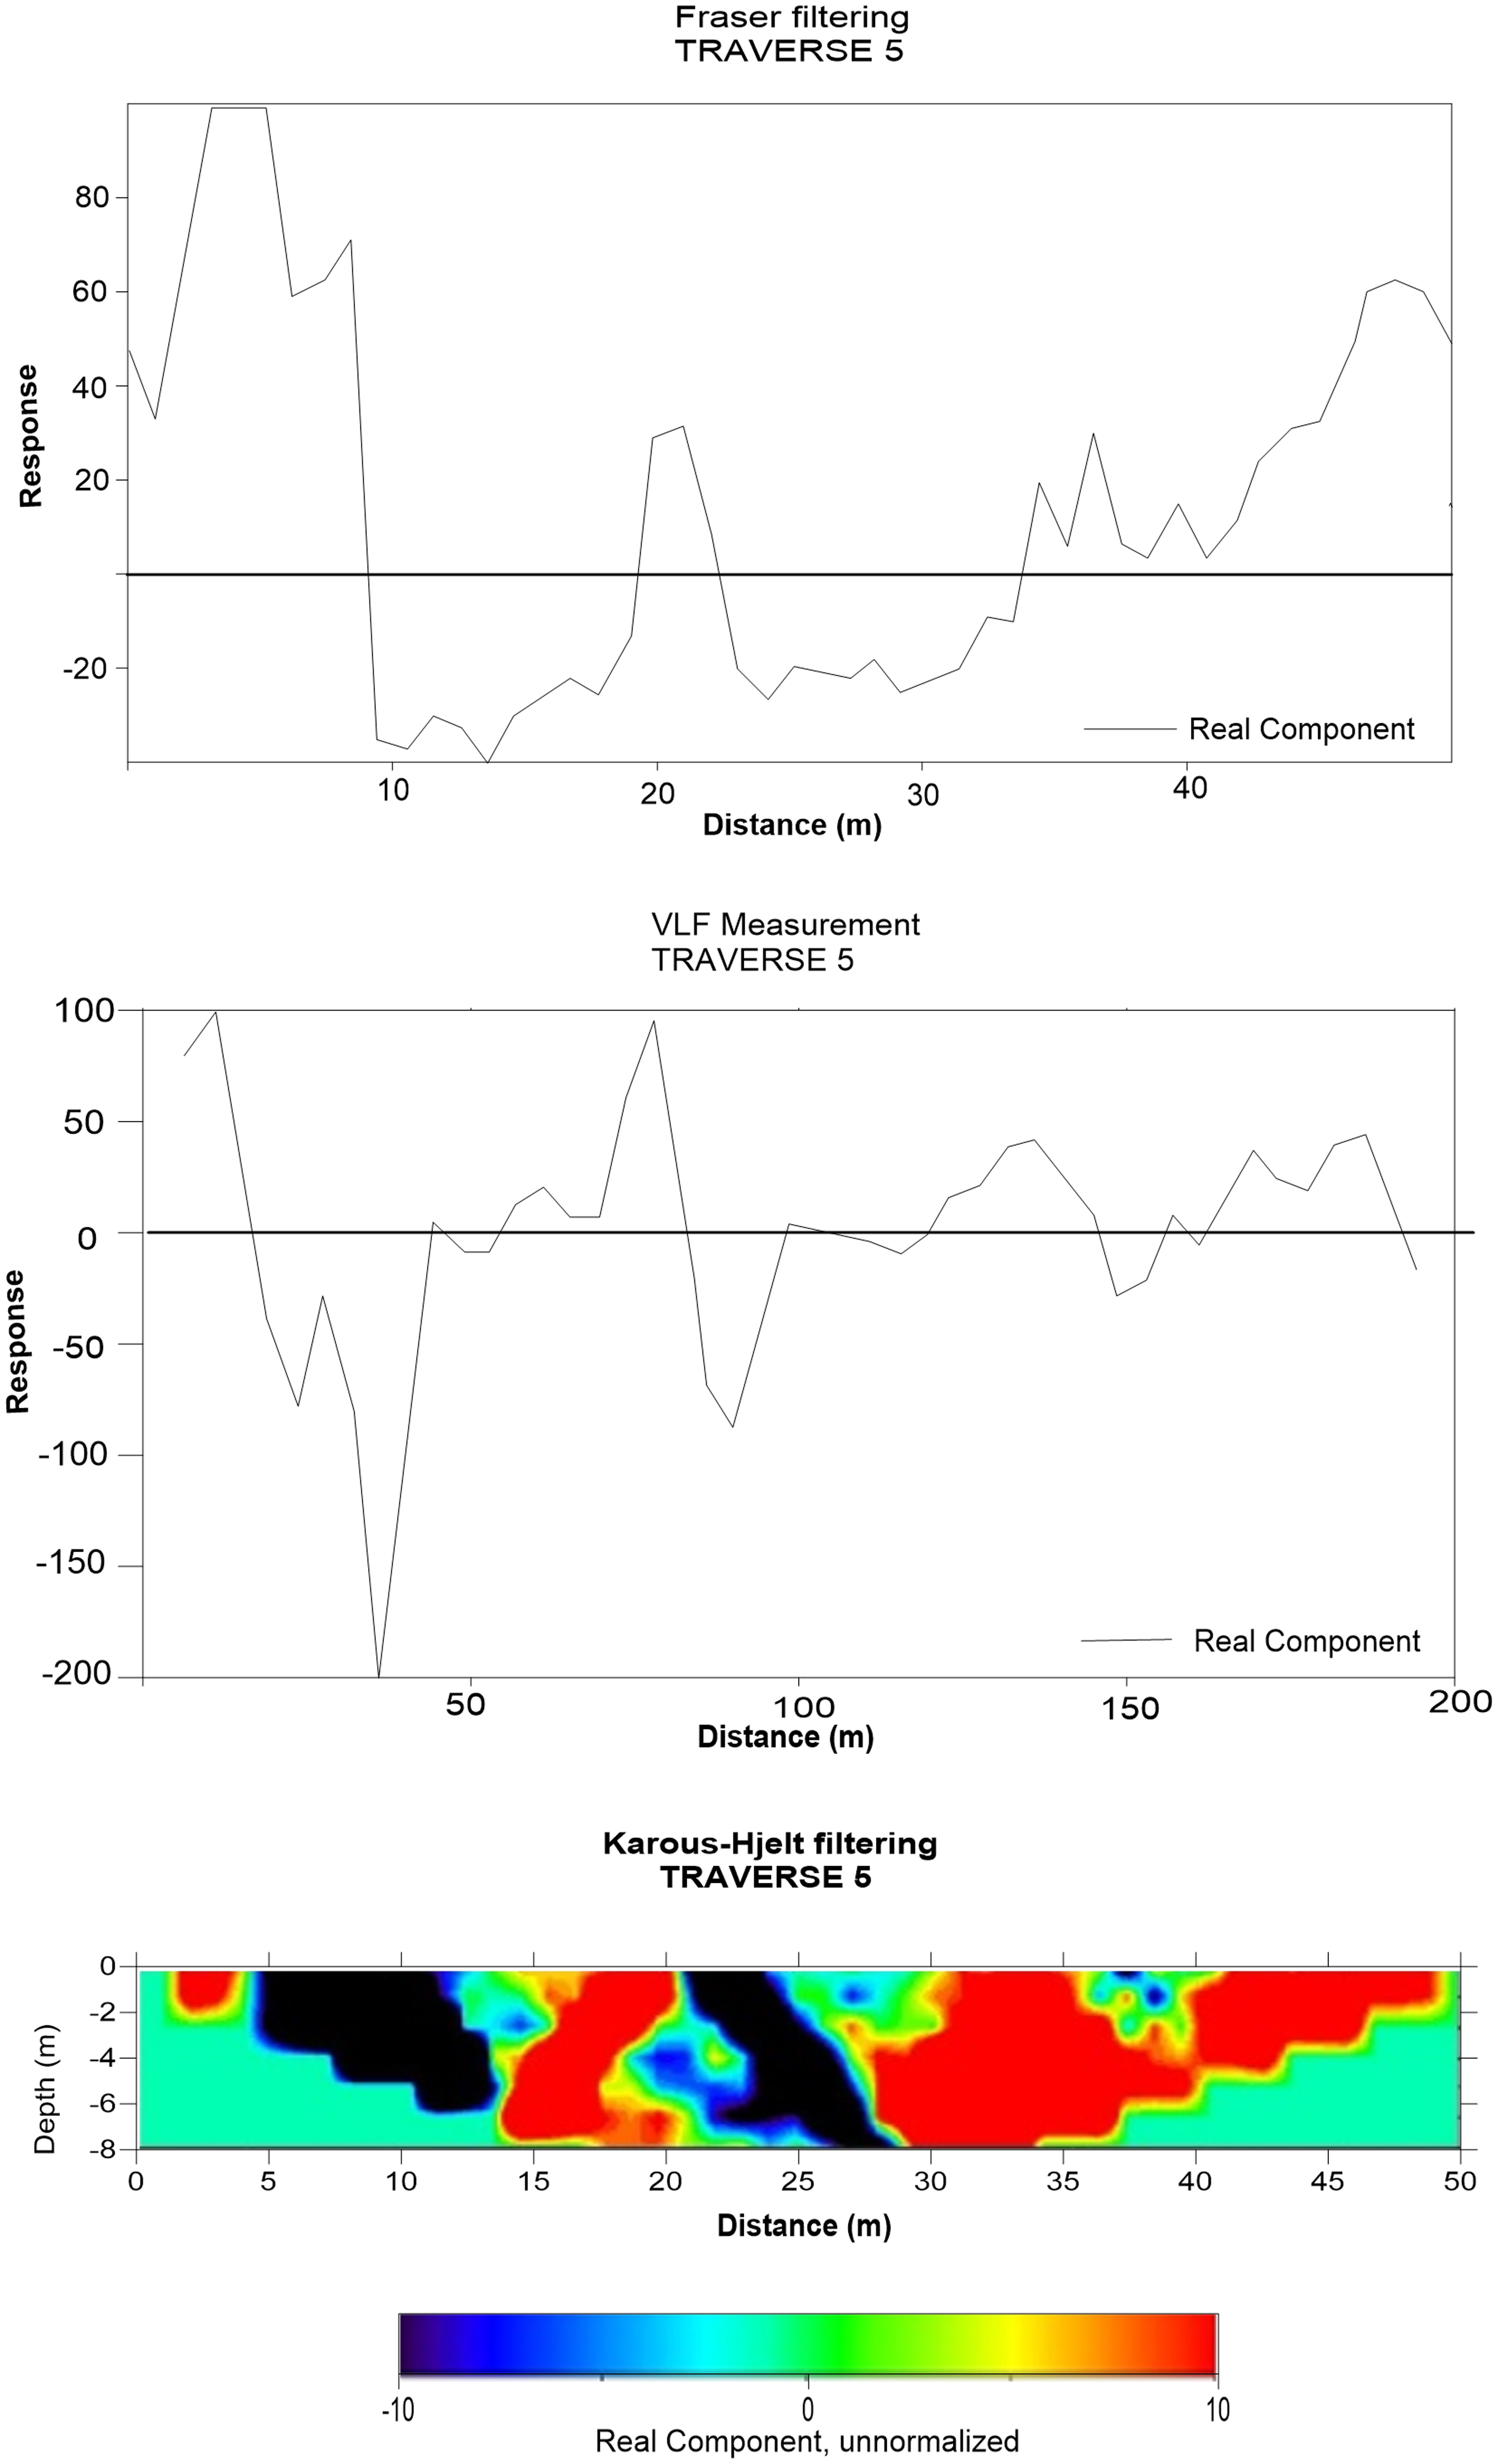
Very low frequency electromagnetic (VLF-EM) profile along traverse 5.
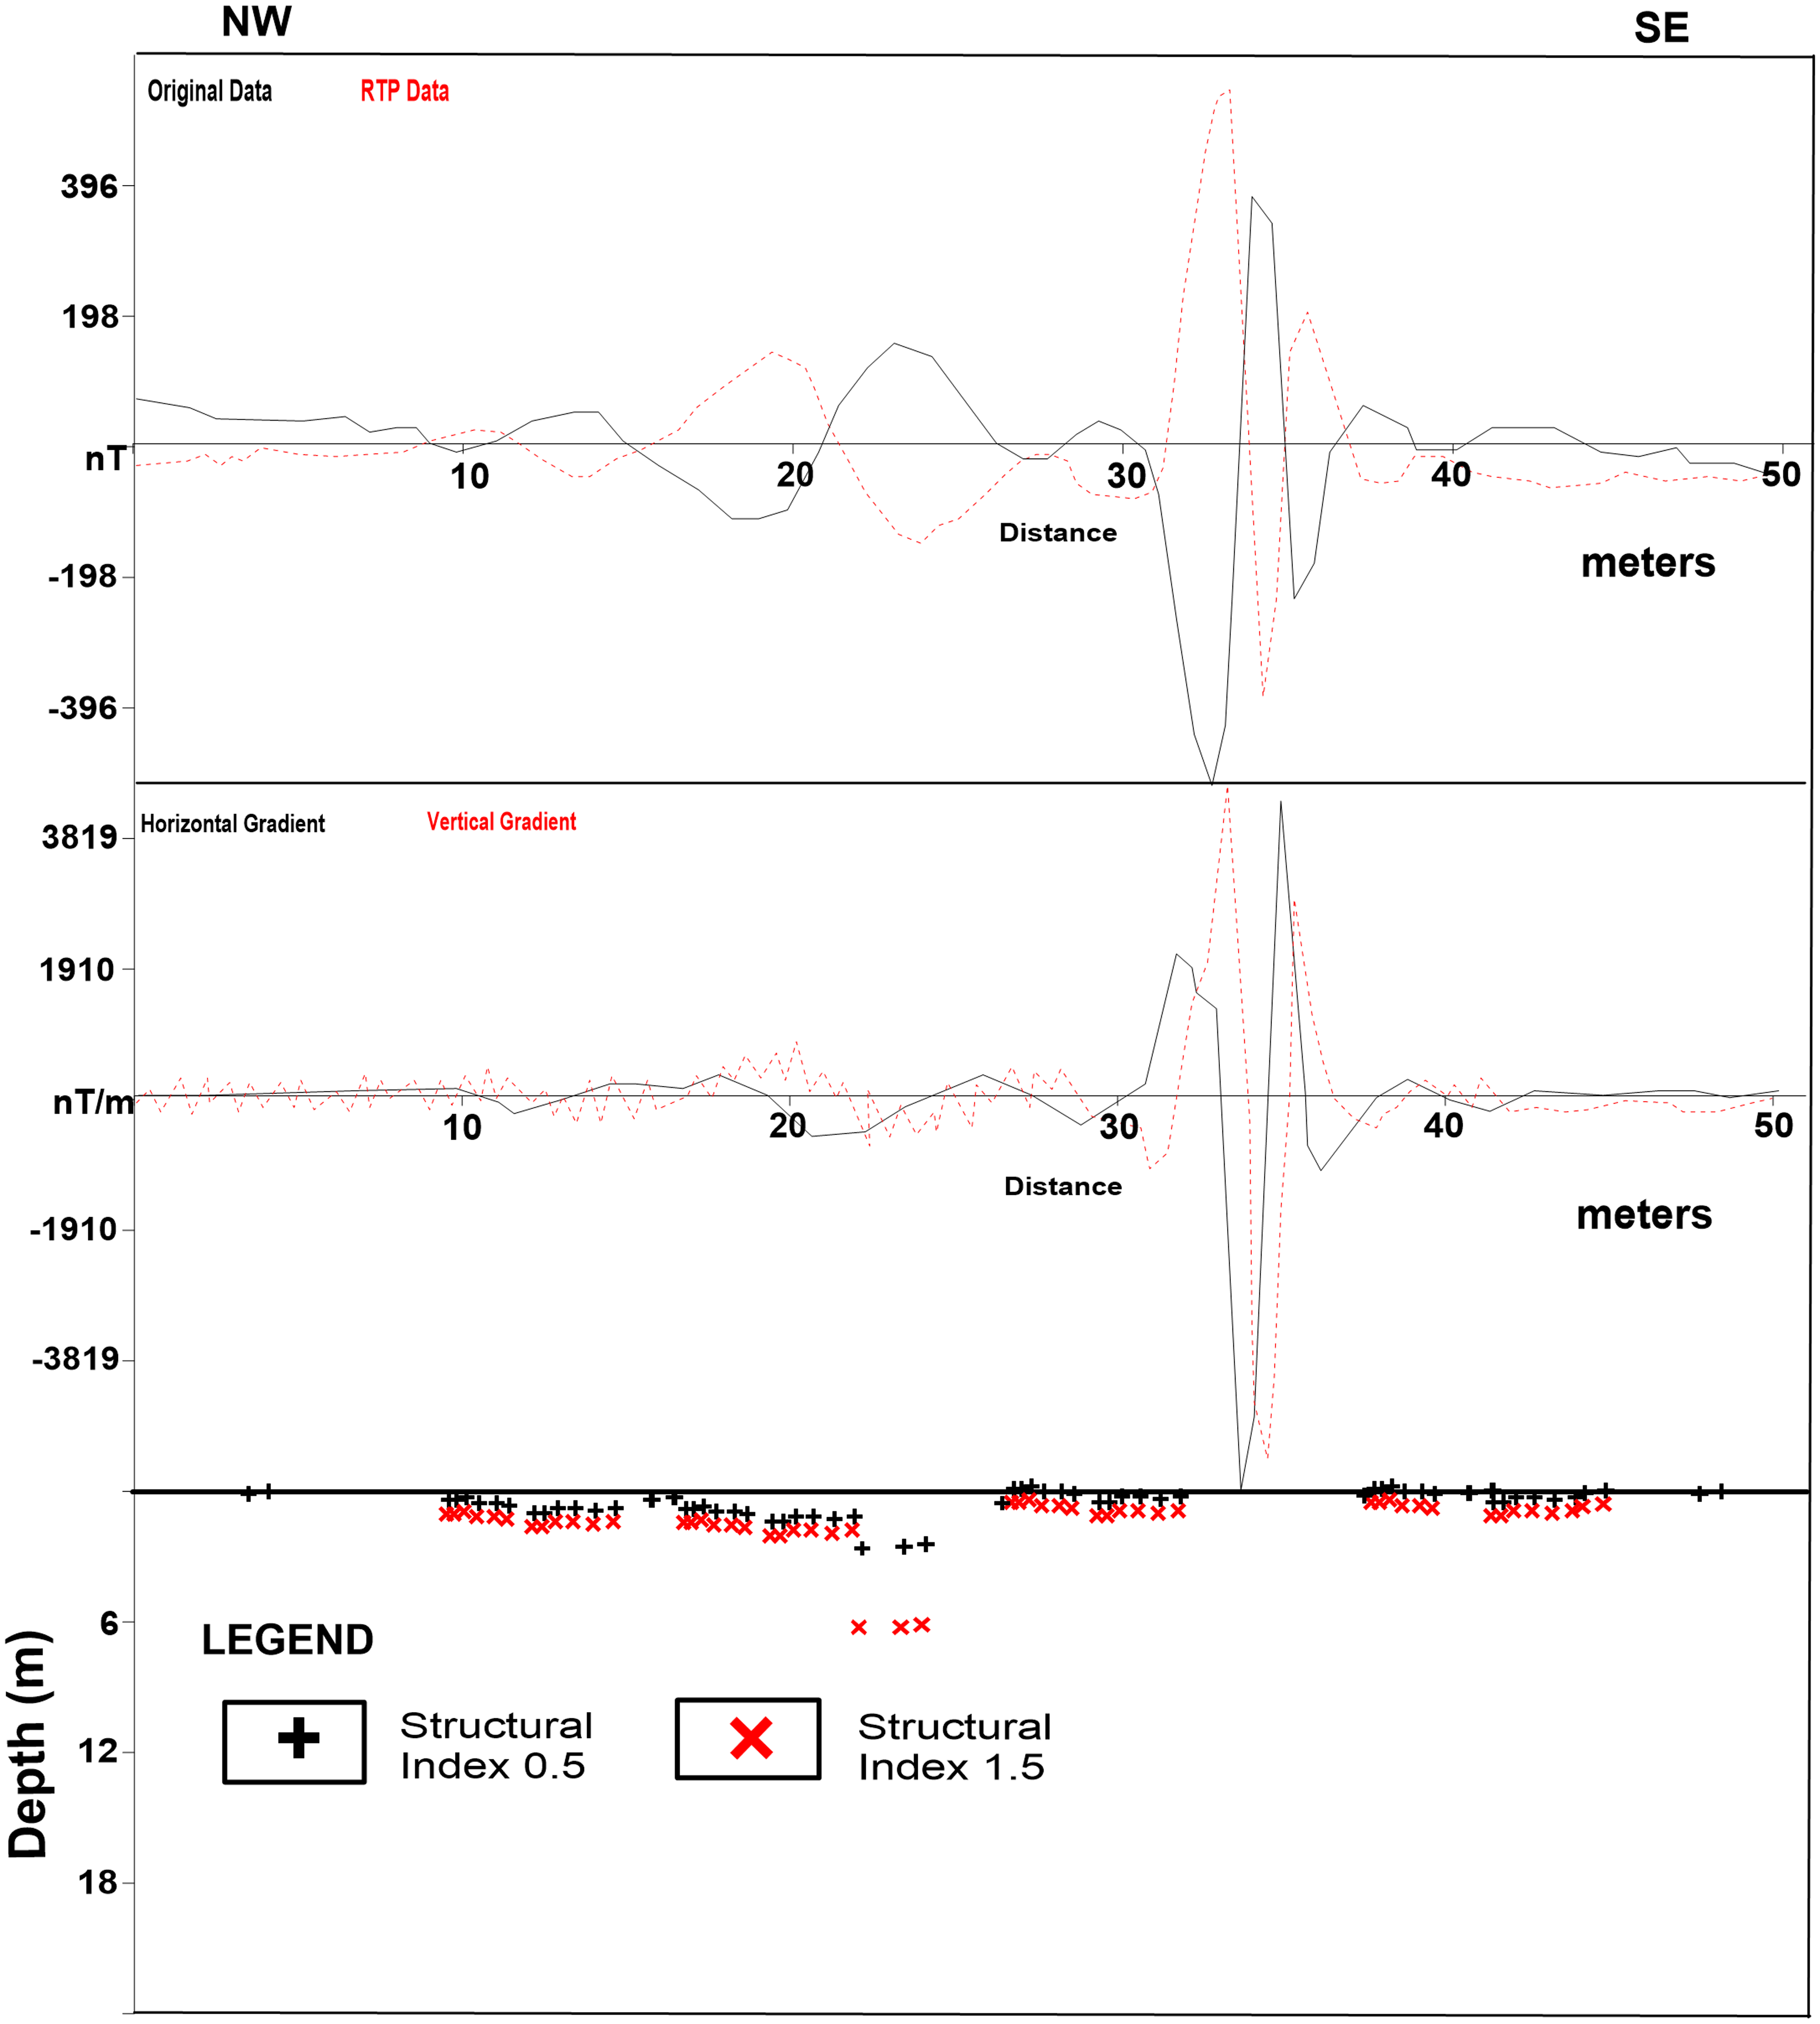
Magnetic profile along traverse 5.
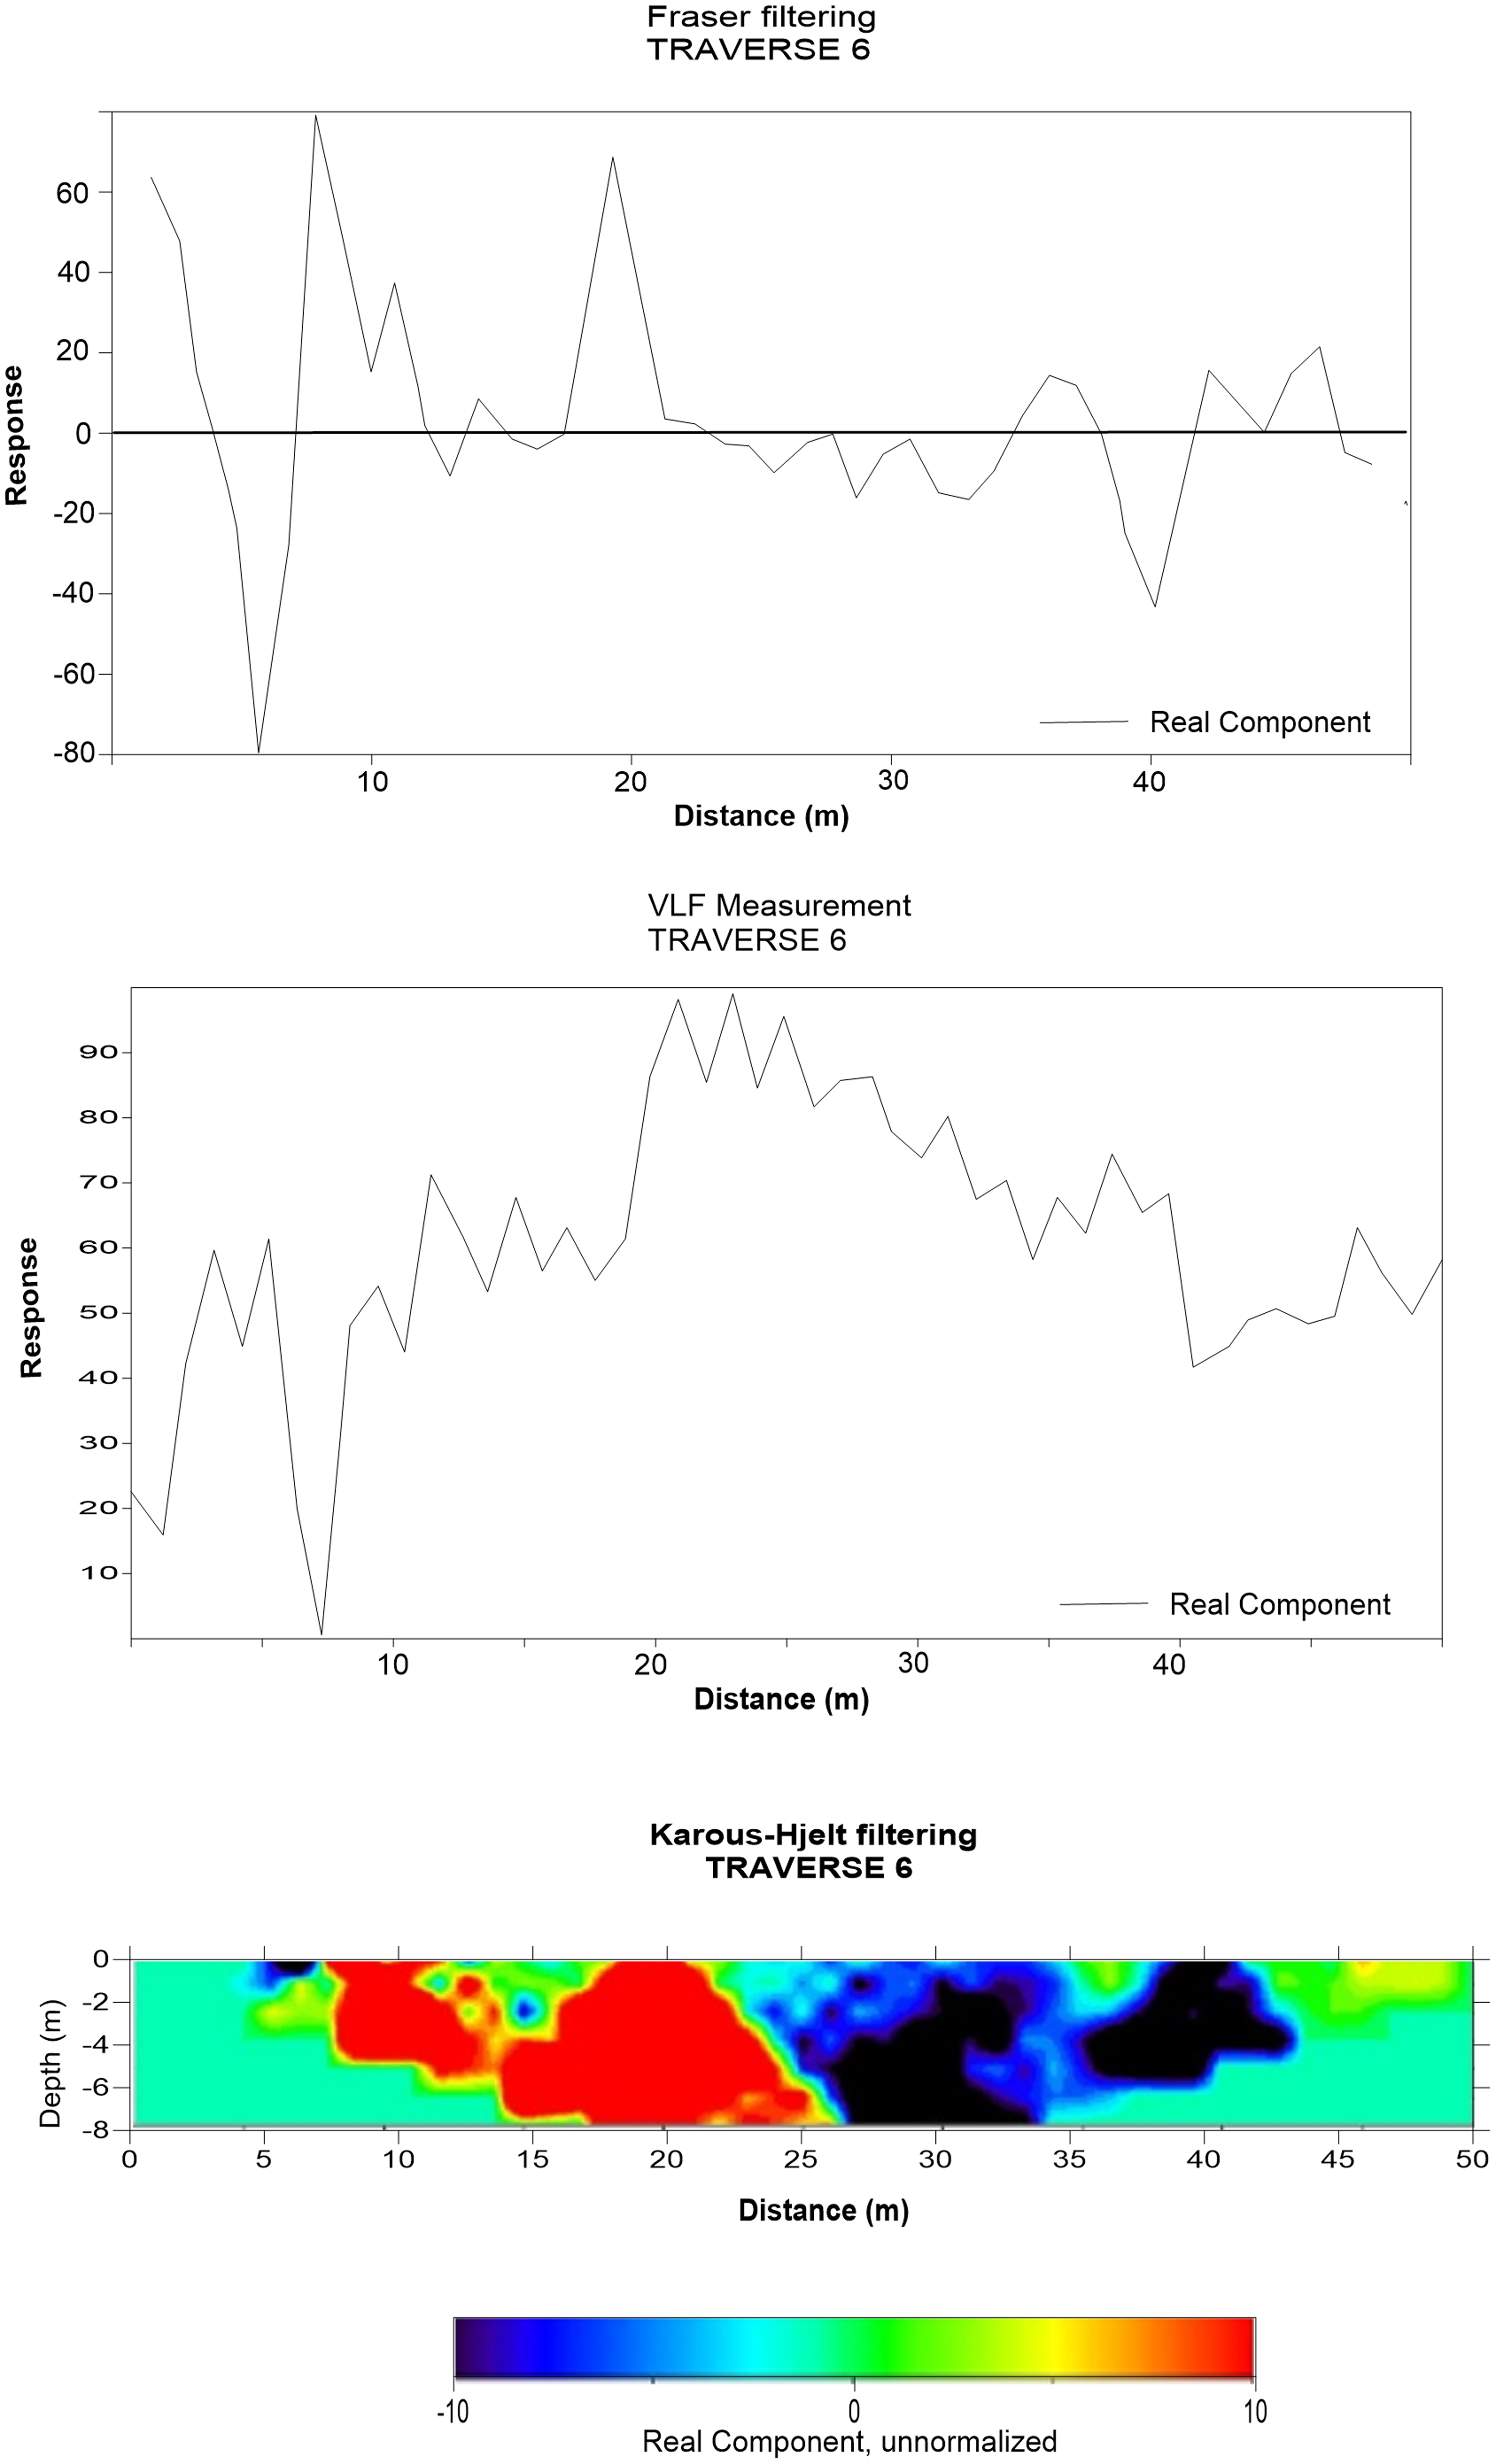
Very low frequency electromagnetic (VLF-EM) profile along traverse 6.
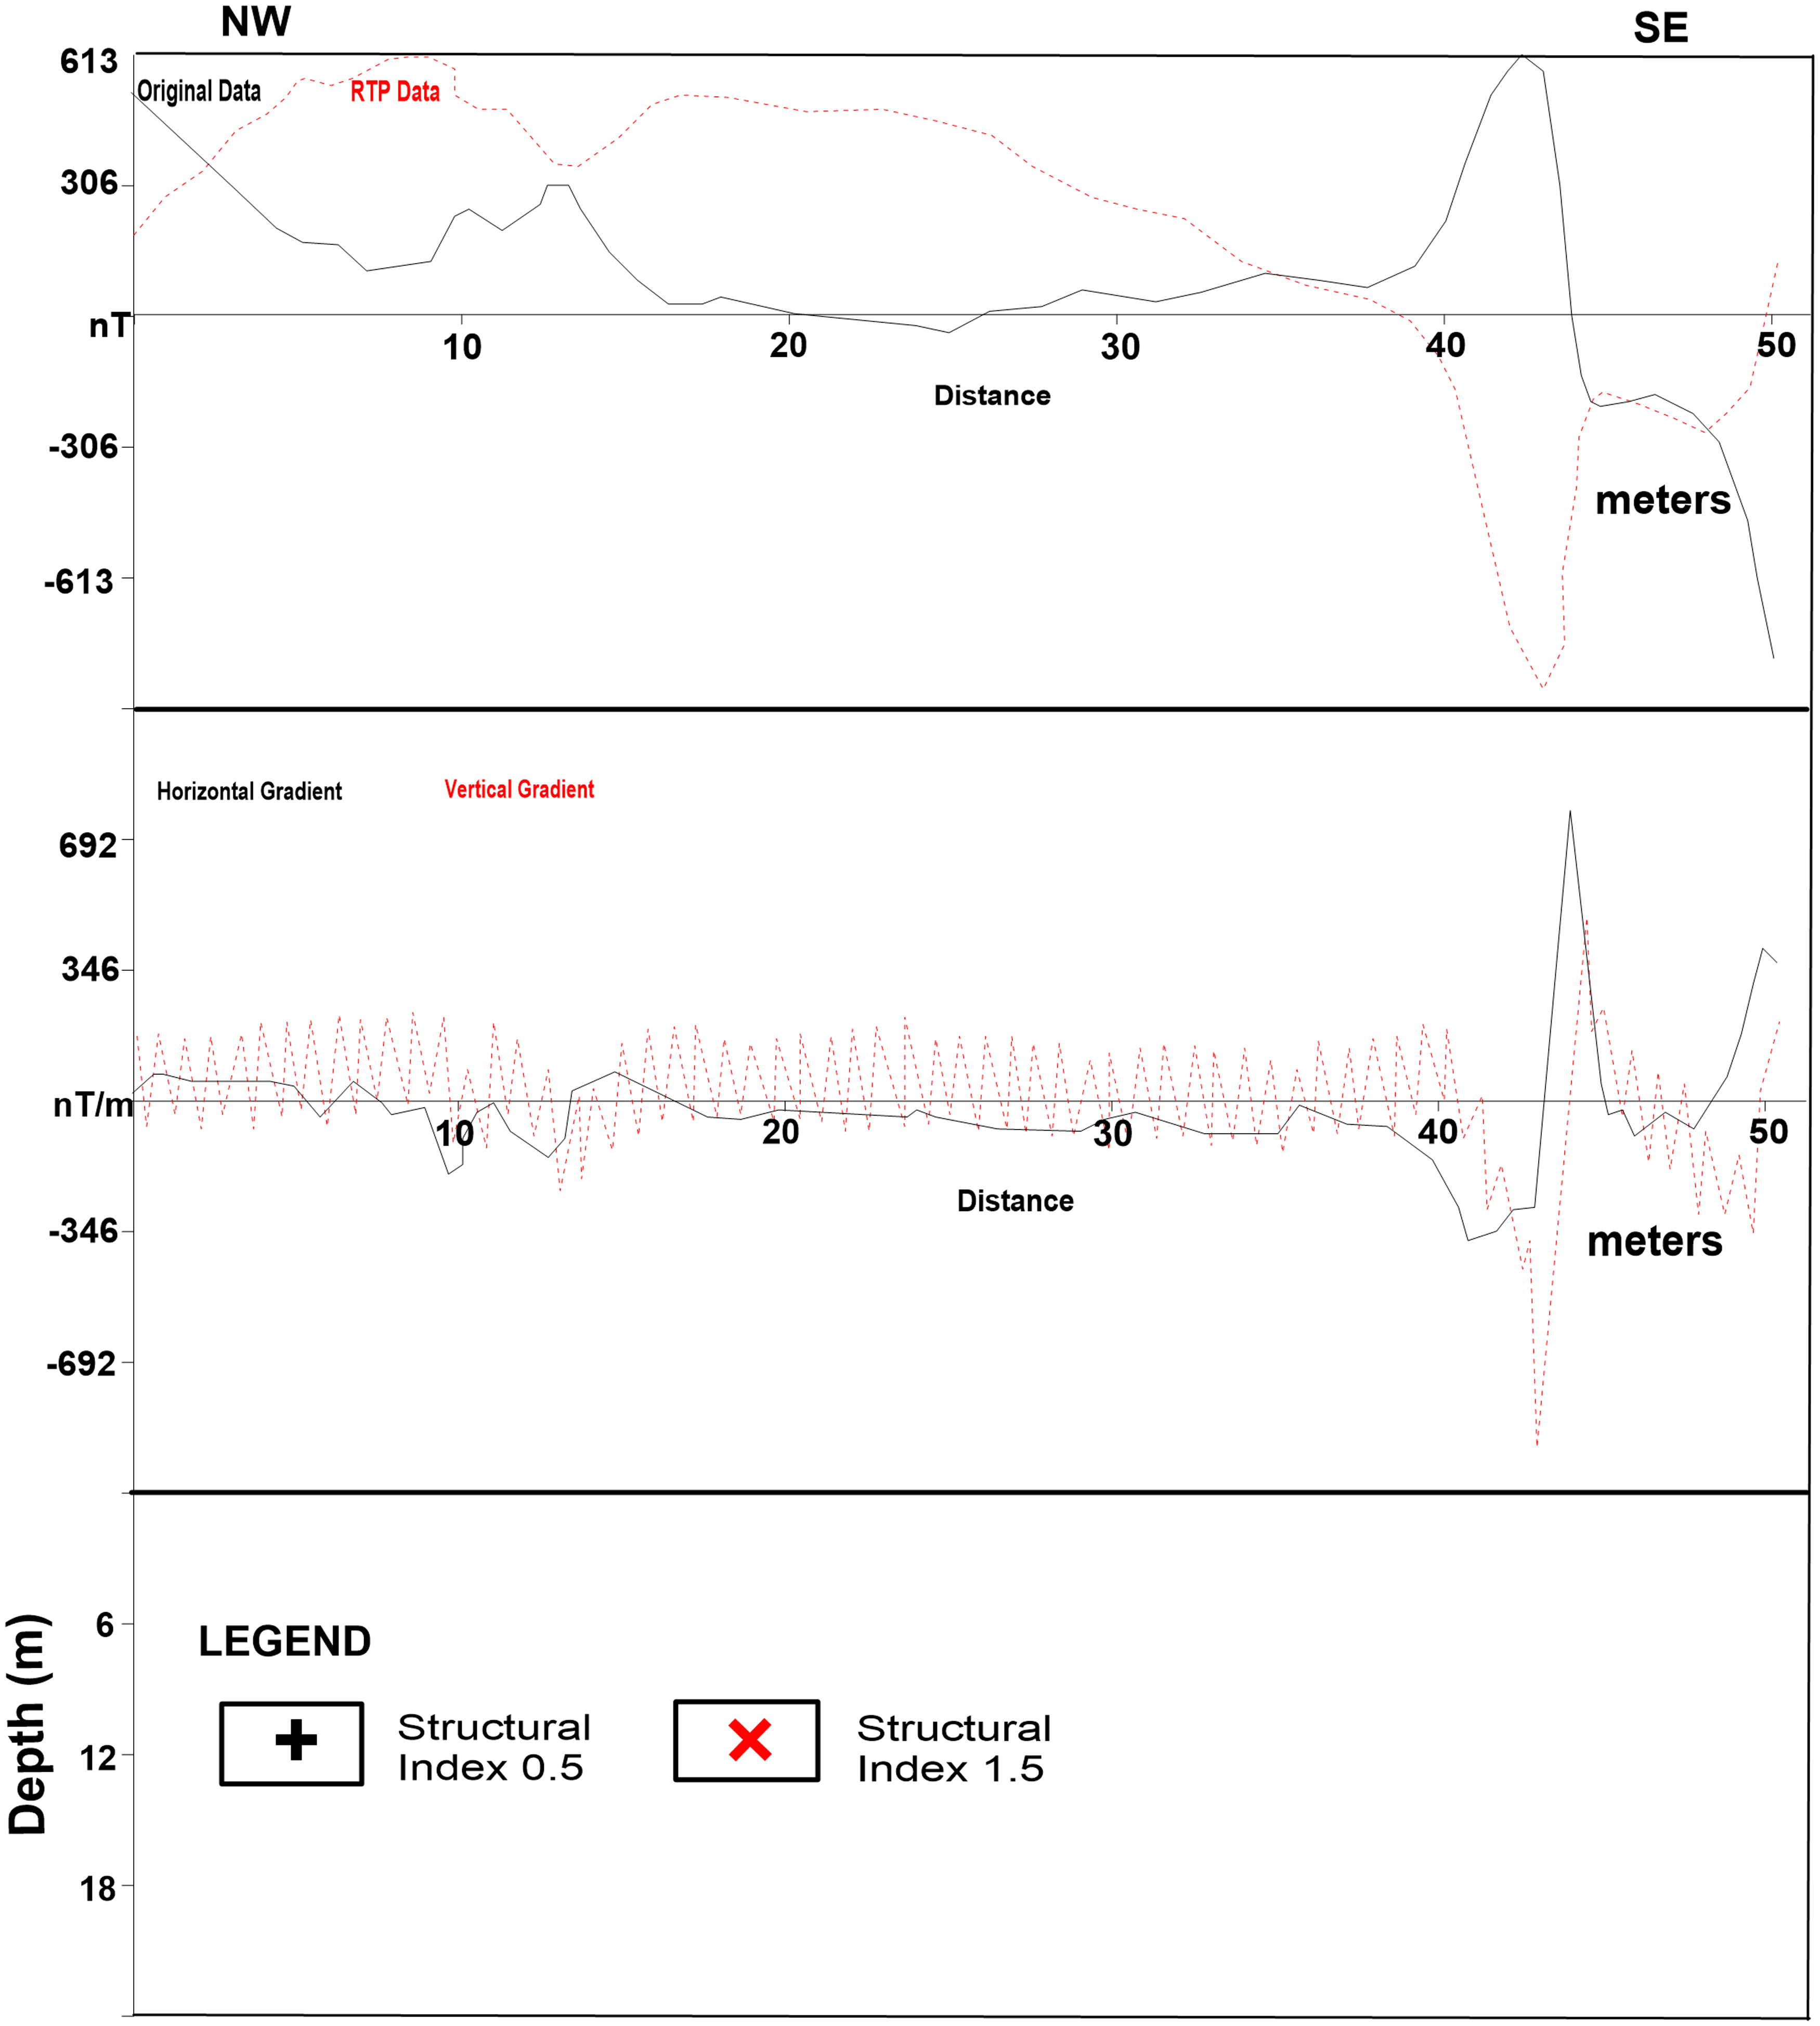
Magnetic profile along traverse 6.
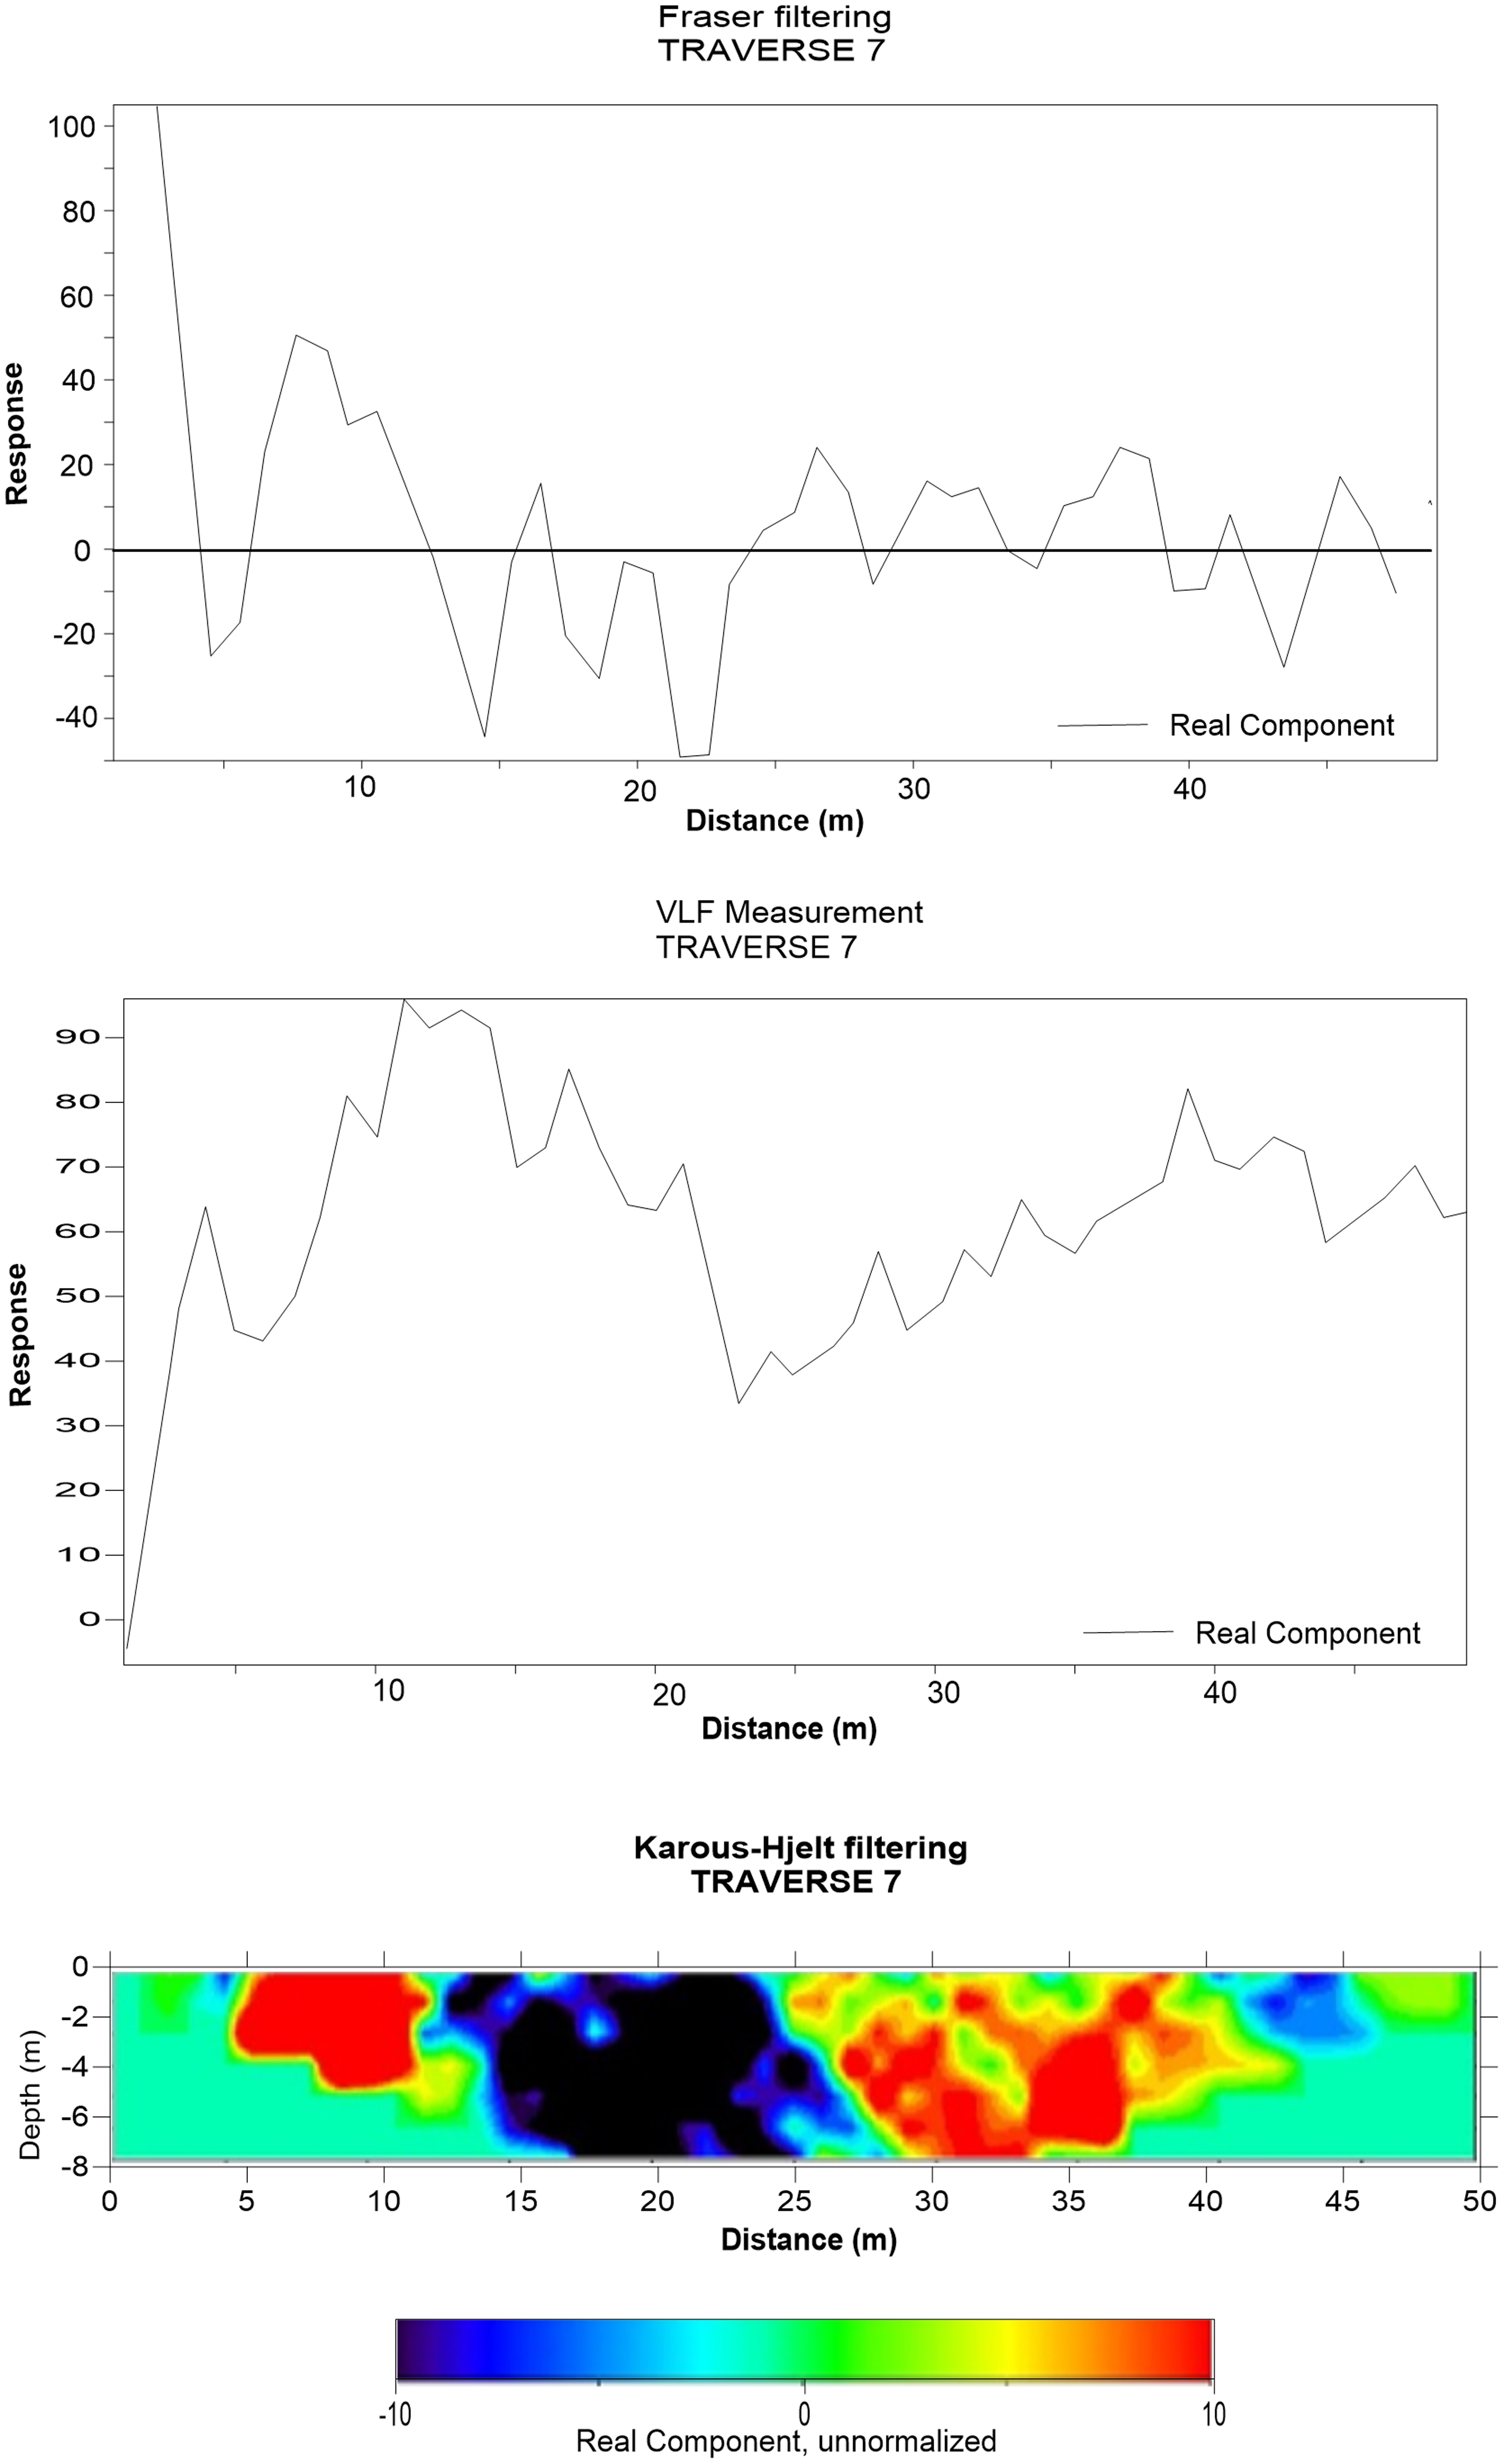
Very low frequency electromagnetic (VLF-EM) profile along traverse 7.
Magnetic profile along traverse 7.
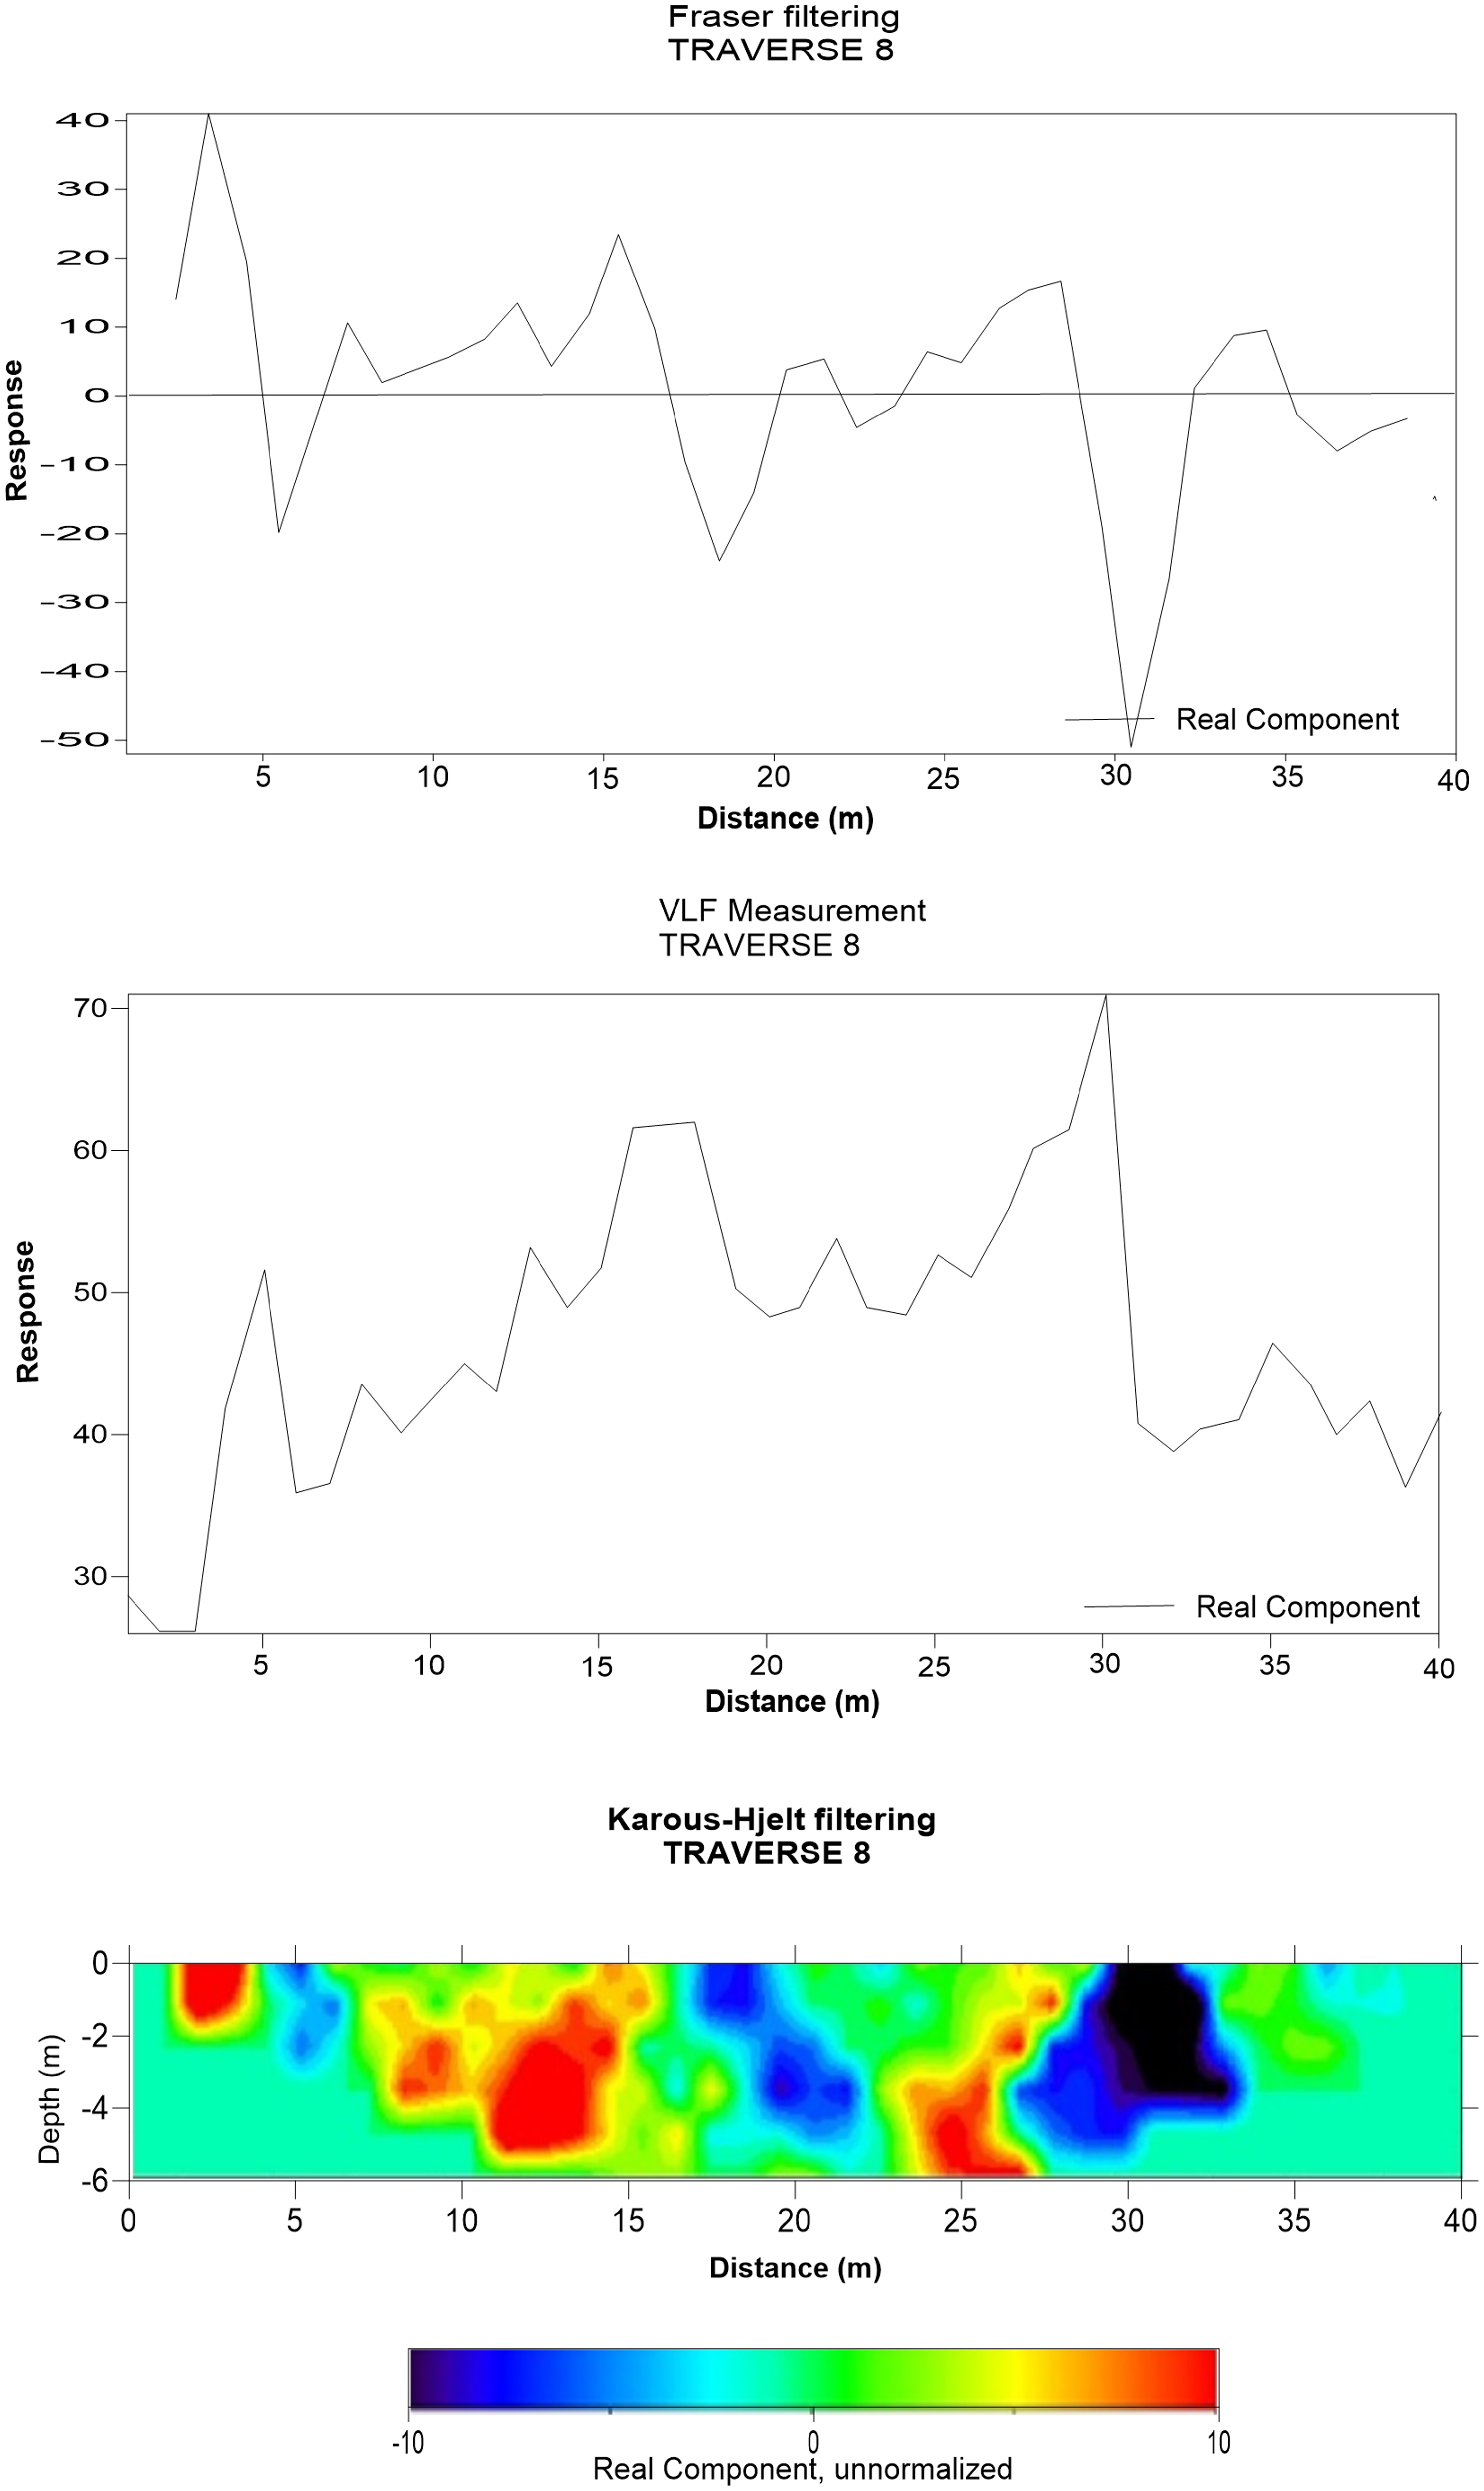
Very low frequency electromagnetic (VLF-EM) profile along traverse 8.
Magnetic profile along traverse 8.
Traverse 1
The results obtained from Traverse 1 are illustrated in Figures 5 and 6, depicting the profiles of VLF-EM and magnetic data. The VLF-EM profiling reveals prominent high conductive responses, which align with high magnetic anomalies observed along the traverse, specifically within distances ranging from 8 to 38 m. The magnetic profile highlights high magnetic values occurring at distances of 9–28, 32–35, and 36–38 m (Figure 6). Moreover, the KH-filter pseudo section demonstrates a substantial presence of high conductivity responses within the distance range of 8–38 m (Figure 5). These findings serve as indicators of suspected ore minerals in the surveyed area.
Traverse 2
The outcomes of Traverse 2 are displayed in Figures 7 and 8, illustrating the profiles of VLF-EM and magnetic data. Notably, the profiles indicate the presence of high conductive responses, which align with a significant magnetic anomaly observed at a distance range of 30–50 m, occurring at a shallow depth of 5 m. These distinct characteristics are consistent with the typical behaviour of magnetite ore minerals.
Traverse 3
The results of Traverse 3 are presented in Figures 9 and 10, depicting the VLF-EM and magnetic data profiles. Notably, there are high conductive responses corresponding to elevated magnetic anomalies observed at distances ranging from 18 to 44 m and at 50 m, as evident in the VLF-EM profile (Figure 9). These findings suggest the presence of conductive minerals in the surveyed area. Furthermore, in the magnetic profiling, significant magnetic values are observed within the distances of 18–22 and 31–38 m, indicating the existence of a mineralised zone at a shallow depth of ∼3 m (Figure 10).
Traverse 4
Traverse 4 results are presented in the profile of VLF-EM and magnetic data as shown in Figures 11 and 12. This traverse was established outside the rock boundary as shown in the base map. There are indications of a low conductive body with a corresponding low magnetic intensity. However, the positive magnetic anomaly observed at 15–25 m, coincides with the area showing a relatively high conductive response, thereby revealing the presence of magnetic ore mineral.
Traverse 5
The profiles of VLF-EM and magnetic data presented in Figures 13 and 14 reveal the findings from Traverse 5. High conductive responses on the VLF-EM profile correspond to areas of low magnetic intensity displayed in the magnetic profiles. Specifically, these occurrences are observed between distances of 15 m and 20 m, as well as 28 m and 48 m. The concurrence of low magnetic values and high conductivity along the traverse indicates a relatively high concentration of minerals such as quartz, microcline, plagioclase, and biotite, all of which are associated with the presence of magnetite ore minerals.
Traverse 6
The results from Traverse 6 are displayed in the VLF-EM and magnetic data profile in Figures 15 and 16. High conductive responses correspond to a high magnetic anomaly occurring at the distance of 8–16 m indicating the presence of ore minerals. High conductive responses correspond to low magnetic intensity between 15–20 and 40–48 m. Indicative of other minerals such as Quartz, microcline, plagioclase, etc., associated with the magnetite ore.
Traverse 7
The VLF-EM and magnetic data profiles in Figures 17 and 18 show the Traverse 7 results. High conductivity responses correspond to high magnetic anomaly occurrence on the veins at a distance of 5–20 m showing signs of ore minerals. High magnetic values were also recorded between 42 and 48 m on the traverse, indicating the presence of magnetite ore minerals despite the area's low conductivity. On the other hand, high conductivity and low magnetic intensity were observed between 28 and 28 m, suggesting the presence of other minerals associated with the magnetite ore mineral.
Traverse 8
This traverse was outlaid outside the outcrop and its results are presented in the profile of VLF-EM and Magnetic data as shown in Figures 19 and 20. There are indications of the presence of low conductive and relatively high magnetic susceptibility material on the majority of the traverse. However high conductivity was observed between 3 and 5, 8 and 16, and 24 and 28 m on the KH-filter pseudo section, while a positive magnetic anomaly was also observed between 5 and 28 m. This infers that the presence of magnetite ore is suspected within 5–28 m on the traverse.
Conclusion
In this study, the successful integration of geophysical methods of VLF-EM and magnetics methods in investigating the occurrence of magnetite ore mineral observed in the study area has greatly enhanced the understanding of the ore geometry and other subsurface geological information which previous studies by surface geological mapping could not deduce. The magnetic profiling showed high magnetic anomalies indicative of potential ore minerals, which corresponded to high conductivity responses from VLF-EM profiling in most parts of the traverses. This association provided further evidence of the presence of magnetite ore minerals in the surveyed area. The high VLF-EM anomalous profiles and low magnetic intensity recorded on some of the pegmatite veins (Tr5, Tr6 and Tr7) are believed to be due to the presence of minerals such as quartz, microcline, plagioclase, and biotite, which are associated with the ore mineral (pegmatite) believed to influence the low anomalous profile. The application of these geophysical techniques enabled a comprehensive assessment of the subsurface, aiding in the identification of conductive bodies and potential mineralised zones. These findings contribute to our understanding of the mineral resource potential in the study area. The presence of magnetite ore minerals, as well as its associated minerals observed in the traverses, highlights the prospectivity of the area for further exploration and potential economic development.
Footnotes
Author's contribution
All authors contributed to the study's conception and design. Material preparation, data collection, and analysis were performed by all authors. The first draft of the manuscript was written by all authors. All authors read and approved the final manuscript.
Availability of data and materials
Due to the nature of this research, participants of this study did not agree for their data to be shared publicly, so supporting data is not available.
Declaration of conflicting interests
The authors declared no potential conflicts of interest with respect to the research, authorship, and/or publication of this article.
Funding
The authors received no financial support for the research, authorship, and/or publication of this article.