
Abstract
This study determines which predictors derived from geophysics or remote sensing data best generate a mineral prospectivity model (MPM) over Ghana's southern Kibi-Winneba belt in a scenario-based modeling case using Random Forest (RF) algorithm. Ten geophysically-derived predictors and six-remote sensing derived predictors were used as inputs in the first and second scenarios respectively. In the third case, the sixteen predictors derived from these afore-mentioned geoscientific datasets were used as inputs. Thus, three binary RF-based MPM were generated, and compared accordingly. The predictive performance in all three scenario-based RF-derived MPM produced was determined using the area under the receiver operating characteristic curve (AUC). AUC scores of 0.840, 0.785 and 0.809 respectively, were obtained for the first, second and third scenarios. The AUC scores obtained further indicates that, MPM developed based on using only the geophysics-sourced layers as inputs performed better in comparison with the MPMs generated in second and third scenarios.
Keywords
Introduction
Mineral prospectivity modelling (MPM) is a crucial procedure that can assist mineral exploration geoscientists in defining regions that are significantly endowed with the potential of hosting a specific mineral deposit.1,2 However, it is noteworthy that uncertainties related to the geological and mathematical frameworks applied, as well as uncertainties pertaining to the geoscientific and geospatial datasets employed, are the main factors impeding the effectiveness of the use of the MPM technique.3–5 Uncertainties in the geoscientific and geospatial datasets used may result from the low resolution of the data as well as mistakes made during data reduction and cleaning procedures.6,7 Usually, these inefficiencies have an impact on the quality of the geoscientific thematic layers obtained. Furthermore, the use of thematic layers that have no geoscientific relevance to the sought-after mineral reduces the efficiency of the MPM generated. Uncertainties in the geological framework arise from a lack of a complete understanding and appreciation of the processes that led to the formation of the mineral deposit of interest within a specific geologic environment.2,8 Uncertainty in mathematical framework comes from the use of a non-robust mathematical approach to determine weights of various geoscientific layers that are to be synthesised into a prospectivity model. 2 The integration of various geoscientific thematic layers to produce an MPM based on a mathematical framework generally takes two forms: knowledge- and data-driven mathematical frameworks. 1 The former is used to generate MPM in areas where known mineral occurrences are rare or absent; in this case, mineral exploration geoscientists’ opinions are incorporated in determining the relative importance of each of the thematic or evidential layers in relation to the mineral deposit to be explored.9,10 However, one major disadvantage of using knowledge-driven mathematical frameworks is the extreme subjectiveness involved in assigning weights to the thematic layers that would be synthesised to produce the MPM. 11 For the data-driven frameworks (which could be bivariate or multivariate), regions of known mineral deposit occurrences are used in the production of an MPM.11,12,13 It is noteworthy that several multivariate-based statistical approaches such as machine learning (ML) algorithms are included in the mathematical frameworks used in data-driven-based MPM. 14 Several studies have demonstrated the efficacy of ML algorithms (multivariate data-driven methods) in MPM and have subsequently lauded their superiority over the bivariate data-driven methods in a variety of geologic environments.2,15–23 Although many ML-based supervised classification algorithms have been employed in the MPM over several geological terranes, the random forests (RFs) are commonly used. This could be attributed to the premise that the RF classifier is more robust than the other ML algorithms in terms of its ability to reduce the effect of overfitting.2,17–20,24,25
Of all the gold belts in Ghana, it is the Kibi-Winneba belt and particularly, its southern part, otherwise known as the southern Kibi-Winneba belt (SKWB) that is the most under-explored, despite its geological terrane being thought to be analogous to the well-known Ashanti belt. 26 Efforts to understand the mineral potential of the SKWB have resulted in the use of both knowledge-driven and bivariate data-driven methods to generate an MPM.11,27 To highlight the mineral prospects as well as target zones that can guide future exploration programmes over the SKWB, this study determines which category of geospatial datasets whose thematic layers can produce the best accuracy when employed in delineating prospective zones of mineral occurrences. Also, by taking into cognisance the superiority of ML algorithms over traditional data-driven methods, and in order to contribute to narrowing down to more favourable zones for the delineation of gold mineral deposits, this study employs the RF algorithm to develop MPM over the SKWB based on three scenarios: thematic layers (a) derived from geophysical datasets comprising magnetic, radiometric and gravity, (b) derived from remote sensing data (Landsat 8 imagery) and (c) derived from geophysical and remote sensing datasets. The performance of the MPMs generated would be assessed using the receiver operating characteristics (ROC) curve to determine which scenario-based dataset is best for outlining prospective zones of mineral occurrences within the SKWB.
Study area and geological setting
Study area
The study area spans three municipalities (thus Efutu, Agona West and Mfantsiman municipalities) and five districts (which include the Awutu Senya, Gomoa East, Gomoa West, Ajumako Enyan Esiam and Asikuma Adoben Brakwa) in the Central Region of Ghana and covers an area of 1902 km2. The area of focus is defined by the longitude/latitude World Geodetic System ellipsoid coordinates 5.63∘N, 5.18∘N and 0.98∘W and 0.53∘W (Figure 1(a)). The study area is 65.5 km southwest of the nation’s capital, accessible via a sealed bitumen road. The study area’s topography generally ranges from 6 to 255 m. 28 Lower elevations are closer to the coast, while higher elevations are closer to the northern half of the study area (Figure 1(b)).
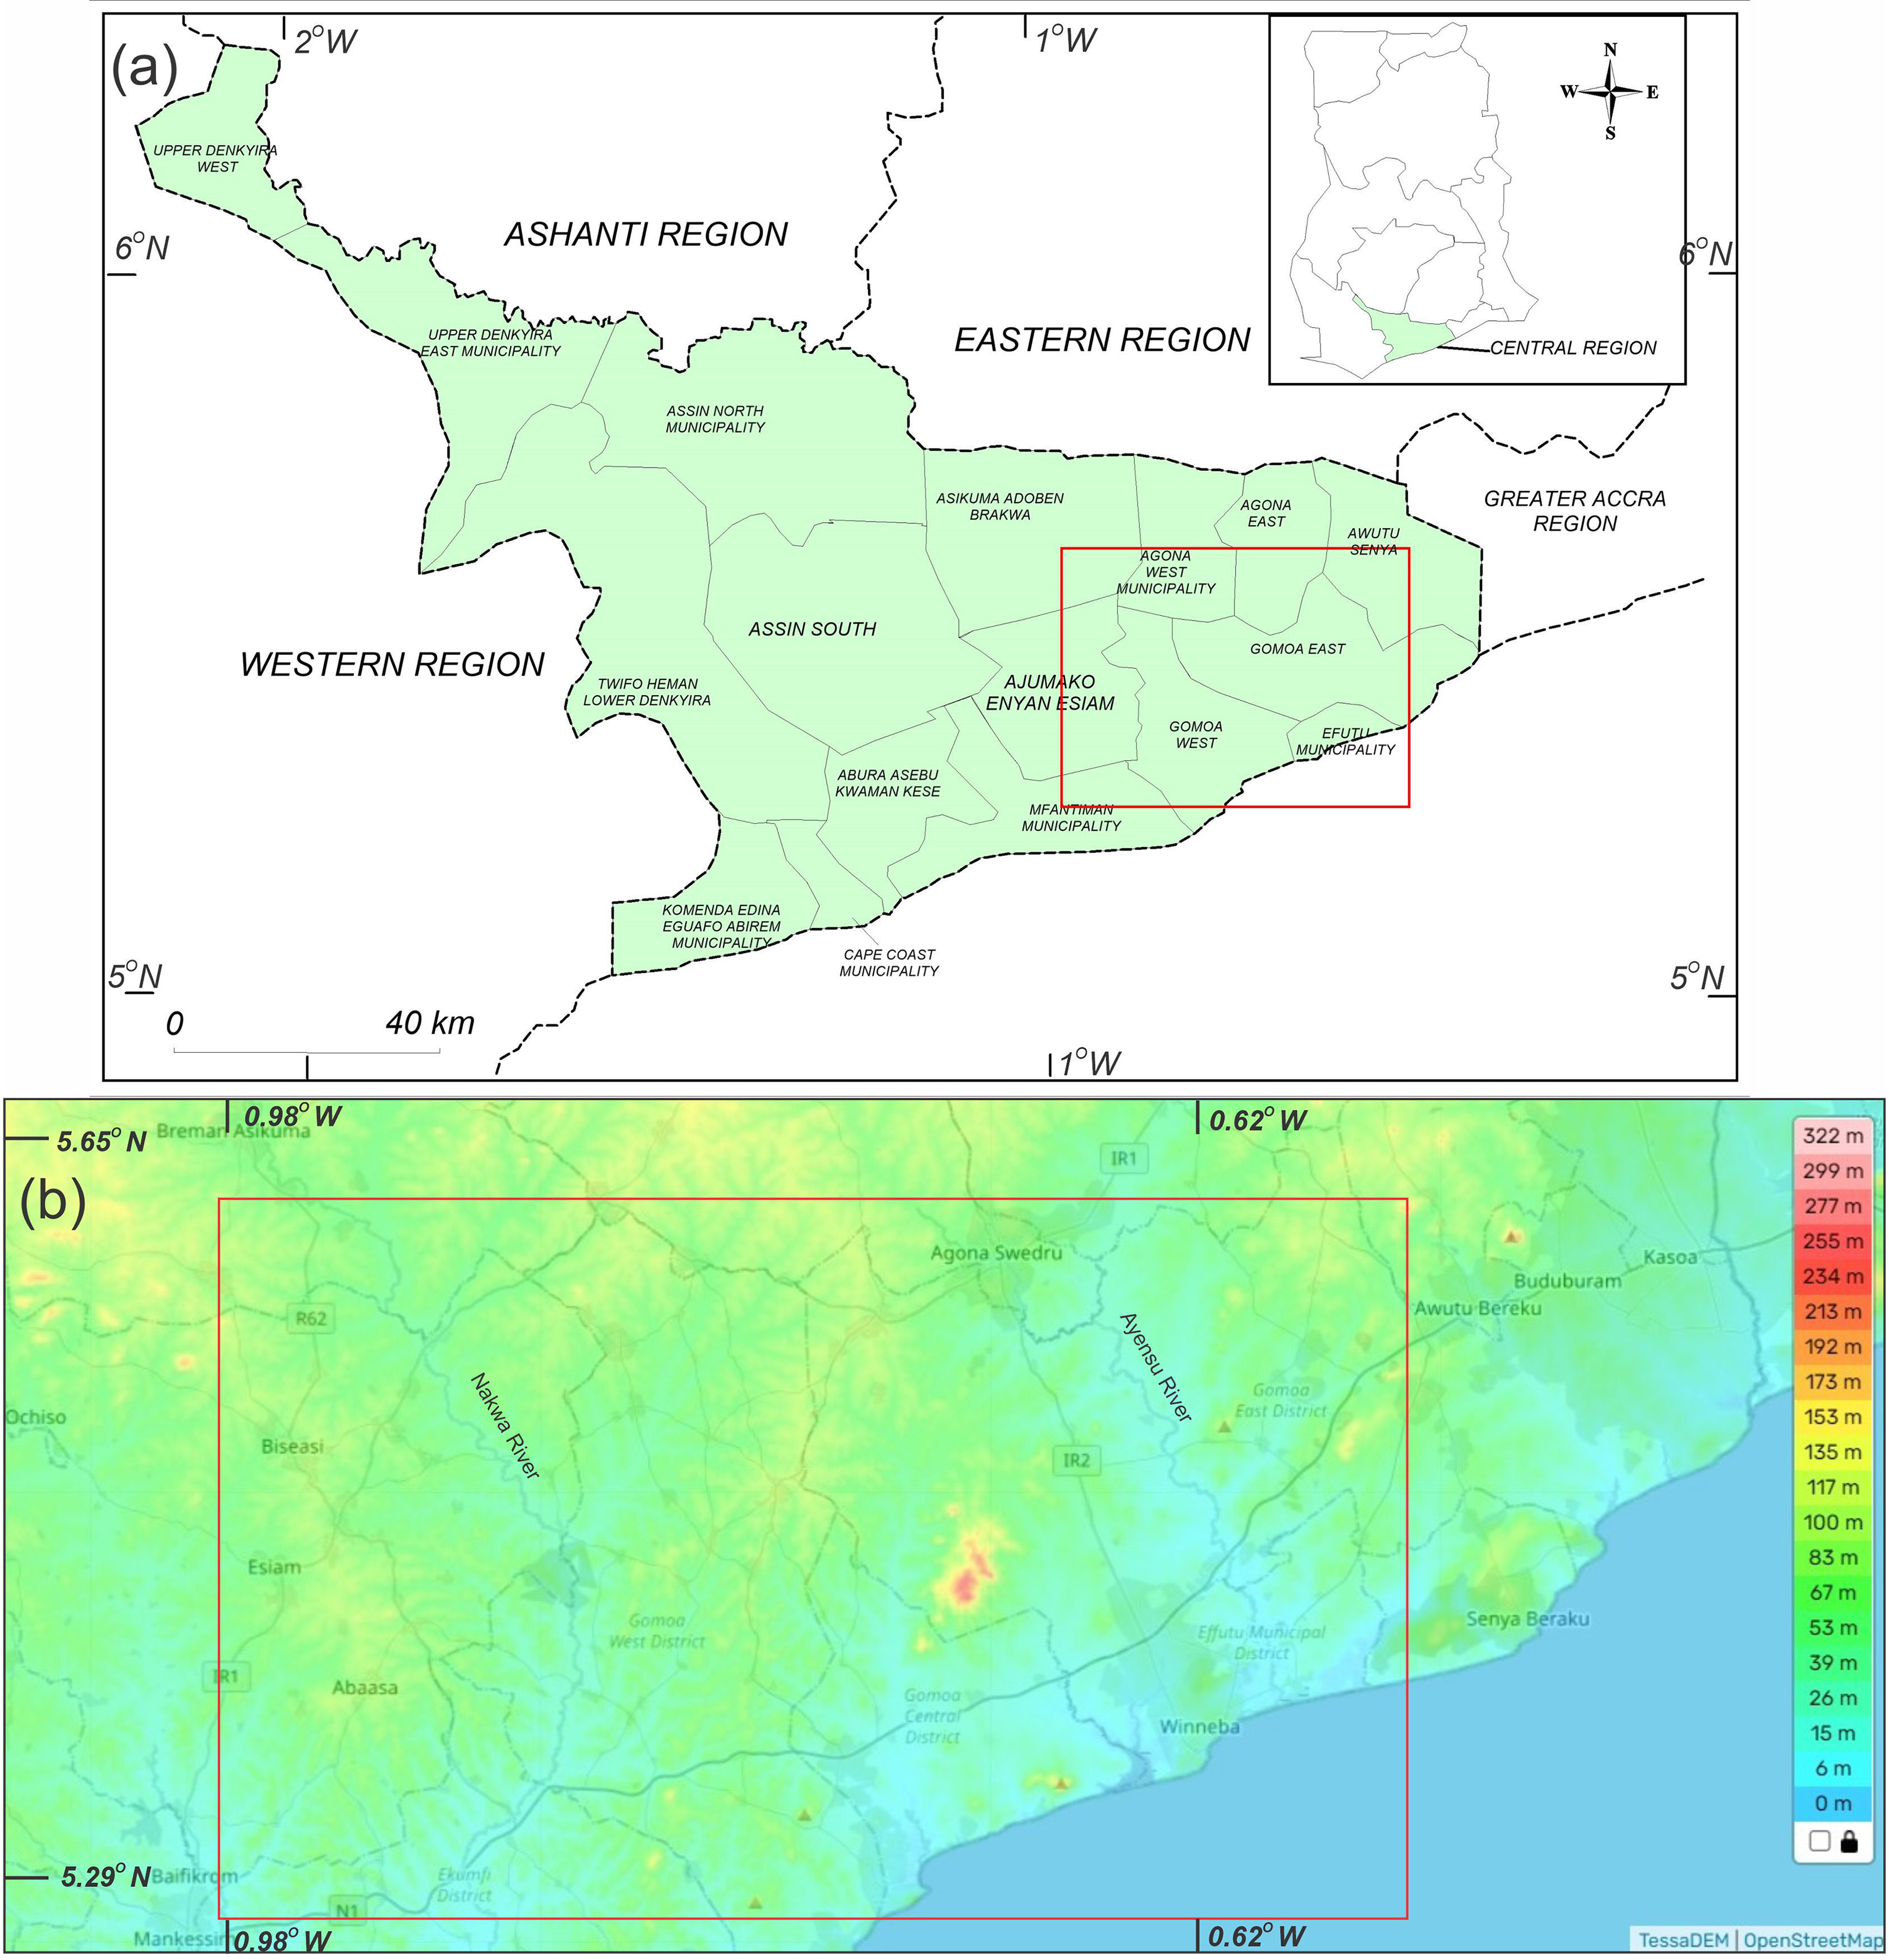
Map of (a) the central region of Ghana showing various administrative districts. (b) The digital elevation model of the study area (marked in red).
Regional geological setting
The northeast-southwest oriented Eburnean tectono-magmatic and metamorphic Kibi-Winneba greenstone belt cropping out in Ghana is part of the Birimian or Boulé-Moussi domain of the West Africa Craton. The belt (Figure 2) is bounded to the east by the Suhum basin, to the west by the Cape-Coast basin, to the south by the Gulf of Guinea’s Atlantic equatorial coast, and to the north by the Volta Basin.
29
The Kibi-Winneba greenstone belt is a belt divided into two halves (thus north and southern halves) by the granitic intrusions composed of the 2116
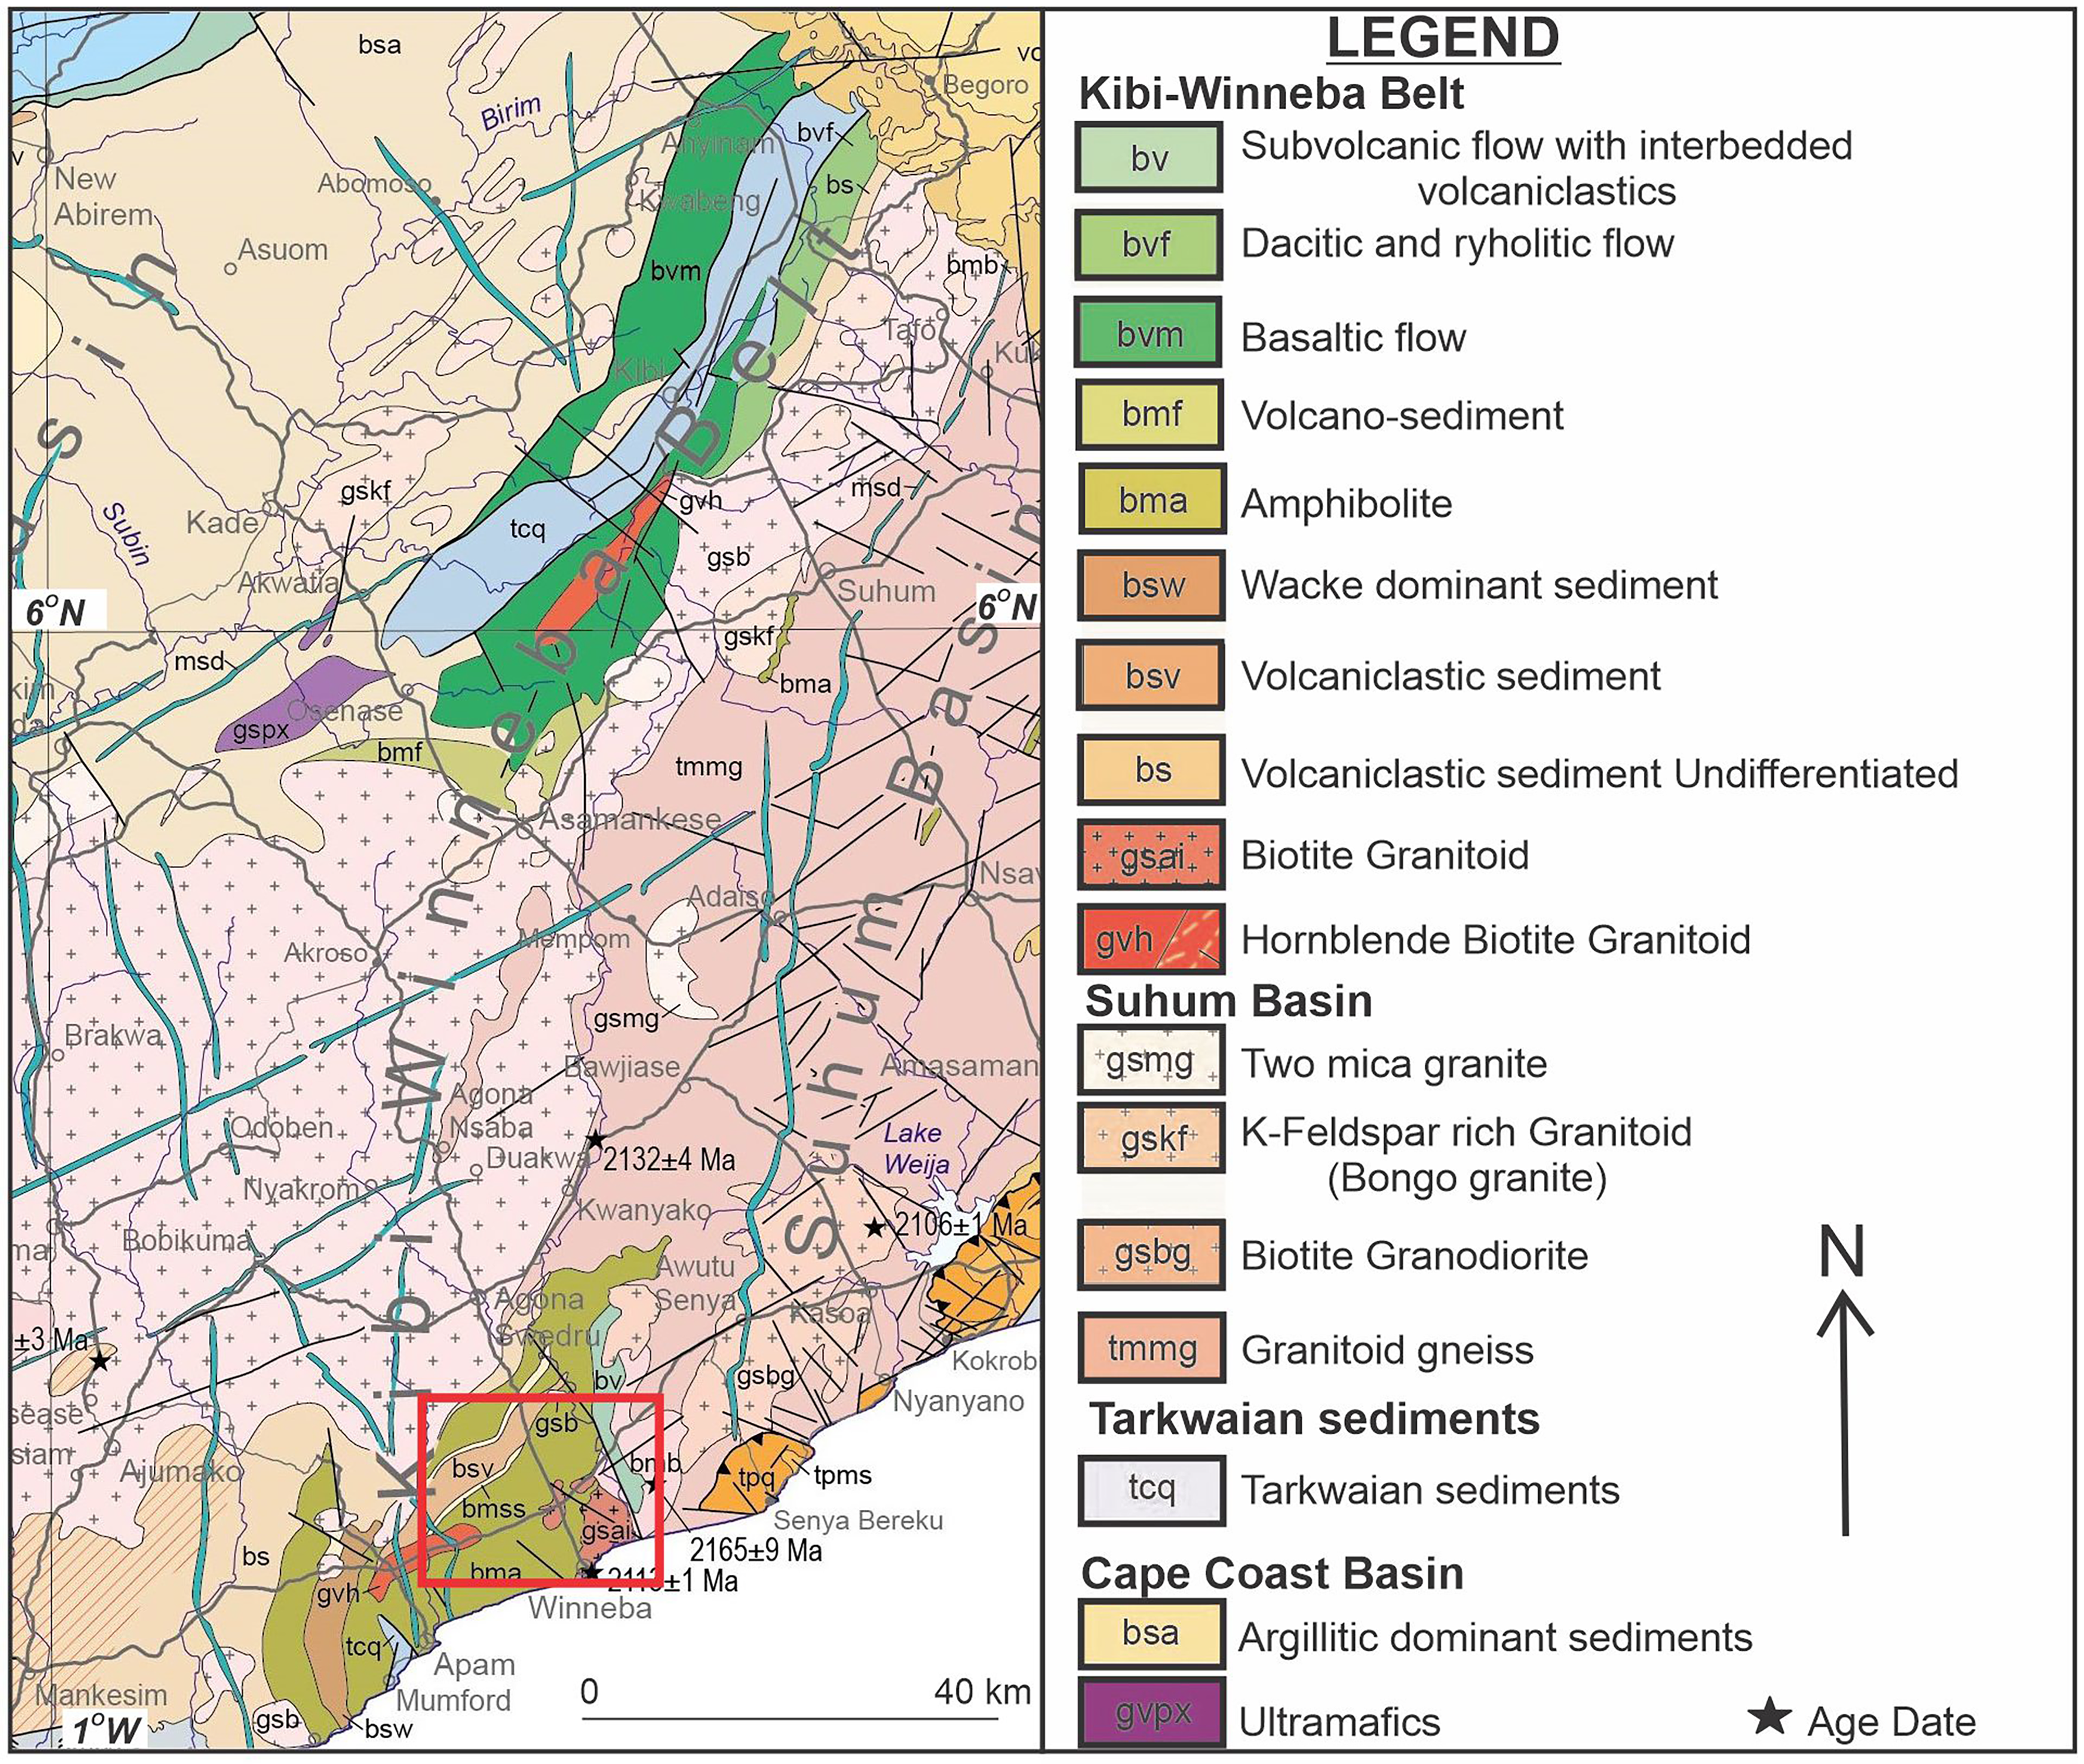
Geological map of the study area. 29
The tectonic evolution of southern Ghana, which includes the Kibi-Winneba belt, is based primarily on the work of Feybesse et al.
35
These authors invoked a polyphase tectonic framework denoted as D1 to D4 deformation event. D1 is composed of northeast-southwest shortening defined by thrust faulting around 2107 to 2097. This finite strain affected all the magmatic and sedimentary rocks deposited before that period. This period also corresponds to the deposition of the Tarkwaian sediments on the belts in southern Ghana. The rocks affected by this deformation event were metamorphosed up to a temperature between 550∘C and
Mineralisation style of the area
The primary lode gold mineralisation types associated with the rocks in the Birimian are:
The steeply (Konongo, Ashanti mines by Oberthür et al.
37
and Bepkong deposit
38
and shallow dipping (Julie deposit; Amponsah et al.
39
) quartz vein in shear zones). Disseminated sulphides (up to 5% sulphide intensity and comprises of pyrite, chalcopyrite, pyrrhotite and sphalerite) spatially associated with quartz vein in metasedimentary rocks with arsenopyrite as the host.37,38 Disseminated and stockwork mineralisation associated with granitoid. Gold mineralisation is associated with the Tarkwaian sediments.
The hydrothermal and mesothermal gold type described in 1–3 usually occurs as a micron size gold inclusion or larger grains within the fractures and the edges of the sulphides or as free gold in the fractures associated with the sulphide and usually sourced from up to 10 km deep.37,38,40 Apart from the Tarkwaian deposit which is a paleoplacer or molassic deposit mineralisation, all the other three are associated with the late Eburnean events that affected the rocks of the Birimian.41,42 Indicator minerals associated with these gold mineralisation types are galena, sphalerite, chalcopyrite, pyrrhotite, marcasite, pyrite, gahnite, jarosite, barite, quartz, k-feldspar and tourmaline, bournonite, lollingite and xenotime, chlorite and ankerite.37,38,39,43 The pathfinder elements associated with this mineralisation type associated with the metasediments are copper (Cu), zinc (Zn), lead (Pb), arsenic (As), stibnite (Sb) and the ones associated with granitoid are tellurium (Te), bismuth (Bi) and wolframite (W). By way of ore geometry, these hydrothermal quartz veins occur as a series of quartz lodes of varying thickness ranging from 5 to 50 m, which are mostly parallel to the shear zone associated with the late Eburnean deformation42,44 or strata bound gold mineralisation associated with conglomerates in the Tarkwaian. The Fluid system studied across various deposits in the Birimian in Ghana shows that gold precipitate in CO2–CH4–N2 and CO2–H2O fluids with salinities ranging from 0 to 8 wt. eq. NaCl at a temperature of 200∘C to 370∘C.38,39,40,45,46
Materials and methods
Data
Sources of data
The airborne geophysical datasets comprising radiometrics and magnetics used in this study were sourced from the Ghana Geological Survey Authority, satellite gravity data from the GFZ German Research Centre for Geoscience (www.gfz-potsdam.de), Landsat 8 OLI data was sourced from the United States Geological Survey Earth Resources Observation and Science Center) and the Southern Kibi-Winneba belt 1:100,000 digital geological map was compiled by Agyei Duodu et al. 29 The Landsat 8 OLI is made up of nine bands with Level 1 processing applied. The airborne radiometric data was supplied with the channels of the three naturally occurring radioactive elements comprising uranium (eU in ppm), thorium (eTh in ppm) and potassium (K in %). The total magnetic intensity (TMI) grid (in nT) and Bouguer anomaly grid (in mGal) were derived from the airborne magnetic data and satellite gravity data, respectively.
Data preprocessing
Prior to employing the RF classifier to execute ML-based training and evaluation, the input data (predictors and target labels) were projected to WGS84 UTM Zone 30 N. Six thematic layers comprising B4/B2, B4/B3, B4/B7, B6/B2, B6/B7 and B6/B5 The RTP and AS predictors are capable of delineating highly magnetic anomalous responses, which could be due to indicator minerals such as arsenopyrite, pyrite and magnetite.9,27 FVD and Frac_Den predictors are capable of outlining various structures such as faults, joints, folds and contacts that are likely to host mineralisations.
49
In the determination of bulk mineral deposits which have inclusions of arsenopyrite, pyrite and chalcopyrite, the gravity predictor serves a good purpose in that regard.
50
Radiometric responses are essentially dependent on the occurrence of mineral species that contain one or more of K, eTh and eU. Thus, eU and eTh are observed in quartz and other rock-forming minerals.
51
For the ratios such as K/eTh and eU/eTh, their significance is observed in the delineation of zones of hydrothermal alteration occurrence, with relevance towards mineralisation within the study area. The remote sensing generated bands comprising B4/B2, B4/B3, B4/B7, B6/B5 First scenario: Classification using layers derived from geophysical datasets (AS, FVD, Frac_Den, RTP, RG, K, eTh, eU, K/eTh ratio and eU/eTh ratio). Second scenario: Classification using layers derived from remote sensing datasets (B4/B2, B4/B3, B4/B7, B6/B2, B6/B7 and B6/B5 Third scenario: Classification using all 16 layers obtained from geophysical and remote sensing layers.
The predictors (derived from the geophysical, remote sensing and geological datasets) were cropped to the desirable study area extent and were subsequently resampled to a cell resolution of 100 m (resulting in a grid of size 491
The essence of generating an MPM based on each of these aforementioned scenarios is to determine which dataset’s predictors perform better in delineating prospective zones of mineral occurrences within the study area.
Preparation of target labels
When training and testing a predictive model, target labels describing the occurrence and non-occurrence of a certain mineral deposit are given values 1 and 0, respectively. This is because the occurrence of a mineral deposit over a region of interest is dichotomous. 55 In the Southern Kibi-Winneba belt, 78 known locations of the gold mineral deposit were reported based on information obtained by Newmont Ghana Limited and Geodita Resource Limited.56–60 In this study, the point pattern analysis sampling technique was employed to determine the optimal distance beyond which the locations of non-gold (sterile) occurrences should be situated. This technique was employed in this study due to its usefulness in visualising and interpreting the spatial distribution of the point patterns of the known locations of gold occurrences. Based on the point pattern analysis sampling procedure which has also been employed by Carranza et al. 12 and Zu and Carranza, 16 the various locations that are sterile to gold occurrence, which characterise locations of non-gold deposits, were chosen for this investigation. According to this procedure, the number of sterile gold occurrence locations selected should be the same as the number of gold occurrence locations. This eliminates potential problems with data imbalance that can have an impact on a predictive model’s training and testing outcomes. Additionally, it is believed that areas adjacent to proven gold deposit locations have a higher likelihood of developing the same mineralisation style or circumstances. In this regard, it is important to select these gold-sterile sites well away from proven gold deposits. In this study, the use of the point pattern analysis technique was crucial in determining the ideal distance from which different locations of gold-sterile deposits may be formed. Due to this, the maximum distance between any two locations of confirmed gold occurrences was statistically determined using the closest neighbour analysis technique. A value of 2262 m was obtained for the maximum distance, indicating that there is an optimal likelihood of defining gold occurrences within its 2262 m radius for any of the gold deposit locations. It is important to note that, within the statistically computed maximum distance, only a few locations can be selected; hence, a buffer distance of 1893 m indicates a region where there is 83.7% likelihood of identifying another gold deposit that is in a close range in relation to a particular known gold occurrence was selected. The final step in this procedure suggested by Carranza et al. 12 and Zuo and Carranza 16 stipulate that the occurrence of a mineral within a given region is spatially distributed in a clustered fashion owing to the premise that mineral occurrence is scarce and characteristically bonded to a systematic ore-forming process. In contrast to this, various locations of gold-sterile deposits selected ought to be spatially distributed in an unsystematic manner as they ensued from common geological processes. From the aforementioned procedure outlined, non-deposit (gold-sterile) locations within the study area were selected randomly as part of the target labels. In this study, 80% of the target labels (with an equal number of gold occurrences and non-occurrences) were used to train the RF model whereas the remaining 20% was used to test the performance of the model produced. The splitting of the target labels into training and testing labels was carried out using the splitting procedure outline by Le Rest et al., 61 which is referred to as the spatial leave-one-out cross-validation approach. By employing this procedure, issues that pertain to spatial autocorrelation are taken care of.
RF algorithm
The RF algorithm, which was first proposed by Ho 62 and later developed by Breiman 63 is a reliable and robust ML algorithm for carrying out classifications. It has numerous applications in geospatial studies for geological modelling64,65 as well as predictions for mineral2,66 and groundwater67,68 The fundamental principle underlying the RF approach has been extensively documented in various works of literature69–72 The RF algorithm is a conglomerate of several decision trees; each tree is a collection of multiple bootstrap samples that are created by original samples (referred to as bagging). During bagging, many new values of training data area created by resampling the original data in a random fashion. A bootstrap sample is employed to construct each individual tree within the decision tree, whereby a subset of various attributes are selected at each node of a tree. 73 In this study, the Gini index was deemed as the optimal parameter during the implementation of the RF algorithm in python programming language to determine the impurity of an attribute with respect to various prospectivity (target) classes involved based on the grid-search cross-validation approach.
Training and evaluating RF classifier
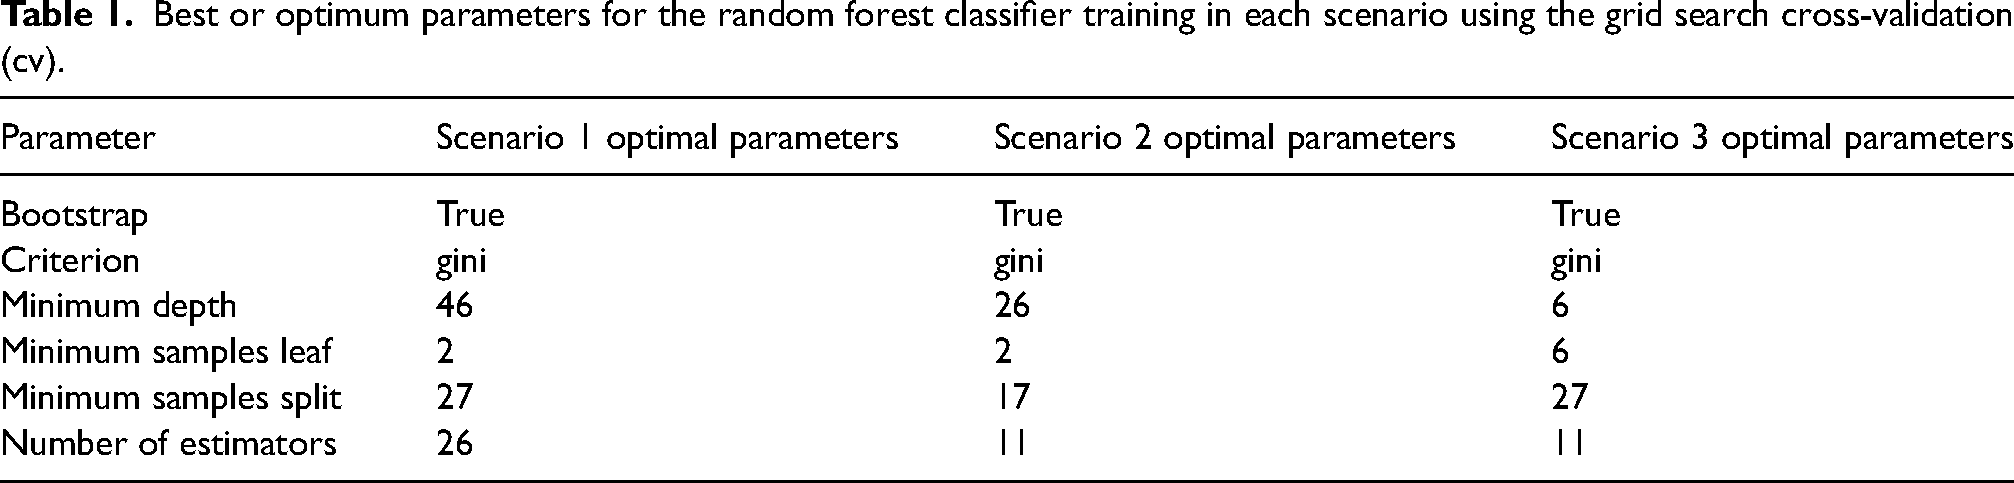
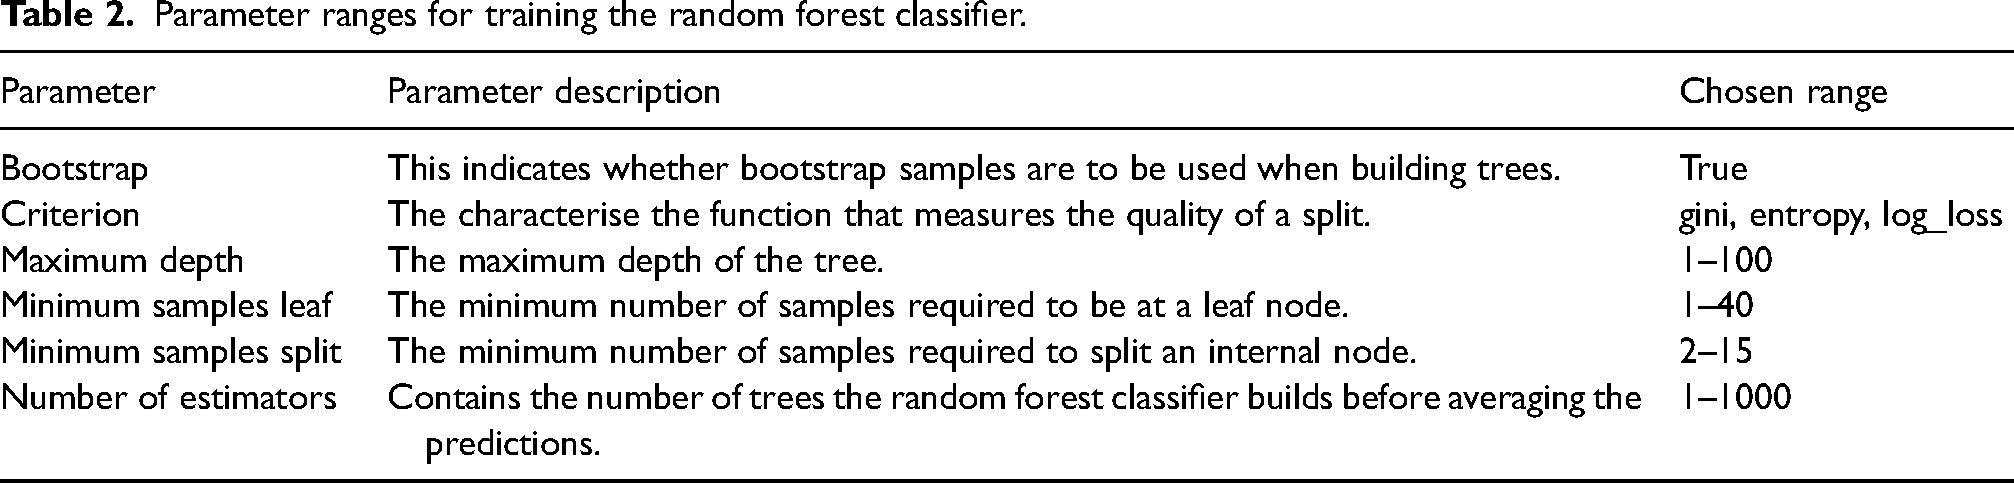
A training process was carried out to generate the RF-based ML model after preparing the input data, which included predictors and target labels. A critical stage in training an ML model is determining the key parameters that will be used to generate a model with high accuracy. However, it is important to note that in data-driven modelling, the specification of the aforementioned parameter based on a suitably deduced configuration is extremely difficult due to the premise that obtaining optimal parameters for ML models changes depending on the nature of the input data employed. This is sufficient to show that there is no universally recognised empirical procedure that must be followed in order to arrive at appropriate parameters that best fit a predictive model developed. In this study, the grid search cross-validation (cv) approach otherwise known as grid search cv was implemented to determine the optimal parameters (shown in Table 1) for each scenario based on a particular range of values chosen based on literature (shown in Table 2). These optimal parameters were subsequently used to generate the predictive models in each of the aforementioned scenarios. A 10-fold cross-validation method using the best parameters found using the grid search cv technique was used to evaluate the effectiveness of the classification performed using the RF classifier.
Best or optimum parameters for the random forest classifier training in each scenario using the grid search cross-validation (cv).
Parameter ranges for training the random forest classifier.
In carrying out predictive modelling, it is also important to ascertain the influence of each of the predictors used towards the model created (known as feature importance). In this study, the determination of the importance of each of the predictors used was determined based on the optimum (best) parameters determined by the grid search cv technique. The feature importance depicts the contribution of each predictor towards the predictive model generated. The feature importance (
Based on the RF approach, the final feature importance is computed based on equation (3):
In geospatial modelling, predictive models generated should be evaluated to convey confidence in the outputs produced.
74
In this regard, the efficacy of the MPM generated based on the RF algorithm was evaluated using the receiver operating characteristics (ROC) curve to ascertain how the known gold occurrences and the mineral predictive model generated spatially correlate. An ROC curve visualises and measures the performance of a classification model based on its rate or correct and incorrect classifications. The precise trade-off between the false positive rate and the true positive rate is also determined by the ROC curve. For well-balanced target labels, the use of the ROC curve is more appropriate. A typical ROC curve features the true positive rate, which is analogous to 

Results and discussion
Importance of the thematic layers towards the generation of the MPMs
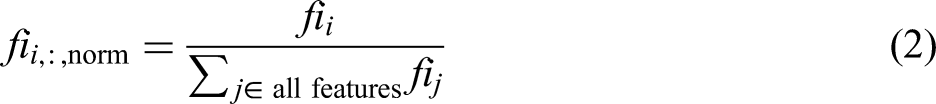
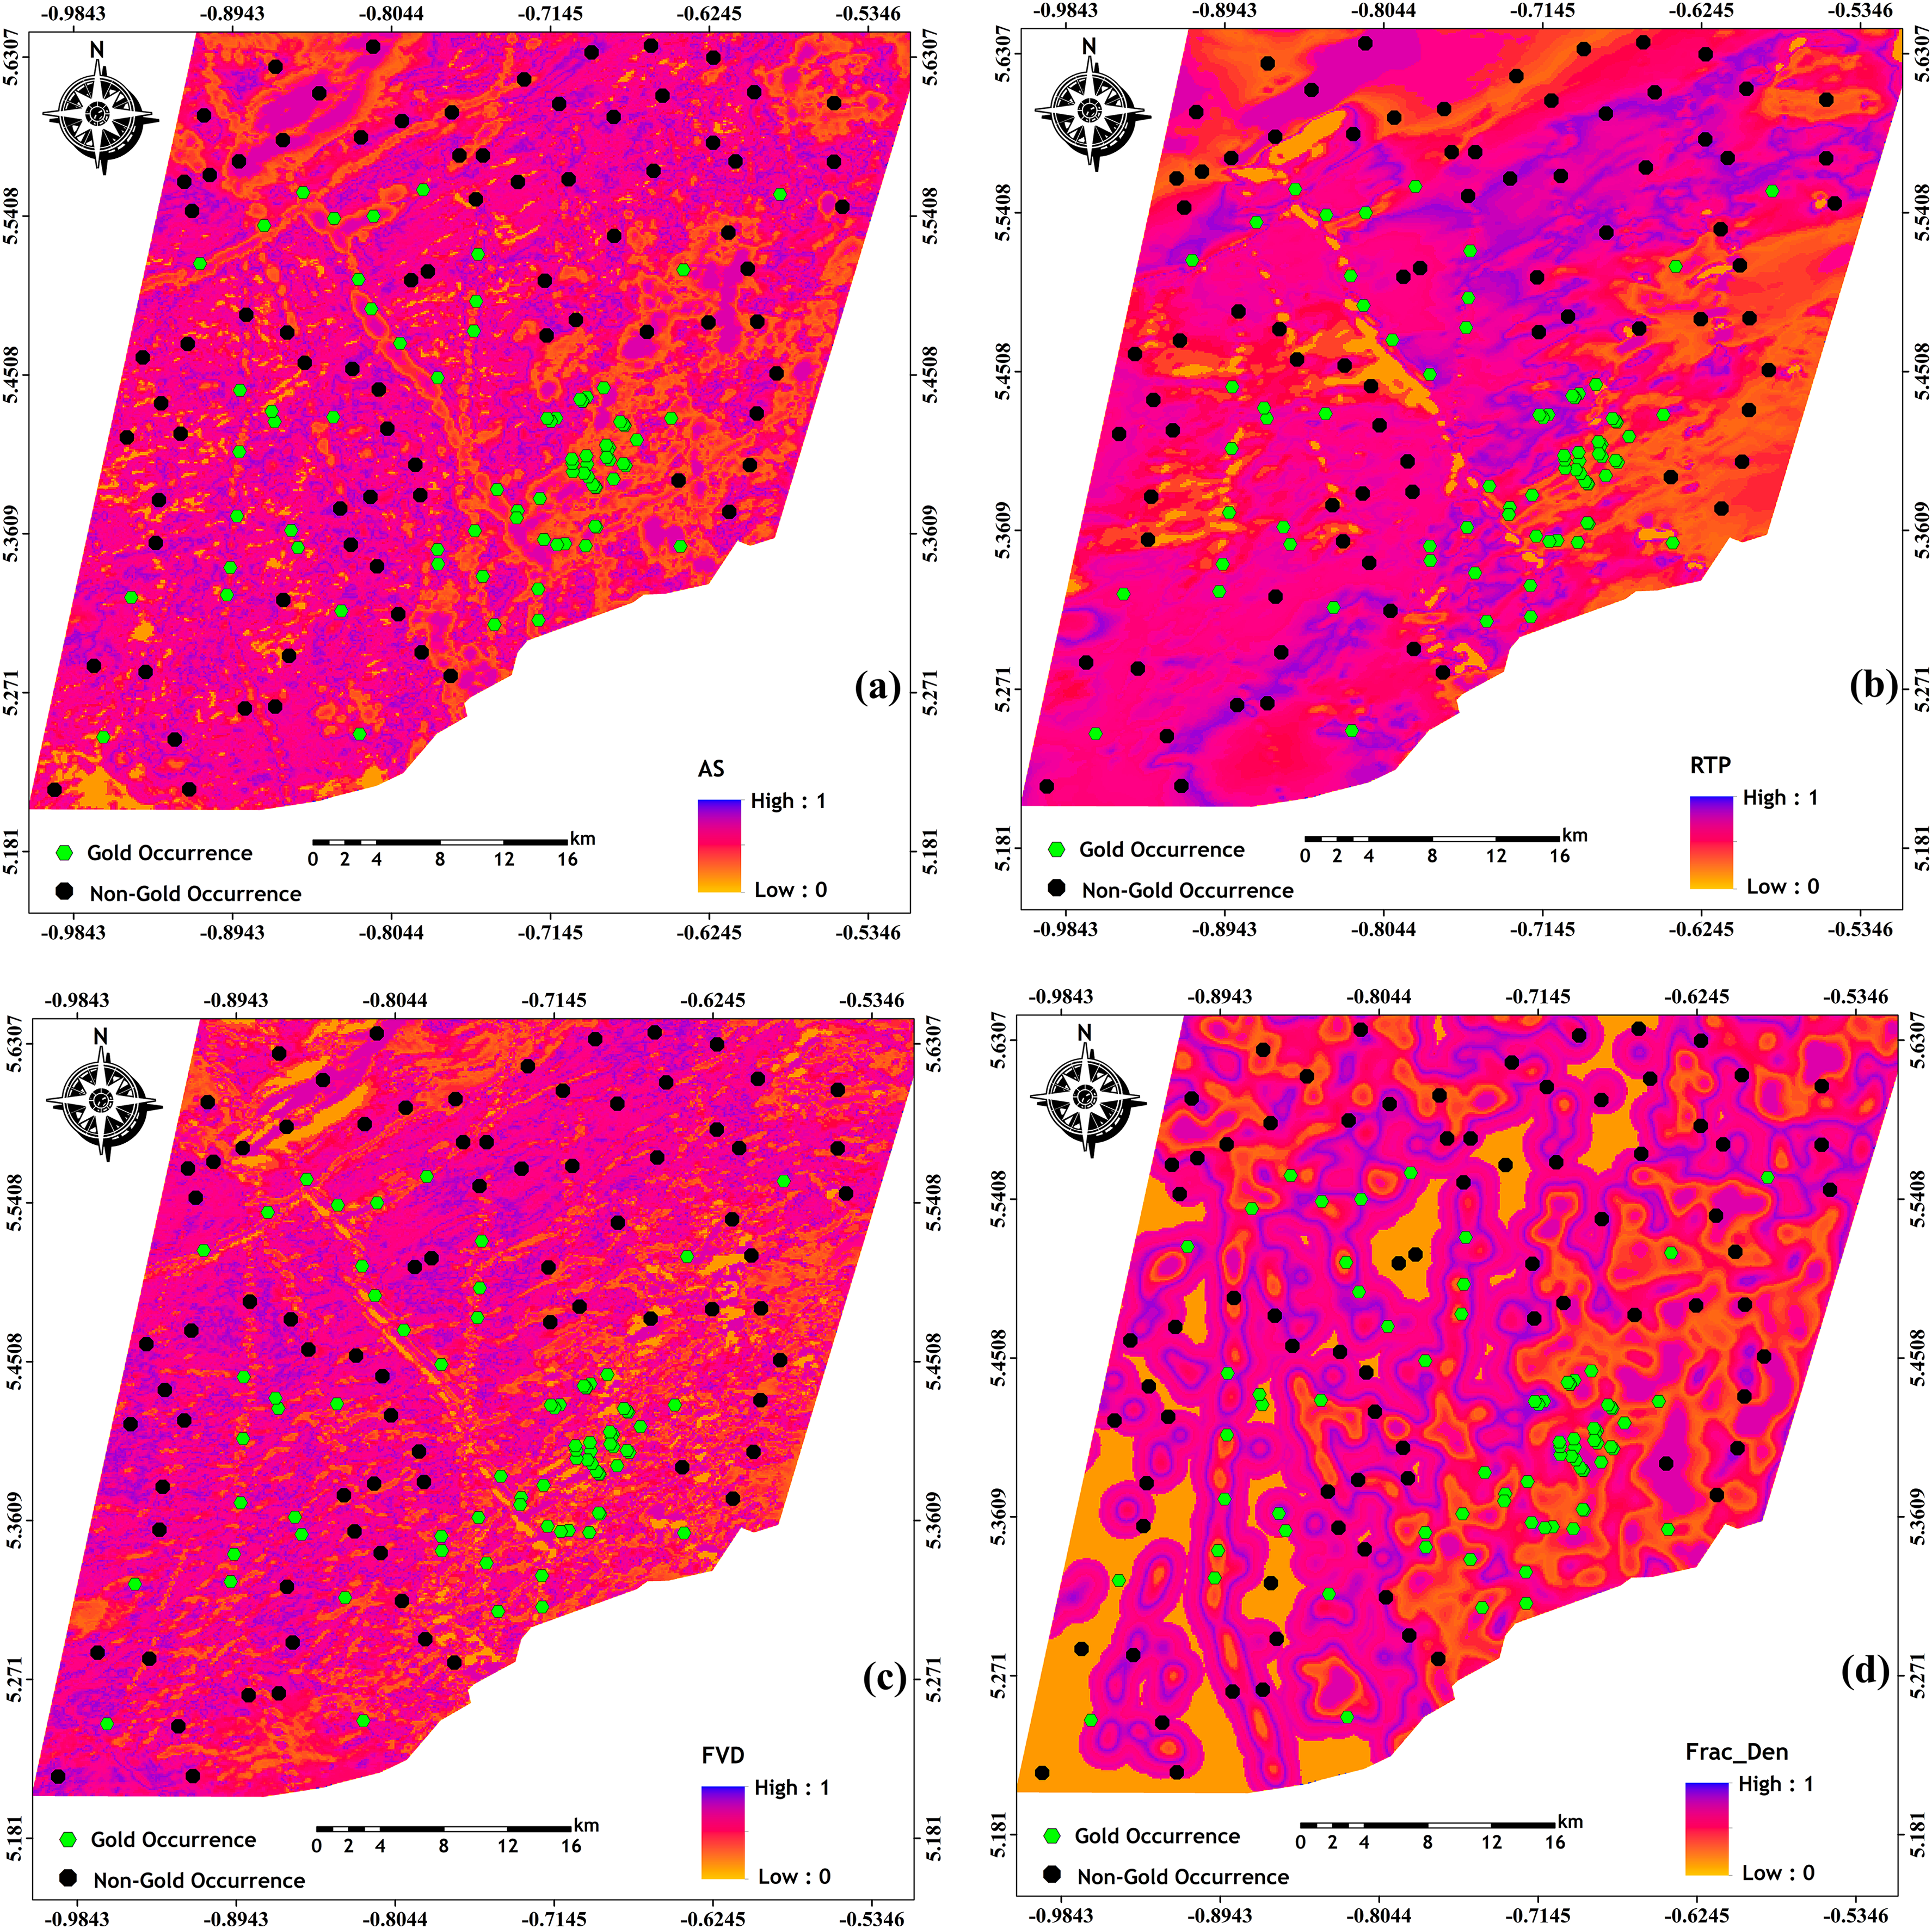
Feature importance constitutes how much a particular geoscientific conditioning parameter is essential when carrying out mineral potential zonation. To assess the contribution of each of the features or thematic layers (Figures 3(a) to (d), 4(a) to (f), and 5(a) to (f)) towards the MPMs produced in each of the scenarios. As suggested by Breiman, 63 the relevance of a thematic layer is obtained by permuting its corresponding values after training it based on an RF classifier. Figure 6 illustrates the importance of each of the geophysically derived thematic layers that served as input for the generation of the MPM in the first scenario. By using only the aforementioned geophysically-derived layers as input features for the RF-based MPM, the K/eTh ratio layer was the feature with the most influence; followed by analytic signal, first vertical derivative, uranium concentration, eU/eTh ratio, thorium concentration, fracture density, RG, potassium concentration and RTP layer in a decreasing order of influence. In the case of the second scenario, where remote sensing layers were used as input features to produce an MPM, band ratio B6/B2 had the highest feature importance and thus its contribution towards the MPM produced is the highest as shown in Figure 7. Conversely, the feature importance of the B4/B3 ratio was the least, an indication of its influence towards the predictive model being the lowest. In the third scenario (shown in Figure 8), where both the geophysical and remote sensing layers were integrated to produce the MPM, the potassium/thorium ratio layer was observed as the feature with the highest importance towards the MPM, whereas the band ratio B4/B7 had the least influence on the model generated. K/eTh ratio being the feature with the highest relevance towards the MPMs produced in this instance corroborates with literature assertion that regions with K increasing and eTh decreasing indicate the prevalence of alteration in mineral ore deposits within the southern Kibi-Winneba belt 50 . Thus, regions delineated as prospective zones of gold mineralisation occurrence within the southern Kibi-Winneba belt in the first and third scenarios, where K/eTh was used as an input feature generally exhibited high values of K/eTh ratios.
Normalised image of (a) analytic signal layer, (b) RTP layer, (c) FVD layer and (d) fracture density layer. RTP: reduction to pole; FVD: first vertical derivative.
Normalised image of (a) eTh concentration layer, (b) eU/eTh ratio layer, (c) eU concentration layer, (d) K concentration layer, (e) K/eTh ratio layer and (f) residual gravity layer.
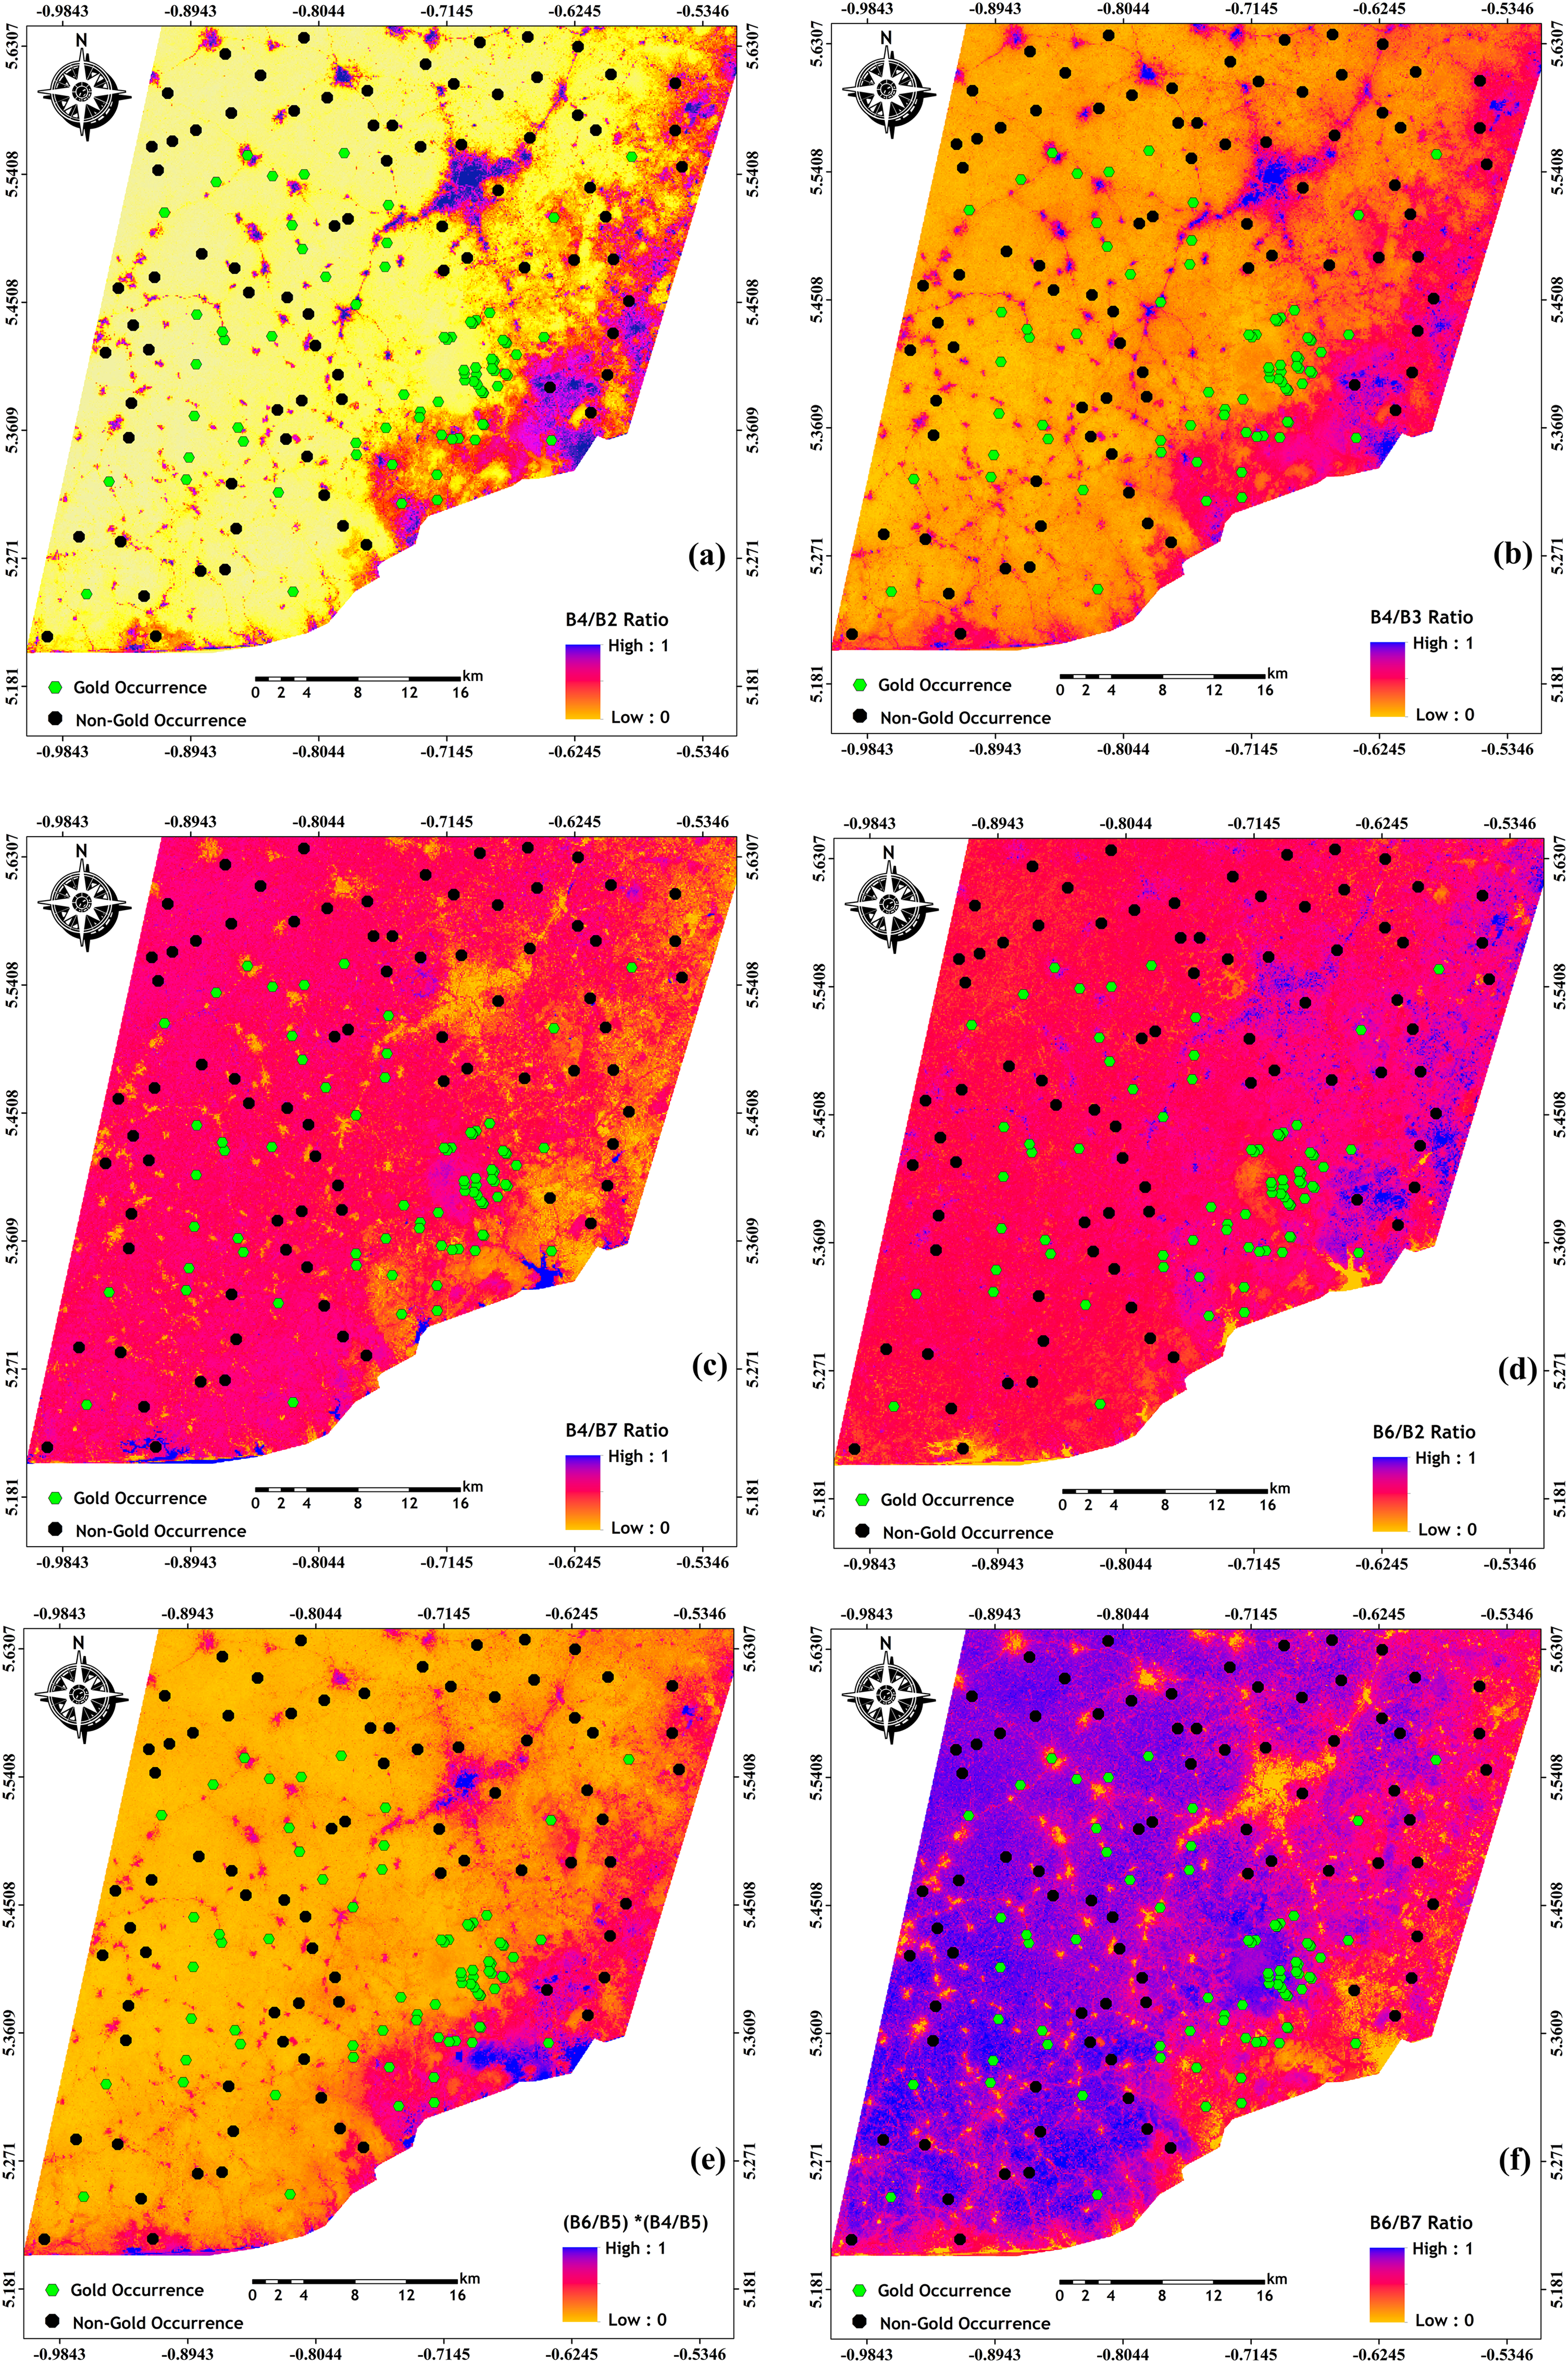
Normalised image of (a) Band 4/Band 2 layer, (b) Band 4/Band 3 layer, (c) Band 4/Band 7 layer, (d) Band 6/Band 2 layer,
(e) Band 6/Band 5
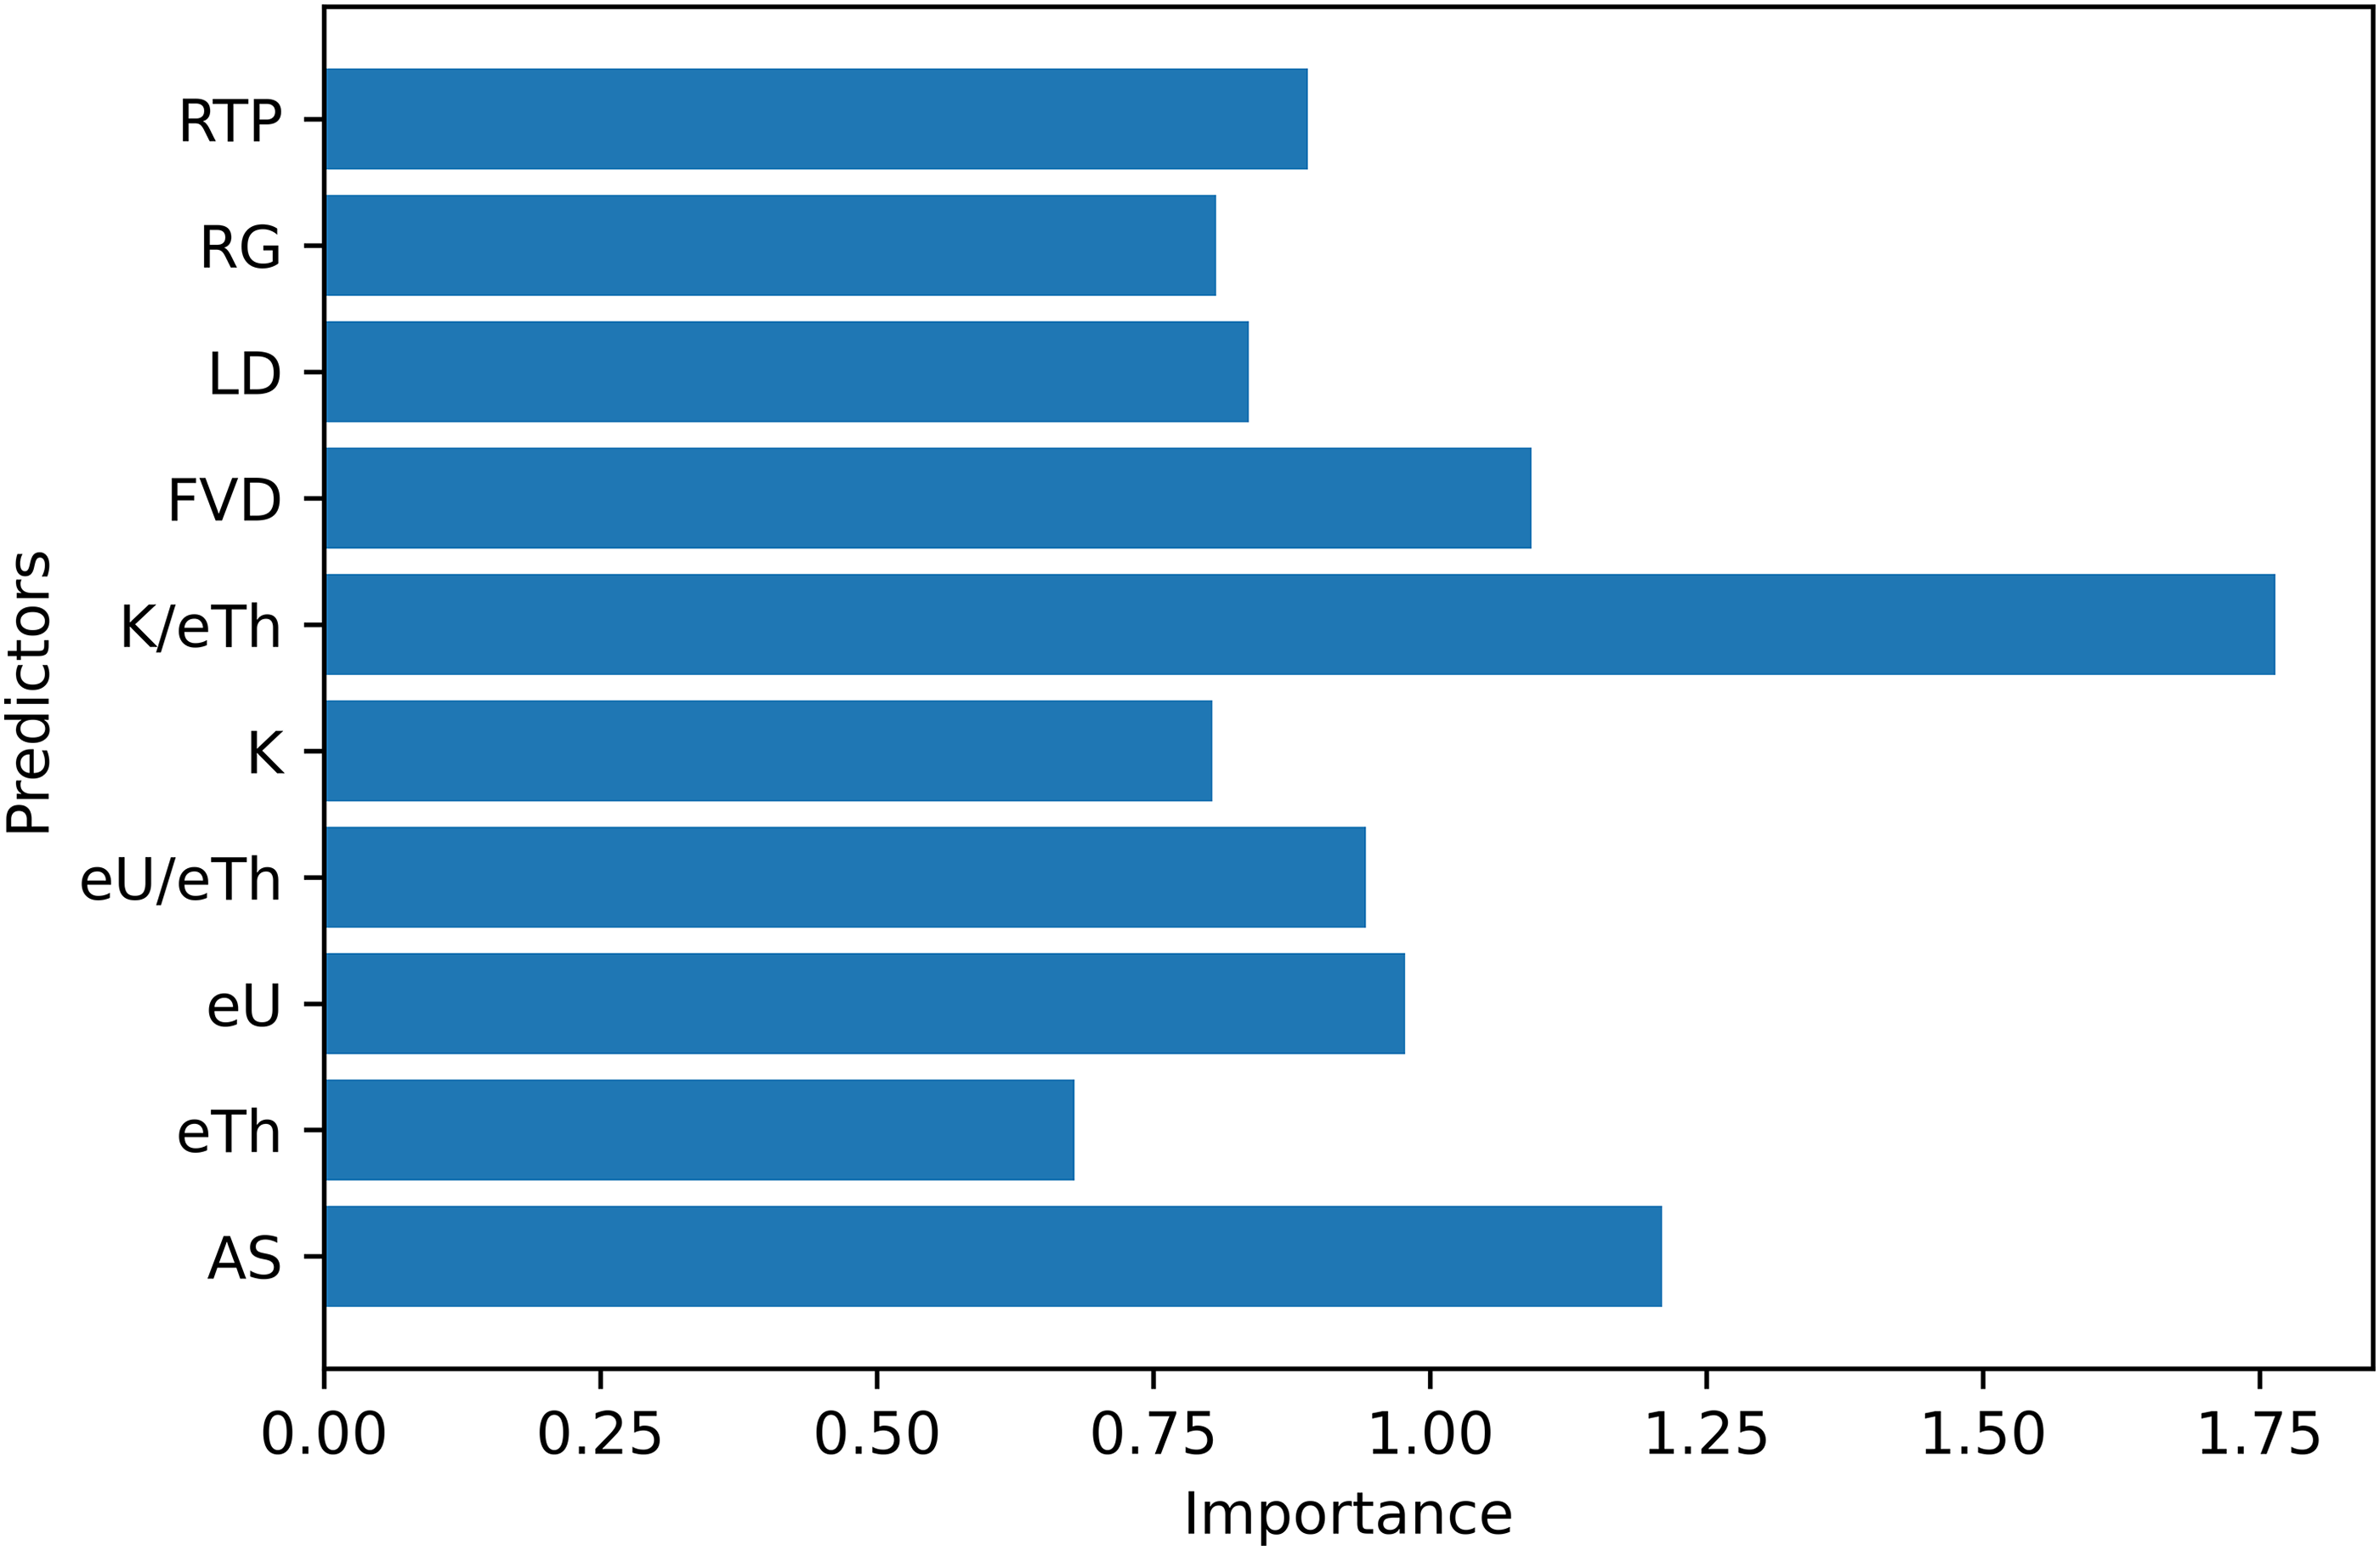
Feature importance of the predictors in the first scenario.
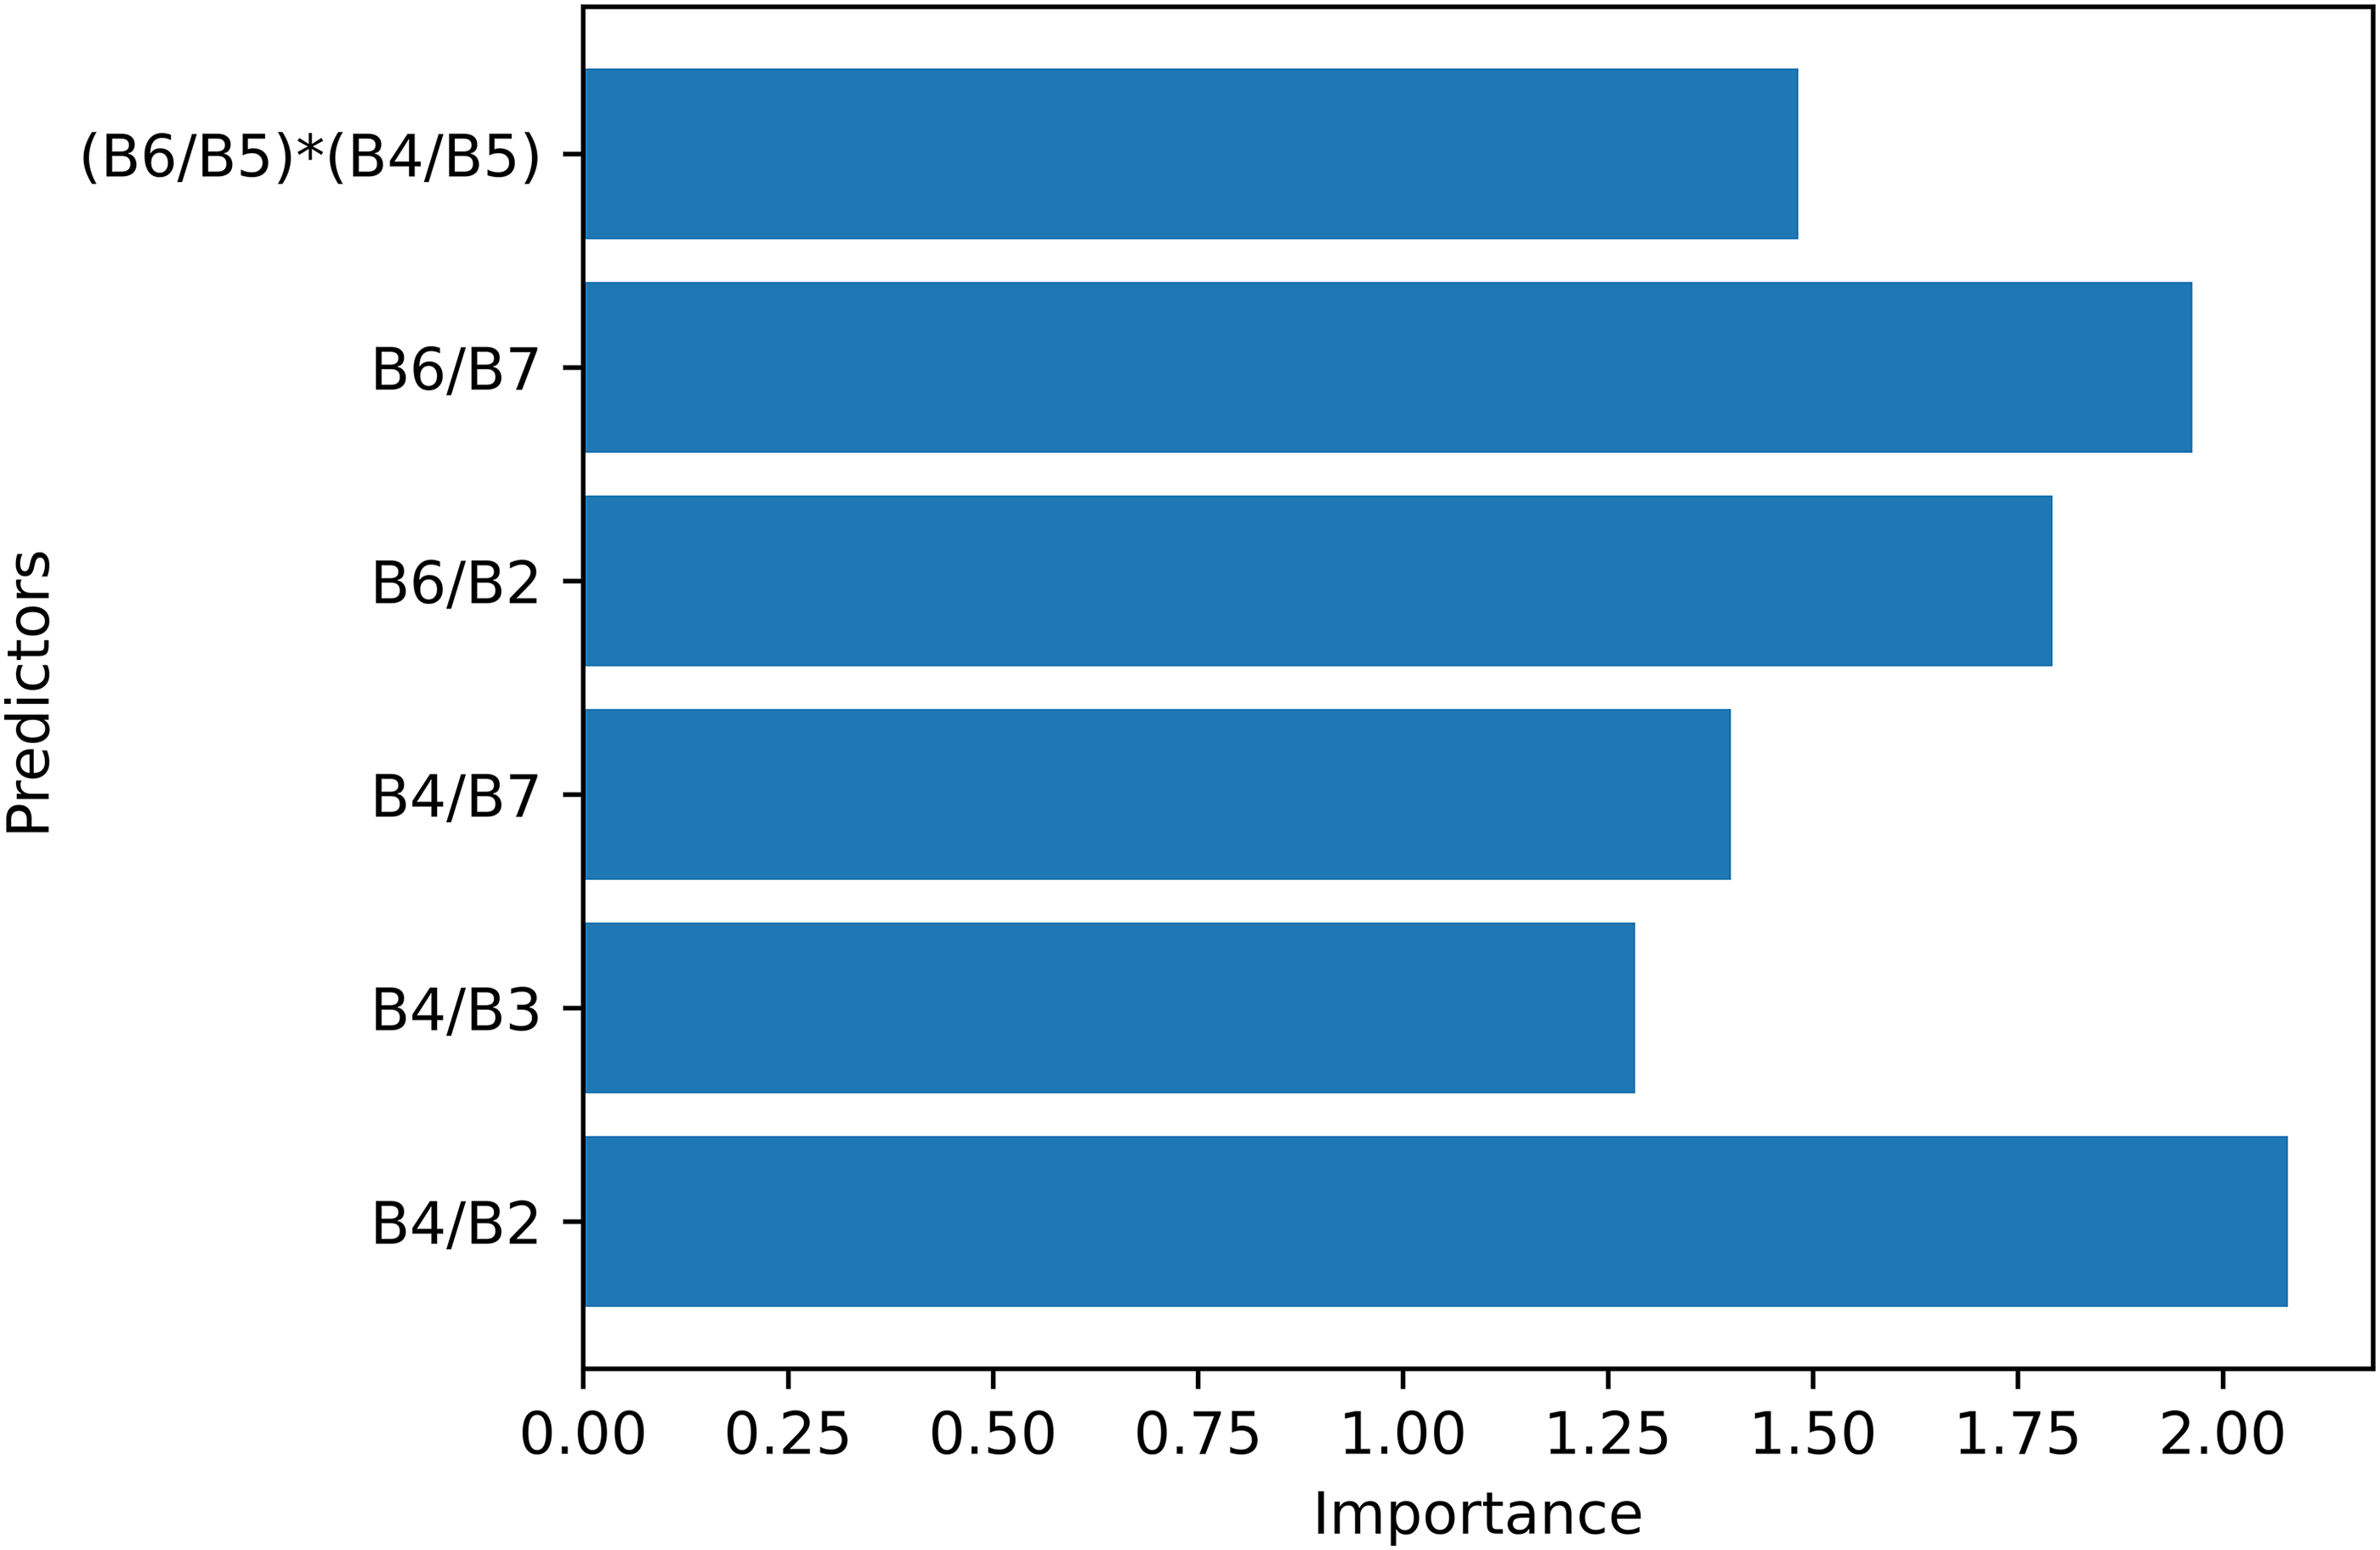
Feature importance of the predictors in the second scenario.
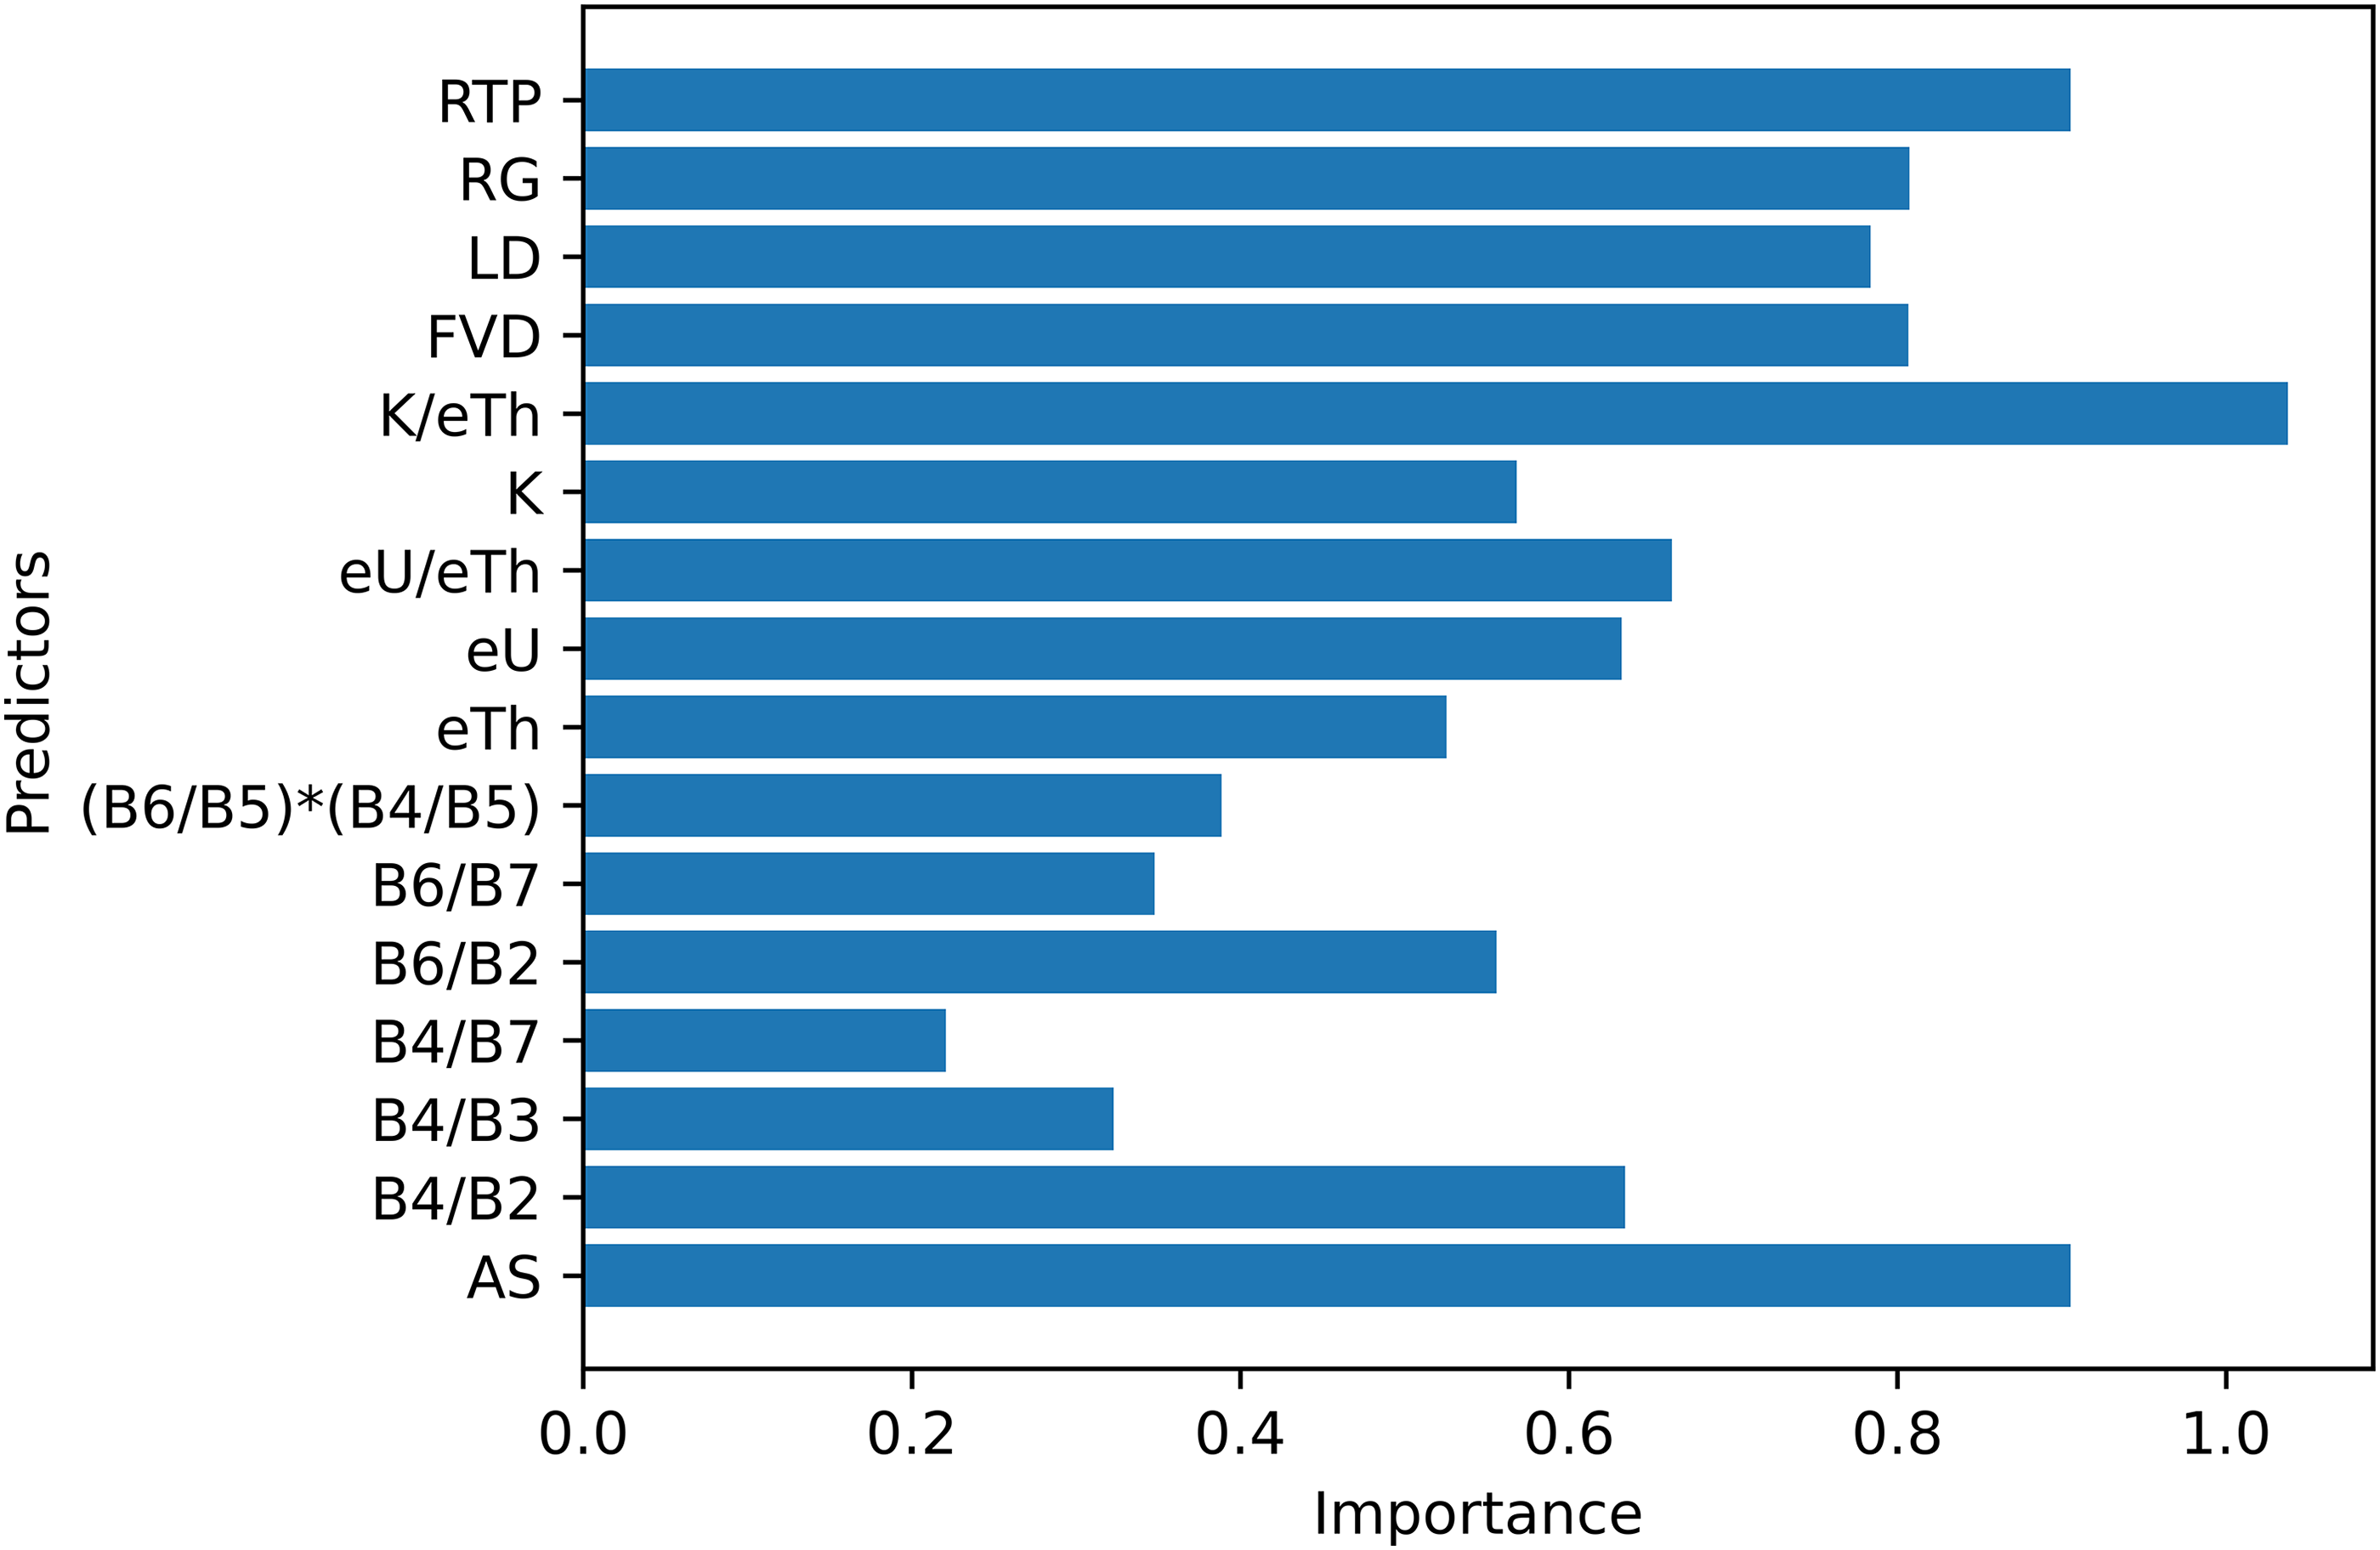
Feature importance of the predictors in the third scenario.
Mineral prospectivity models
In order to create a predictive model that outlines the prospective and non-prospective classes over the southern Kibi-Winneba belt, the RF classifier was employed by using geoscientific thematic layers in the aforementioned three scenarios (based on only geophysical (GP) layers, only remote sensing (RS) layers and both GP and RS layers). Figure 9(a) to (c) depicts the MPMs generated by the RF classifier using only the geophysically derived layers, only remote sensing-derived layers and layers derived from both geophysical and remote sensing layers respectively. In the case of the first scenario (Figures 9(a)), where only geophysical layers were used for the classification, 20.17% representing an area size of 386.93 km2 was delineated as the prospective class of gold mineralisation over the study area as shown in Table 3. The regions delineated as prospective classes were observed to be predominant over the southeastern and the northern northwestern portions of the study area. For the MPM produced based on only the remote sensing layers (Figures 9(b)), the areal extent of the regions delineated as prospective and non-prospective were, respectively, 540.03 km2 and 1378.30 km2, representing respectively 28.15% and 71.85% of the total areal size of the study area. For this remote sensing scenario, prospective classes of gold mineralisation were observed to dominate the central and eastern portions of the study area. For the third scenario where the MPM was produced based on the synthesising of all layers derived from geophysical and remote sensing datasets (Figures 9(c)), it was observed (as shown in Table 3) that 22.11% of the study area, which is analogous to an area extent of 424.14 km2 was delineated as the prospective class with gold mineralisation. Regions delineated as prospective of gold mineralisation based on the RS layers were very profound in the eastern and north-western portions of the study area.
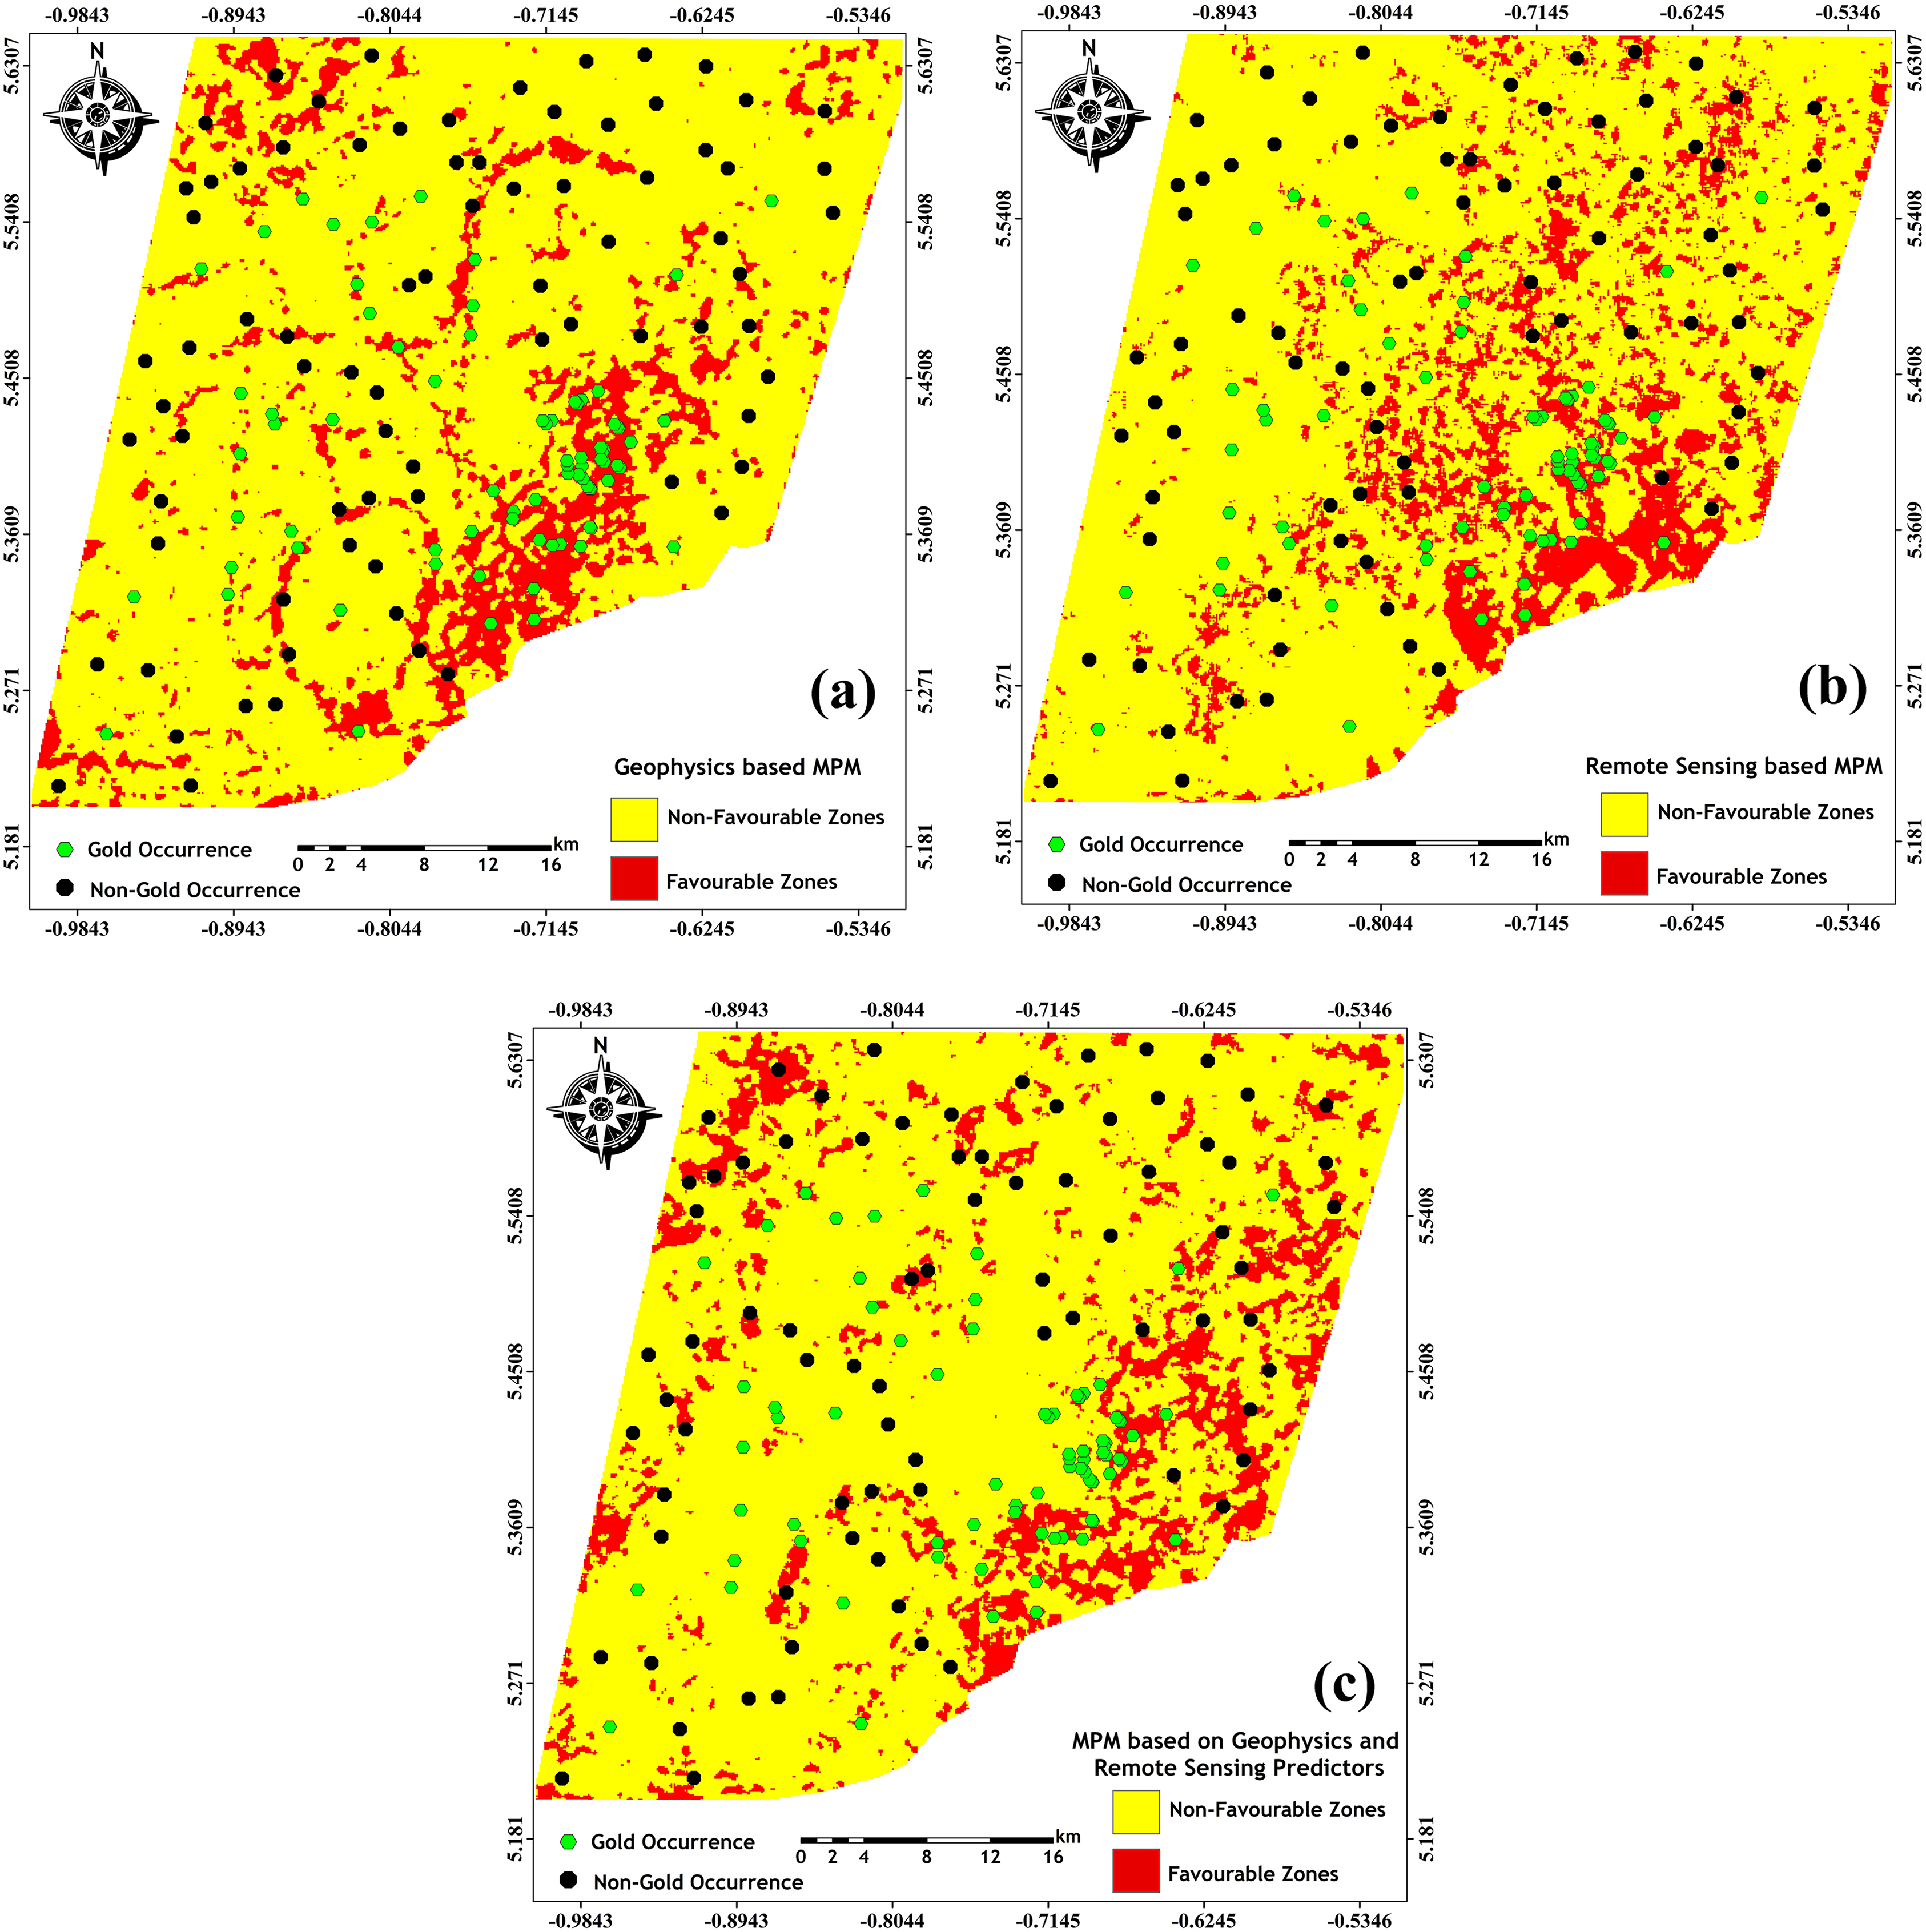
Mineral prospectivity model (MPM) produced in the (a) first scenario, (b) second scenario and (c) third scenario.
Area extent and percentage of mineral prospectivity classes.
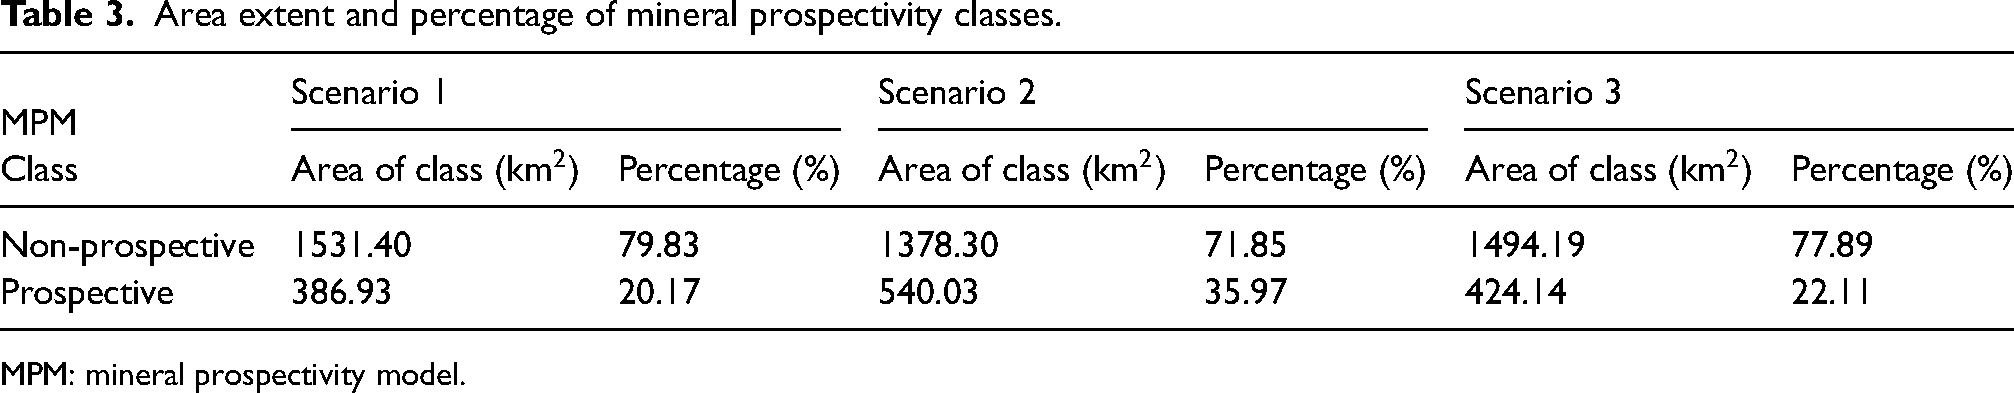
MPM: mineral prospectivity model.
Evaluation of the MPMs
Predictive models produced are only worthy for consideration of any meaningful decision-making when they have been evaluated to assess their efficacy, which correspondingly builds confidence in users of the predictive models. 75 In view of this, the performance of the predictive models generated based on the RF classifier in the aforementioned three scenarios was assessed using the receiver operating characteristics (ROC) curve. The performance assessment of the MPMs produced in these scenarios indicates the predictive efficacy of the outputs generated in each of the three scenarios. The area under the ROC curve scores obtained for the MPM results in the first, second and third scenarios are, respectively, 0.840, 0.785 and 0.809 as shown in Figure 10. The AUC scores obtained in the scenarios indicate that the MPM produced by using only the geophysically derived thematic layers as input showed a better performance in comparison with the MPMs produced based on only the remote sensing layers as well as all the sixteen layers (both remote sensing and geophysics derived layers). This suffices to show that, the MPM generated based on the only geophysical layers obtained the highest accuracy while predicting prospective zones of gold mineralisation occurrence within the study area.
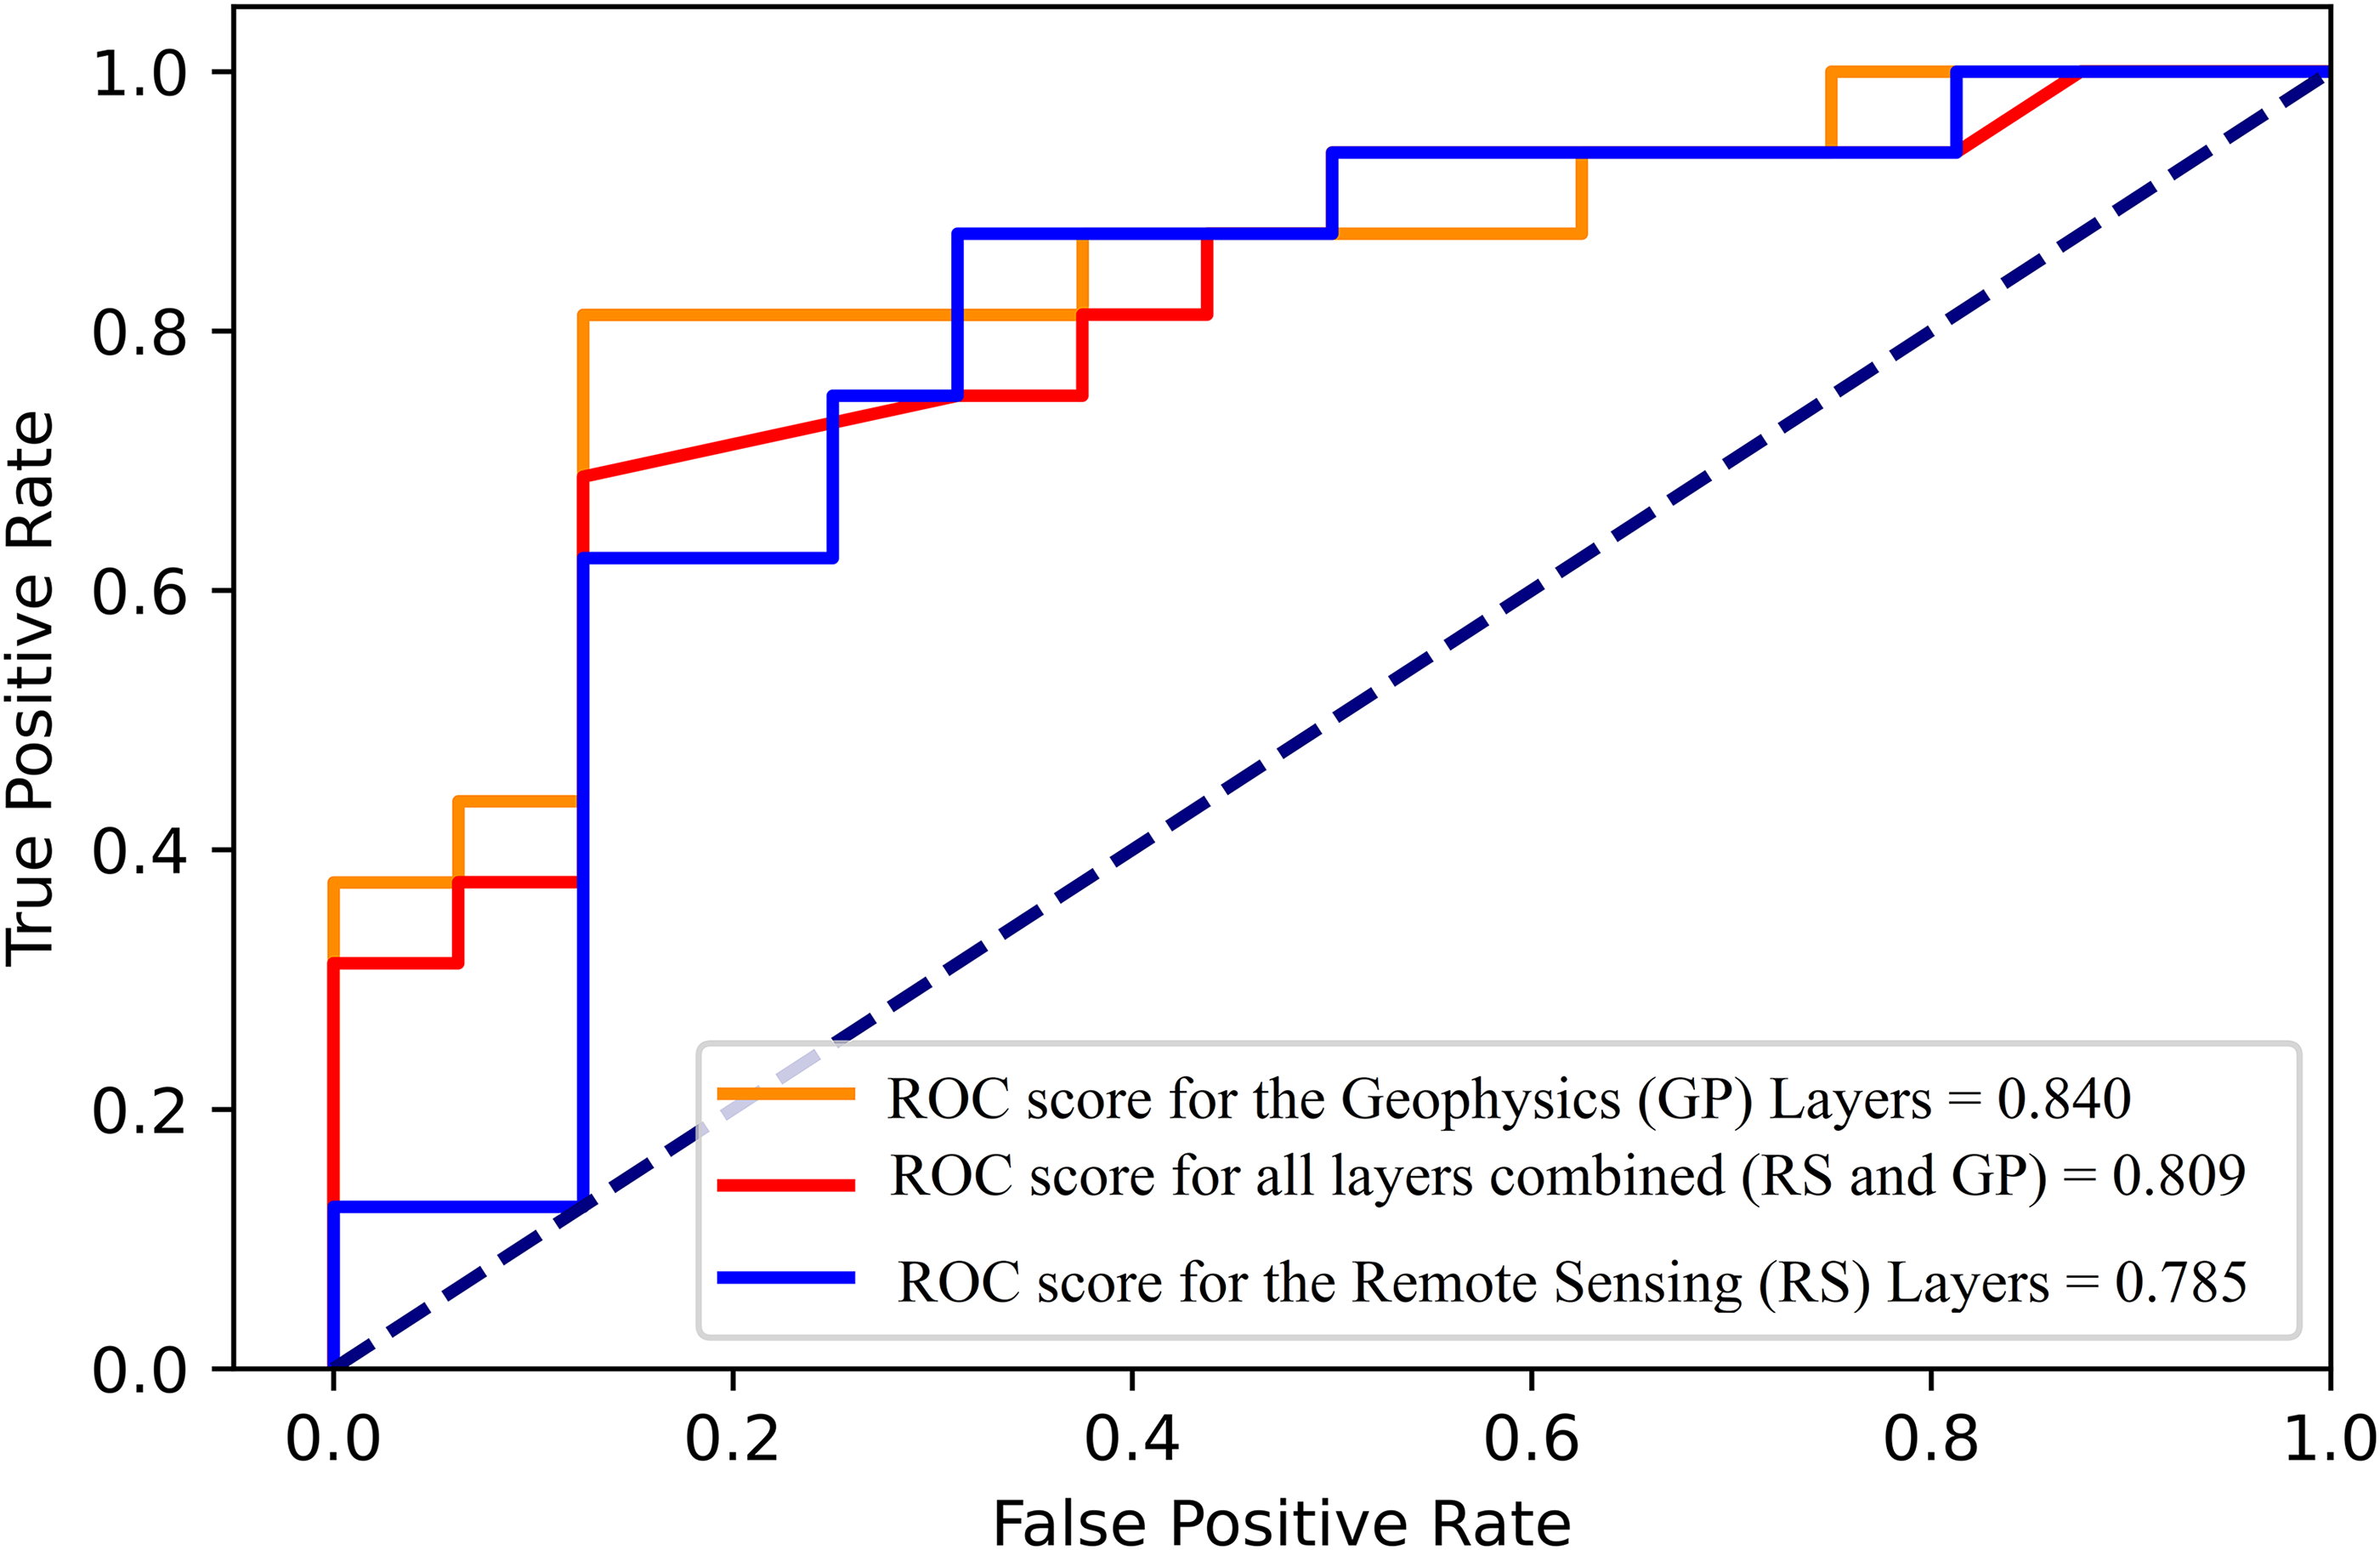
ROC curve for the scenario-by-scenario based MPM generated. ROC: receiver operating characteristics; MPM: mineral prospectivity model.
Discussion
The contribution of the mineral sector towards the economic gains of various countries with natural resources cannot be overemphasised. 76 Hence, the search for prospective zones of mineral occurrence is on the ascendancy in most mineral-rich countries including Ghana. Ghana’s gold resources are primarily known to be hosted in six main belts comprising the Ashanti, Bole-Nangodi, Bui, Kibi-Winneba, Lawra and Sefwi belts. 29 Among these aforementioned belts, it is the Kibi-Winneba belt, particularly its southern part that is being under-explored. In recent years, defining exploration targets for mineral prospecting, otherwise known as mineral prospectivity modelling, various predictors sourced from various geoscientific datasets are synthesised using ML approaches. As an initial stage in the mineral exploration programme, one task that is missing in the literature is to identify which category of geoscientific datasets can best guide the delineation of prospective zones of a sought-after mineral over a region of interest. In view of this, this study generated and compared MPM generated based on the RF approach using only geophysically sourced layers, only layers sourced from remote sensing datasets as well as layers sourced from both geophysical and remote sensing datasets. The development of MPMs whose prospective classes can serve as essential exploration targets requires that issues of target label imbalance, as well as spatial autocorrelation, are addressed. By employing the point pattern analysis technique the optimal distances beyond which non-occurrence data points (of equal number to that of the known occurrences) were created randomly to avoid data imbalance 16 . The random creation of these datasets was essential in minimising the biases that may arise if non-occurrence points were done manually. Spatial autocorrelation which arises due during train/test split was addressed by applying the splitting approach proposed by Le Rest et al. 61 In the first and third scenarios, where MPM was generated based on only geophysically sourced layers as well as layers from both geophysics and remote sensing datasets, the K/eTh predictor was deemed to be the most important predictor. This corroborates with literature as the K/eTh ratio predictor is capable of mapping hydrothermal alteration zones that consequentially essential targets for mineral exploration within the study area77,50. For the MPM generated based on only the predictors sourced from the remote sensing datasets, band ratios B4/B2 were deemed to have the most influence followed by B6/B7. This also corroborates with the literature as these two band ratios are capable of delineating respectively iron and hydroxyl-associated minerals such as pyrite, arsenopyrite, chalcopyrite, and sericite, which are essential indicator minerals to gold occurrence within the study area40,52. For a study that used a well-balanced target labels as carried out in this study, the determination of the performance of the MPMs generated can be appropriately done using the ROC curve. Through the use of the ROC curve, a score is produced for the area under it, otherwise known as the AUC score. MPM with a higher AUC score indicates a higher performance. Thus, MPM produced based on the geophysically sourced layers has a better performance (with an AUC score of 0.840) than MPM produced based on both geophysics and remote sensing predictors (AUC score of 0.809) as well as only remote sensing predictors (AUC score of 0.785). Also, the outputs from the geophysics-based MPM corroborate enormously with the literature such that the delineated prospective classes are predominantly observed within the metavolcanic (central to the southeastern part of the study area) as well as the northwestern portion of the study area, where gold mineralisation is generally deemed to occur due to the metavolcanic as well as the prevalence of potassium metasomatism due to hydrothermal leaching of quartz within the granitoids78,50. The outputs of this study further indicate that, in carrying out an initial exploration programme in terranes synonymous to the SKWB, the use of geophysically sourced predictors for MPM can give you optimal results.
Conclusion
Various machine-learning approaches have been employed for regional mineral prospectivity delineation worldwide. In geospatial classification, the RF remains the ML approach, which is robust and commonly used. The main objective of this study was to determine which predictors among geophysical and remote sensing datasets can give optimal results in the generation of an MPM over the southern Kibi-Winneba belt of Ghana using the RF algorithm. The RF-based mineral potential classification in this study was carried out in three scenarios: (a) by using only the geophysical layers as input layers, (b) by employing the layers derived from remote sensing data as inputs and (c) by employing all the layers sourced from both geophysical and remote sensing datasets. Results obtained from the MPM produced indicate that the percentage of the study area delineated as prospective in the first, second and third scenario were, respectively, 20.17%, 28.15% and 22.11%, which is, respectively, analogous to an areal extent of 386.93 km2, 540.03 km2 and 424.14 km2. In order to assess and evaluate the efficacy of the delineated classes based on the RF algorithm in each of the three classification scenarios, the area under the receiver operating characteristics curve was applied by using the test data. According to the AUC scores obtained, the RF-based mineral prospectivity classification in the first, second and third scenarios were 0.840, 0.785 and 0.809. This indicates that the use of geophysics layers as thematic layers for MPM over the southern Kibi-Winneba belt gives a better performance than remote sensing layers. These AUC scores observed are all >0.70, thus the models generated in these three scenarios can be useful for mineral exploration geoscientists in carrying out detailed mineral exploration programmes within the study area.
Footnotes
Acknowledgements
The authors are grateful to the University of Ghana-Carnegie Corporation and Building a New Generation Africa (BaNGA-Africa) for their immense support in making this study a success by funding the first author's postdoctoral fellowship. The authors also wish to thank the United States Geological Survey Earth Resources Observation and Science Center, Geodita Resources Limited and GFZ German Research Centre for Geoscience (Potsdam-Germany) for making data available for use in this study.
Declaration of conflicting interests
The authors declared no potential conflicts of interest with respect to the research, authorship and/or publication of this article.
Funding
The authors received no financial support for the research, authorship, and/or publication of this article.