
Abstract
In cave mines, wet inrushes occur when there is an uncontrolled inflow of fine, wet material from drawpoints. Currently, uncertainty exists regarding the spatial-temporal pattern and severity of inrush incidents. This uncertainty arises from the limited understanding of wet inrush mechanisms within the complex conditions of a cave mine. In this study, the existing gaps in knowledge around the spatial and temporal patterns of inrush incidents were addressed using machine learning techniques. A random forest (RF) model was employed to analyse the inrush database collected at the Deep Ore Zone mine over several years. The conceptual understanding of inrush mechanisms and triggers, along with historical evidence, was employed to establish an initial set of key inrush variables to be used in the RF model. The developed RF model demonstrated promising performance with an accuracy of 85%. The feature importance results indicated that previous inrush history, fragment size, draw rate (short term and long term), differential draw index (short term and long term) and history of inrush at neighbouring drawpoints had the highest impact on inrush susceptibility. The insights gained provide an improved assessment of inrush susceptibility, thereby improving the strategies employed to mitigate inrush risk.
Keywords
Introduction
Inrush hazards are a significant risk to operations in underground mines, especially those that utilise caving techniques. In block or panel cave mines, inrushes occur when there is an uncontrolled inflow of material from drawpoints into the extraction panel, usually as a result of mucking activities (Hubert et al., 2000). The presence of fine material (typically material less than 2 mm in size) within the cave is key to inrush incidents (Call and Nicholas, 1998). Fines can be generated in the cave through secondary fragmentation processes, or they can be brought into the cave from external sources, such as depleted mines or soil deposits above the cave (Butcher et al., 2005). Inrush material can be either dry (known as rill swells) or wet, exhibiting a range of flow behaviours from viscous (known as clay or mud push) to fluid (known as wet muck spills or mud rushes) (Jakubec et al., 2012; Lett et al., 2022). The primary source of water for wet inrushes is precipitation that directly infiltrates into the subsidence zone above the cave or enters through aquifers intersected by the cave (Butcher et al., 2005). In this study, the focus is on wet inrush incidents, referred to hereafter as inrush.
Inrush has been reported at various underground mines, including the Grasberg Mining Complex (Indonesia), the El Teniente mines (Chile), the Kimberley mines (South Africa) and the Cadia East mine (Australia) (Castro et al., 2017; Holder et al., 2013; Widijanto et al., 2006). These mines cover a wide range of conditions in terms of draw column heights, hydrological conditions and properties of the orebody (e.g., shape, depth, host rock lithologies and strengths). Grasberg's Deep Ore Zone (DOZ) panel cave likely sits at one end of the spectrum, having low to medium column heights (∼500 m) and being located in a very wet environment (>5500 mm/yr), while the Cadia East mine potentially sits at the other end, having large column heights (>1000 m), high fines generation potential and being located in a relatively temperate environment (Lett et al., 2022; Widijanto et al., 2012). The El Teniente mines consist of multiple overlying caves (mine sectors) with low draw columns, located in a relatively dry environment. The key fines sources contributing to inrushes at each mine sector at the El Teniente mines are external fines that are brought from the overlying caves, as well as fines entering the caves from surficial deposits. The topographical depression and the growing subsidence zone serve as a catchment area for water (Navia et al., 2014).
The current understanding of inrush triggering mechanisms and contributing factors is limited and has primarily been developed based on experience gained from historical inrush incidents. Butcher et al. (2005) describe the mechanism as breaching and releasing of ‘mud pockets’ due to ore extraction and muck pile compaction (arch collapse). Jakubec et al. (2012) point to differential draw as a key contributing factor, describing that it creates a high porosity zone above the drawpoints that allows for preferential flow and accumulation of fines and water. As saturated fine material cannot easily dissipate water under rapid changes in stress state (e.g., due to disturbance from mucking, blasting and equipment vibration), it is prone to liquefaction, resulting in inrush incidents (Jakubec et al., 2012).
Understanding wet inrush hazard and managing the risks associated with it has gained greater attention in the past few decades. The current trends in underground mining, such as existing caves breaking through to the surface, open-pit mines transitioning to underground operations and underground operations being extended to greater depths, suggest an increased potential for inrush incidents in the foreseeable future (Heslop, 2000). Mine operations that are at risk of inrush hazards have developed short-term and long-term risk management plans to address the risk that inrush hazards may pose to mine safety, assets and production. The key controls to mitigate inrush risk include managing surface water and groundwater, continuously monitoring drawpoint water content and fragment size, monitoring subsidence zones, implementing restrictions on operations in areas prone to inrushes (e.g., distance and time-based exclusions), maintaining a continual and uniform draw strategy and remotely operating mining equipment (Edgar et al., 2020).
One challenge in managing the risk posed by inrush incidents is that precipitation that directly infiltrates the cave from the subsidence zone cannot be effectively controlled, causing the cave to become more saturated as it matures and therefore causing wet muck formation to become inevitable (Castro et al., 2018). Another challenge is that, while automated systems can help to reduce the inrush risk to personnel, they are not effective at reducing inrush susceptibility (likelihood) and severity (volume and runout distance), and remote loaders may still be buried frequently (Edgar et al., 2020). Remote loaders also generally have lower operational capacity and efficiency compared to manual loaders, resulting in reduced production rates.
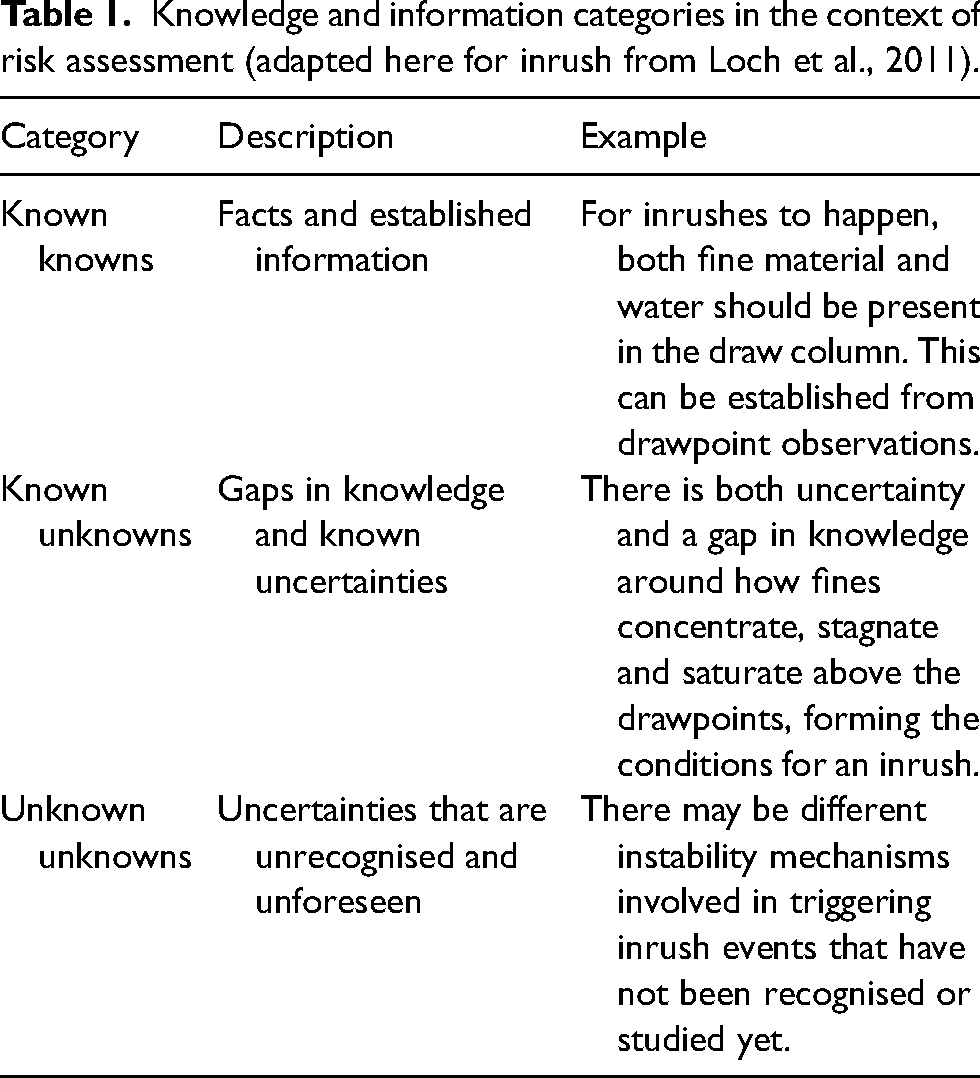
Drawpoint susceptibility to inrush is monitored by tracking evidence that informs workers of the presence of fine material and water in draw columns, such as the fragment size and water content of the ore exposed at drawpoints, signs of active water drainage from drawpoints, height of draw (HoD), differential draw and drawpoint proximity to external fine material sources (Castro et al., 2017; Widijanto et al., 2012). Nevertheless, major uncertainty exists with regards to the spatial-temporal pattern, frequency and severity of inrush incidents. This uncertainty is partly due to the complex behaviour of the inrush hazard itself, as well as the complex inrush triggering conditions within draw columns, which cannot be directly observed. Inrushes are unexpected, rare events that are likely the result of multiple transient or permanent unfavourable conditions occurring simultaneously within draw columns. From a risk assessment perspective, these conditions can be classified as shown in Table 1.
Knowledge and information categories in the context of risk assessment (adapted here for inrush from Loch et al., 2011).
Inrush risk assessment involves dealing with a complex dynamic system that changes rapidly over time at both the drawpoint and cave scale. To tackle this complexity, some recent studies have employed statistical and machine learning–based methods to gain a better understanding of inrush susceptibility and improve risk management practices. Castro et al. (2018), Varian (2022) and Salas et al. (2022) used multivariate logistic regression models to identify drawpoints with high inrush risk using a series of inrush risk variables, such as HoD, water inflow rate and neighbouring inrush drawpoints. Some of these models were able to identify high-risk drawpoints with accuracies ranging between 73% and 84%. However, they did not provide insight into the likelihood and frequency of inrush incidents at the identified high-risk drawpoints.
As a cave matures, its fines generation potential and water storage capacity increases (Laubscher et al., 2017). Once a drawpoint is labelled as high-risk, it is less likely to be reclassified as lower risk in the future. From a risk management perspective, it is not only important to identify drawpoints with a high risk of inrush but also to identify the conditions under which inrushes are more likely to occur at these drawpoints. Ghadirianniari et al. (2022) used statistical methods to analyse the impact of draw strategy on the likelihood of inrush incidents at a series of high-risk drawpoints at Grasberg's DOZ mine. Results from that study provided insight into the combined effects of varying draw rates and non-uniform draw conditions on the likelihood of inrushes.
The primary objective of this study is to address the current gap in understanding regarding both the spatial and temporal patterns of inrush incidents, particularly at inrush-susceptible drawpoints. To achieve this goal, inrush susceptibility at the DOZ mine was assessed by applying a random forest (RF) machine learning model to the extensive inrush database collected at the mine. Machine learning was employed as the primary methodology for this study to leverage its capability to uncover hidden correlations and trends in complex and large databases. Random forests can capture complex interactions between variables and provide a feature importance ranking, allowing for the identification of the variables that contribute most to the model's predictions. In this study, the conceptual understanding of inrush mechanisms and triggers, along with historical evidence, were utilised to develop an initial set of key variables contributing to the occurrence of inrush incidents. The RF model was then employed to assess the relative importance of these variables and narrow down the scenarios leading to inrush incidents. The insights gained and correlations identified aim to provide an improved assessment of inrush susceptibility, guiding the development of enhanced inrush risk mitigation strategies.
Wet inrushes at the DOZ mine
The DOZ panel cave mine in the Grasberg Mining Complex was operated by PT Freeport Indonesia (PTFI) between 2000 and 2022. The layout of the Grasberg Mining Complex is shown in Figure 1. The DOZ mine was the third lift in the East Ertsberg Skarn System (EESS) deposit after the Gunung Bijih Timur mine (depleted 1993) and Intermediate Ore Zone mine (IOZ, depleted 2003), with a production plan approximately 1200 m below surface (Widijanto et al., 2006). In 2003, the northern part of the DOZ cave broke through into IOZ (Widijanto et al., 2012). The DOZ mine deposit comprised two main geological domains: the Erstberg Stockwork Zone (ESZ) in the southern part of the cave, dominated by hard diorite, and the EESS deposit in the northern part of the cave, hosting a variety of medium and low strength rocks, including forsterite skarn, magnetite skarn, forsterite-magnetite skarn and breccia (Widijanto et al., 2006). The water-bearing zones around the DOZ included fractured diorite in the ESZ, limestone units in the northern area of DOZ and fault zones in the east and west of the cave (Casten et al., 2016).
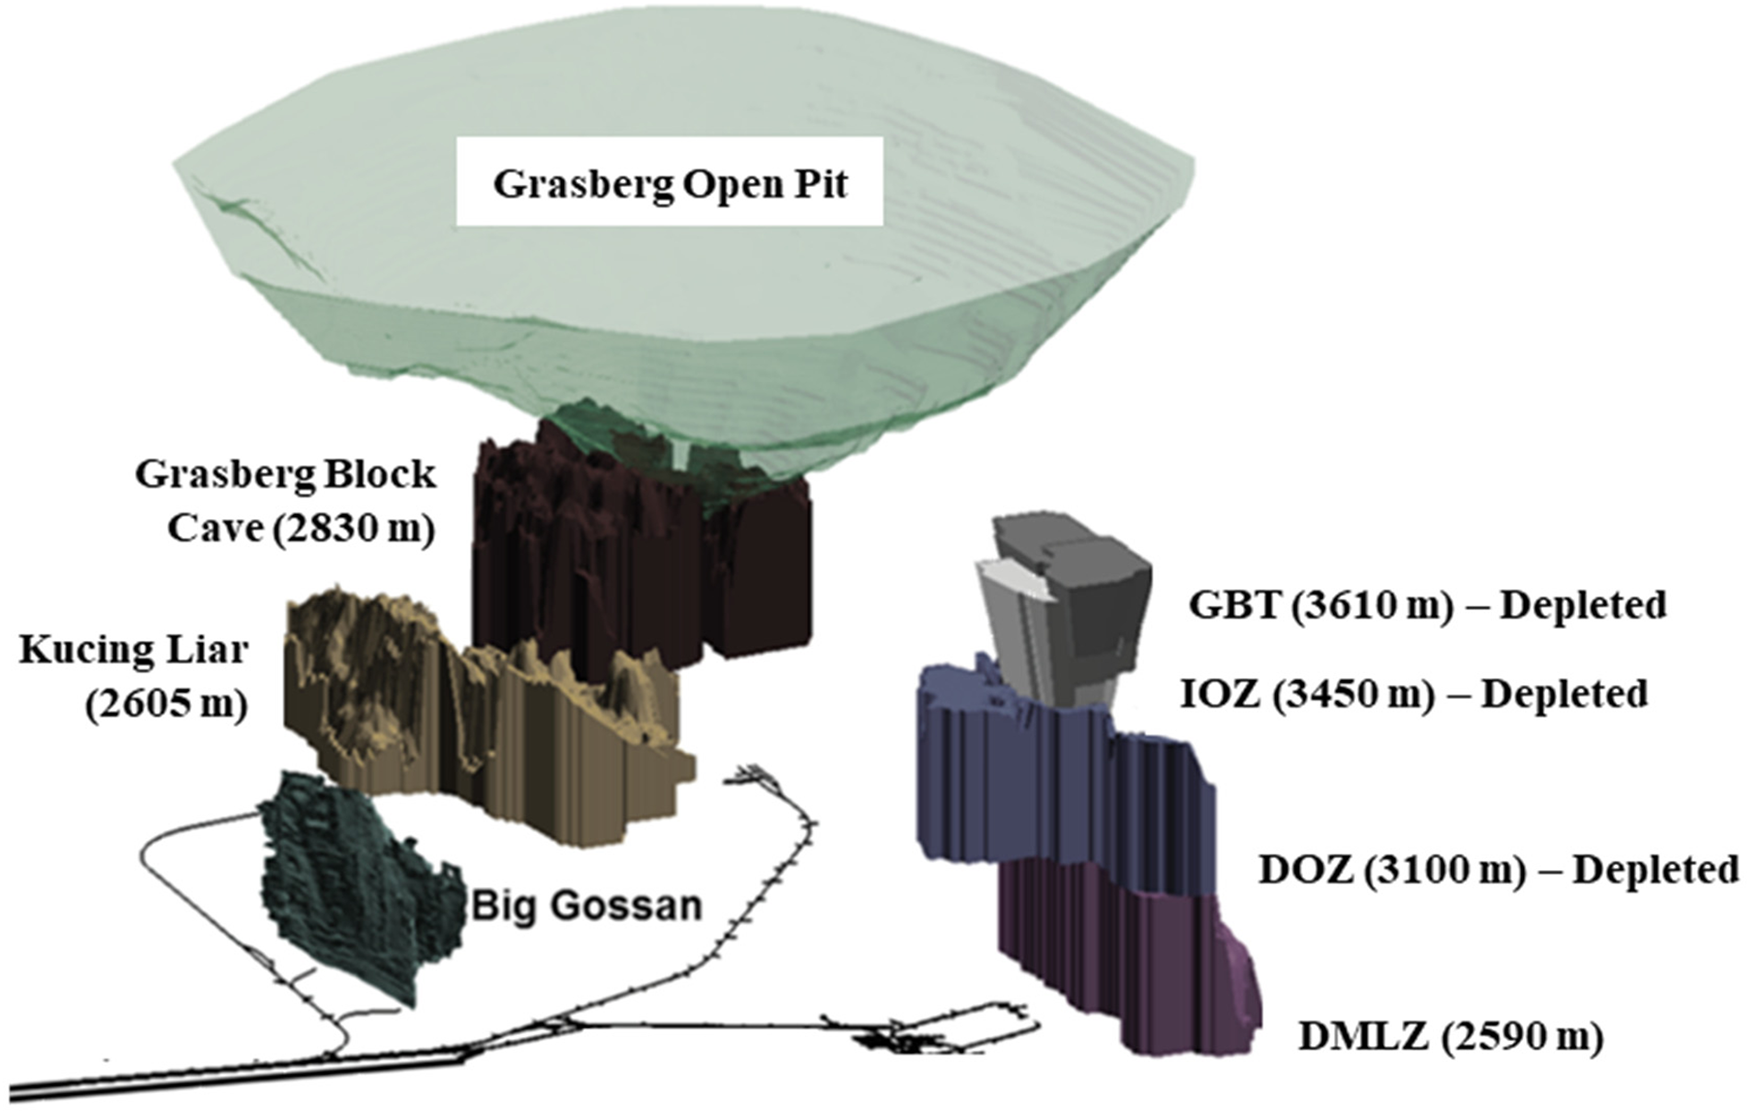
Layout of the Grasberg Mining Complex (Casten et al., 2016).
The DOZ mine experienced several inrush incidents during its later years of operation (∼2016 onwards). During those years, inrush incidents were inevitable at the mine due to DOZ being a mature cave characterised by abundant fines and a high water storage. Fine material was primarily the product of secondary fragmentation within the cave but was also brought into the cave from the overlying IOZ mine (Wilson et al., 2016). The major source of water entering the cave was the heavy precipitation (approximately 5500 mm/yr), which directly infiltrated into the cave from the subsidence zone or was stored in the surrounding aquifers (Samosir et al., 2008). The key inrush mitigation measures at the DOZ mine included extensive dewatering through drainage boreholes drilled around the periphery of the cave, rigorous drawpoint monitoring for wet muck susceptibility, fully automated operations at high-risk zones, time-based and distance-based exclusion rules after inrush events and a modified ore flow system to handle wet material. Further details on the inrush Standard Operating Procedures and the mitigation measures undertaken by PTFI at the time can be found in Edgar et al. (2020).
This study focuses on the inrush incidents that occurred at the DOZ mine during the period from September 2017 to August 2019. During this period, several inrush incidents were recorded at drawpoints with varying fragment sizes, water contents, HoDs and draw conditions, providing valuable insights into the conditions and factors that contribute to inrush events. The DOZ drawpoint layout, hydrogeological units, IOZ footprint and inrush locations during the study period are shown in Figure 2.
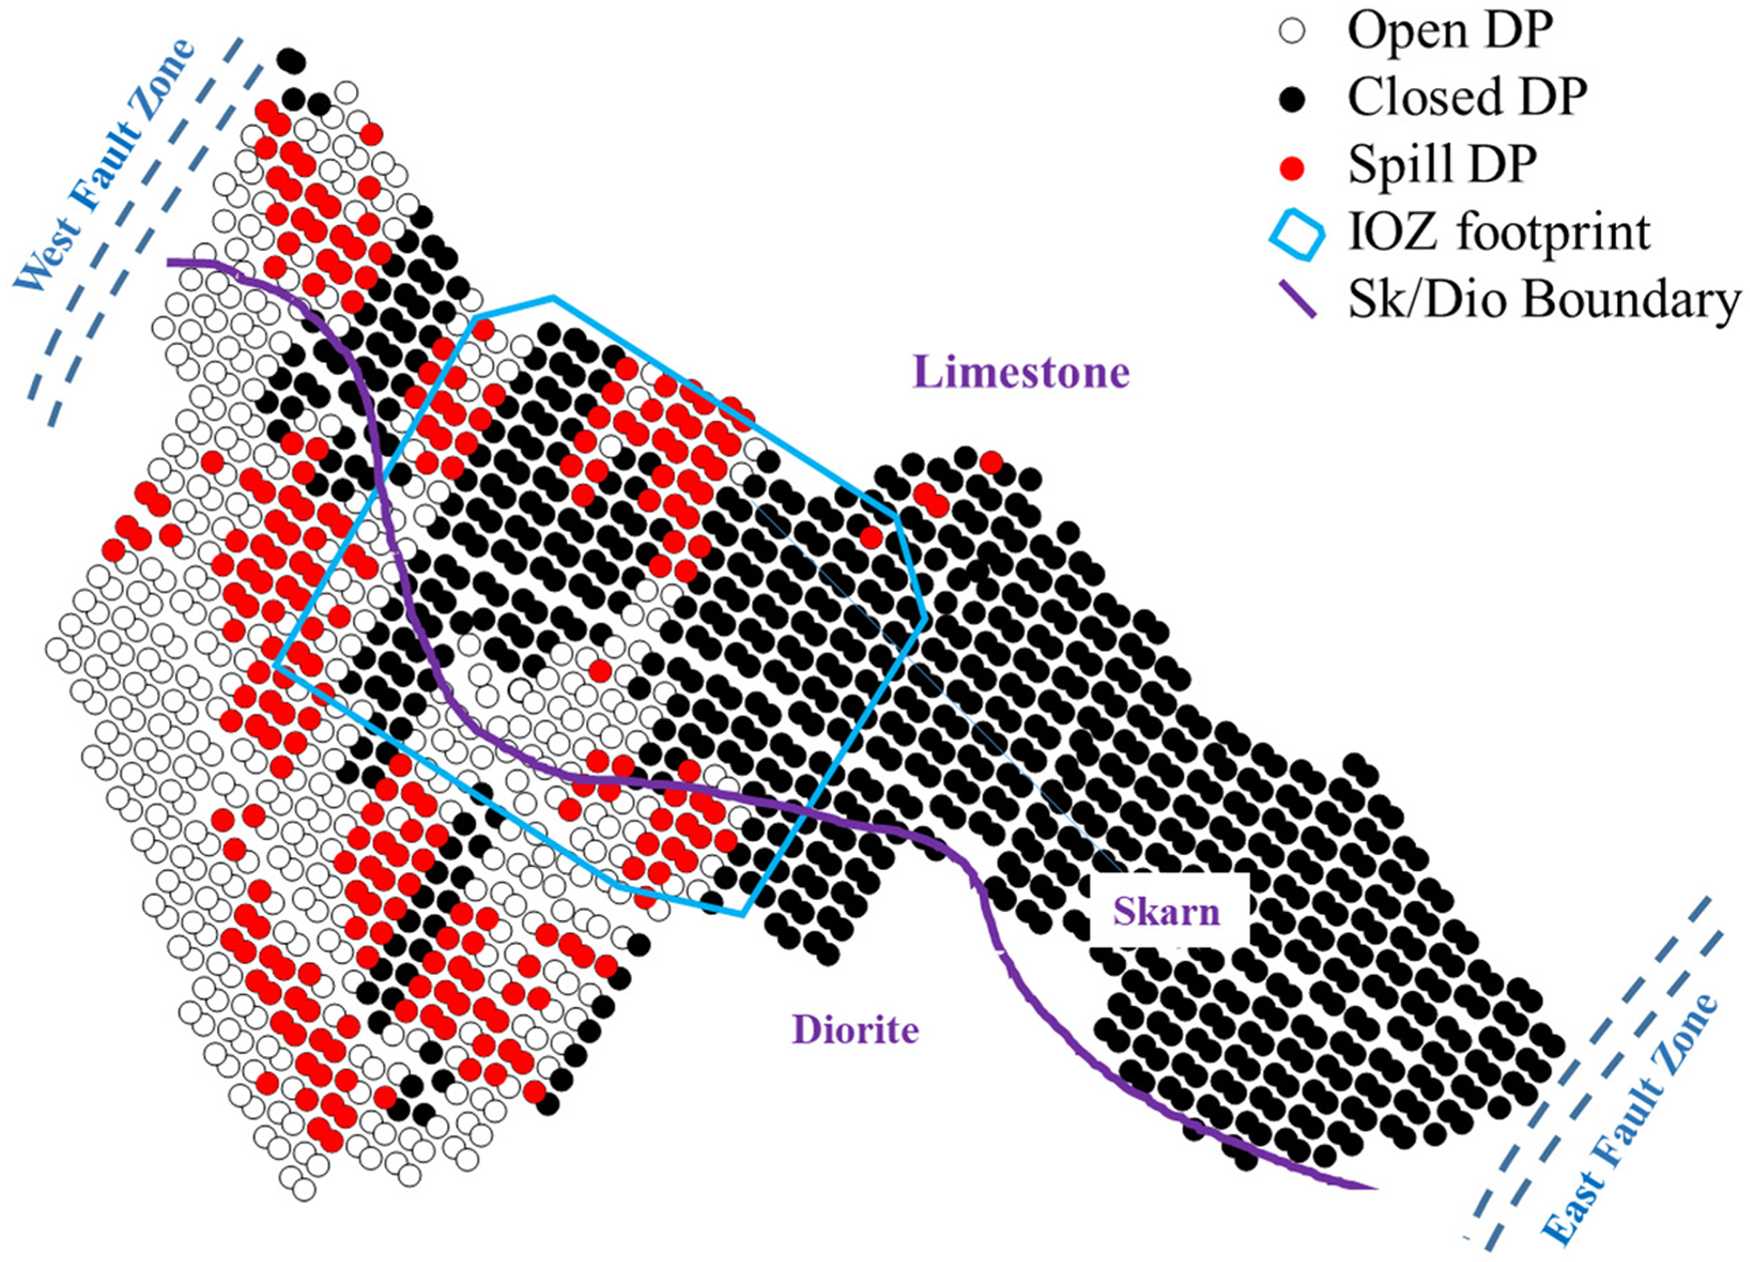
DOZ geological domains, fault zones, drawpoint layout and inrush locations during 2017–2019.
Methodology
The workflow in this study involved leveraging the understanding of the mechanisms behind fines accumulation and water storage, and their effect on inrush susceptibility, to extract key variables that contributed to inrush events from the daily data collected for DOZ drawpoints. A RF machine learning algorithm was then employed to analyse these variables and develop a model that identifies patterns and correlations that contribute to the occurrence of inrush incidents, with the objective of better understanding the scenarios leading to future inrush incidents. The flowchart shown in Figure 3 summarises the workflow described in this section for inrush susceptibility assessments.

The workflow used for inrush susceptibly assessment at the DOZ mine.
Variables associated with inrush susceptibility at the DOZ mine
Inrush susceptibility at the DOZ mine can be linked to different types of variables, including those indicating the potential for accumulating fines, those suggesting the presence of water and increased water storage capacity, and those containing information inferred from previous inrush incidents. This section describes the primary variables associated with fines accumulation, water saturation and water storage capacity.
Drawpoint fragment size and water content
The dominant fragment size and water content of the ore exposed at the drawpoints are the most relevant variables that inform workers of the presence of fines and water within the draw columns. At the DOZ mine, the data on drawpoint fragment size and water content were collected on a weekly basis by visual mapping (Widijanto et al., 2012). The matrix used by the operations team to classify drawpoints is shown in Table 2. The matrix classifies drawpoints as dry (1), moist (2) or wet (3) based on the amount of water present in the ore, and as coarse (A), mixed (B) or fine (C) based on the proportion of material less than 5 cm in size. The 5 cm threshold set by the matrix represents the smallest material size that can be easily visually mapped by personnel at the mine. Although 5 cm is notably larger than the material size needed for mud formation (<2 mm), it serves as an indicator of the presence of finer material. This connection is drawn because, in cave mining, fines are produced through secondary fragmentation processes (i.e., successive splitting of larger blocks into smaller pieces and rounding). Consequently, drawpoints with higher amounts of fine material are generally anticipated to also contain larger quantities of <5 cm material.
Drawpoint classification matrix used at the DOZ mine (after Widijanto et al., 2012).
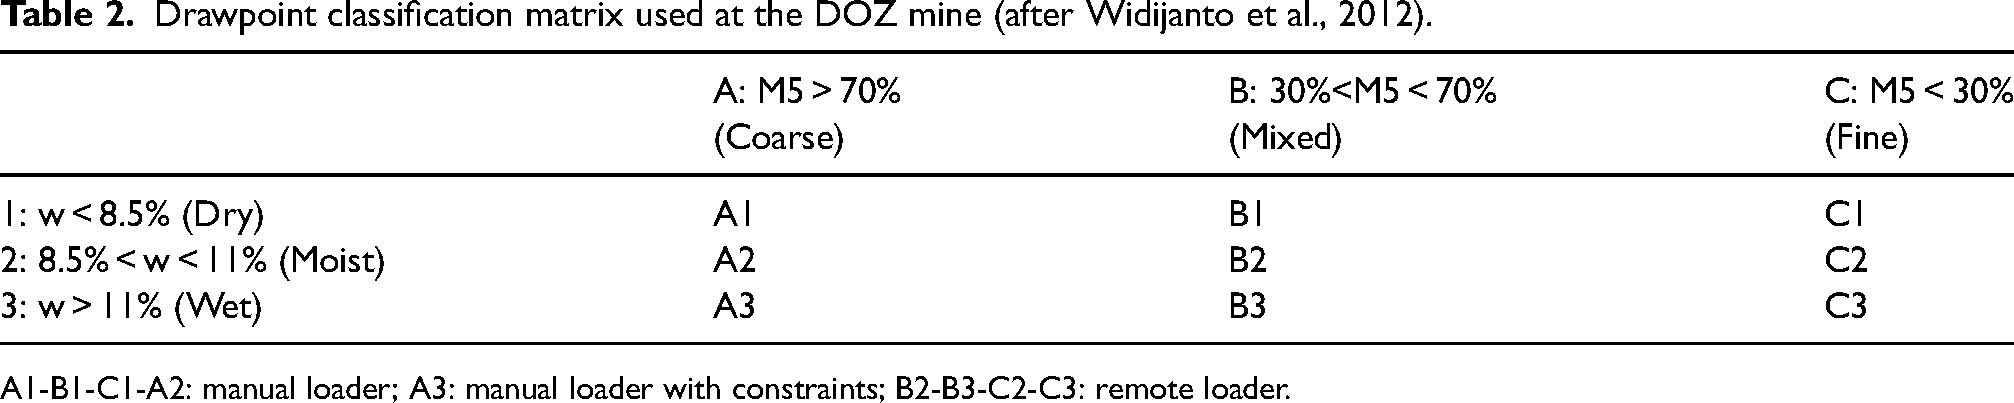
A1-B1-C1-A2: manual loader; A3: manual loader with constraints; B2-B3-C2-C3: remote loader.
Height of draw
Height of draw is defined as the equivalent height of material drawn from a drawpoint. As more material is drawn from drawpoints, resulting in a higher HoD, more secondary fragmentation occurs as the blocks move down through the ore column to the drawpoints. The increased secondary fragmentation results in higher fines generation due to the increased rock splitting and rounding (Laubscher, 2000). Additionally, a higher HoD indicates a greater height of broken or above the drawpoints, which can serve as an entry point for external fines and water (Hekmat et al., 2018).
Draw strategy
Draw strategy is a key factor associated with the temporal pattern of inrush incidents, particularly those occurring at drawpoints that have been previously identified as susceptible to inrush (Ghadirianniari et al., 2024). Historical inrush evidence at the Grasberg's IOZ and DOZ mines and South African diamond mines has shown that the vast majority of inrush incidents are triggered by draw activities (e.g., mucking, blasting), with only a small proportion identified as ‘self-initiated’ (i.e., attributed to the time-dependent collapse of material or sudden changes in load conditions within the draw columns) (Butcher et al., 2005; Hubert et al., 2000).
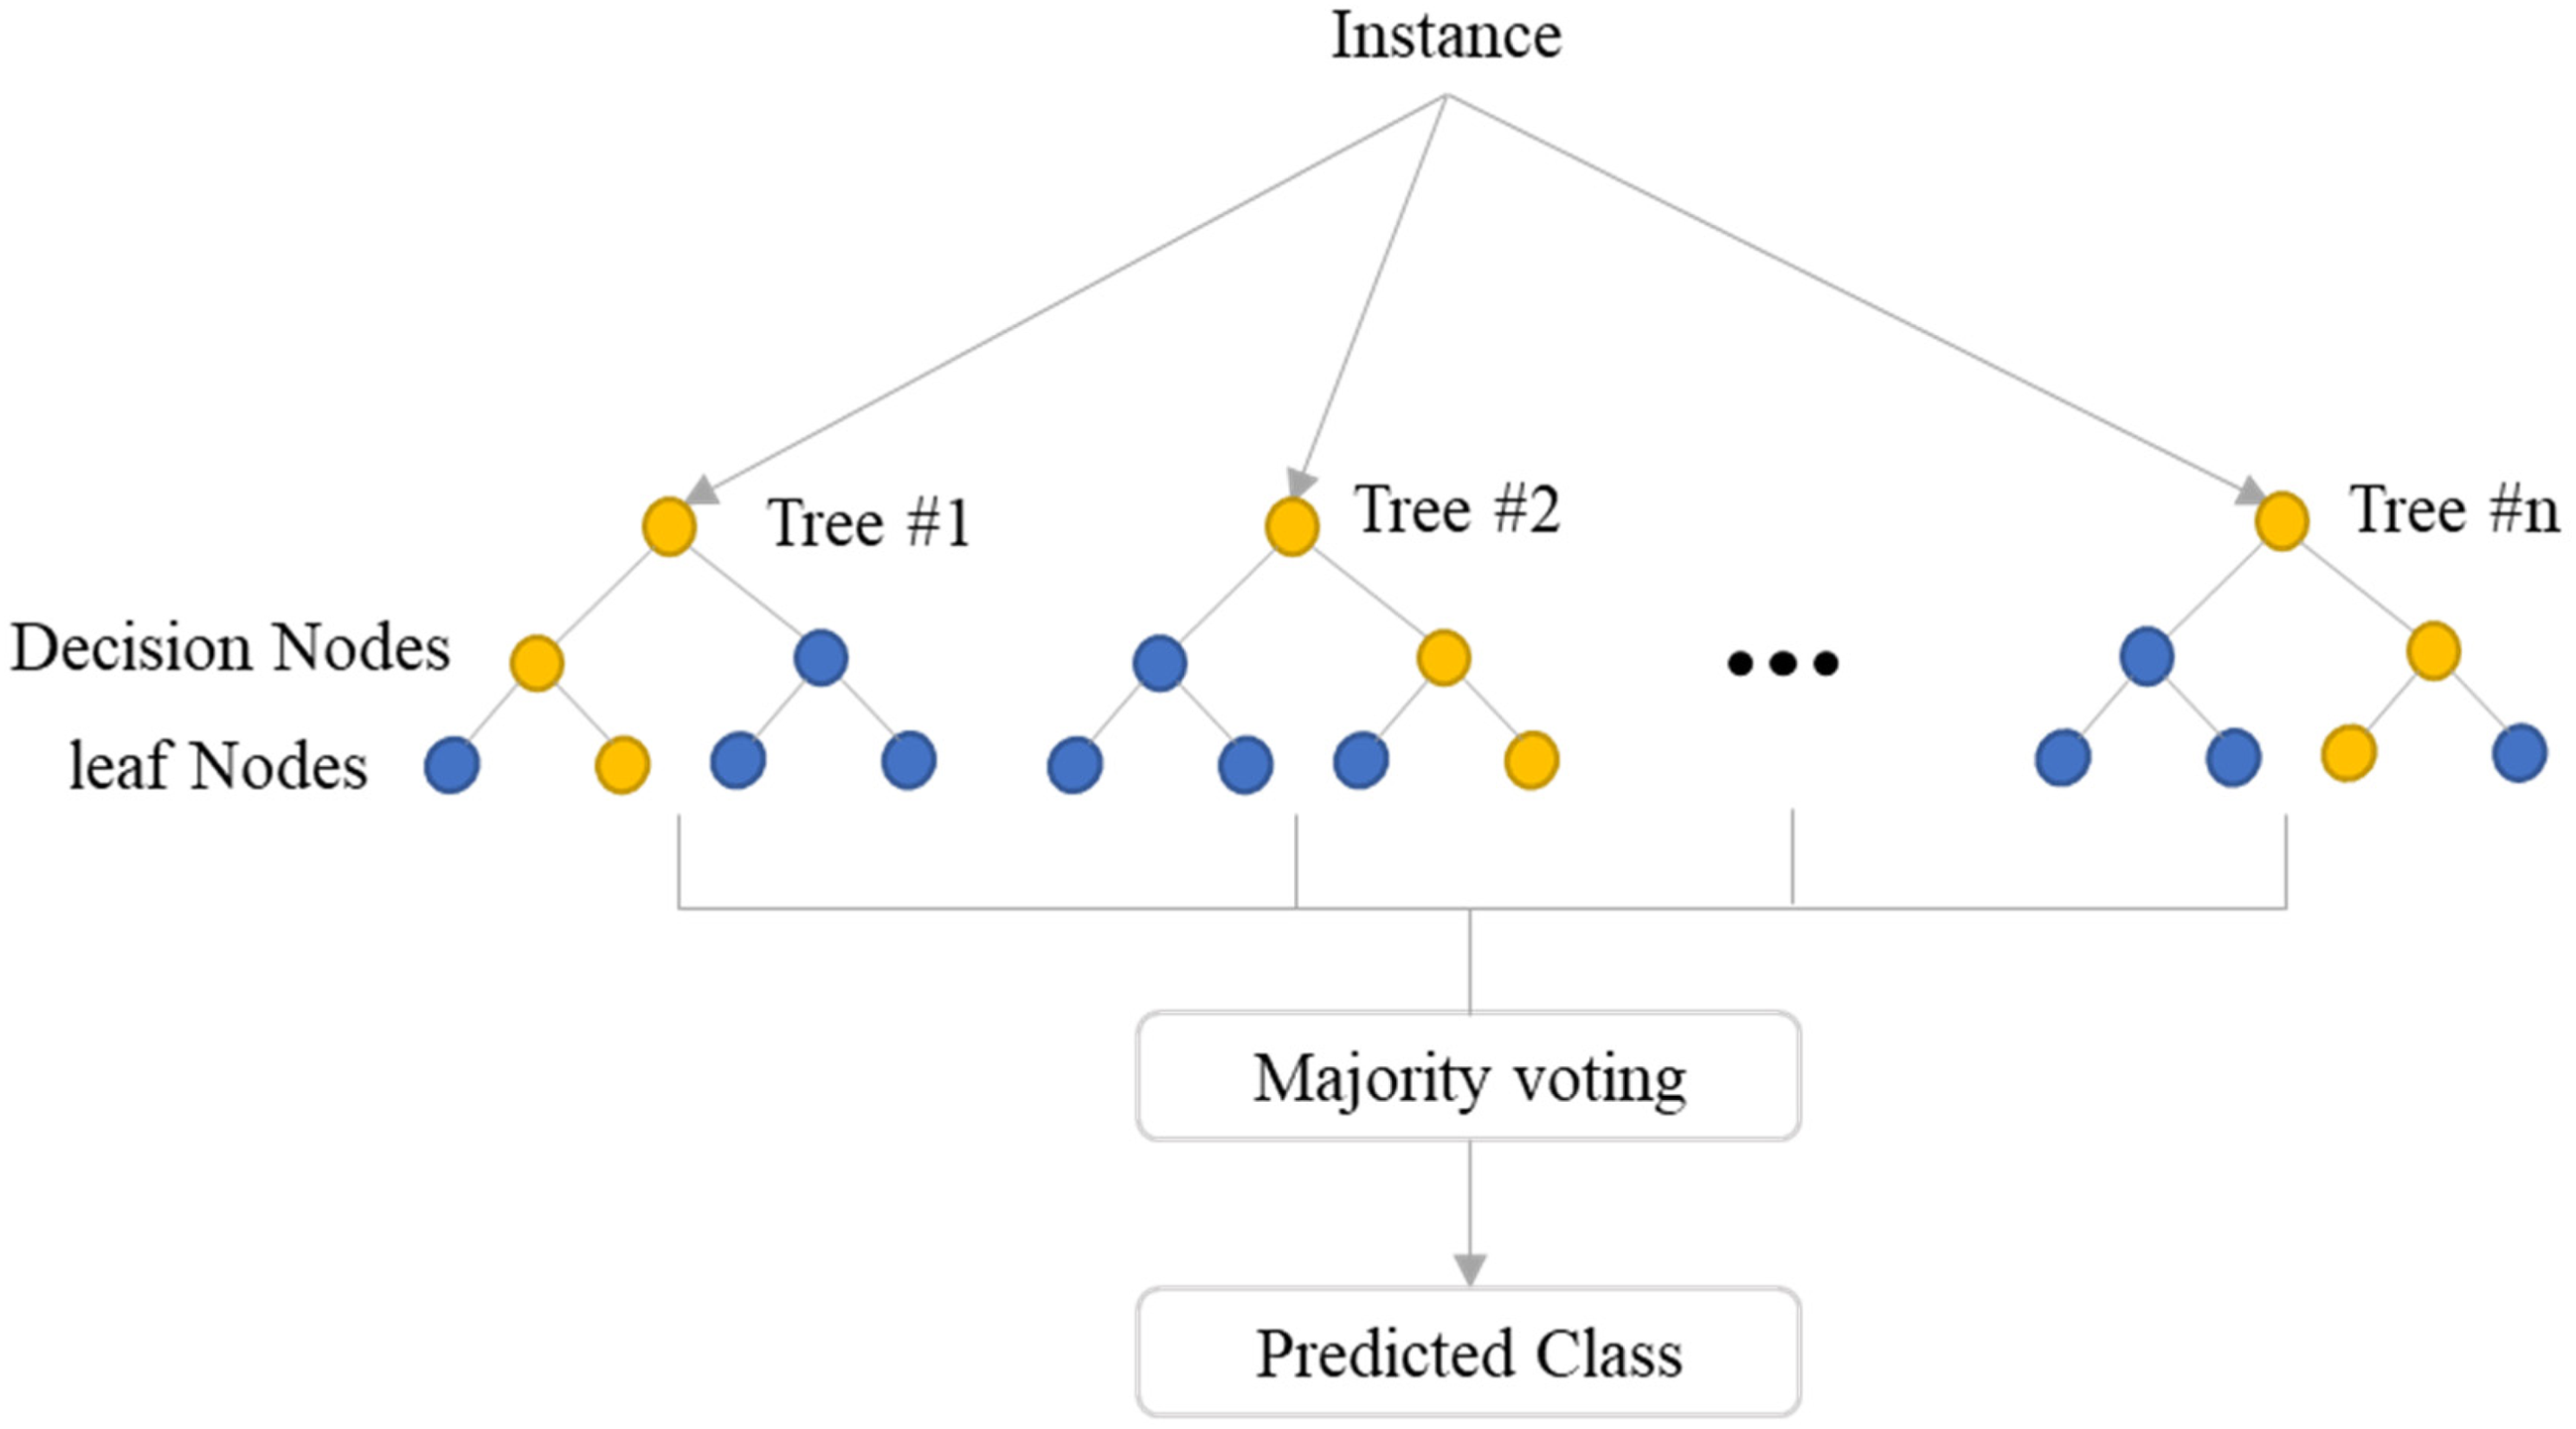
Ghadirianniari et al. (2024) proposed that heavy differential draw increases inrush likelihood at inrush susceptible drawpoints through various mechanisms, including: (a) a heavy differential draw leads to the creation of an extended zone of elevated porosity above the drawpoints under the heavy draw rate, which can potentially promote the preferential flow of water and fines to the drawpoint (Pierce et al., 2010); (b) under heavy differential draw, saturated fine material is more likely to settle in a loose state, making it more susceptible to flow when triggered (Castro et al., 2017); and (c) when differential draw is maintained over a long period, it can promote fines generation due to shear-induced attrition caused by differential movement of cave material (Pierce et al., 2010).
Ghadirianniari et al. (2024) showed through statistical analyses that the probability of inrushes was highest under ‘heavy-isolated’ draw, a scenario where material is drawn at a high rate under highly non-uniform draw conditions. In their study, they quantified the draw strategy by two variables: draw rate (
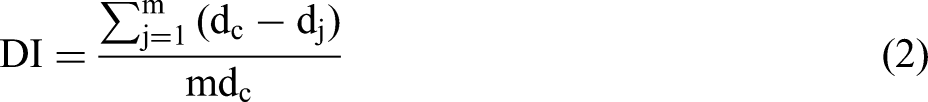
DI terms for a drawpoint with seven neighbours in an offset Herringbone layout (after Ghadirianniari et al., 2024).
In this study,
Another aspect of the impact of draw strategy on inrush susceptibility is its effects on inrush material concentration, stagnation and saturation cycles. Historical evidence has shown that continuous draw keeps material flowing, allowing it to dissipate water, whereas periods of draw inactivity can result in material saturation and stagnation above a drawpoint (Jakubec et al., 2012). To account for the potential effects of continuous draw versus intermittent draw on inrush susceptibility, a binary variable was defined to indicate whether or not a drawpoint was active within a few days preceding any given inrush or no-inrush observation.
Proximity to pathways of external fines
Fines have been shown to rapidly percolate down through the draw columns, accumulating in drawbells and filling the voids between larger blocks (Pierce, 2010). When a significant amount of fine material is accumulated, cushioning may occur, where larger blocks are found to be floating in a matrix of fines (Dorador, 2016). At the DOZ mine, the major source of external fines was the overlying IOZ mine. As fine material tends to percolate down vertically, external fines were most likely to be found within and near the footprint of the IOZ cave. The footprint of the IOZ mine on the DOZ production plan is shown in Figure 2.
Proximity to water pathways
Historical evidence of inrushes from the IOZ and the El Teniente mines suggests that the most likely pathways for precipitation ingress into the cave are through subsidence and topographical low points, as well as along with the cave boundary (Call and Nicholas Inc., 1998; Castro et al., 2018). However, during the analysis period, the DOZ cave was predominantly saturated, and several factors undermined the impact of preferential rainwater flow on inrush susceptibility, including the presence of a fractured diorite zone serving as an aquifer above the cave, as well as the depleted IOZ mine.
History of inrushes at a drawpoint
Historical evidence of inrushes at the DOZ and El Teniente mines has shown that inrushes tend to reoccur at certain drawpoints (Hekmat et al., 2018). One possible explanation for this behaviour is the formation of sustained preferential water paths and fines recharge paths within the cave near these drawpoints. The exact location of these pathways may not be directly associated with low points of the subsidence zone or known external fines recharge zones, due to the complex conditions within the cave. Drawpoints with previous inrush history are, at least temporarily, characterised by higher inrush potential. To account for this increase in susceptibility, the inrush history at a drawpoint was used as an engineered feature. An engineered feature is a manually created variable that is included in a machine learning model to help better understand and classify data (Guyon and Elisseeff, 2003).
History of inrushes at neighbouring drawpoints
It is a common challenge to determine the exact timing of an inrush incident, particularly at a drawpoint without a previous history of inrushes. For a drawpoint that has not experienced an inrush previously, the history of inrushes at the neighbouring drawpoints can be a factor that indicates an increased susceptibility to inrush. Water and saturated fines above the drawpoint with a previous inrush history may preferentially flow to the drawpoint in the same drawbell or to drawpoints across the major and minor apexes (as shown in Figure 4), thereby increasing the likelihood of inrushes at those drawpoints. The history of inrushes at neighbouring drawpoints was used as an engineered feature, with the aim of identifying the first inrush incidents at drawpoints without an inrush history.
Geological domain
Fines generation potential within a cave depends on the geological properties of the orebody rock and tends to increase with lower rock strength due to finer secondary fragmentation (Laubscher et al., 2017). At the DOZ mine, the Skarn domain in the northern part of the cave has a finer fragmentation characteristic compared to the Diorite domain in the south, which increases its susceptibility to fines generation and accumulation. The boundary between the Skarn and Diorite geological domains is shown in Figure 2.
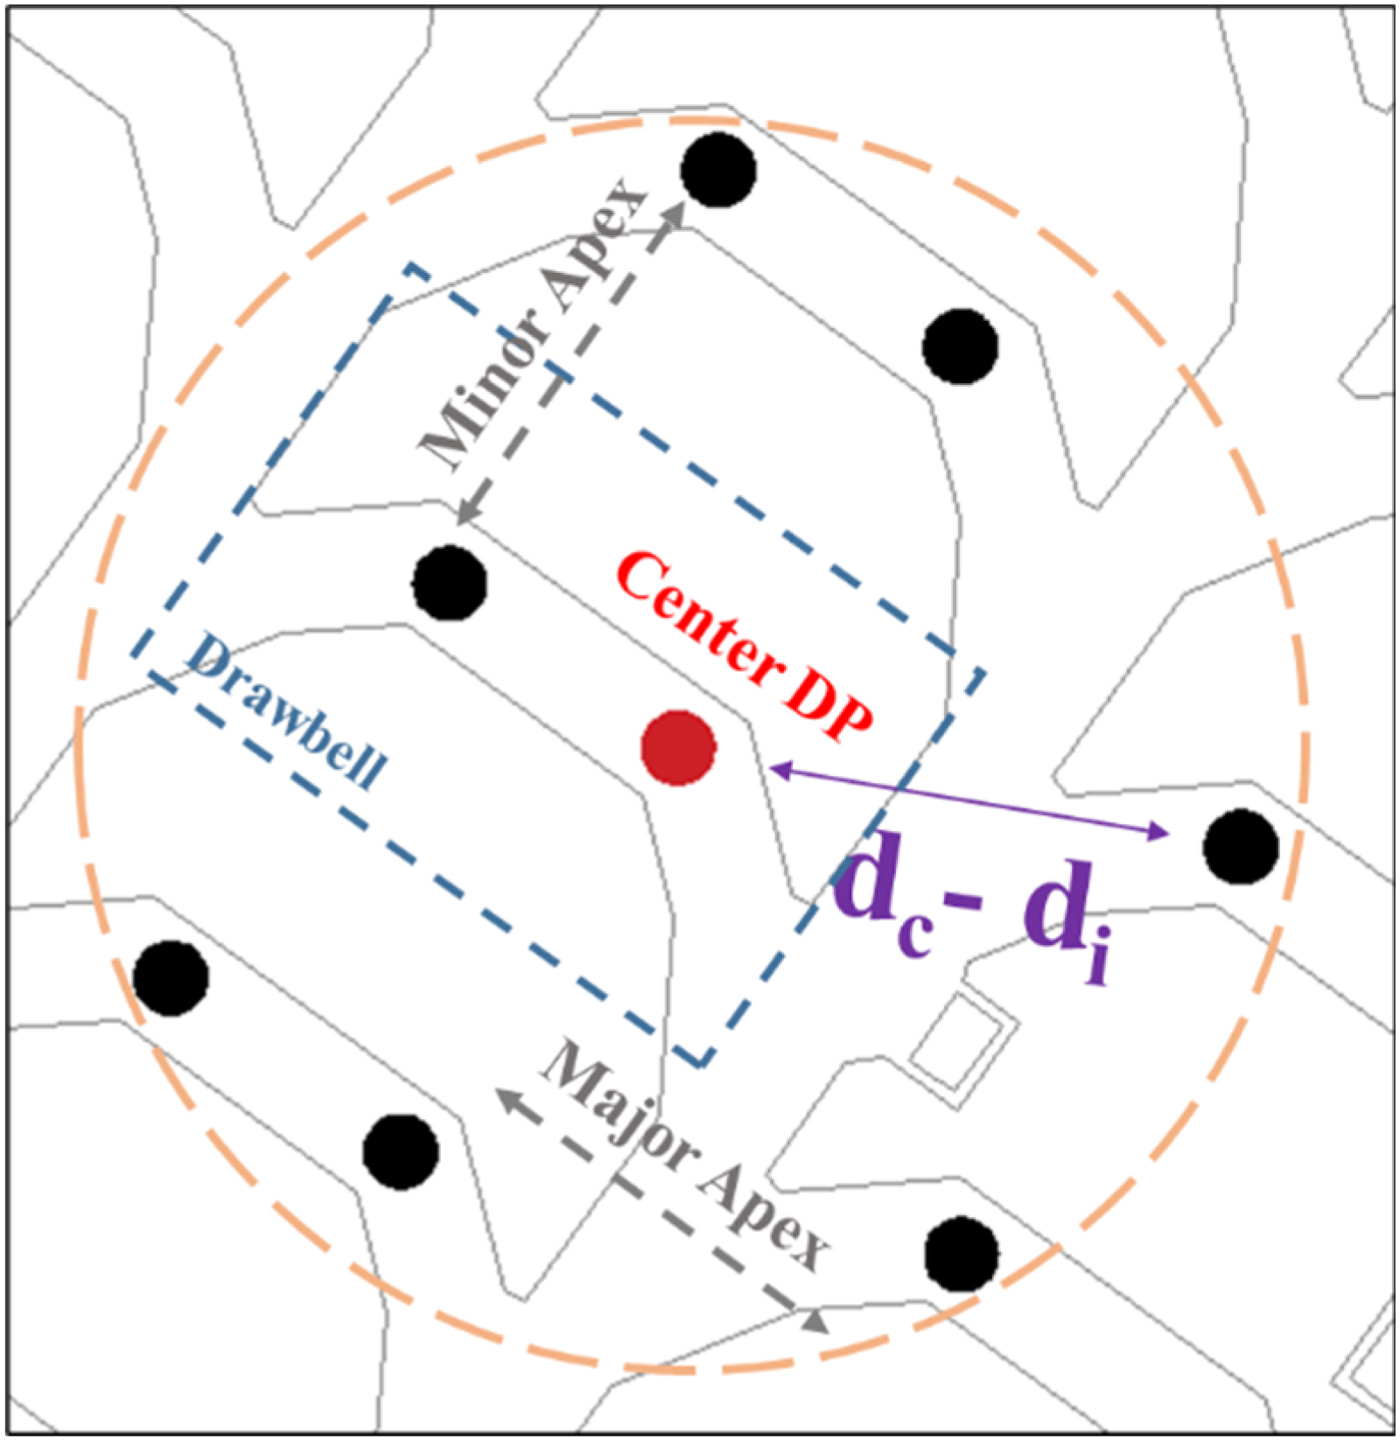
Table 3 summarises the features associated with the explained inrush mechanisms and contributing factors throughout this section. These features were used in the development of the RF machine learning model.
The random forest model input features.
*Selection of 3-day and 3-month periods were based on results from Ghadirianniari et al. (2024).
Machine learning with a random forest model
Machine learning (ML) is a field that aims to develop algorithms capable of learning from complex and large datasets (Domingos, 2012). Machine learning techniques can be broadly categorised as supervised or unsupervised learning, depending on whether or not the data points are labelled with a target variable for the model to predict (Bishop and Nasrabadi, 2006). The two main types of supervised learning problems are classification and regression. Classification involves predicting a categorical label for each input instance, while regression involves predicting a continuous numeric value (Breiman et al., 1984). Inrush event prediction is a classification supervised learning problem, where ML techniques can be used to map the input variables associated with inrush to the actual occurrences of inrush and make predictions accordingly.
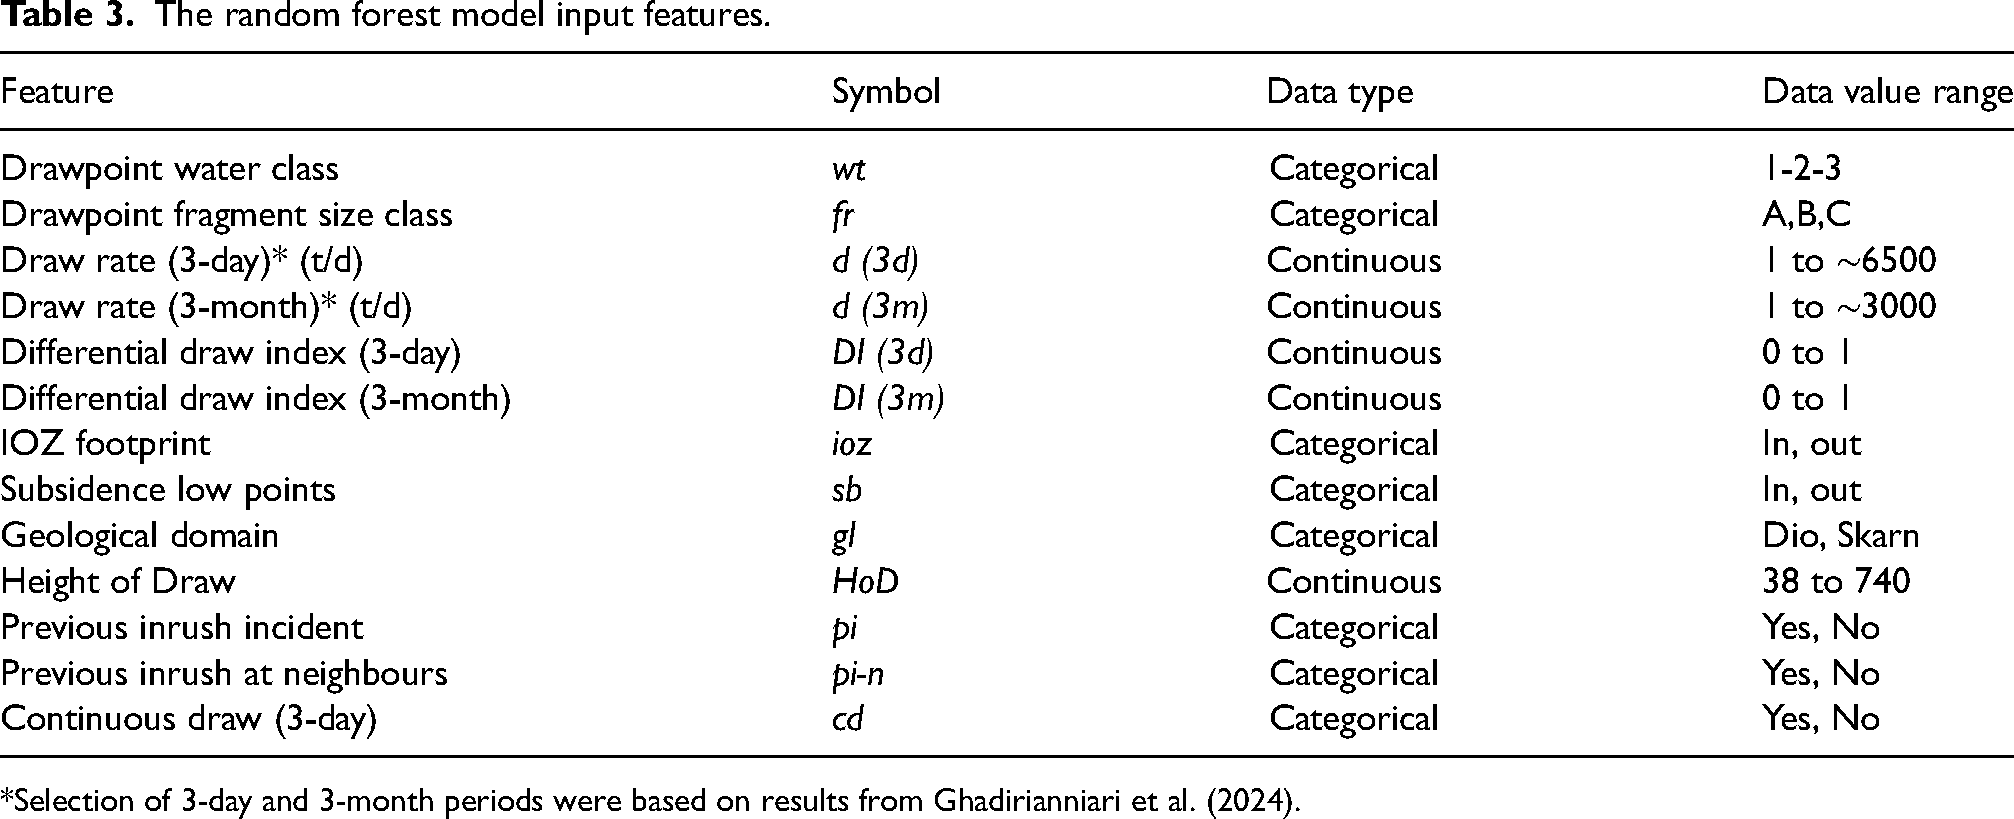
This study uses a RF ML model, which is a non-linear decision tree-based ensemble learning algorithm (Breiman, 2001). Random forest involves constructing multiple decision trees, each trained on a randomly selected subset of the training data and a randomly selected subset of the input variables. A schematic diagram of a RF algorithm is shown in Figure 5. Each tree is made up of decision nodes and leaf nodes. Decision nodes split the data into subsets based on the input features, while leaf nodes represent the final output or decision. The final prediction is obtained by aggregating the individual predictions of the trees (Breiman, 2001). The benefits of using a RF ML model, compared to linear methods such as logistic regression, include a reduced risk of overfitting and improved generalisation performance of the model (Cutler et al., 2007). Additionally, RF is not significantly affected by multicollinearity amongst the features because it only considers a subset of features for each split, which reduces the impact of highly correlated features (Breiman, 2001). This benefit is particularly important for inrush event prediction, where variables may have high interdependency. Correlated features violate the assumption of independence of predictors that is required for linear models (Belsley et al., 2005).
Schematic diagram of a random forest algorithm.
Inrush event prediction involves dealing with datasets that are severely imbalanced, meaning in this case, that there are significantly fewer inrush instances relative to no-inrush instances. Data imbalance can lead to the majority class (no inrush) dominating the learning process when using a standard ML model (He and Garcia, 2009). To effectively balance the influence of each class in the learning process, a weighted RF model (Chen et al., 2004) was employed, where a higher weight (importance) was assigned to the inrush class (minority class). Through this weighted ML learning process, errors in predicting the minority class are penalised more heavily, encouraging the model to learn patterns from the inrush class (the class of interest). The class weights were chosen based on the inverse frequency of the classes in the training set. Hyper-parameter tuning (Bergstra and Benigo, 2012) was conducted to optimise the performance of the RF model and find the right balance of model complexity to avoid underfitting and overfitting. Underfitting occurs when a model is too simple and does not fit the training data, while overfitting occurs when a model is too complex and fits the training data too well, leading to poor performance on new data (Vapnik, 1999). The tuned parameters included the number and maximum depth of the trees, as well as class weight.
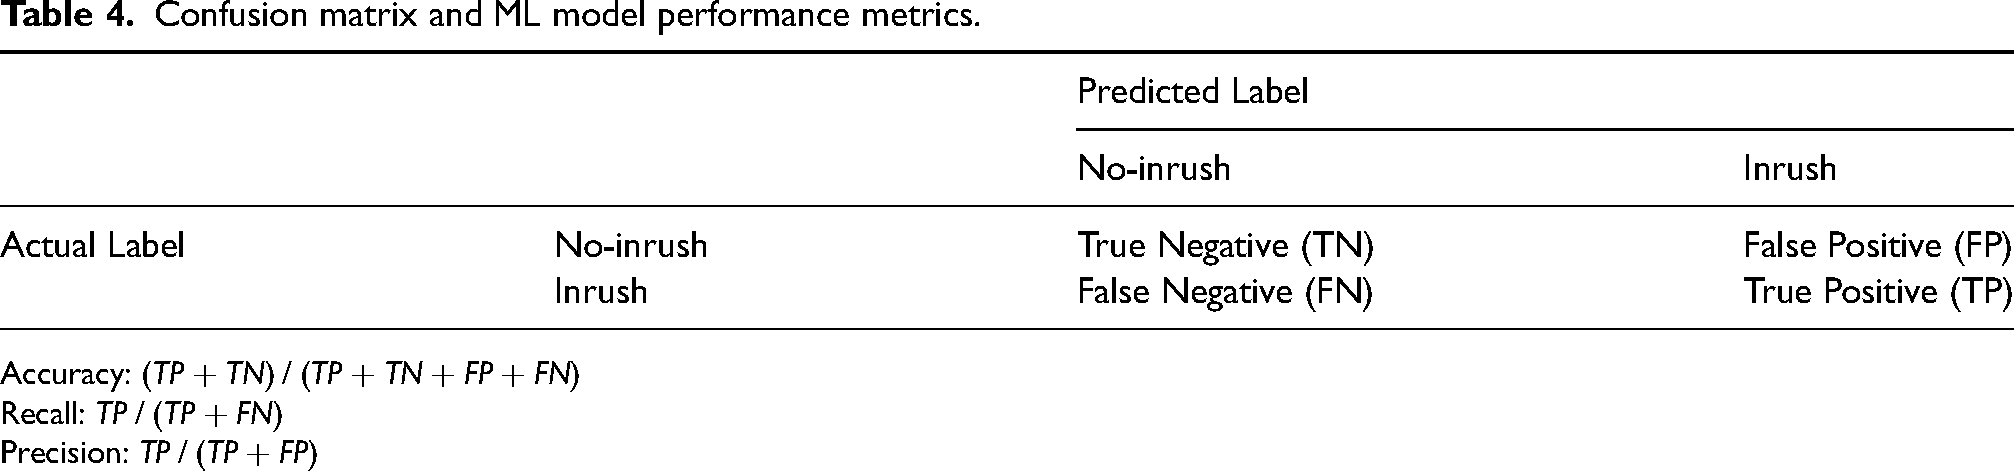
The performance of the trained RF model was evaluated using a confusion matrix summarising the results of the model predictions compared to the actual observations related to the test data (Table 4). In the confusion matrix, a true positive is a case where the model correctly predicts the inrush class, a true negative (TN) is a case where the model correctly predicts the no-inrush class, a false positive (FP) is a case where the model incorrectly predicts the no-inrush class, and a false negative (FN) is a case where the model incorrectly predicts the inrush class. Accuracy, precision and recall are the metrics obtained from the confusion matrix, with their calculation provided in Table 4. Accuracy is the proportion of correct predictions amongst all predictions made by the model, precision is the proportion of true inrush predictions amongst all inrush predictions made by the model, and recall is the proportion of inrush predictions amongst all actual inrush instances in the data.
Confusion matrix and ML model performance metrics.
Accuracy:
Recall:
Precision:
To extract insights from the data and identify the primary drivers of wet inrushes, feature importance was calculated using the mean decrease in impurity (MDI) method (Breiman, 2001) and the SHAP (SHapley Additive exPlanations) approach (Lundberg and Lee, 2017). The reason for using two methods was that the MDI method, which is the conventional method for calculating feature importance in a RF model, may not always accurately reflect the true importance of features in the dataset, especially when dealing with highly correlated features (Strobl et al., 2008). In such cases, it is often necessary to use additional techniques, such as SHAP values, to gain a better understanding of the relative importance of the correlated features. SHAP feature importance considers all possible combinations of features and calculates the contribution of each feature to the predicted output, taking into account interactions between features (Lundberg and Lee, 2017).
Deep Ore Zone datasets
For this study, data was compiled from several DOZ-maintained databases that included drawpoint records for: daily draw tonnages, weekly drawpoint classification (fragment size and water content classes), monthly HoD and inrush incidents. The time frame selected for the analysis was from January 2017 to August 2019, corresponding with a mature state of the DOZ mine, with numerous inrush events occurring during this period.
The inrush incidents were originally reported by the Load Haul Dump remote operators, and the information related to the inrush incidents were documented in wet muck spill reports. The reports included information on the location (drawpoint number) and the timing of inrush incidents, inrush clean-up buckets, draw activity prior to the incident and inrush material class. The wet muck inspectors (trained assessors from the underground geotechnical, hydrology, operation production and geology departments) conducted regular (at least once a week) wet muck inspections by visually mapping the drawpoints. They reported the drawpoints’ wet muck conditions, including the water content and fragment size classes and hang-up conditions. All of the data related to the inspections were compiled in the DOZ wet muck database.
The dataset for the RF model development was created by classifying daily DOZ drawpoint observations as either inrush or no-inrush, based on whether the drawpoints experienced an inrush shortly (up to 24 h) after being mucked. The constructed dataset consisted of 971 inrush instances and 89,550 no-inrush instances related to the 670 active drawpoints during the study period. The dataset was randomly split into a training and validation set consisting of 70% of the data and a test set consisting of the remaining 30%.
This study exclusively focuses on ‘yellow’ and ‘red’ hazard-level drawpoints (A3, B2, B3, C2 and C3 in Table 2) and inrush events triggered by mucking. This approach was used to selectively include instances that were susceptible to inrush events to prevent the RF model from generating unnecessary TNs and to avoid an artificially inflated model accuracy. The unnecessary TNs were related to instances where the drawpoint was not active (no mucking at drawpoint) or its fragment size and moisture content suggested that its susceptibility to inrush was minimal at DOZ (‘green’ drawpoints: A1, A2, B1, C1).
Results and discussion
Random forest model results
A RF model was constructed using the inrush variables specified in Table 3. Figures 6(a) and 6(b) illustrate the model feature importance obtained using the MDI and SHAP methods, respectively. The order of the features is similar in both figures, where the previous inrush history has the highest importance value, and the next seven variables with the highest importance are draw rate (short term and long term), fragment size class, history of inrush at adjacent drawpoints, differential draw index (short term and long term) and HoD. On the other hand, water class, subsidence and continuous draw had relatively low importance values, while geological domain and IOZ footprint above the DOZ had very low importance. It is noted here that contrary to the central importance of water class for inrush susceptibility, it is ranked as having low importance because the dataset only included moist and wet drawpoints. Dry drawpoints were not included to avoid an artificially high model performance as there are no inrush events associated with dry drawpoints.
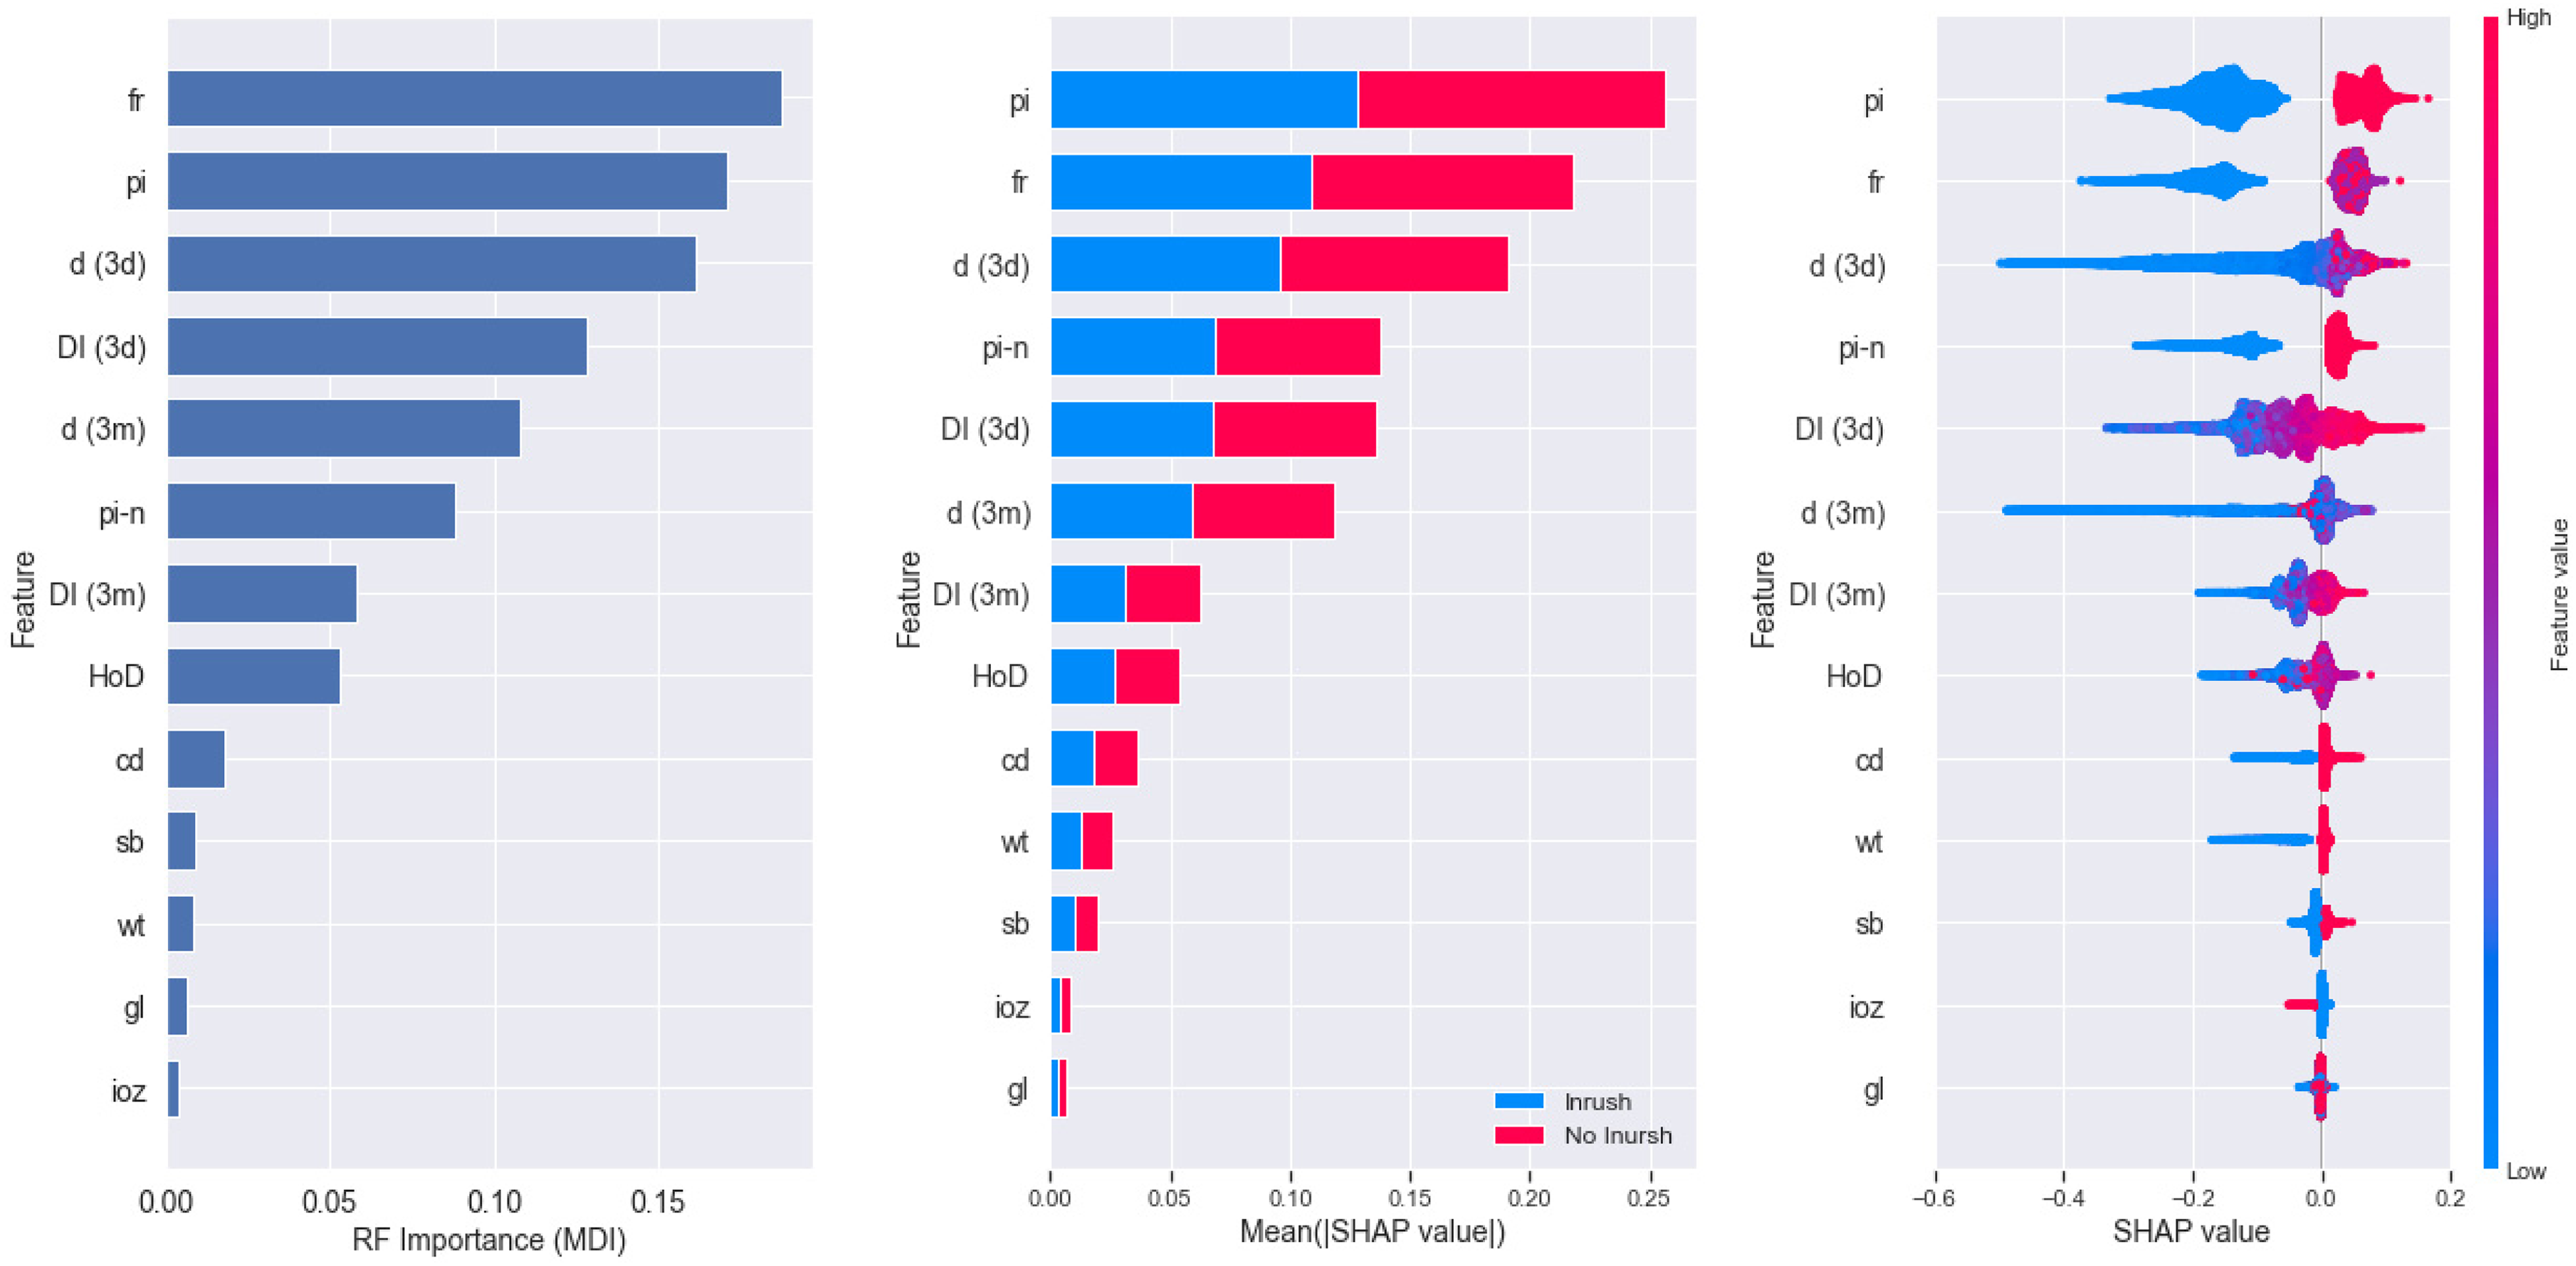
(a) Random forest MDI feature importance; (b) SHAP feature importance; (c) SHAP values plot (see Table 3 for feature codes).
Figure 6(c) shows the SHAP value plot, which illustrates the positive or negative impacts of the input features on inrush susceptibility. The plot is made of all instances in the training data, and each dot represents a single data point in the dataset. The dot colours show whether the corresponding variables are high (in red) or low (in blue) for the instances. The dots on the positive (right-hand) side of the plot indicate that the feature had a positive impact on inrush, while the dots on the negative (left-hand) side indicate that the feature had a negative impact. For example, a higher fragment size class (red colour) has a positive impact (positive SHAP value) on inrush likelihood, meaning that a higher fines content is positively correlated with inrush occurrence. The positive correlation with inrush holds true for most of the input features (except for IOZ footprint and continuous draw), supporting the conceptual assumptions used in selecting those features as inputs for developing the RF model.
The performance of the RF model was evaluated by systematically experimenting with different subsets of the features shown in Figure 6 to ensure the highest performance was achieved. The geological domain (gl), continuous draw (cd) and IOZ footprint (ioz) features, which had either a counterintuitive impact or minimal impact on model performance, were removed from the final model. After selecting the input features for the final RF model, hyperparameter tuning was performed to optimise the performance of the model. Table 5 summarises the attributes of the resulting model with the optimised performance. The model comprised an ensemble of 50 trees with maximum tree depth of 8 and class weight of 1:150, corresponding to the inverse frequency of inrush and no-inrush instances.
The developed RF model attributes.
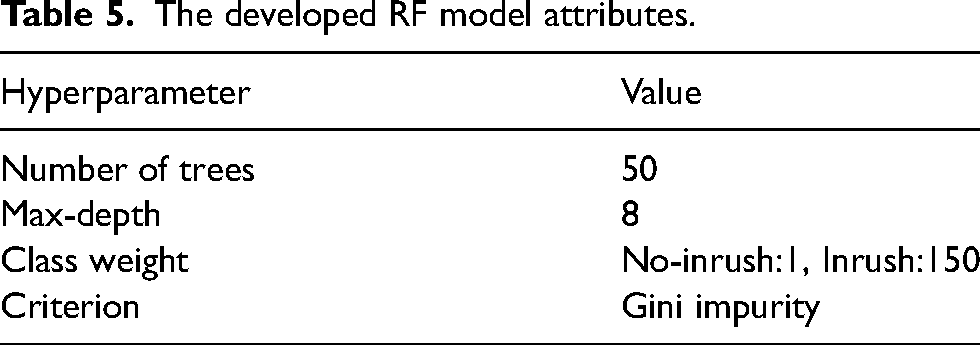
Figure 7 shows the confusion matrix and the performance metrics obtained from the RF model. The accuracy of the model was 85%, meaning the model accurately predicted 85% of the no-inrush and inrush instances combined. The recall was 84%, meaning the model predicted 84% of the inrush instances correctly. The precision was 6%, meaning 16 out of 17 instances predicted as inrush turned out not to be an actual inrush.
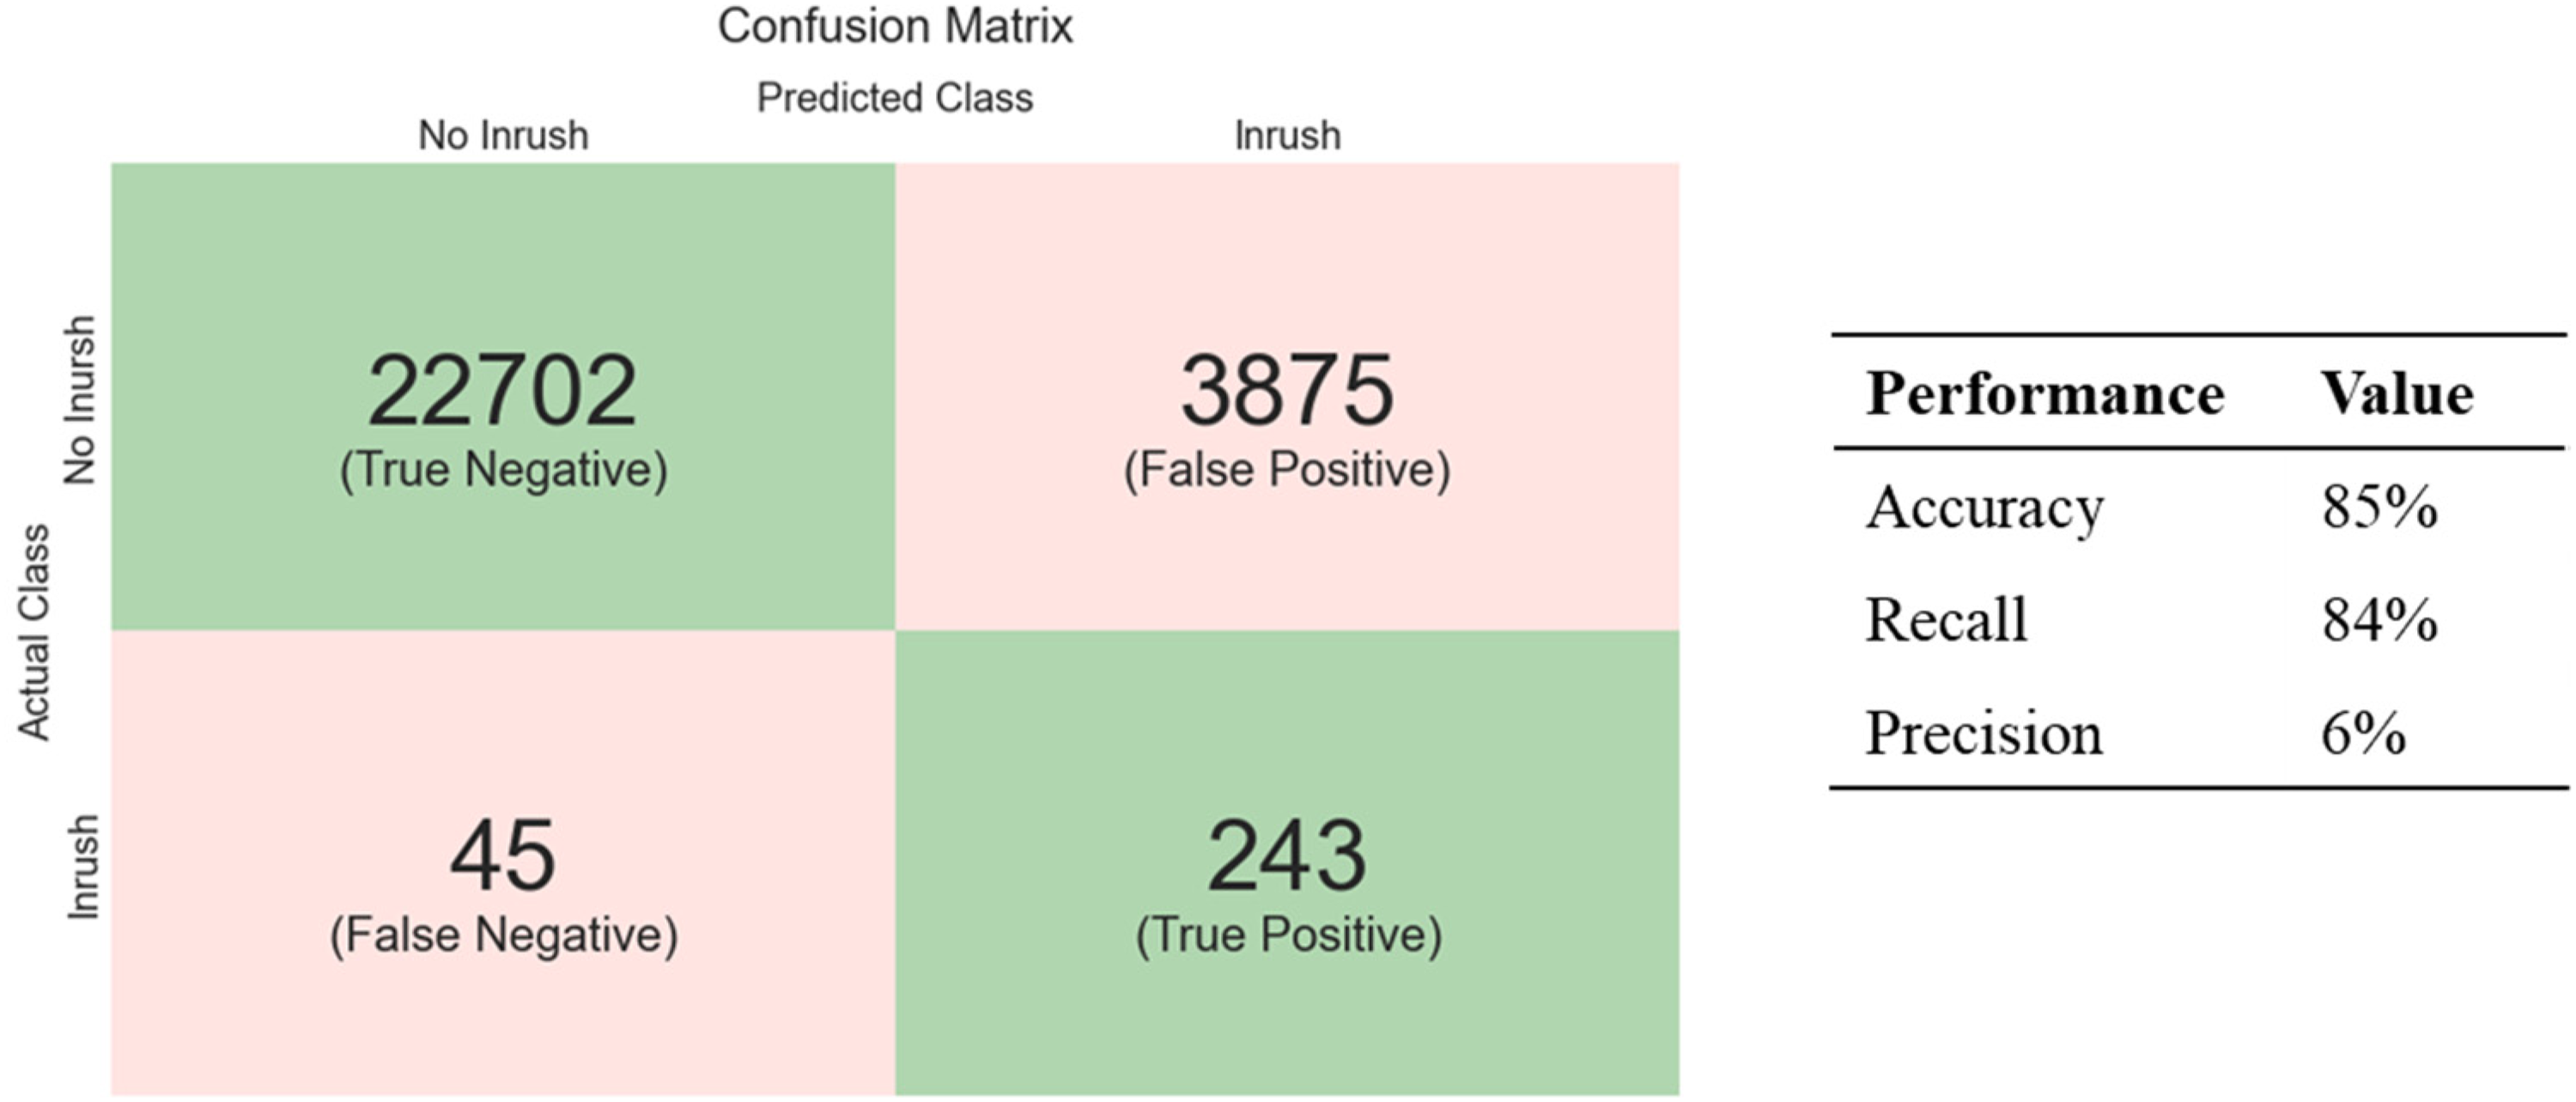
The confusion matrix and performance metrics obtained from the RF model.
Discussion
The objective of the RF model developed through this study is to provide a better understanding of the spatial-temporal pattern and the drivers of the historical inrush incidents, utilising the mine's extensive historical inrush datasets. This model does not aim to replace the mine's safety risk mitigation measures. Rather, it aims to help identify the scenarios leading to inrushes, thereby guiding strategies to minimise the occurrence of inrush and its impacts.
The achieved model performance (Figure 7) suggests that the model fulfils this objective. The model accurately labels 84% of inrush incidents (recall value introduced in Table 4) and 85% of instances overall (accuracy value introduced in Table 4), which is a notable achievement considering that the dataset only included instances related to ‘yellow’ and ‘red’ inrush susceptible drawpoints under active mucking. The model's ability to distinguish between inrush and no-inrush instances 85% of the time shows that the model is uncovering the spatial-temporal pattern of inrush incidents and identifying the no-inrush scenarios at susceptible drawpoints. For comparison, a randomly guessing model would achieve an accuracy of around 50% in this binary classification problem.
An investigation into the model's FN predictions (45 out of 288 as shown in Figure 7) revealed that more than half of these were related to the very first incident at a moist or wet drawpoint. Although attempts were made to predict the first inrush events at drawpoints by including the feature related to previous inrush history at neighbouring drawpoints in the model, such instances (i.e., exact location and time) were generally harder to predict. The model also appears to have a low precision related to a high number of false-positive predictions. Low precision is a common challenge when attempting to predict infrequent events, which are inherently difficult to predict in terms of their exact timing of occurrence. Despite the low precision, the model has the ability to narrow down the scenarios leading to inrush at a series of inrush susceptible drawpoints where no additional information would otherwise be available regarding the likelihood of inrush occurrence.
Note that there is a trade-off between model precision and recall. Modifying the model to yield a higher precision (e.g., by assigning a higher class weight to the minority class) will often lead to a decrease in recall, and vice versa. The choice between precision and recall depends on the specific application and the costs associated with FPs and FNs. Specific to this study, the choice between precision and recall is not as critical as the objectives of the DOZ model and ML analysis was to provide insights into the spatial-temporal pattern of inrushes and the relative impact of different factors contributing to their occurrence.
The overall order of the features in the feature importance plots (Figure 6) is intuitive and consistent with the mechanistic understanding of inrush mechanisms and triggers. The model indicates that for inrushes to occur at ‘yellow’ and ‘red’ drawpoints, certain baseline conditions likely had to be met at the drawpoint, including high fines content, high HoD, previous inrush history and previous inrush history at the neighbouring drawpoints. Inrushes were most likely triggered when these unfavourable baseline conditions were combined with short-term (transient) and long-term heavy isolated draw conditions as reflected in the three-day and three-month d and DI features. The impact of the subsidence zone on model performance was low, as its impact on preferential flow was likely reduced by the overlying fractured Diorite zone and the presence of water in the IOZ mine. Similarly, the impact of geological domain, which was represented only as a binary feature, was likely already captured by the fragment size class feature. The RF model also shows that the impact of continuous draw on inrush susceptibly contradicts expectations. This discrepancy is likely due to the absence of a well-established framework for quantifying continuous versus non-continuous draw, as well as for assessing how periods of draw inactivity can influence saturation and stagnation cycles.
The presence of a water class (wt) amongst the model features with lower importance was also unexpected. From the ML perspective, a possible reason for the low importance of the water class feature is that the majority of drawpoints were classified as wet during the analysis period, with only 17% classified as moist. The imbalance in the number of samples between wet and moist drawpoints may have led to lower importance for the water (wt) feature, likely due to its lack of discriminatory power in distinguishing between the two classes. A closer examination of the data also revealed that several of the inrush instances labelled as moist for the water class were related to the scenarios when the drawpoint temporarily or permanently transitioned from moist to wet after the inrush event. Since the model uses the wetness class mapped up to one week prior to the event as input, this water class may not reflect the water content of the inrush material itself or post-event water content. Lastly, from an operation perspective, there might be a bias in visual classification of wet versus moist drawpoints. The current RF model does not include instances related to dry drawpoints, where the moisture content feature would have shown its significant impact (Varian, 2022).
In the developed RF model, the past occurrence of inrush (previous inrush history) has a high importance value. While it is common practice to use historical evidence as input features, it is crucial to ensure that the historical data is representative of the future events so that the model is not overfitting to that feature, in which case the model may rely heavily on past occurrences and not be able to adapt to new patterns. In the developed model, the use of previous inrush incidents as an input variable is balanced with other relevant input variables to ensure the model is adaptable to new patterns.
To investigate the possibility of overfitting and evaluate the dependency of the model on previous inrush history, the performance metrics were calculated for the training set and a version of the model that excluded the previous inrush incident variable (pi). The accuracies achieved for the training set and the model excluding pi were 85% and 82%, respectively, indicating that the RF model was not overfitting. The number of features is significantly lower than the number of instances in the model, further lowering the chance of overfitting. The maximum depth of the trees were also kept low to avoid complexity that could lead to overfitting.
The RF model presented in this study is developed based on the late-stage DOZ dataset and therefore reflects the patterns and correlations observed in a mature cave. It specifically illustrates how the conceptual understanding of the factors contributing to inrush at DOZ reveals itself through analysing the mine's actual inrush datasets. While the input variables used in the model align with the mechanistic understanding of inrush contributing factors, they are most relevant to mines with conditions similar to the DOZ mine. If this model is applied to a new cave mine, it is expected that a subset of the existing variables may become less relevant, the order of variable importance may change, or additional variables may be needed.
Training a similar ML model for inrushes at a different mine should start with developing a conceptual model that explains the inrush mechanisms and the specific factors contributing to fines generation and water entry at the mine. For example, for a new cave mine at a green-field site (i.e., one that is not being developed below an older mined-out cave), factors such as preferential flow along the cave boundary and localised concentrated flow through subsidence low points would likely have a greater influence on the spatial pattern of inrush incidents. In a mine in a generally dry environment, the impact of draw strategy on inrush susceptibility may not be as prominent, and inrush susceptibility may be localised only to specific wet areas in the mine. It is crucial to re-evaluate the use of the input variables when developing a similar model for a cave with different conditions and ensure that all of the variables representative of the new conditions are incorporated.
The application of machine learning to predict cave mining hazards has inherent limitations. The potential usefulness and accuracy of a machine learning model are closely connected to the relevance, quality and adequacy of its input features. The complex conditions within the draw columns can only be partially informed by the evidence and information gathered at the drawpoint level, which further points to the existing challenges in predicting inrushes. Additionally, data collected at the drawpoint level may be subject to common or occasional biases inherent to visual mapping and classification. The data collection campaigns are consistently evolving, becoming more systematic, frequent and comprehensive, thereby allowing for more refined data-driven models to be developed over time.
Conclusions
Inrush susceptibility at the DOZ panel cave mine was assessed using machine learning techniques. A RF model was developed to identify patterns and correlations that contributed to the occurrence of inrush incidents, with the ultimate goal of improving the understanding of inrush susceptibility, isolating scenarios leading to inrush incidents and guiding risk-informed decision making. For the development of the RF model, the conceptual understanding of inrush mechanisms and triggers was utilised to derive the key variables contributing to inrush incidents, which were then used as input features in the model.
The developed RF model used the inrush database collected at the DOZ mine between January 2017 and August 2019. This time frame covered a period that was related to the later stages of the DOZ cave's maturity and when the mine experienced several inrush incidents. The datasets used for the RF model development included 971 inrush instances and ∼89,000 no-inrush instances related to a series of coarse and fine drawpoints with moist or wet water content conditions (A3, B2, B3, C2 and C3 classes) during days when they were actively being mucked. The selected dataset exclusively included the instances that were presumed to be inrush-prone, ensuring realistic and non-inflated performance metrics were achieved from the RF model.
The feature importance of the RF model was obtained using SHAP and MDI methods. Using SHAP as an alternative to MDI ensured accurate results were achieved when handling correlated input features. The feature importance results from both methods showed that previous inrush history, fragment size, draw rate (short term and long term), differential draw index (short term and long term) and history of inrush at neighbouring drawpoints had the highest impact on inrush susceptibility. In contrast, subsidence low points, IOZ footprint, geological domain and water class had lower importance values. The variables with low importance either had limited variability to capture different scenarios leading to inrush versus no-inrush or their impact was likely reduced by other factors, particularly features that were highly correlated with them. Thus, the specific results presented in this study do not negate the potential impact of these variables on inrush susceptibility, but rather suggest that their contributions may be less significant due to limited variability, overshadowing by other highly correlated features, and potential biases in drawpoint mapping data.
The results from the RF model indicated a positive correlation between the majority of the inrush contributing factors and inrush likelihood, supporting the conceptual assumptions used in selecting those factors as input features for developing the RF model. To ensure that the obtained feature importance was realistic and overfitting was minimised, the potential for overfitting was assessed by comparing the model performance on both the training and test sets, as well as testing a version of the model that excluded the feature with highest importance value.
The RF model achieved an accuracy of 85%, meaning the model accurately classified 85% of the no-inrush and inrush instances combined. The recall score indicated the model accurately classified 84% and 85% of inrush and no-inrush instances, respectively. The model is one of the few models developed to assess inrush susceptibility on an event basis. The achieved performance metrics showed that the model met its objective of providing insights into the spatial-temporal pattern of inrush incidents.
The results of this study are based on data specific to the DOZ mine and its hydrogeological and fragmentation characteristics. Therefore, the trained inrush model itself is not directly applicable to a mine with a different geological and hydrogeological setting or mine design. However, the framework presented in this study to develop the RF model is applicable to other mines. For this purpose, a conceptual mechanistic model needs to be developed first to explain the most likely inrush mechanisms at the mine. The mine's data can then be used to retrain a similar model, incorporating site-specific inrush contributing variables. ML models are capable of building on themselves as more data is fed into them, allowing for real-time assessment of inrush susceptibility as the conditions at the mine evolve. For example, subsequent training iterations of a model incorporating new data may show changes in the order of the importance of inrush variables, providing insights into which contributing factors have the most impact on inrush susceptibility at a given time. This real-time assessment would not be successful without using a model that is trained and regularly updated based on site-specific data.
Recent improvements in data collection techniques (e.g., currently implemented at PTFI's Grasberg Block Cave mine) have led to more systematic, comprehensive and frequent gathering of data over time. These offer the opportunity to leverage the enhanced data sources for advancing the conceptual understanding of inrush mechanisms and developing predictive models with improved performance. While using ML-based methods appears to be a suitable approach to utilise massive mine databases, it is only one of several approaches that need to be pursued to advance inrush research and improve operational practices. Large-scale physical modelling, research-informed targeted data collection and monitoring, and post-event laboratory testing of inrush materials are amongst the other essential components of research that need to be carried out to test hypotheses and address the existing gaps in inrush knowledge.
Footnotes
Acknowledgements
This research was carried out as part of the International Caving Research Network (ICaRN). The authors would like to acknowledge the support of PT Freeport Indonesia, the Natural Sciences and Engineering Research Council of Canada (NSERC), Mitacs, the Centre for Innovation in Mineral Resource Engineering (CIMRE) and the University of British Columbia for funding this project, and providing the essential resources to conduct this study. The authors would also like to express their deepest appreciation to the Deep Ore Zone (DOZ) mine site team for collecting and organizing the extensive and valuable data sets used in this research as well as their valuable feedback during numerous discussions.
Declaration of conflicting interests
The author(s) declared no potential conflicts of interest with respect to the research, authorship, and/or publication of this article.
Funding
The author(s) received no financial support for the research, authorship, and/or publication of this article.