
Abstract
Mine planning and pit design involve making the best decisions and recognising good practices for the profitable exploitation of mineral resources. A pit design project begins with the delimitation of the ore body in the form of blocks, then going through pit optimisation, then pit design and sequencing and ends with the economic evaluation. Several techno-economic indicators are used in these stages and have a direct impact on mine planning. The research methodology proposes an in-depth study of the geotechnical parameters of the pit to be conducted in mine planning in a more reliable and assertive way, with the aid of 3D geotechnical modelling. From a geotechnical point of view, an initial validation of the methodology was performed in an example of application in an iron mine, where a change in the planned slope angles of a pit over a 5-year period was suggested. The suggested new pit guarantees safety factors that suit the minimum stability requirements and proposes a 1.49% higher ore availability and a 0.90% increase in the net present value.
Introduction
A mining project involves a range of studies necessary for its implementation. Such studies encompass several engineering specialties in general, and leading the mining project to the desired success strongly depends on the accuracy of such studies as each study is of significant specific importance (Costa, 1979).
The design of a mining enterprise can be divided into stages: exploration, resource estimation, reserve estimation, production planning, economic analysis, risk and sensitivity analysis, project start-up and operation. These steps are performed repeatedly depending on the quality of the information and the maturity of the project, which makes the process iterative and dynamic (Costa, 1979; Hustrulid et al., 2013).
Mine planning will lead the development of the project. According to Hustrulid et al. (2013), the planning phase involves three basic stages: conceptual study, preliminary study and feasibility study. Each of these stages depends on the maturity of the information and its level of reliability, starting from the exploratory phase, going through the evaluation of resources and reserves and the validation of the project and ending with the investment decision based on a feasibility report.
The planning and design of open pit pits comprise the decision-making process of a realistic and actionable plan that seeks to extract mineral resources profitably. Planning is usually performed according to different timeframes, from short-term planning (e.g. anticipating immediate changes in mining activities) to long-term planning (e.g. anticipating profitable production until the end of the mine's life). Appropriate long-term mine planning requires the best decisions regarding pit design and mine sequencing, production rate, ore selection and mineral processing method.
According to Parra et al. (2018), mine planning follows a logical sequence of steps that are influenced by several parameters that directly affect the advancement to subsequent steps. Briefly, there are six steps: (1) construction of the block model; (2) optimisation; (3) definition of the ultimate pit and nested pits; (4) phase design; (5) sequencing; and (6) economic evaluation.
Optimisation seeks to determine the optimal ultimate pit (mathematics) based on an economic model subject to technical constraints (Peroni, 2002). Several algorithms have been developed to meet optimisation goals. However, two methods have achieved greater popularity and computational implementation: the floating cone technique (David et al., 1974; Lemieux, 1979; Pana and Carlson, 1966) and the Lerchs-Grossmann algorithm (Lerchs and Grossmann, 1965).
The ultimate pit can be discretised into nested pits. These pits are generated from the application of discounted and revenue factors that simulate the net present value (NPV) under various economic conditions. A given set of nested pits defines a pushback (Figure 1), which, according to Hustrulid and Kuchta (1995), can be defined as a mine expansion phase, and it can be developed in practice and mined bench by bench.
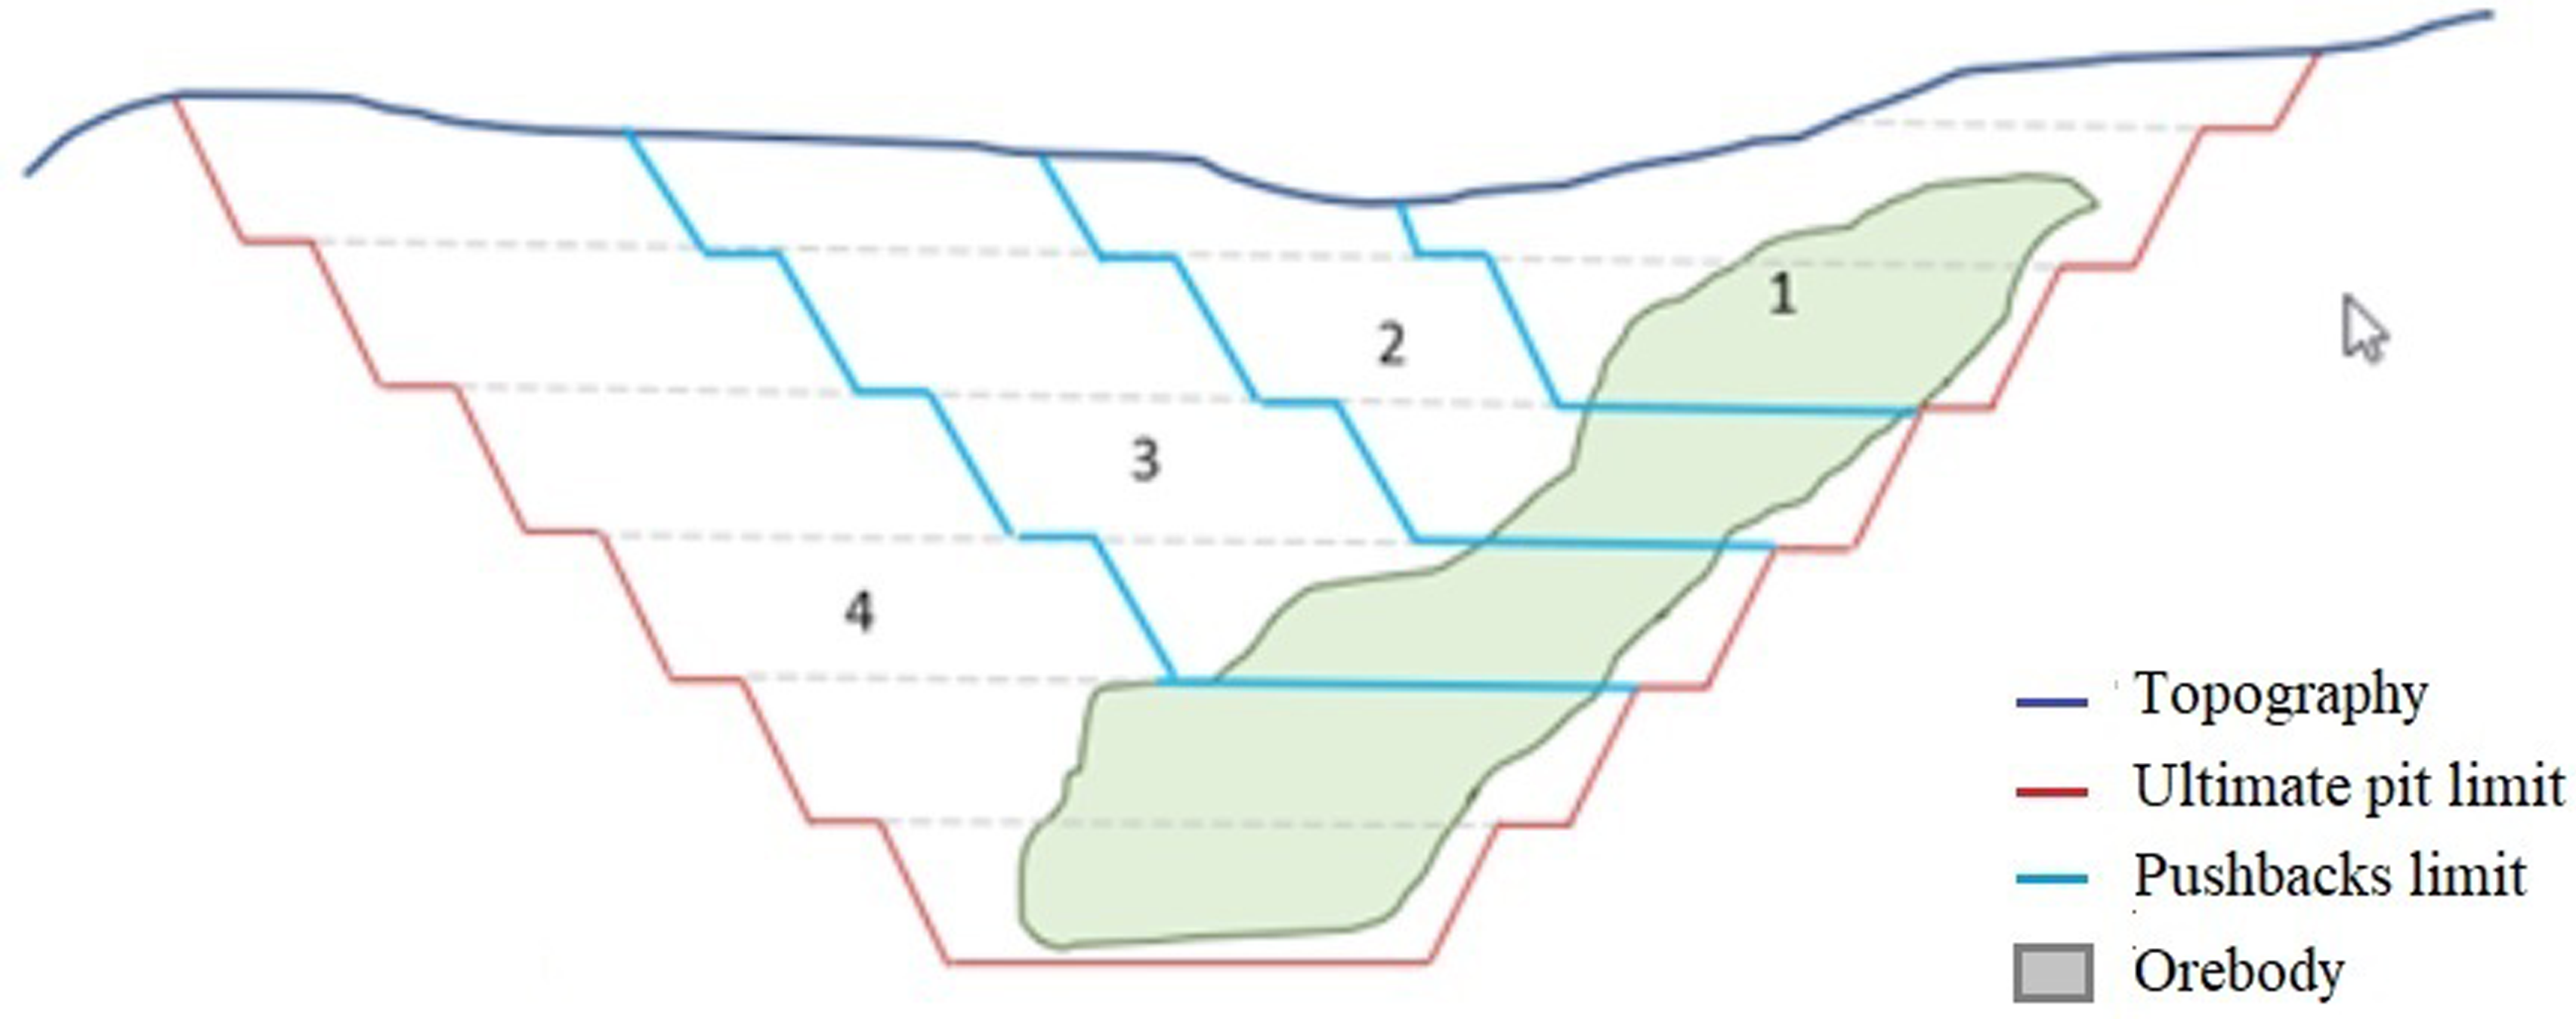
Example of ultimate pit divided into four operational pushbacks. Source: Modified from Maepa (2021).
In the design stage of the phases, the operation of the pit is performed, considering each of the pushbacks and the predetermined mining limits through the ultimate pit. In this sense, some structures are inserted, such as benches with adequate face angles, height and width, ramps and windrows.
The arrangement of the slopes is a determining factor in this stage, and according to Wyllie and Mah (2004), in an open pit slope design, there are three main components: (1) overall slope angle, (2) inter-ramp and (3) face angle of the individual bench. A representation of the three components can be seen in Figure 2.
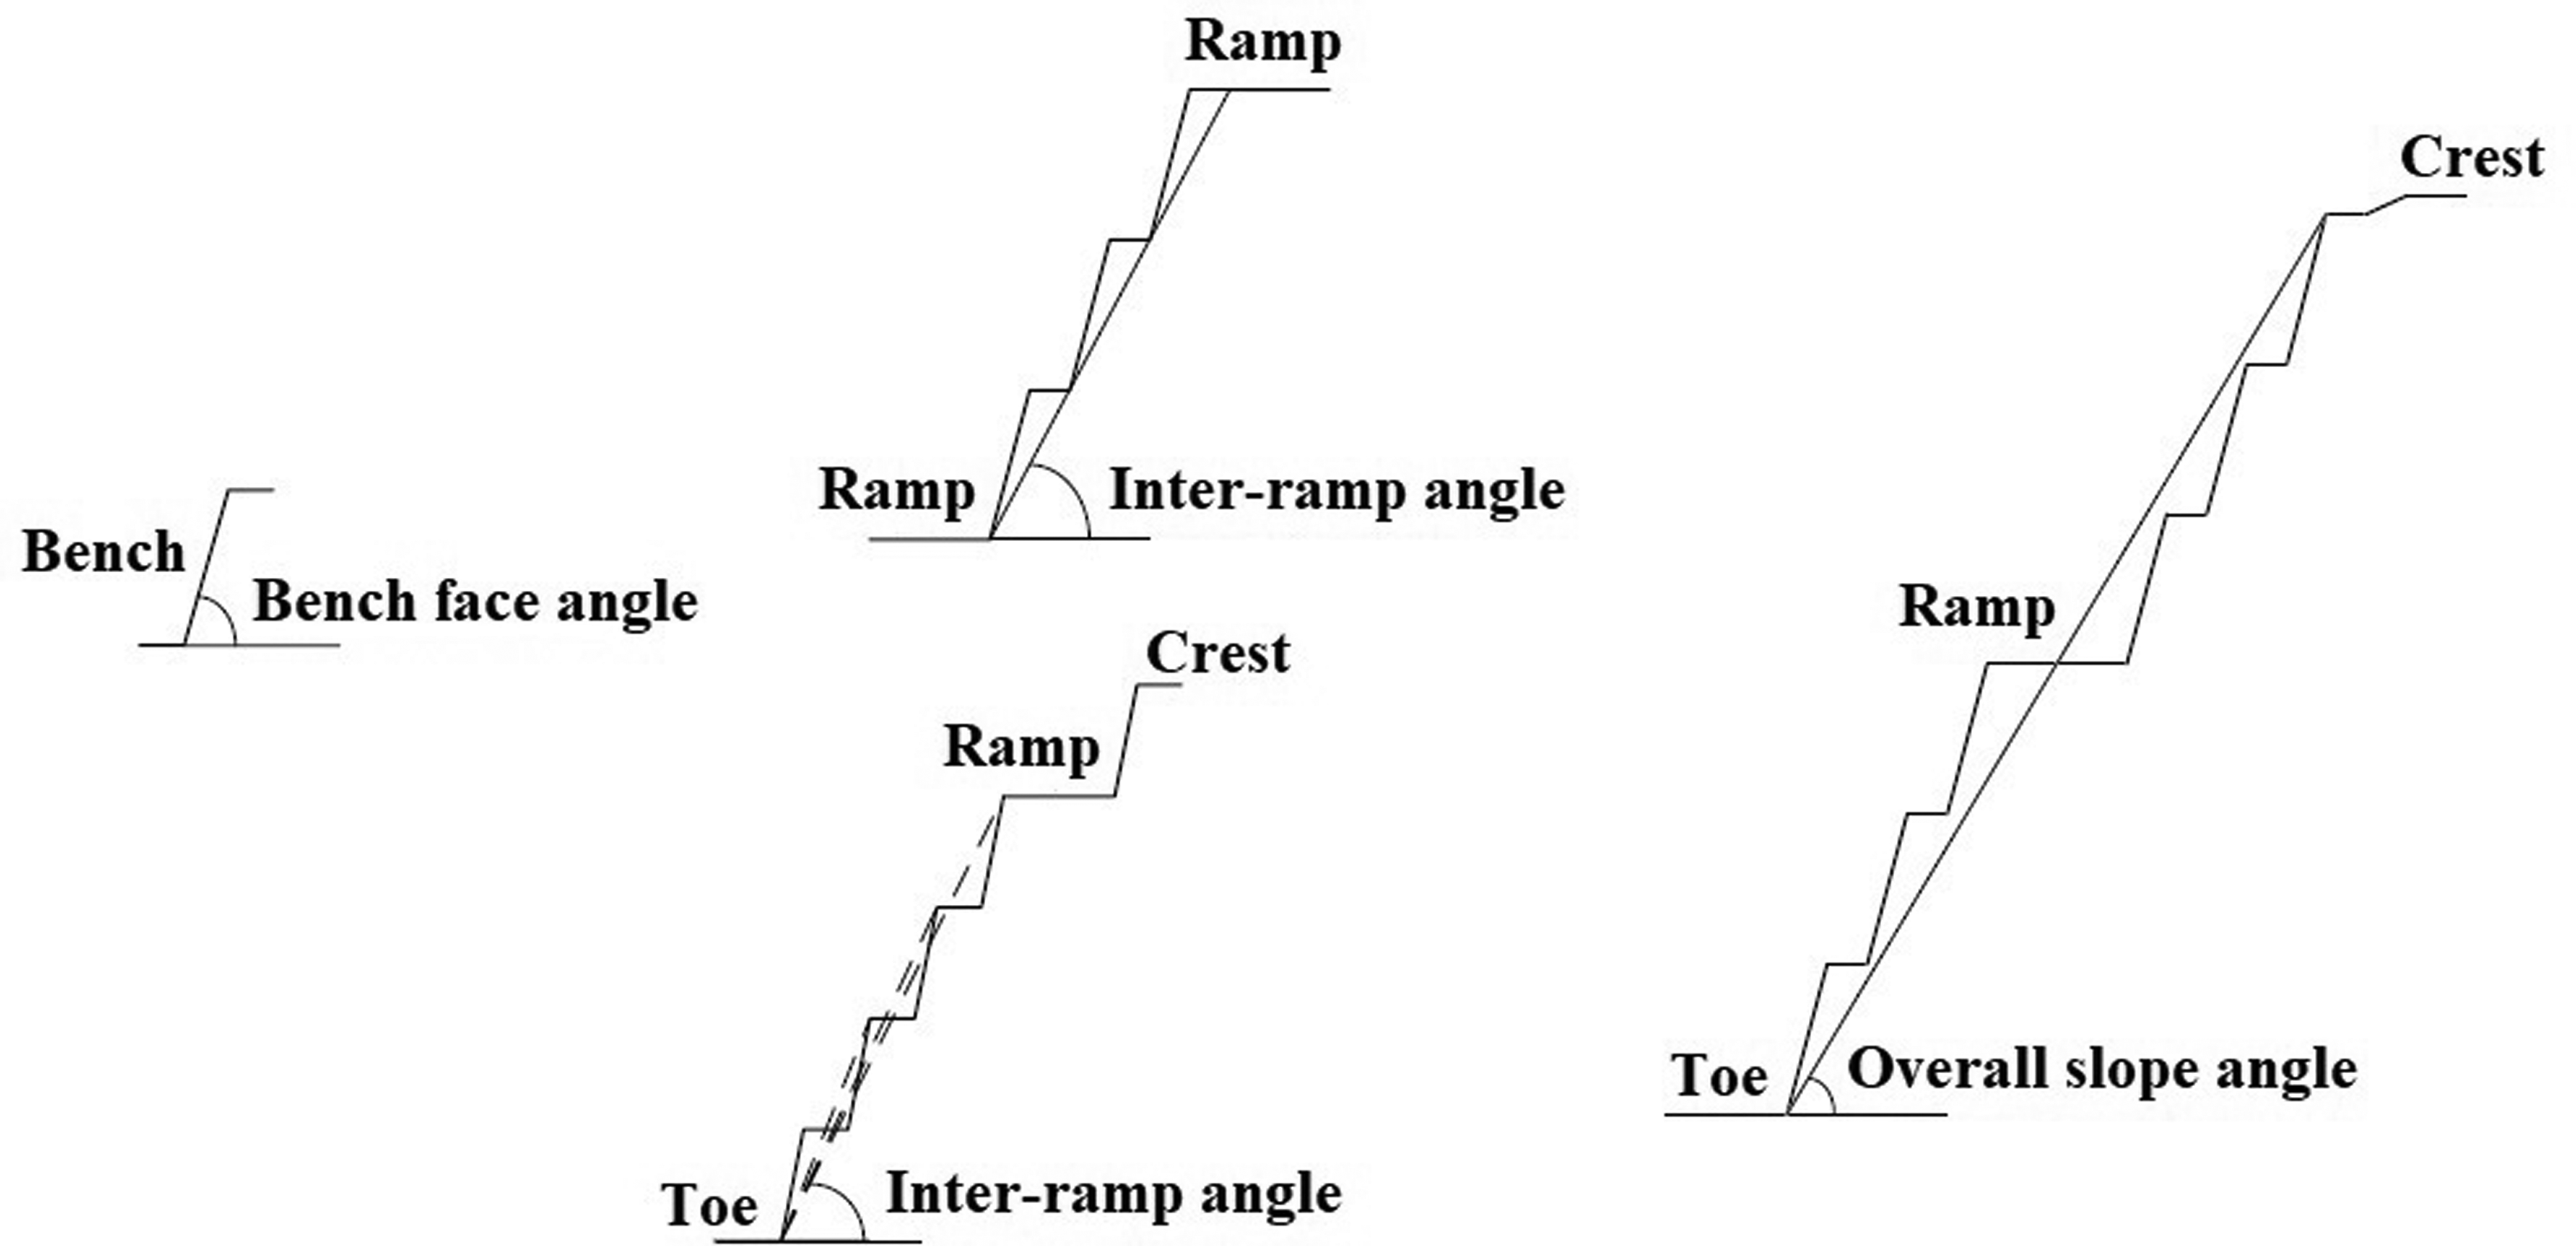
Representation of the main components of a slope project. Source: Modified from Sjöberg (1999).
Sequencing is the chronologically established plan to mine a deposit in a manner compatible with the technical and economic conditions of a particular operation. The conditions and particularities of the operation throughout the mining period are conducted and changed to achieve previously established targets, such as the production rate and the stripping ratio (SR) (Peroni, 2002).
A slope design is expected to establish stable benches throughout the life of the mine and beyond mine closure (Read and Stacey, 2009). Essentially, slope stability seeks to minimise the risks in terms of the safety of people and equipment and the economic risks of the reserves. In addition, to meet economic needs, it is expected to maximise ore recovery and minimise overburden removal.
To choose the best values of the slope angles, available geotechnical information of a certain level of quantity and quality are used, taking into consideration the balance of economic, operational and safety aspects; such information enable the creation of a geotechnical model. With the aid of this information, the potential mechanisms of slope failure will be evaluated, and solutions will be sought to ensure the stability of the slopes.
The geotechnical model, along with its four components, the geological, structural, rocky massif and hydrogeological models, is one of the main pillars of a slope design. Integrating the geotechnical model with relevant field data requires not only keen observation and attention to detail but also rigorous adherence to data collection protocols (Dunn, 2014).
With the advancement of computer technology, there has been an improvement in the storage and processing of large amounts of raw data, thus allowing the creation of geotechnical models in three dimensions (3D). In stability analyses, it is often suggested that the geotechnical parameters be adapted to 3D block models as an alternative to using geotechnical information.
3D geotechnical modelling is a very important tool for mine engineering because it has the ability to assist in the preparation of a slope design when conducting slope stability analysis. The three-dimensional approach has the ability to perform more representative analyses because it is closer to the operational reality.
The failure mechanism of a slope in an open pit mine is difficult to define because failure can occur gradually, and the moment when the slope is no longer stable can be highly subjective. Hoek and Bray (1981) identified several failure mechanisms of slopes, which include planar failure, wedge failure, toppling, circular failure and landslides. Each type of failure has a specific method for analysing slope stability. The methods are based on the critical factors identified from the geotechnical model and the slope components (face angle, inter-ramp angle and overall angle).
To perform a quantitative estimate of the stability of a slope, analytical models capable of mathematical solutions are used. For any analytical model, the analysis requirements are the slope and fault geometry, the material properties (hydrological, rock mass and strength) and any assumptions about stress distributions. Among the various methodologies for slope stability analysis, the following stand out: limit equilibrium, numerical models and probabilistic models (Antocheviz, 2018; Cheng and Yip, 2007; Rezende, 2013; Vecci, 2018). Any instability must be controllable, either in terms of individual benches or overall slopes.
The limit equilibrium technique is the predominant method for assessing the stability of slopes in two or three dimensions. By identifying potential failure mechanisms, it determines factors of safety for specific geotechnical scenarios. It proves to be a suitable option when evaluating the stability of structures such as retaining walls, foundations, earth or rock dams, open-pit mines and slopes in general (Huang, 2014).
Over the years, some design acceptance criteria in terms of slope stability have been developed. Among the criteria, we highlight the factor of safety (FoS), the probability of failure, the consequences of slope displacement in mining operations and the risk. Traditionally, the concept of FoS has been used and is defined as the ratio between the real shear force and the minimum shear force to maintain equilibrium (Bishop, 1955). The FoS calculation generally uses the generalised Hoek‒Brown (Hoek et al., 2002) and Mohr‒Coulomb (MC) rupture criteria.
Several previous studies have addressed various methodologies for evaluating slopes in open pit design projects, introducing innovative technologies aiming to reduce costs, increase revenues, and ensure operational safety. Khalokakaie et al. (2000) employed two approaches to estimate average and safe slope angles using pit optimisation software. The first approach identifies the steepest safe angle through kinematic analysis, while the second approach determines slope angles using limit equilibrium analysis in terms of FoS or failure probability by Monte Carlo simulation. Catalan and Onederra (2016) aimed to implement best practices in blast performance evaluation, adhering to stringent geotechnical requirements, including the reconciliation of key geotechnical design parameters (berm width, slope face angle, inter-ramp angle and overall slope angle). Agosti et al. (2023) investigated the integration of all of mining activities tax carbon's cost into pit optimisation projects, in parallel with use specialised software to automatically determine optimised slope profiles.
In this article, the objective is to present the initial validation of the methodology, applied in an iron ore mine. The methodology studies the geotechnics of the pit through 3D geotechnical modelling and uses the results as input data in mine planning. In the sections that follow, the methodology, the application of methodology and the results and discussions of this application will be presented. The last section presents the findings of the study.
Materials and methods
The proposed methodology developed a 3D geotechnical model, with information about the rock mass and its lithogeotechnical qualities, for a representative stability analysis, which meets the safety conditions and contributes to eventual gains in mine planning. By integrating 3D geotechnical modelling with mine planning, geotechnical information was better used at the project level, leading to improved reliability in planning in relation to operation (adherence). Figure 3 presents a flowchart of the study methodology.
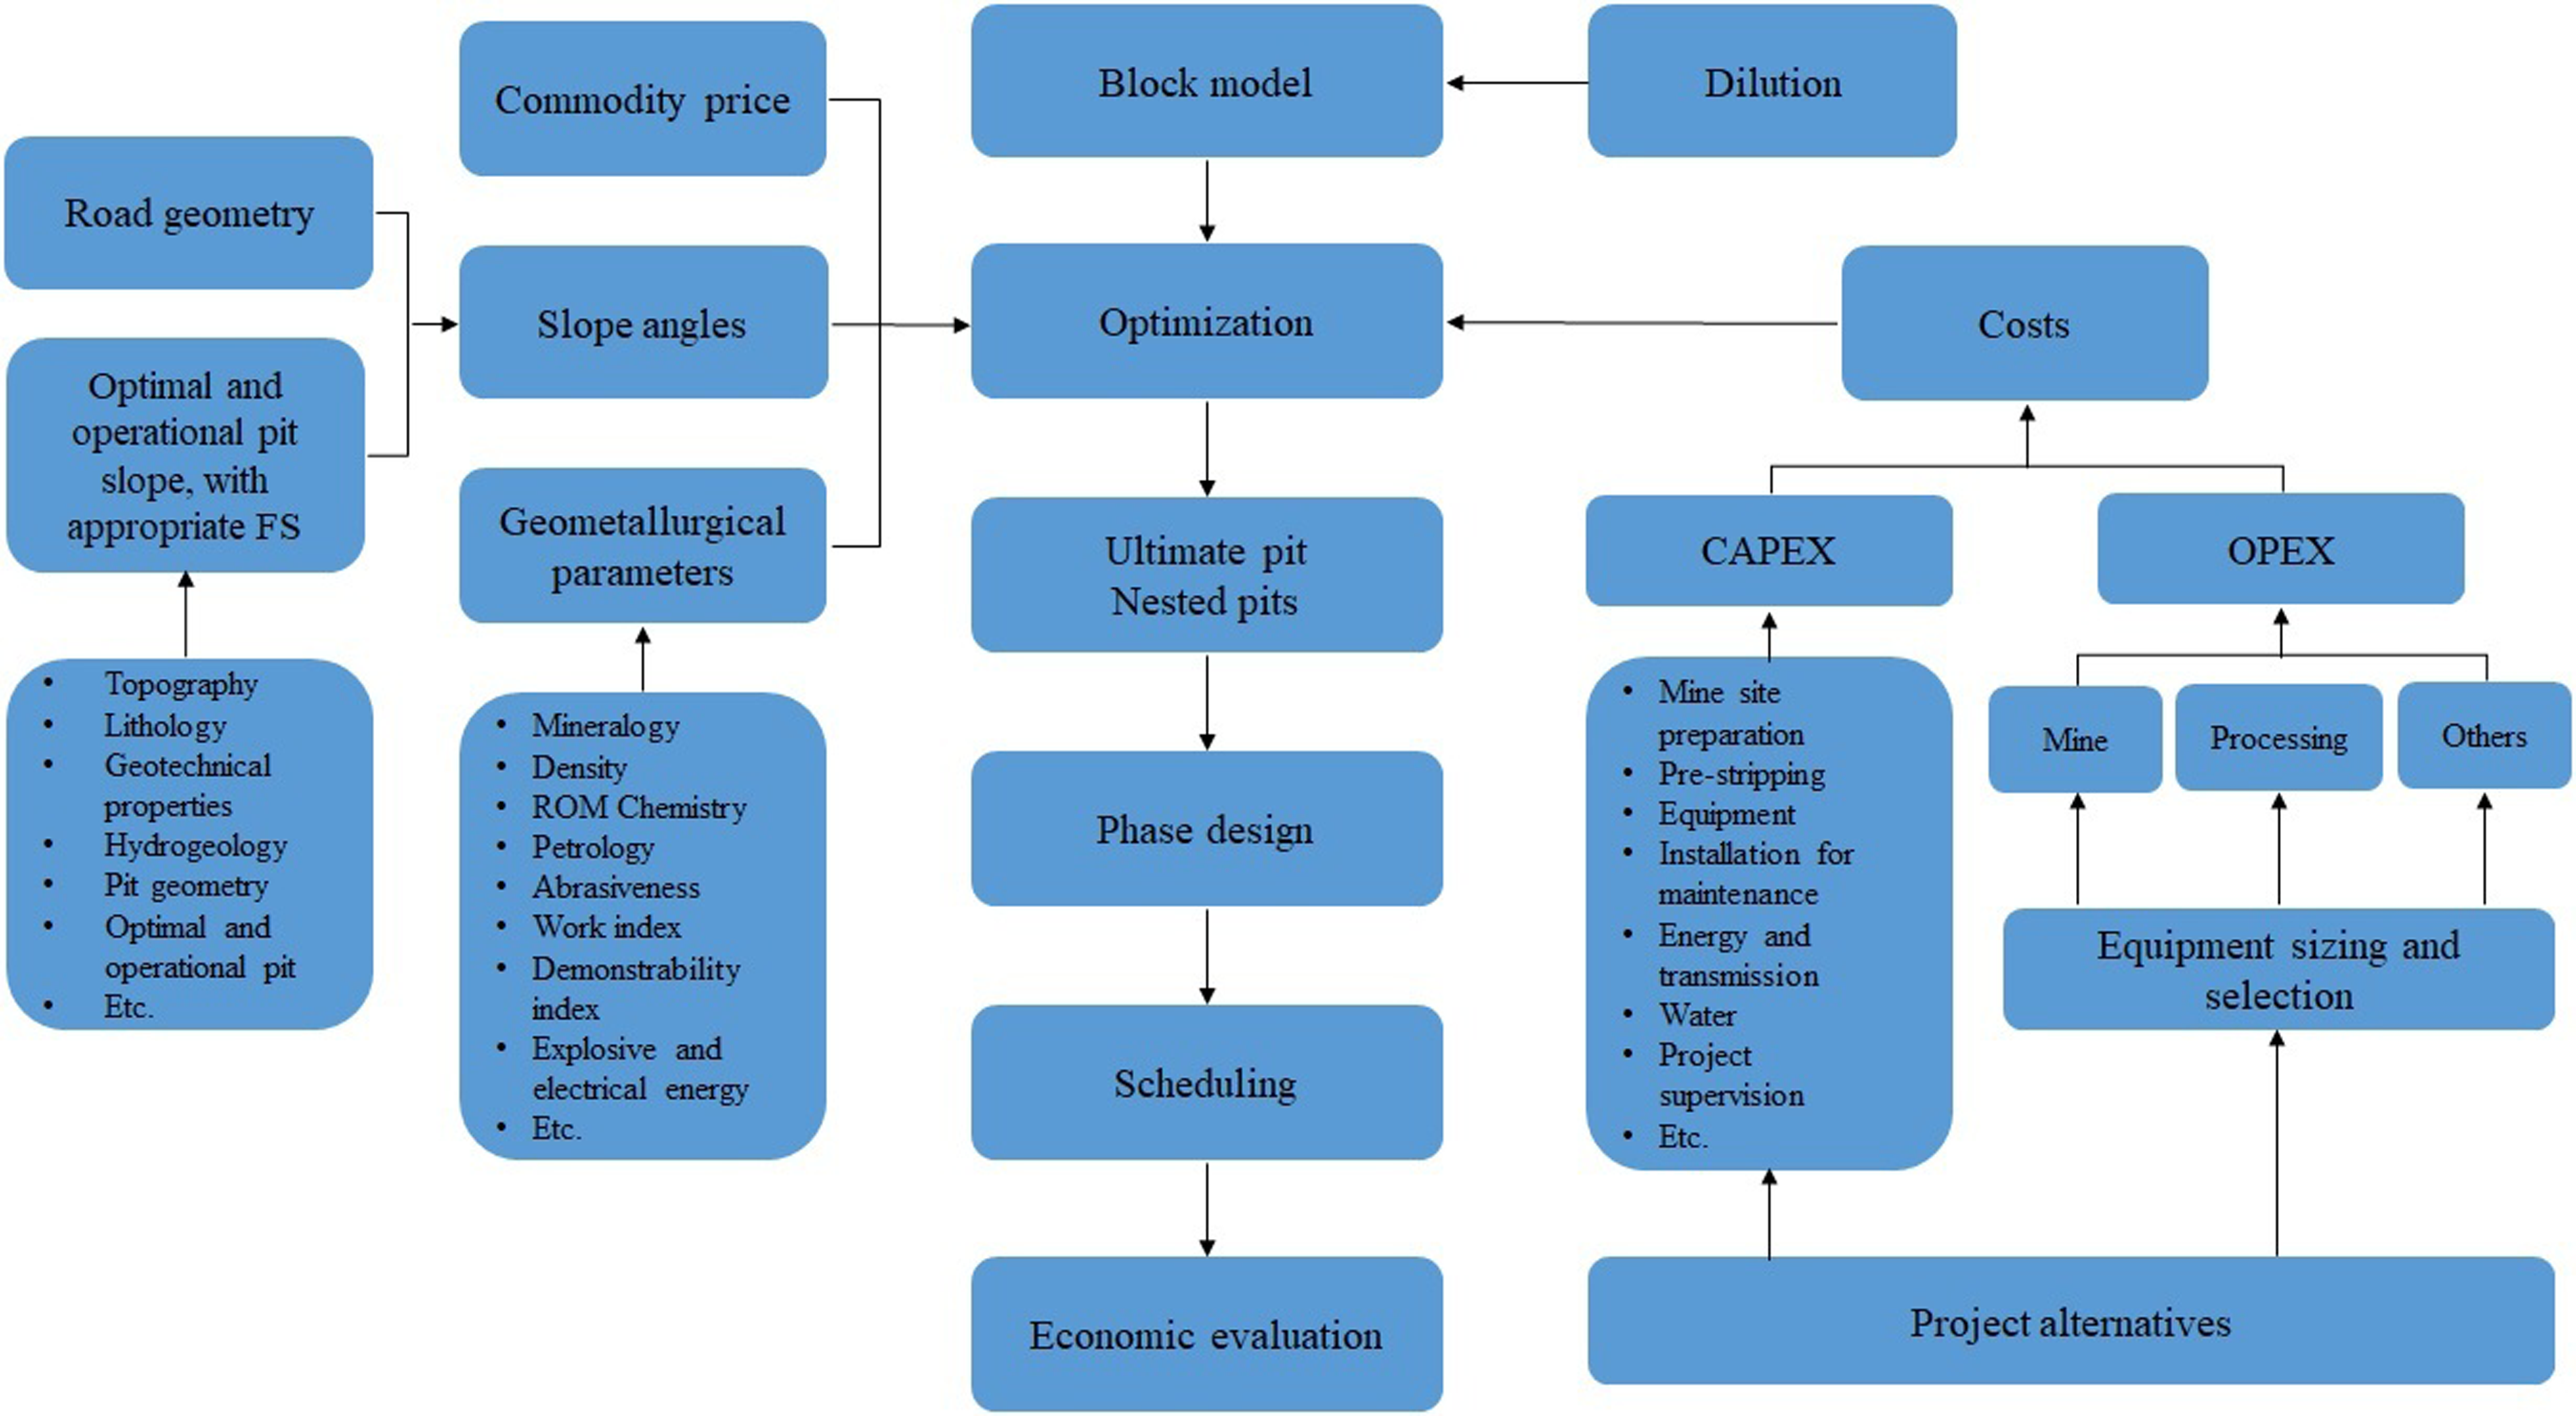
Flowchart of methodology and techno-economic parameters. Source: Adapted from Parra et al. (2018).
The flowchart in Figure 3 is an adaptation of the flowchart presented in the study by Parra et al. (2018); it shows the stages of mine planning and the various techno-economic parameters that directly influence each of these stages. For the initial validation of the methodology, the main contribution of 3D geotechnical modelling was in relation to the slope angle parameter.
A slope stability analysis was performed using a 3D geotechnical model and an operational pit over a 5-year period. When this was identified in a sector of the pit, the FoS did not meet the stability conditions, and thus modification of the geometry of the slopes was suggested, aiming to improve the safety of the pit at this location.
To assess the stability of the open-pit excavation, the three-dimensional geometry of the excavation was considered. This type of analysis is not common in open-pit slope projects. However, with the advancement of technology, powerful software tools have emerged enabling 3D limit equilibrium analyses over large areas (Lu et al., 2013). The method involves dividing the mass above the failure surface into multiple vertical columns, with each column subjected to normal and shear forces acting on the sides and bases of the structural unit of failure. Therefore, the FoS represents the ratio between the resisting forces and the acting forces favourable to sliding. Several authors have conducted reviews on 3D analyses (Cheng and Yip, 2007; Kalatehjari and Ali, 2013; Lam and Fredlund, 1993).
Based on the new suggested face angles, a new operationalisation was performed, followed by a new stability analysis, where the FoS met the stability conditions. Finally, an evaluation of tonnes and grades of the new pit was performed, and it identified a greater availability of ore and an increase in NPV compared to the original pit.
Application of methodology
The methodology was applied in an open pit iron ore mine located in southeastern Brazil. The topographic surface of the mine corresponds to an area of approximately 2225 ha. The block model of the resources consisted of a grid measuring 2900 m (east‒west), 2500 m (north‒south) and 1200 m (elevation). The blocks have dimensions of 12.5 m × 12.5 m × 6 m, totalling 232 columns, 200 rows and 200 levels. The model does not completely fill the grid and thus presents a quantity of 6,191,283 blocks. The main qualitative and quantitative attributes of each block contained in the block model are types of lithology, classification of the mineral inventory (measured, indicated, inferred), density, percentage of global content of the chemical components (Fe, Si, P, among others) and percentage content of the fractions +6.3 mm and −6.3 mm of the chemical components (Fe, Si, P, among others). Table 1 presents the lithologies present in the block model according to the abbreviation (Litho) and numerical code (Lithon), along with the designation of ore and waste rock.
Classification of lithologies.
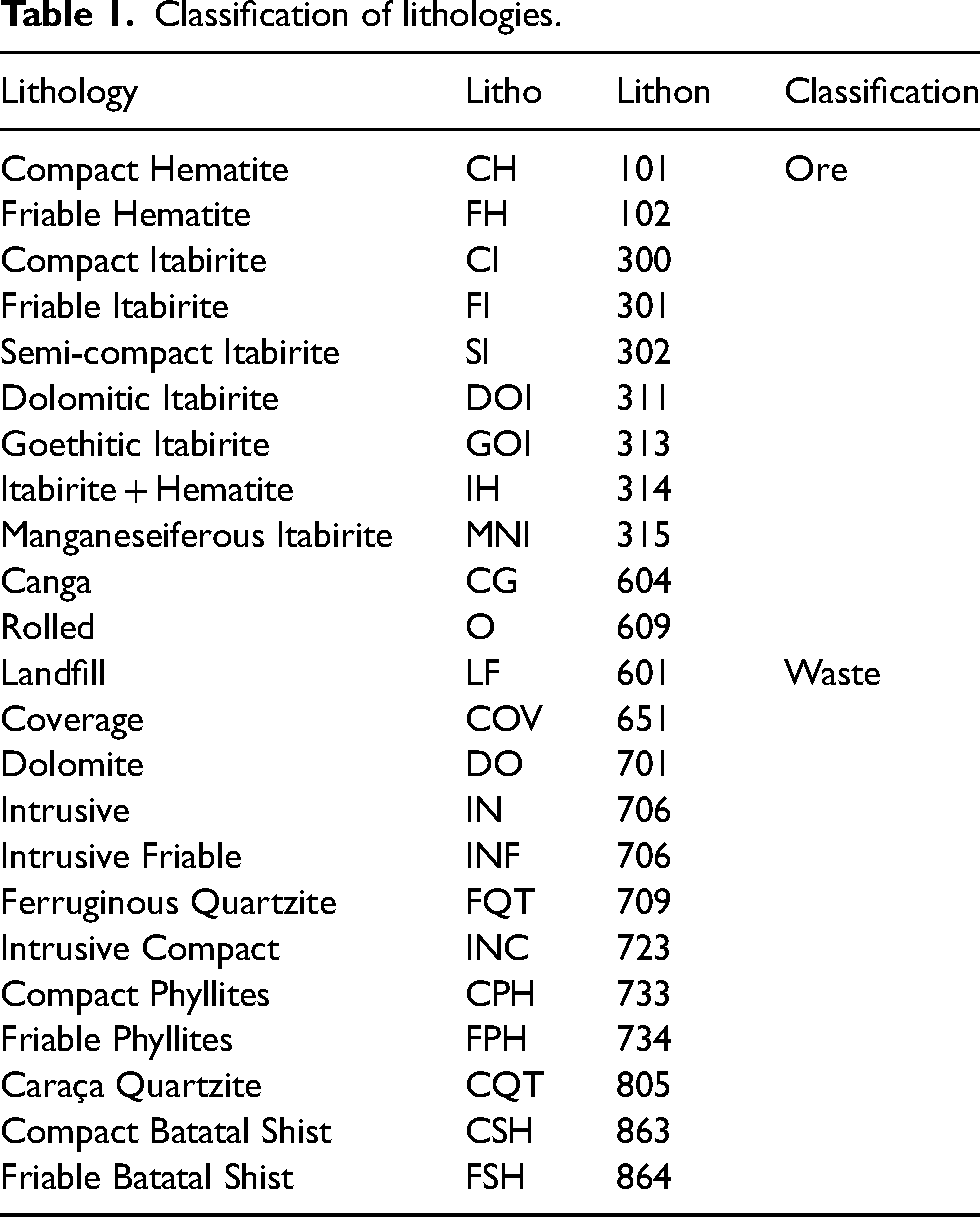
The ore body is predominantly composed of itabirite, and the overburden layers are predominantly composed of quartzite, shist and phyllite. The depth of the block model varies between 1360 m and 328 m, where the highest portion has a thickness of approximately 1032 m and the lowest, 740 m. Figure 4 shows a vertical section of the block model, with lithology classification.
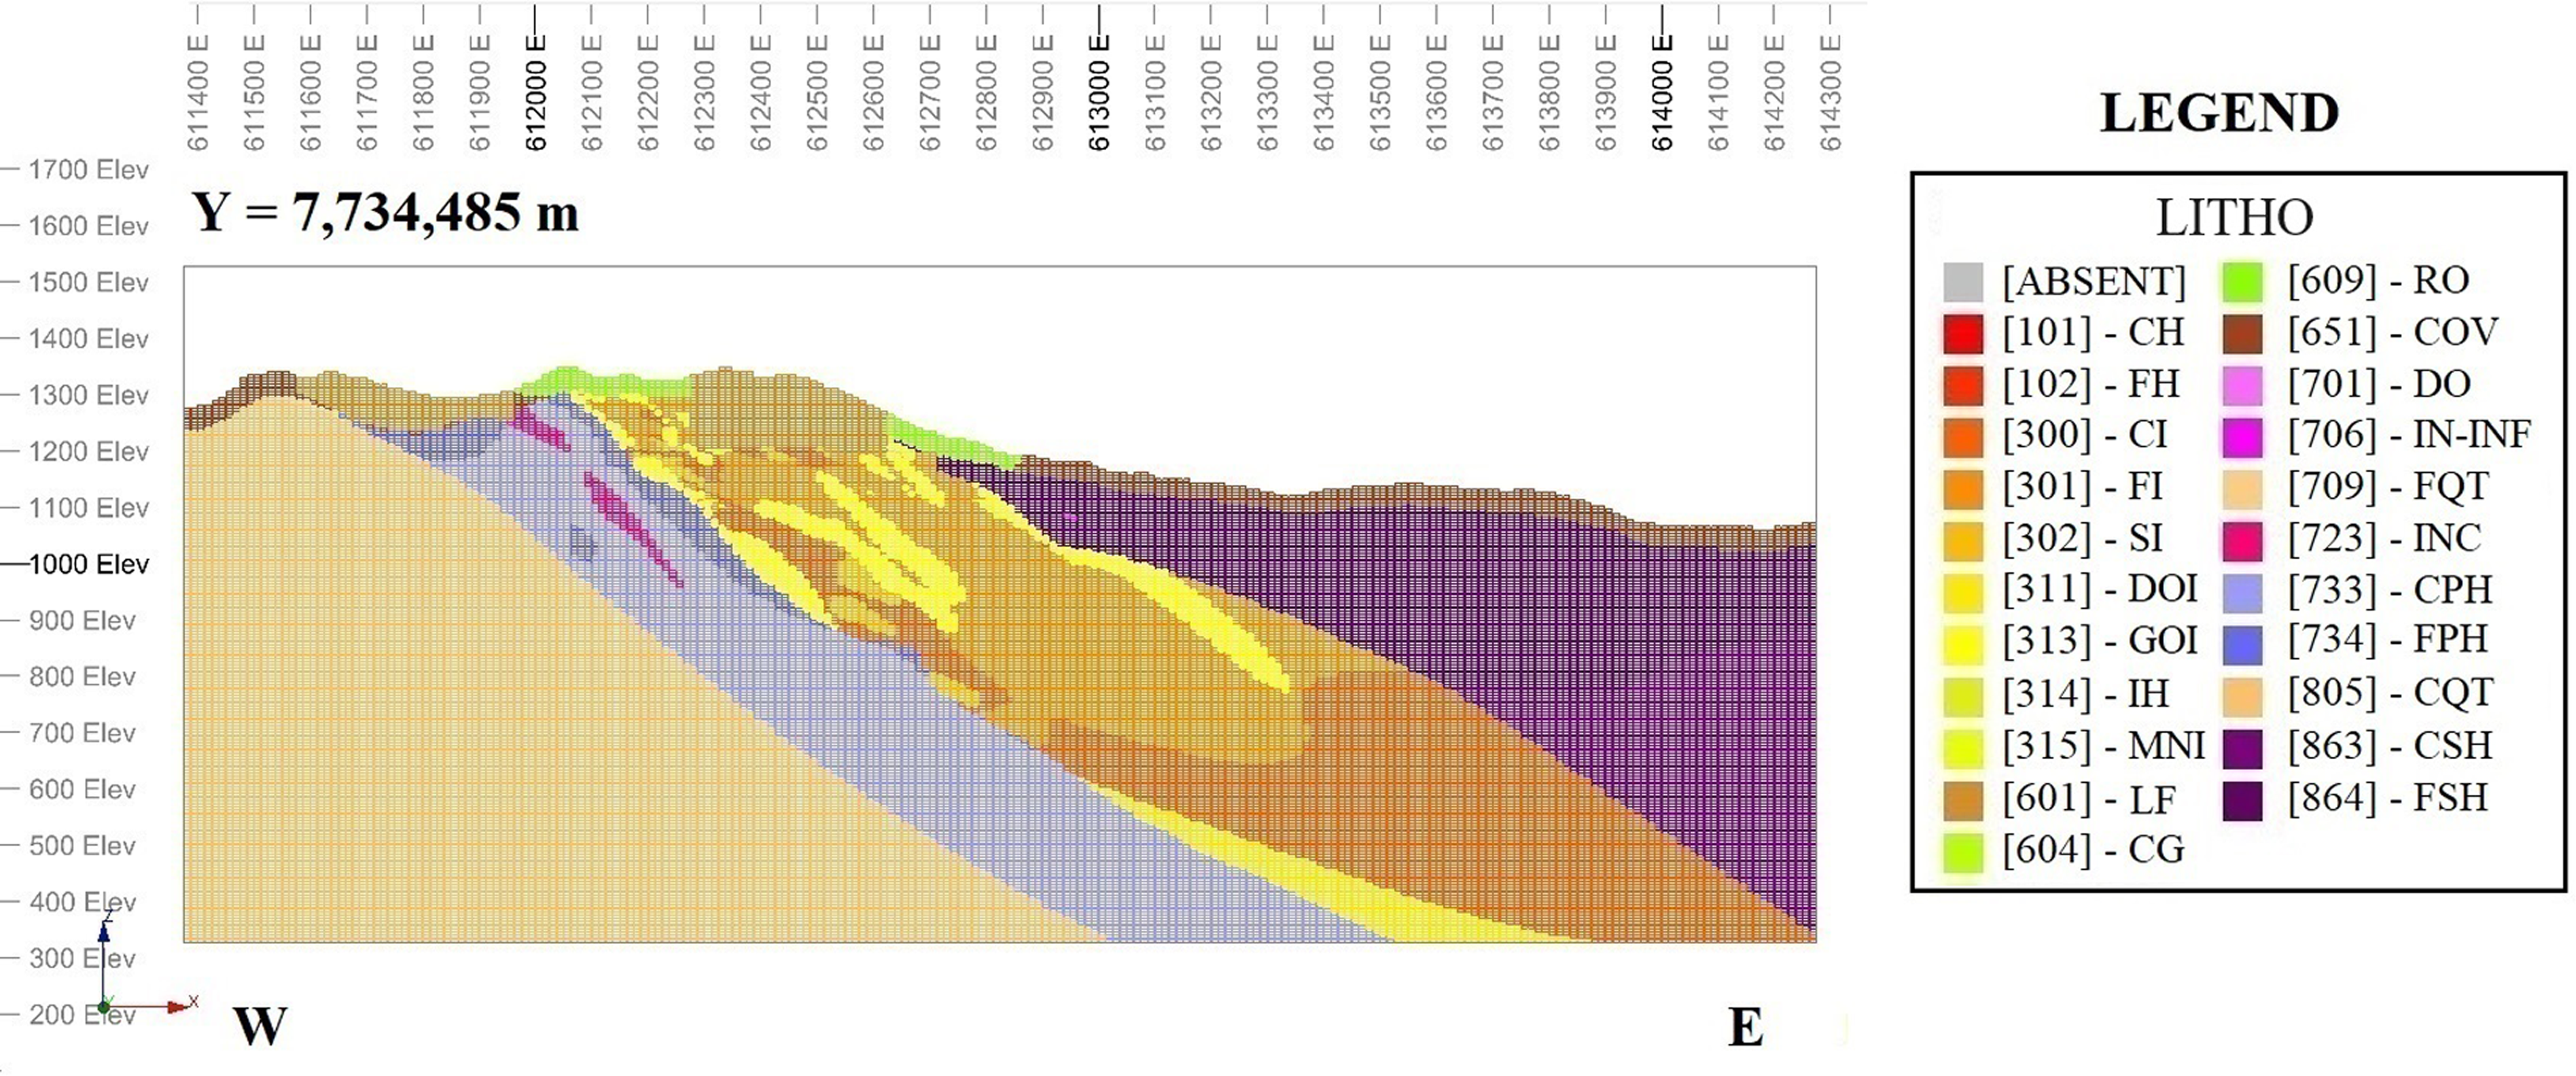
Vertical section of the block model.
Planning data
The planning data consist of all the parameters used for pit optimisation and for the design of the operational pit. In this study, an operational pit for a period of 5 years was considered. The technical-economic parameters used for optimisation are listed in Table 2. It is noteworthy that the operating costs and sales price consider the ore on a wet basis with the base year 2020.
Technical-economic parameters used in pit optimisation.
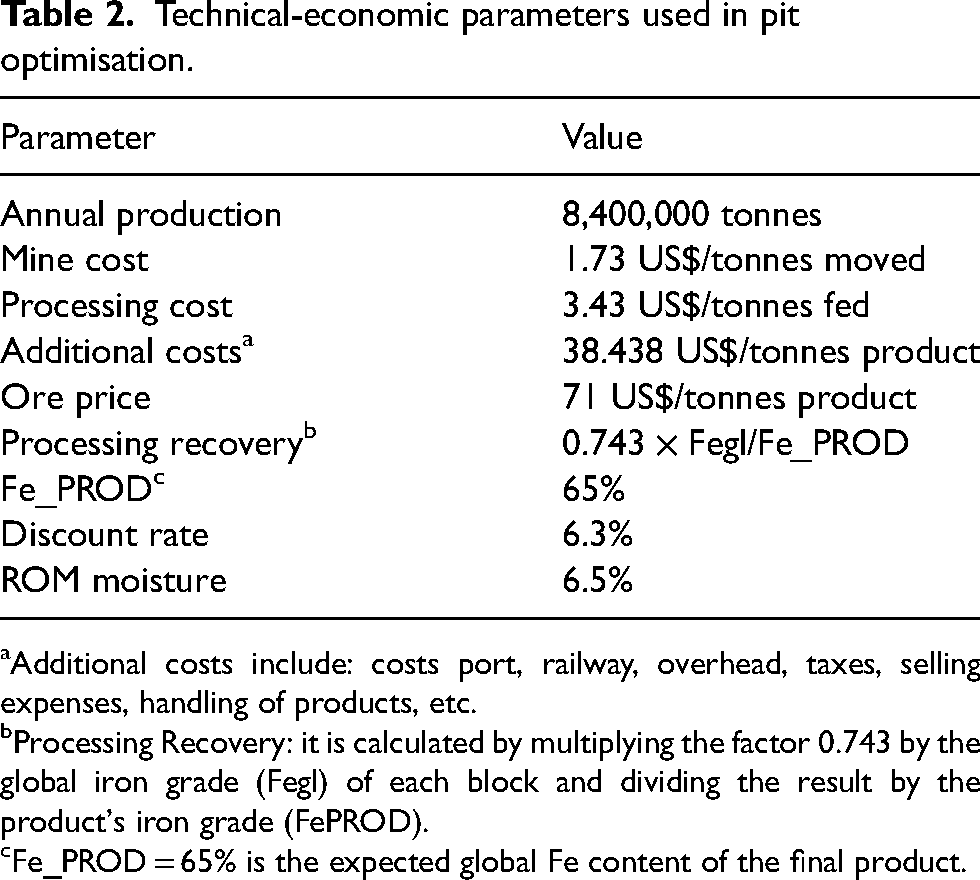
Additional costs include: costs port, railway, overhead, taxes, selling expenses, handling of products, etc.
Processing Recovery: it is calculated by multiplying the factor 0.743 by the global iron grade (Fegl) of each block and dividing the result by the product's iron grade (FePROD).
Fe_PROD = 65% is the expected global Fe content of the final product.
In addition to these parameters, some considerations regarding the ore lithologies were considered, which should have a cut-off content of 25% global iron and classes of measured and indicated mineral inventory. The overall slope angles between 24° and 46°, according to the lithologies, were also considered.
For the design of the operational pit, the following parameters were considered: bench width - 8 m; bench height – 12 m; bench face angle – between 32° and 74° (varies according to lithology); width of the roads – 20 m; longitudinal grade roads – 10%. Figure 5 shows perspective views comparing the topographic surface (year 0) with the operational pit (year 5), indicating the delimitation of the workplace of the advance in mining effort during the period of 5 years.
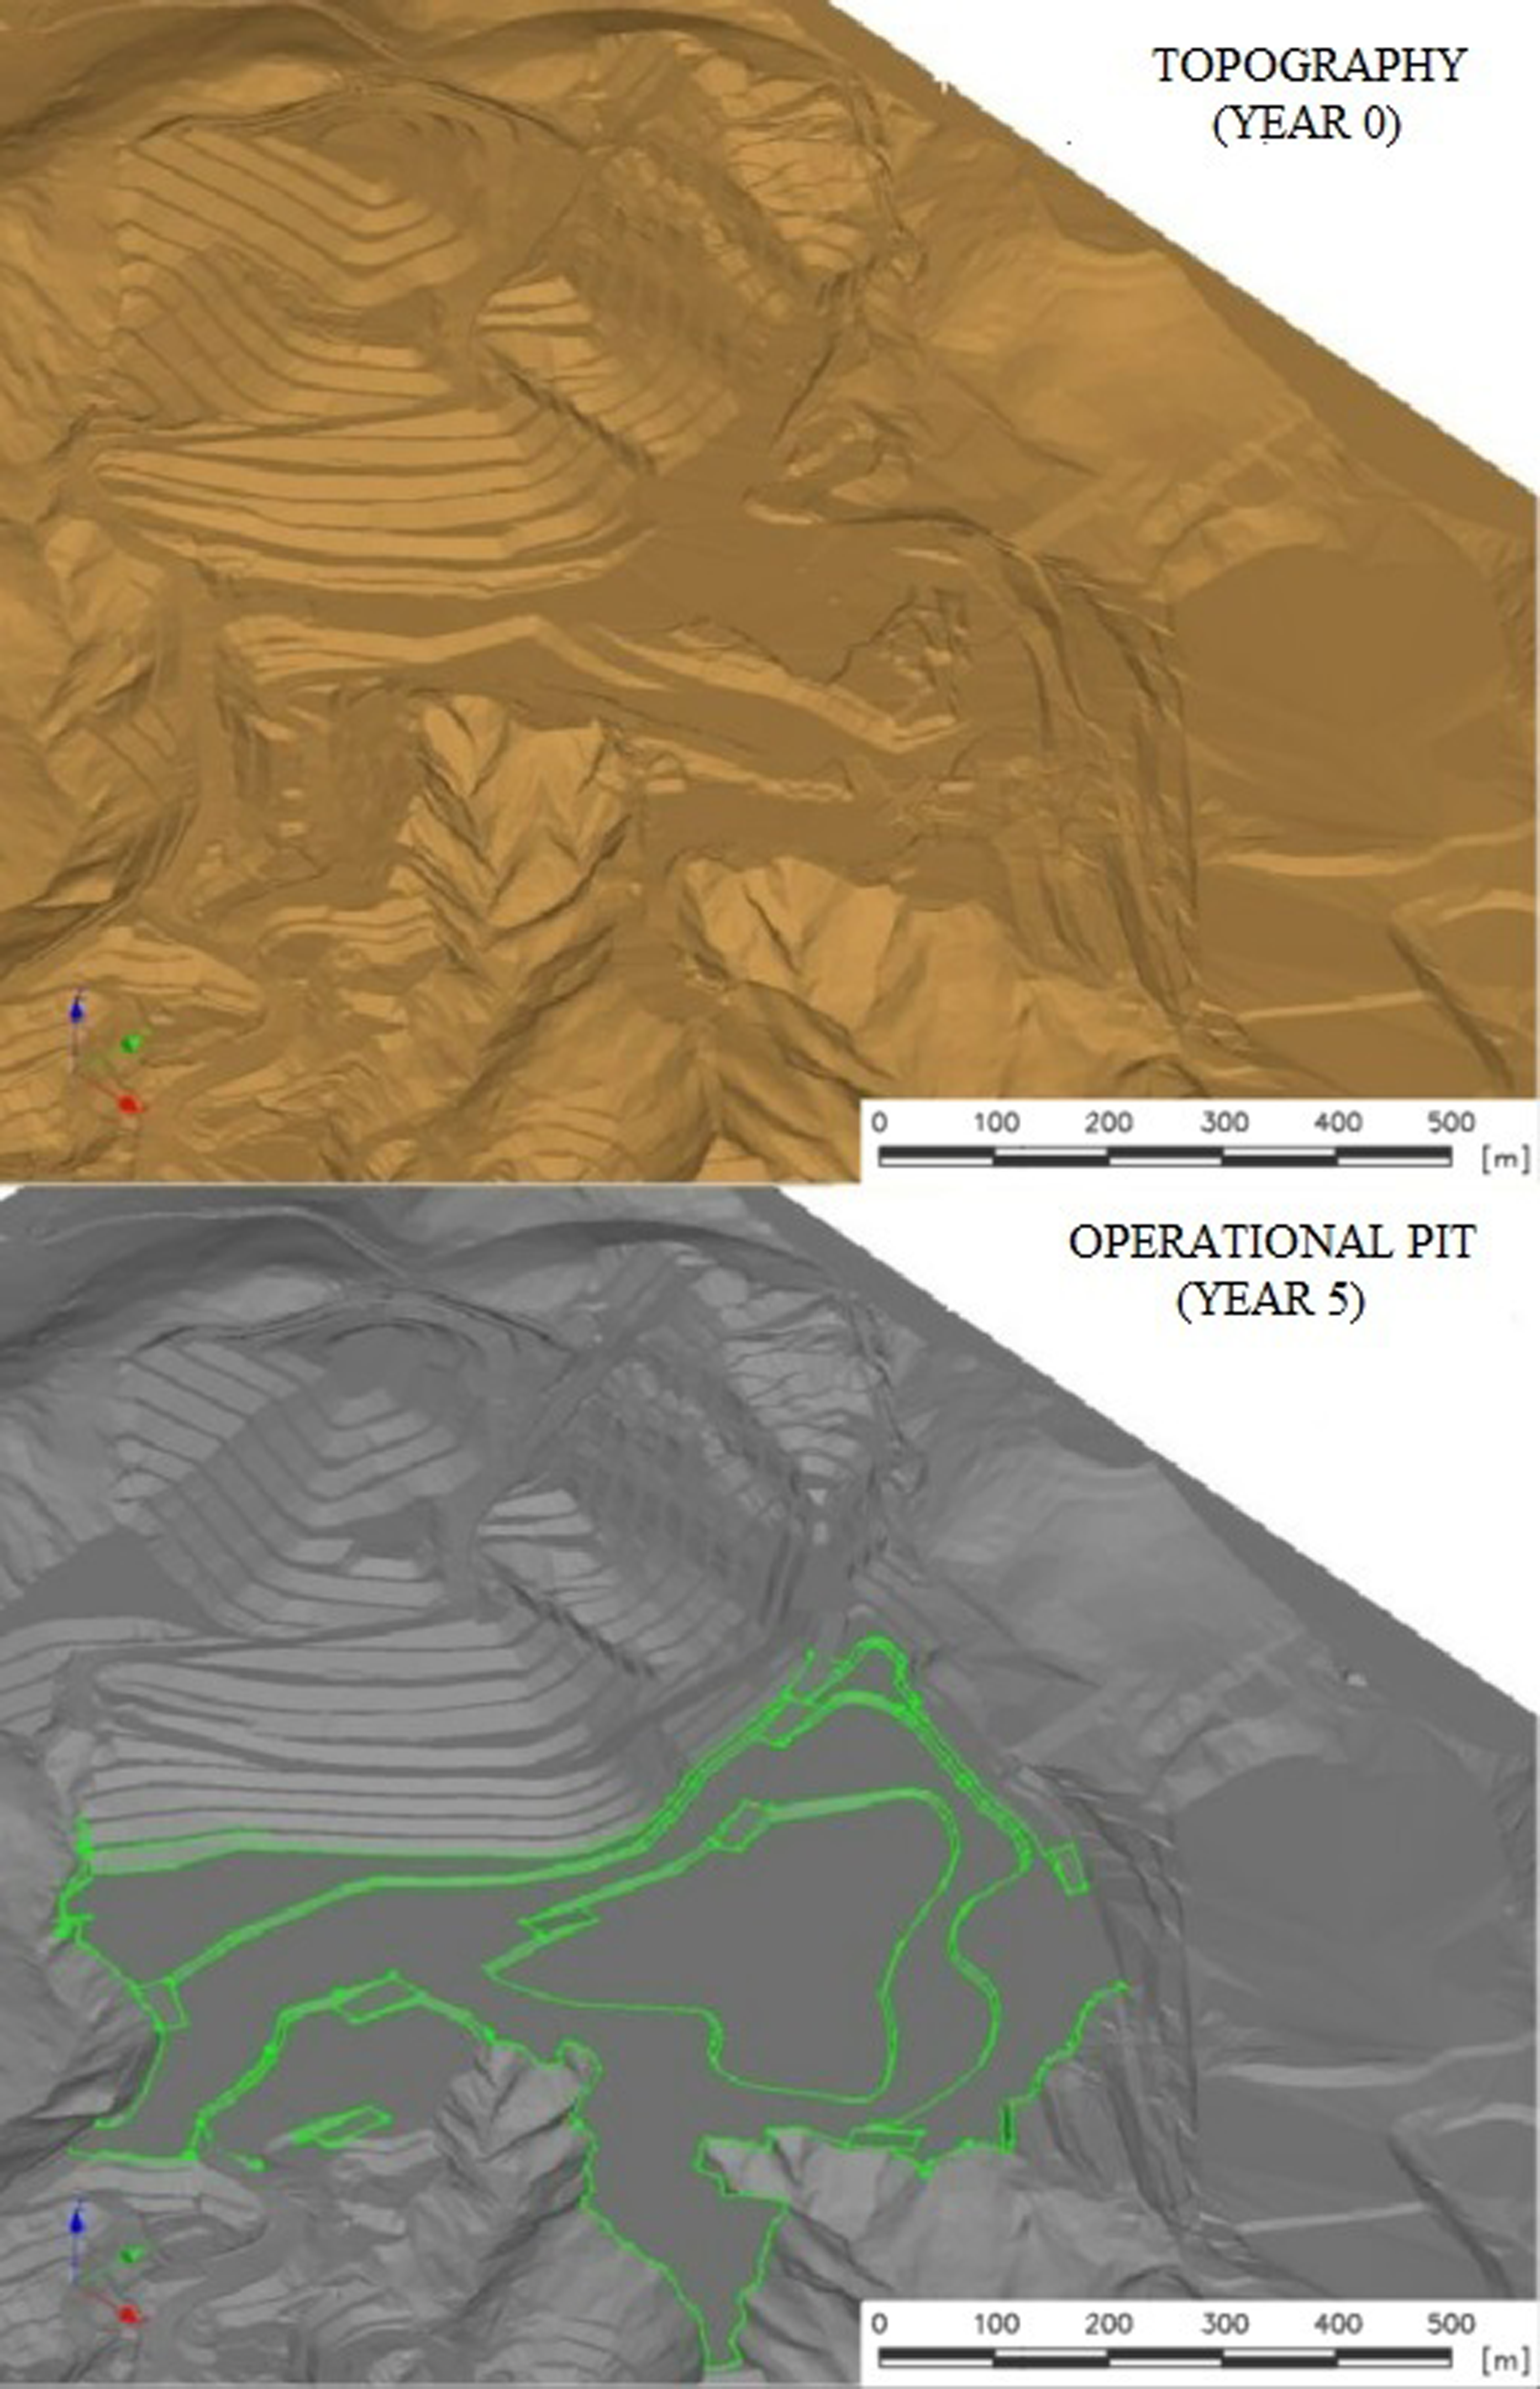
Perspective view of topography (year 0) and operational pit (year 5), with the delimitation of the work square of the mining advance (contour lines).
Geotechnical data
The structural mapping determined that there are two faults that cut across the pit in an east-west direction. However, due to their orientation, they cut orthogonally through the pit slopes, penetrating the excavation in a way that does not constitute a significant risk factor. Therefore, the faults were not considered in the 3D stability analysis.
The geotechnical database consists of strength parameters of the lithologies, according to their behaviour until failure. The generalised Hoek‒Brown (HB) failure criterion was used to estimate the strength and deformation characteristics of the most competent rock masses. The MC failure criterion was used to describe the softer rocks.
The block model classifies the lithologies only with a distinction between compact and friable. To prepare the geotechnical model, a conservative criterion was assumed for low-strength materials. For the friable lithology blocks, where the ore is found, lower strength parameters were considered in relation to the database of the evaluated lithology. Table 3 presents the strength parameters of the lithologies considered in the creation of the 3D geotechnical model that were later used in the stability analyses.
Strength parameters used in the elaboration of the geotechnical model.
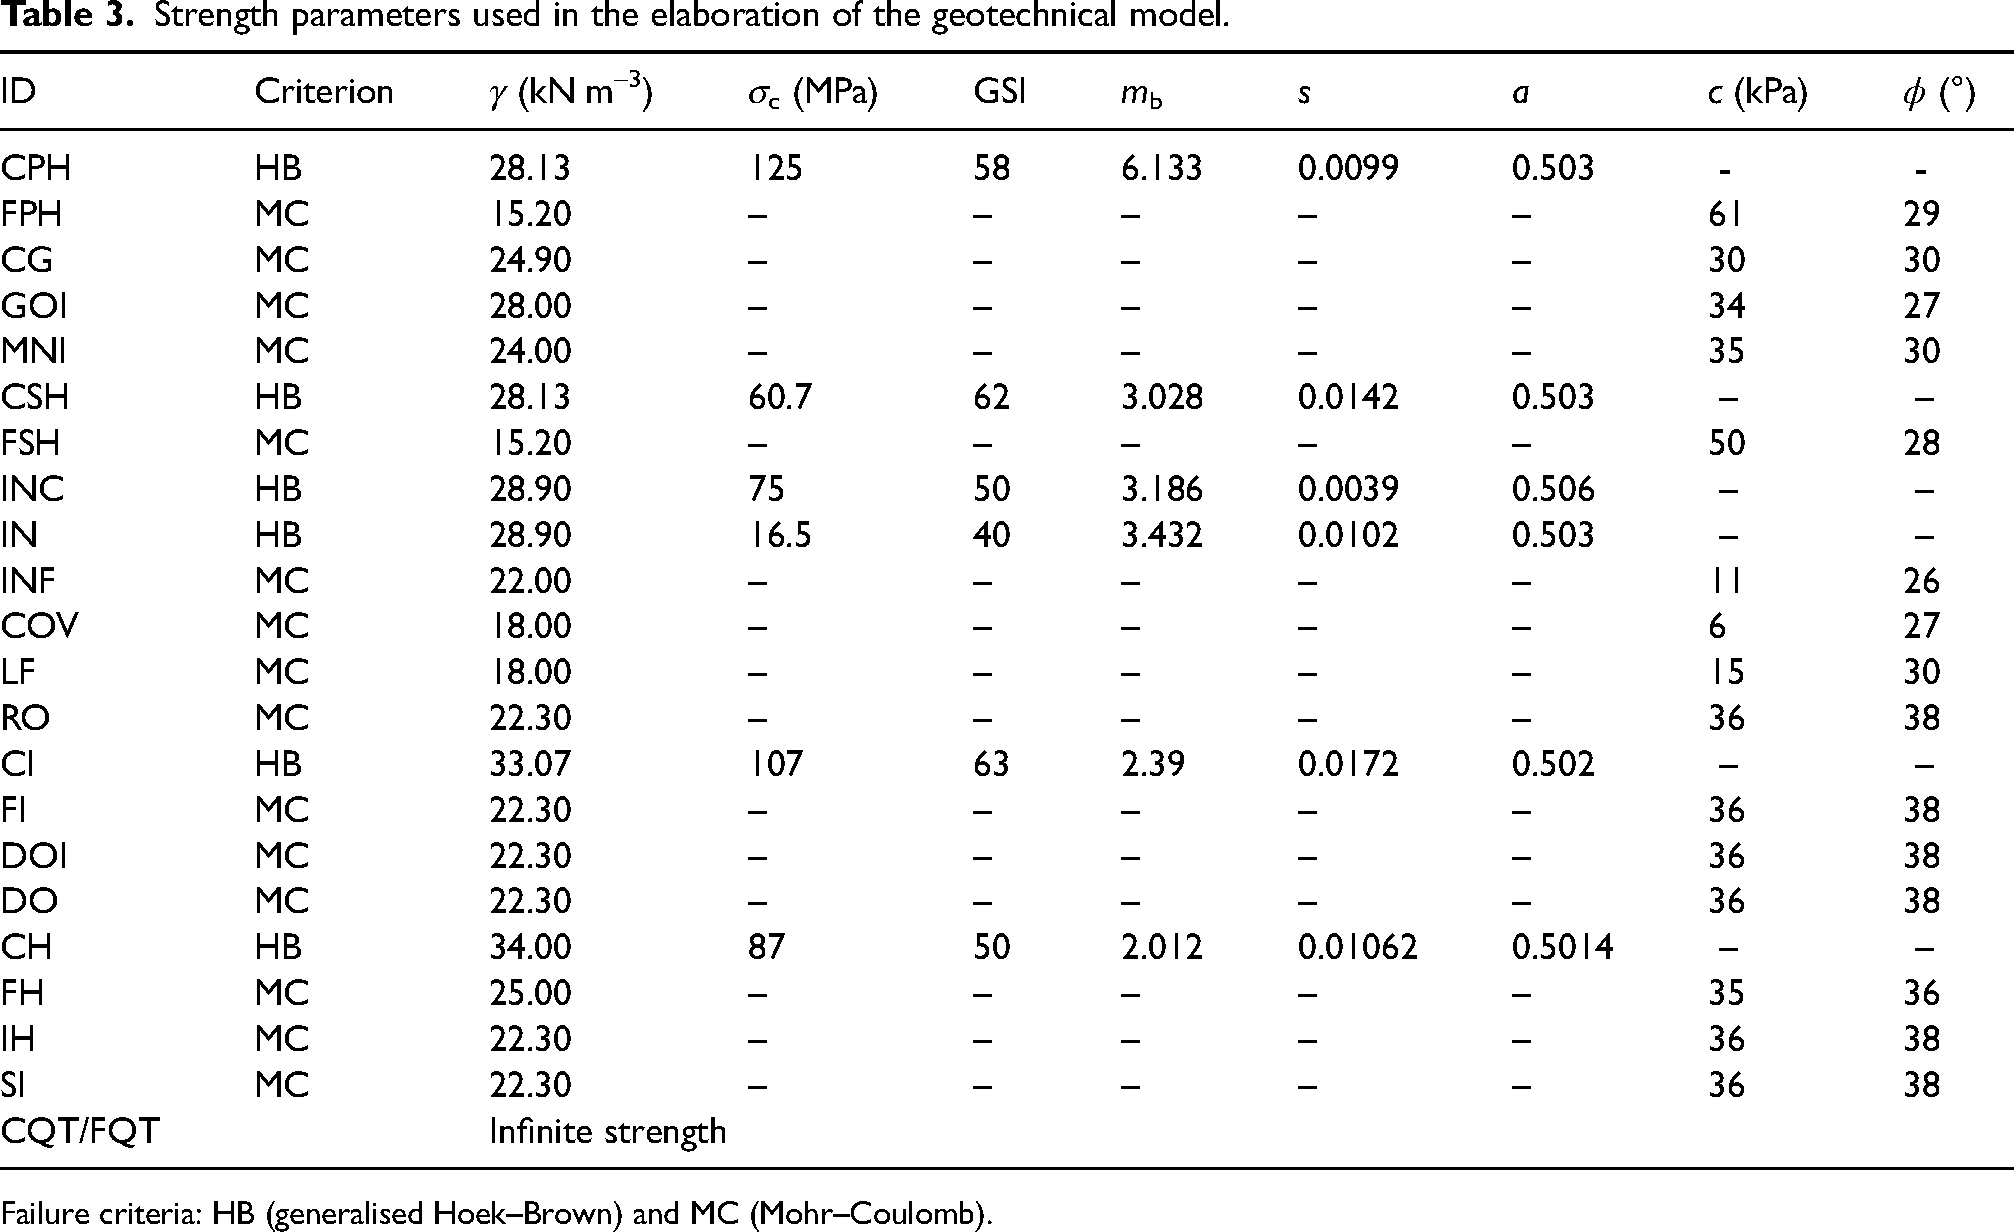
Failure criteria: HB (generalised Hoek–Brown) and MC (Mohr–Coulomb).
The 3D geotechnical model was prepared from the block model of the features and the rock strength parameters presented in Table 3. To identify the region with the lowest FoS, analysis sections were conducted along the wall's study. Figure 6 displays the distribution and extent of the analysis sections.
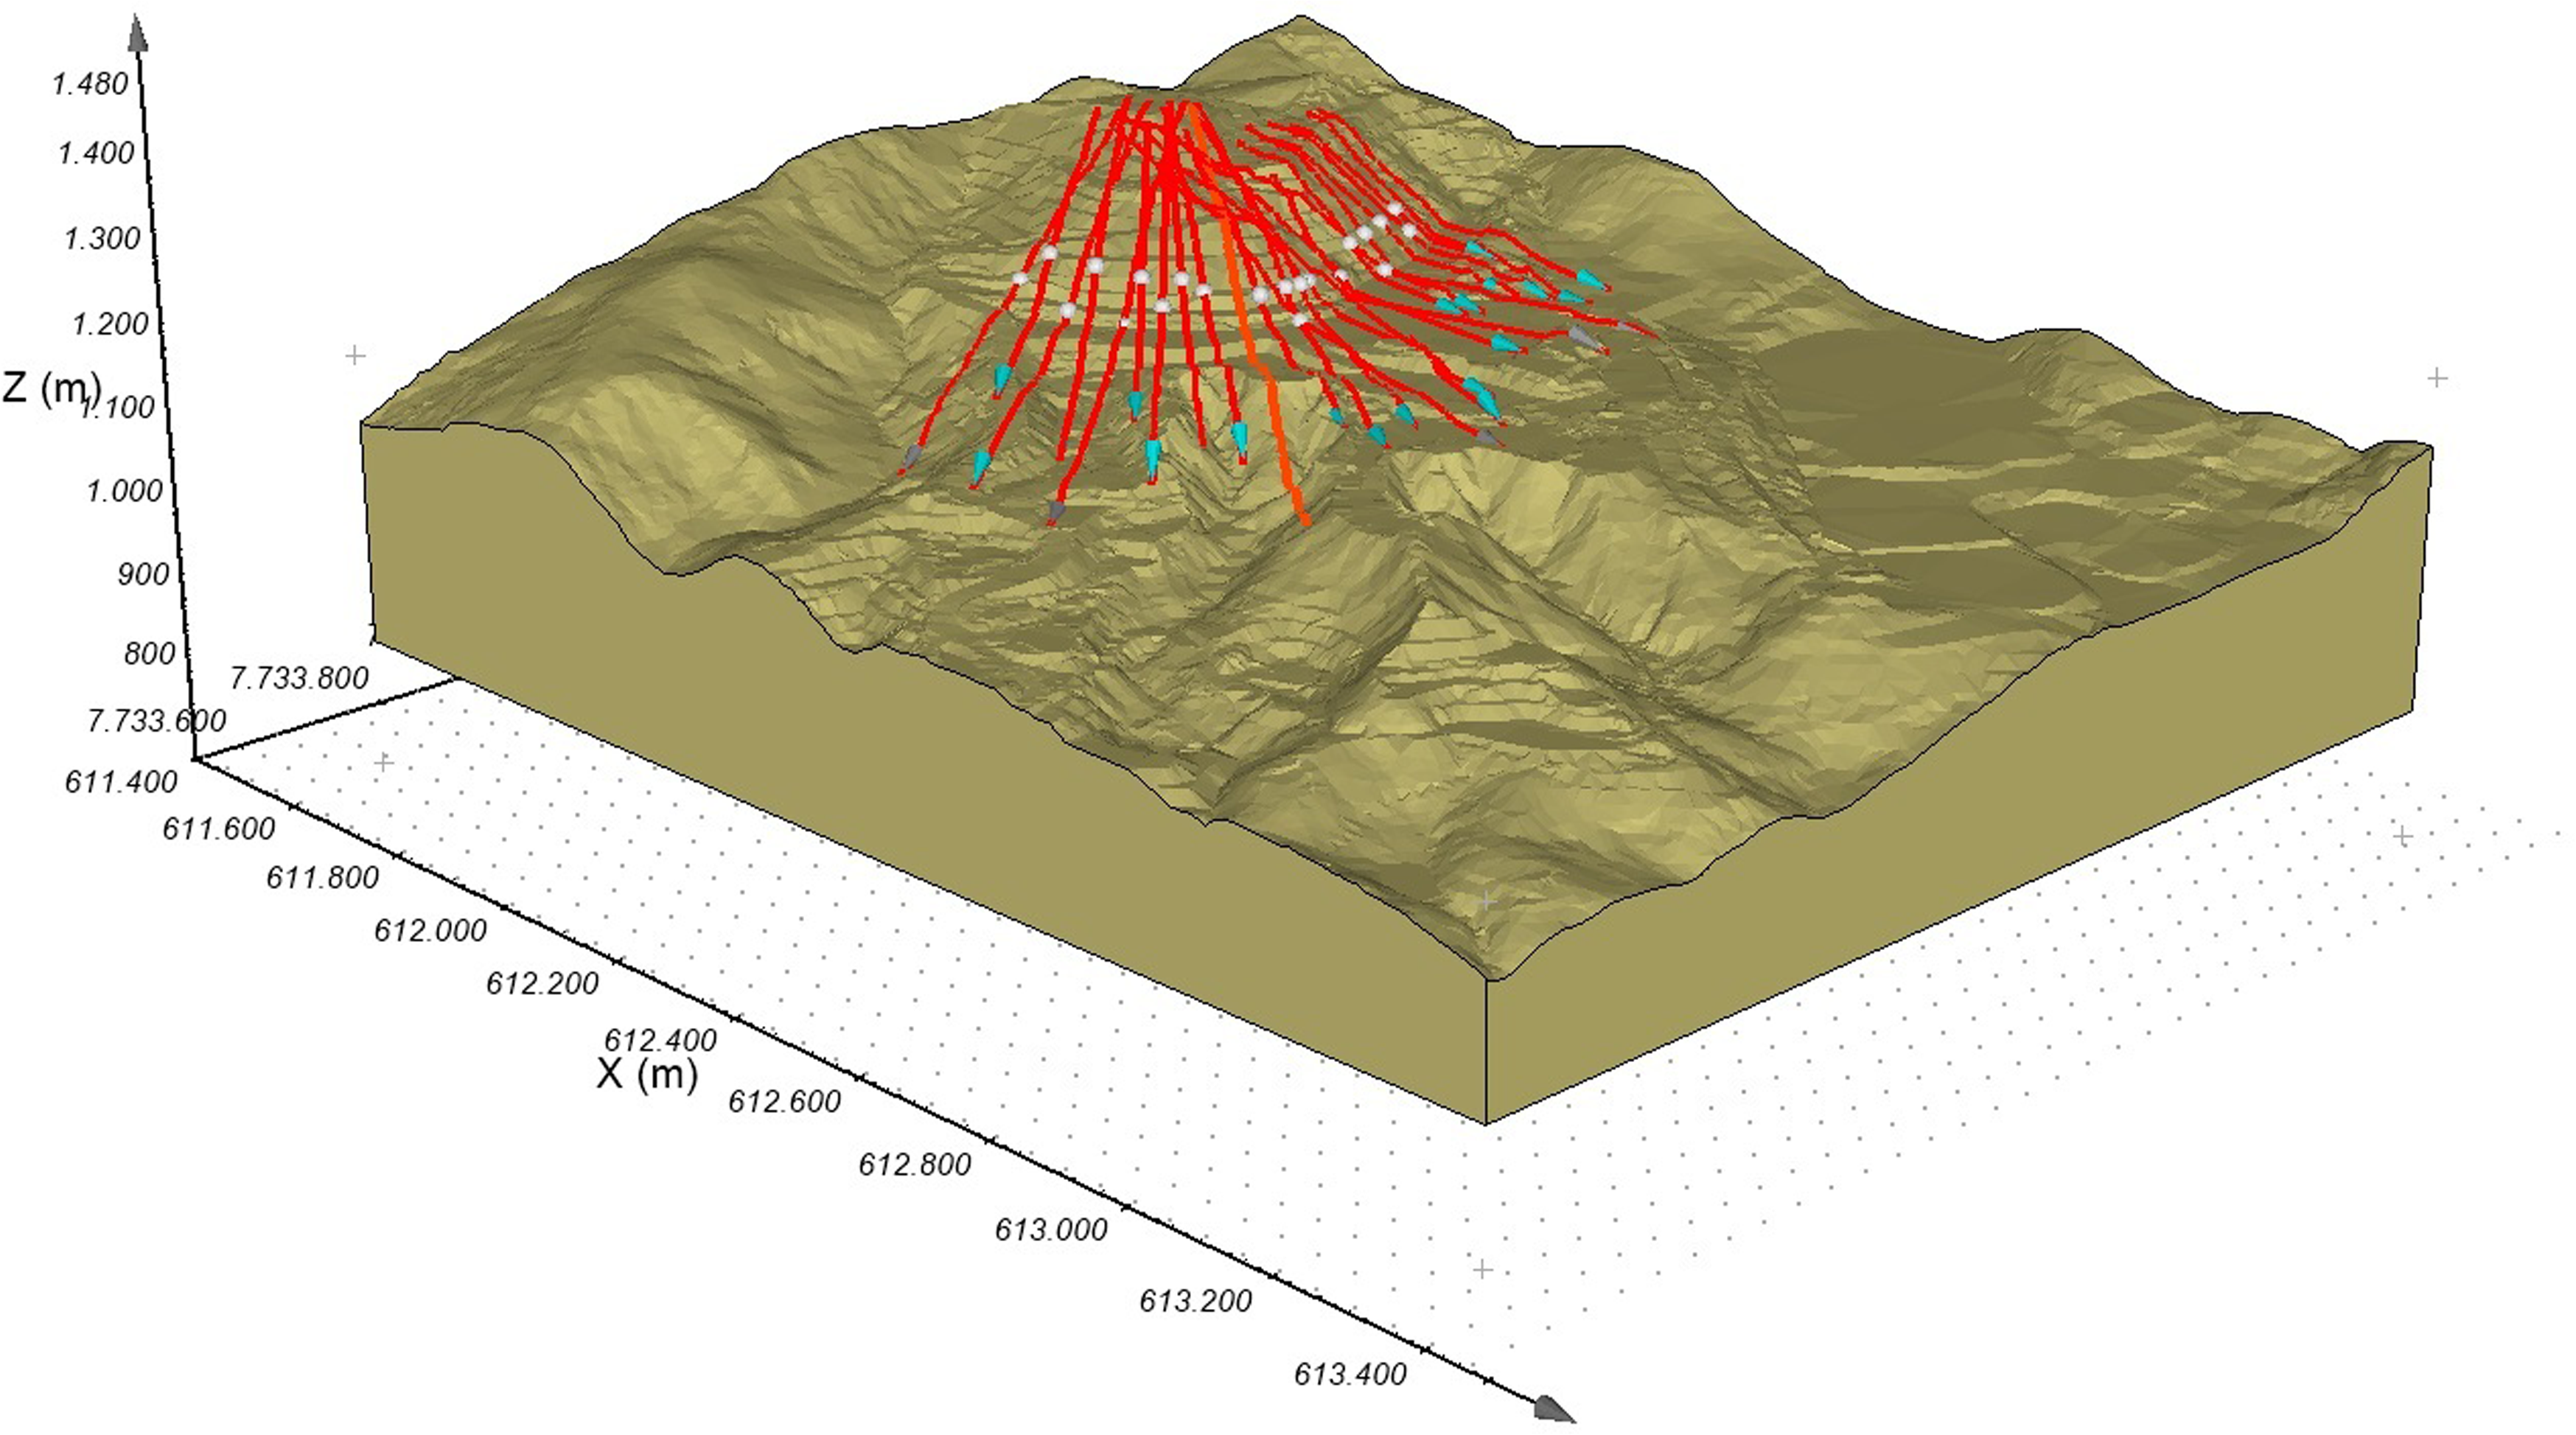
Cross-sections for stability analysis of the slopes.
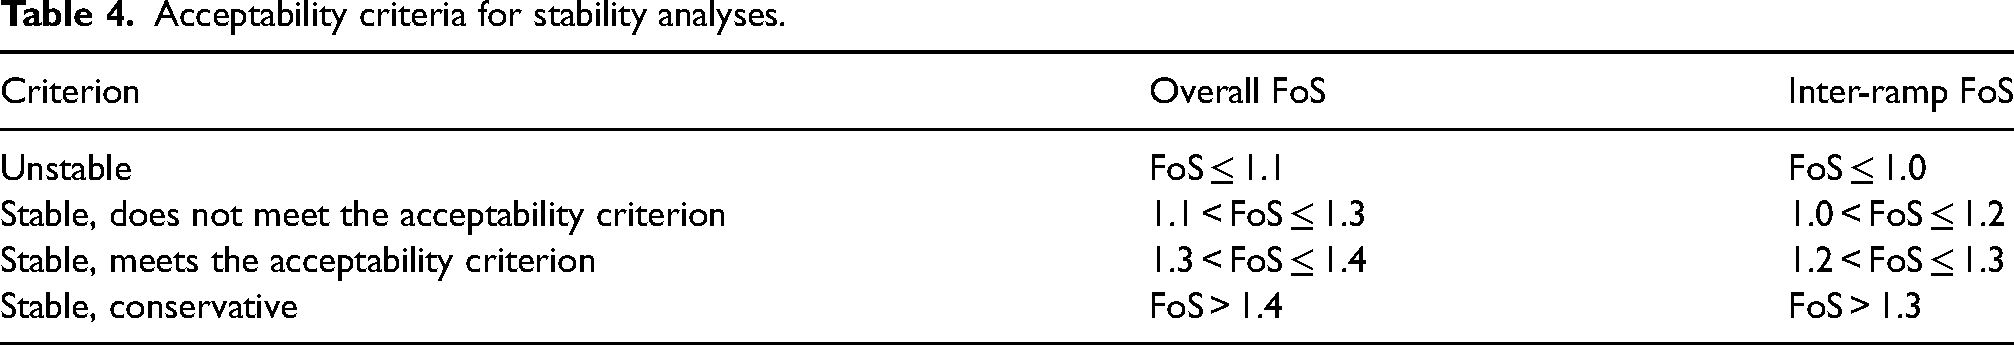
To assess the degree of stability of an overall and/or inter-ramp slope, acceptability criteria based on several studies (Hoek, 2007; Read and Stacey, 2009; Swan and Sepulveda, 2001) and personal experience were used. Table 4 summarises the criteria considered.
Acceptability criteria for stability analyses.
Results and discussion
The application of the methodology was as follows:
Stability analysis and determination of safety factors for the slopes of the 5-year operational pit; Proposition of a new geometry for slopes in which the safety factors are oversized (greater than 1.3 for temporary structures) and undersized (less than 1.3 for temporary structures); Design of the 5-year operational pit with the new proposed geometries; Comparison between the results obtained for the original 5-year operational pit and the suggested new 5-year operational pit in terms of NPV, ore tonne, waste tonne, etc.
Figure 7 presents the stability analysis conducted in the 5-year operational pit. Commercial software with the capability to perform the limit equilibrium method in 3D space was used. The colour scale indicates the variation in FoS. According to the criteria presented in Table 4, the red zone represents a stable region that does not meet the acceptability criterion. Therefore, geometric changes to the slopes were made in this area.
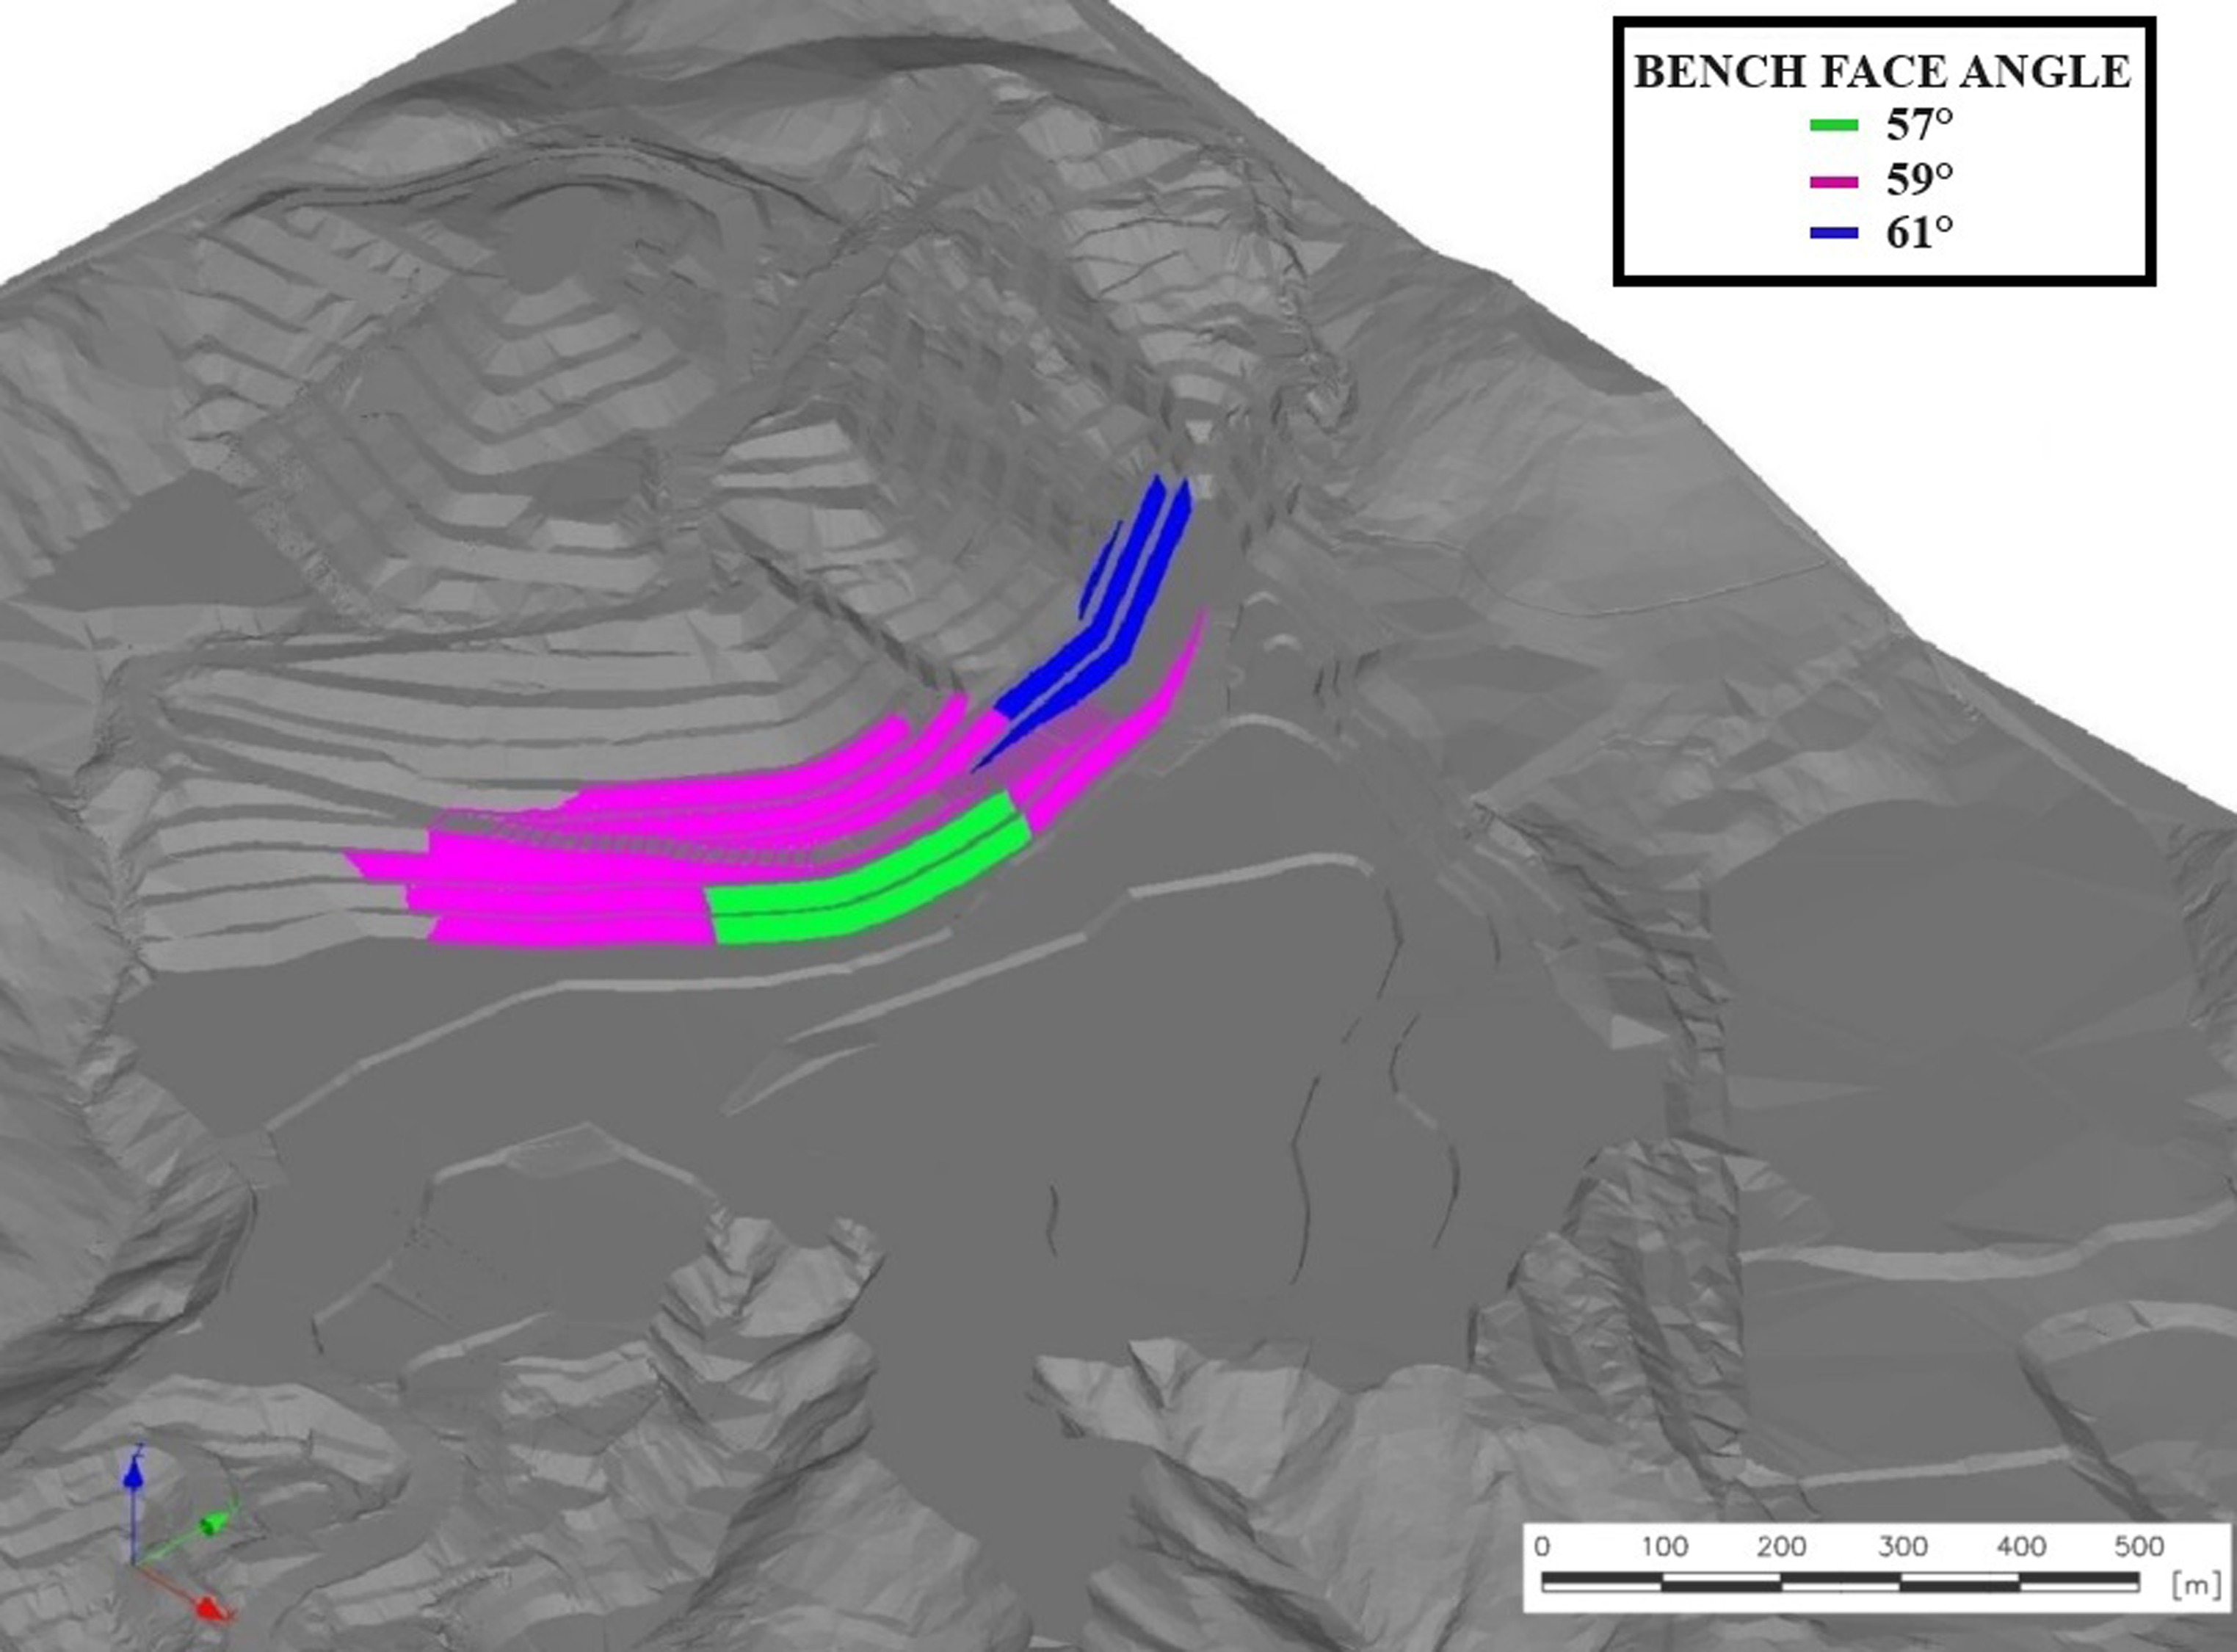
In general, the wall is stable, but it does not meet the acceptability criterion on a bench. The geometry adjustments of this wall seek to meet the acceptability criterion of FoS > 1.3. In cases where FoS > 1.4, an attempt was made to make the slopes more vertical to provide greater availability of resources. In this sense, 8 cross-sections were evaluated in the areas of interest and can be observed in Figure 8, with the indication of the new proposed face angles.
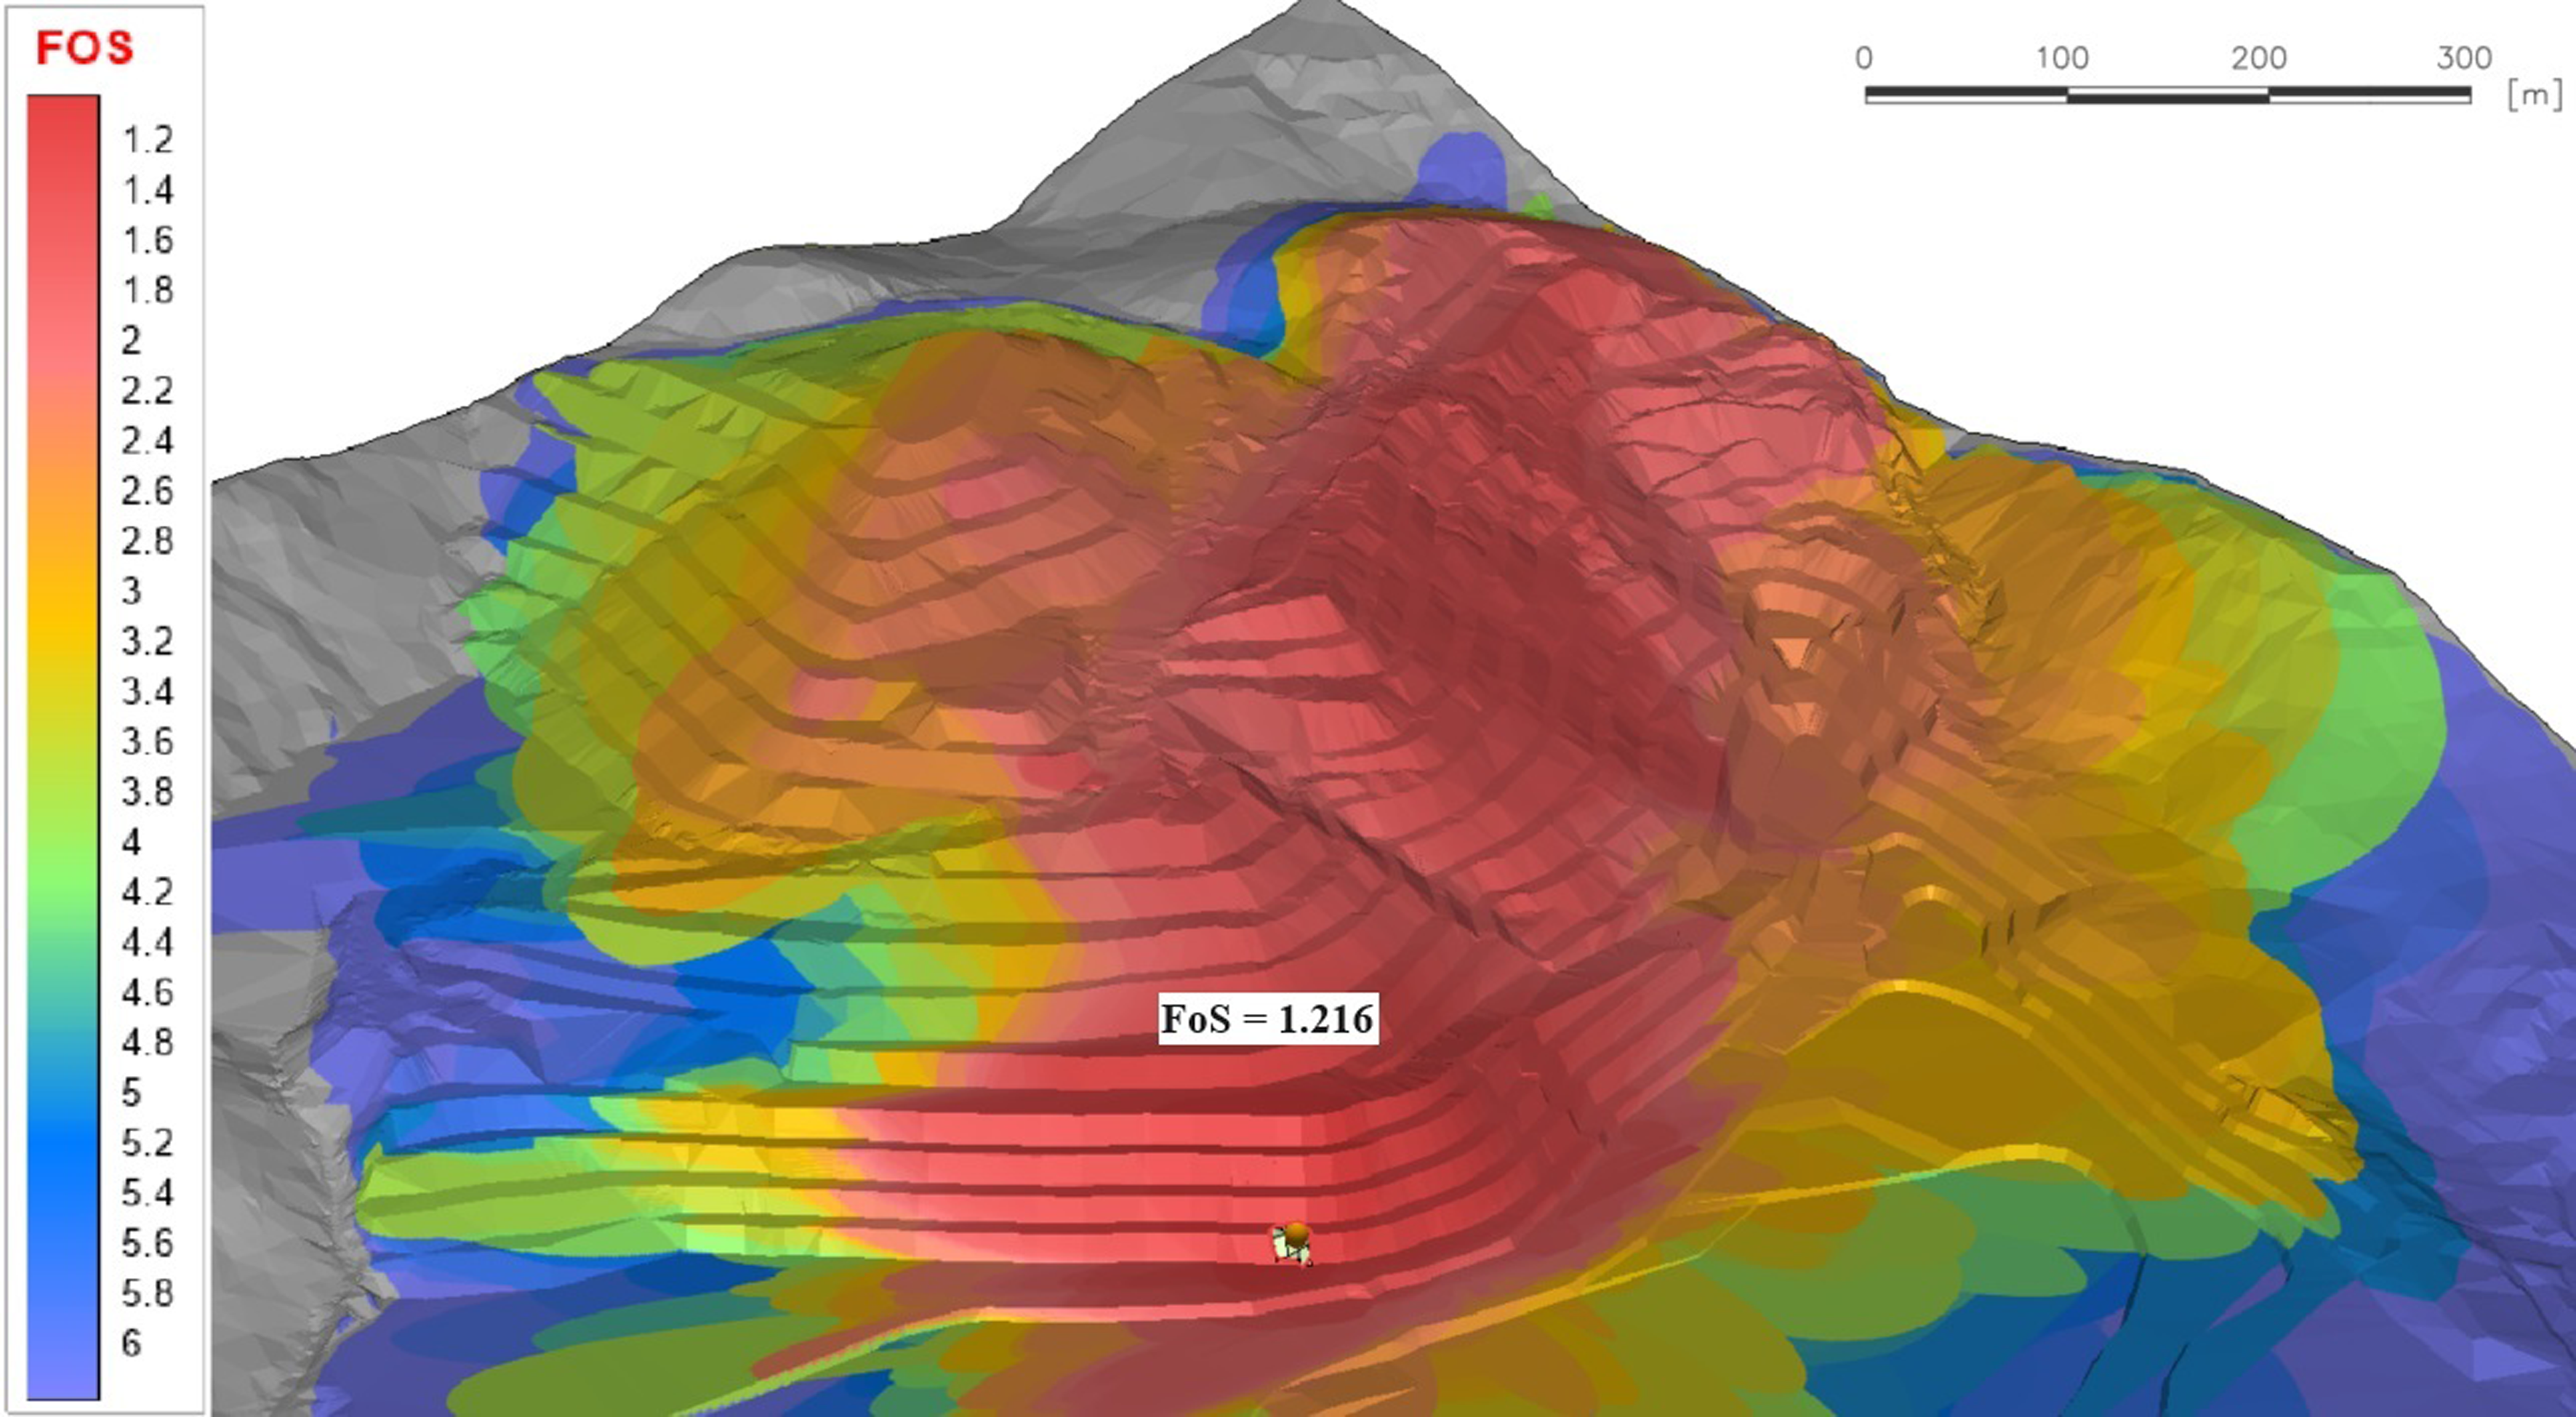
3D stability analysis of 5-year operating pit.
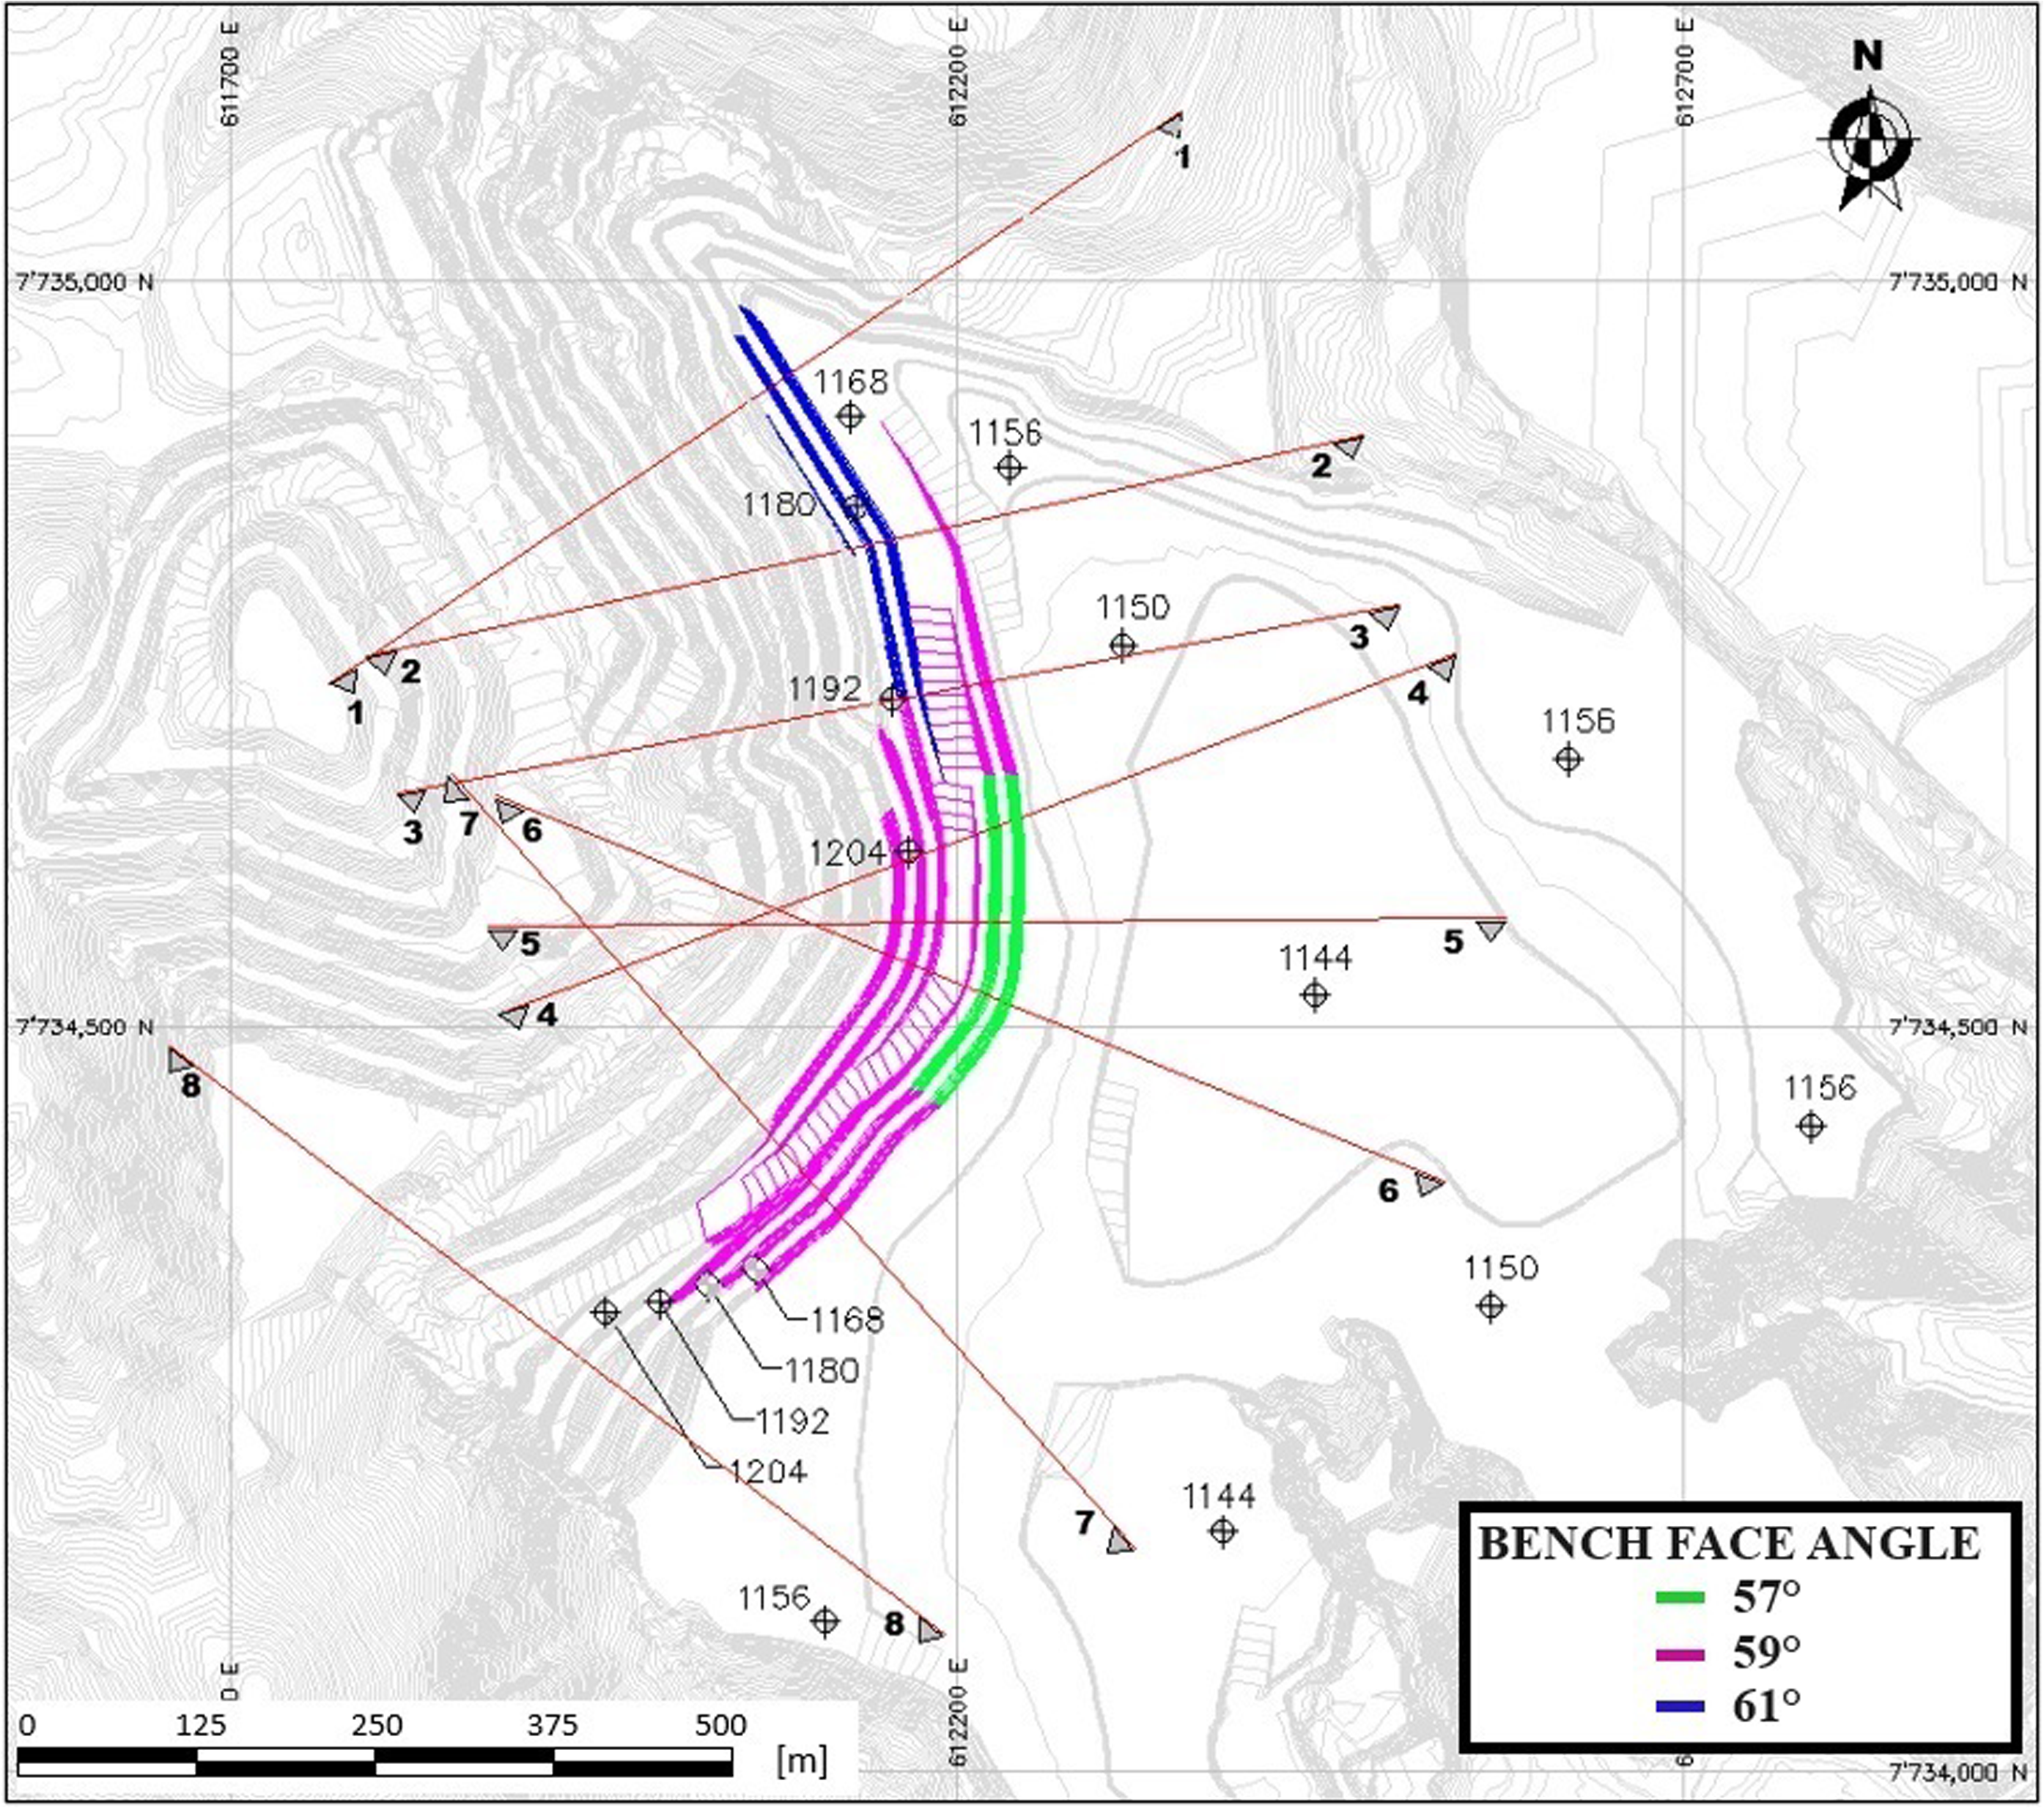
Plan view of the cross-sections analysed, presenting the proposed new face angles, being 57°, 59° and 61°.
The suggested new 5-year operational pit is shown in Figure 9, noting that despite the change in the slope face angles, the access width remained at 20 m with a longitudinal slope of 10%. The height of the benches and the width of the berms were also maintained at 12 m and 8 m, respectively.
View in perspective of the new operational pit of 5 years suggested, with angles of face of the of 57°, 59° and 61°.2.
After changing the slope face angles, a new stability analysis was performed. The new geometries guarantee an FoS that meets the acceptability criteria in the most critical region, with a value of 1.309, as shown in Figure 10.
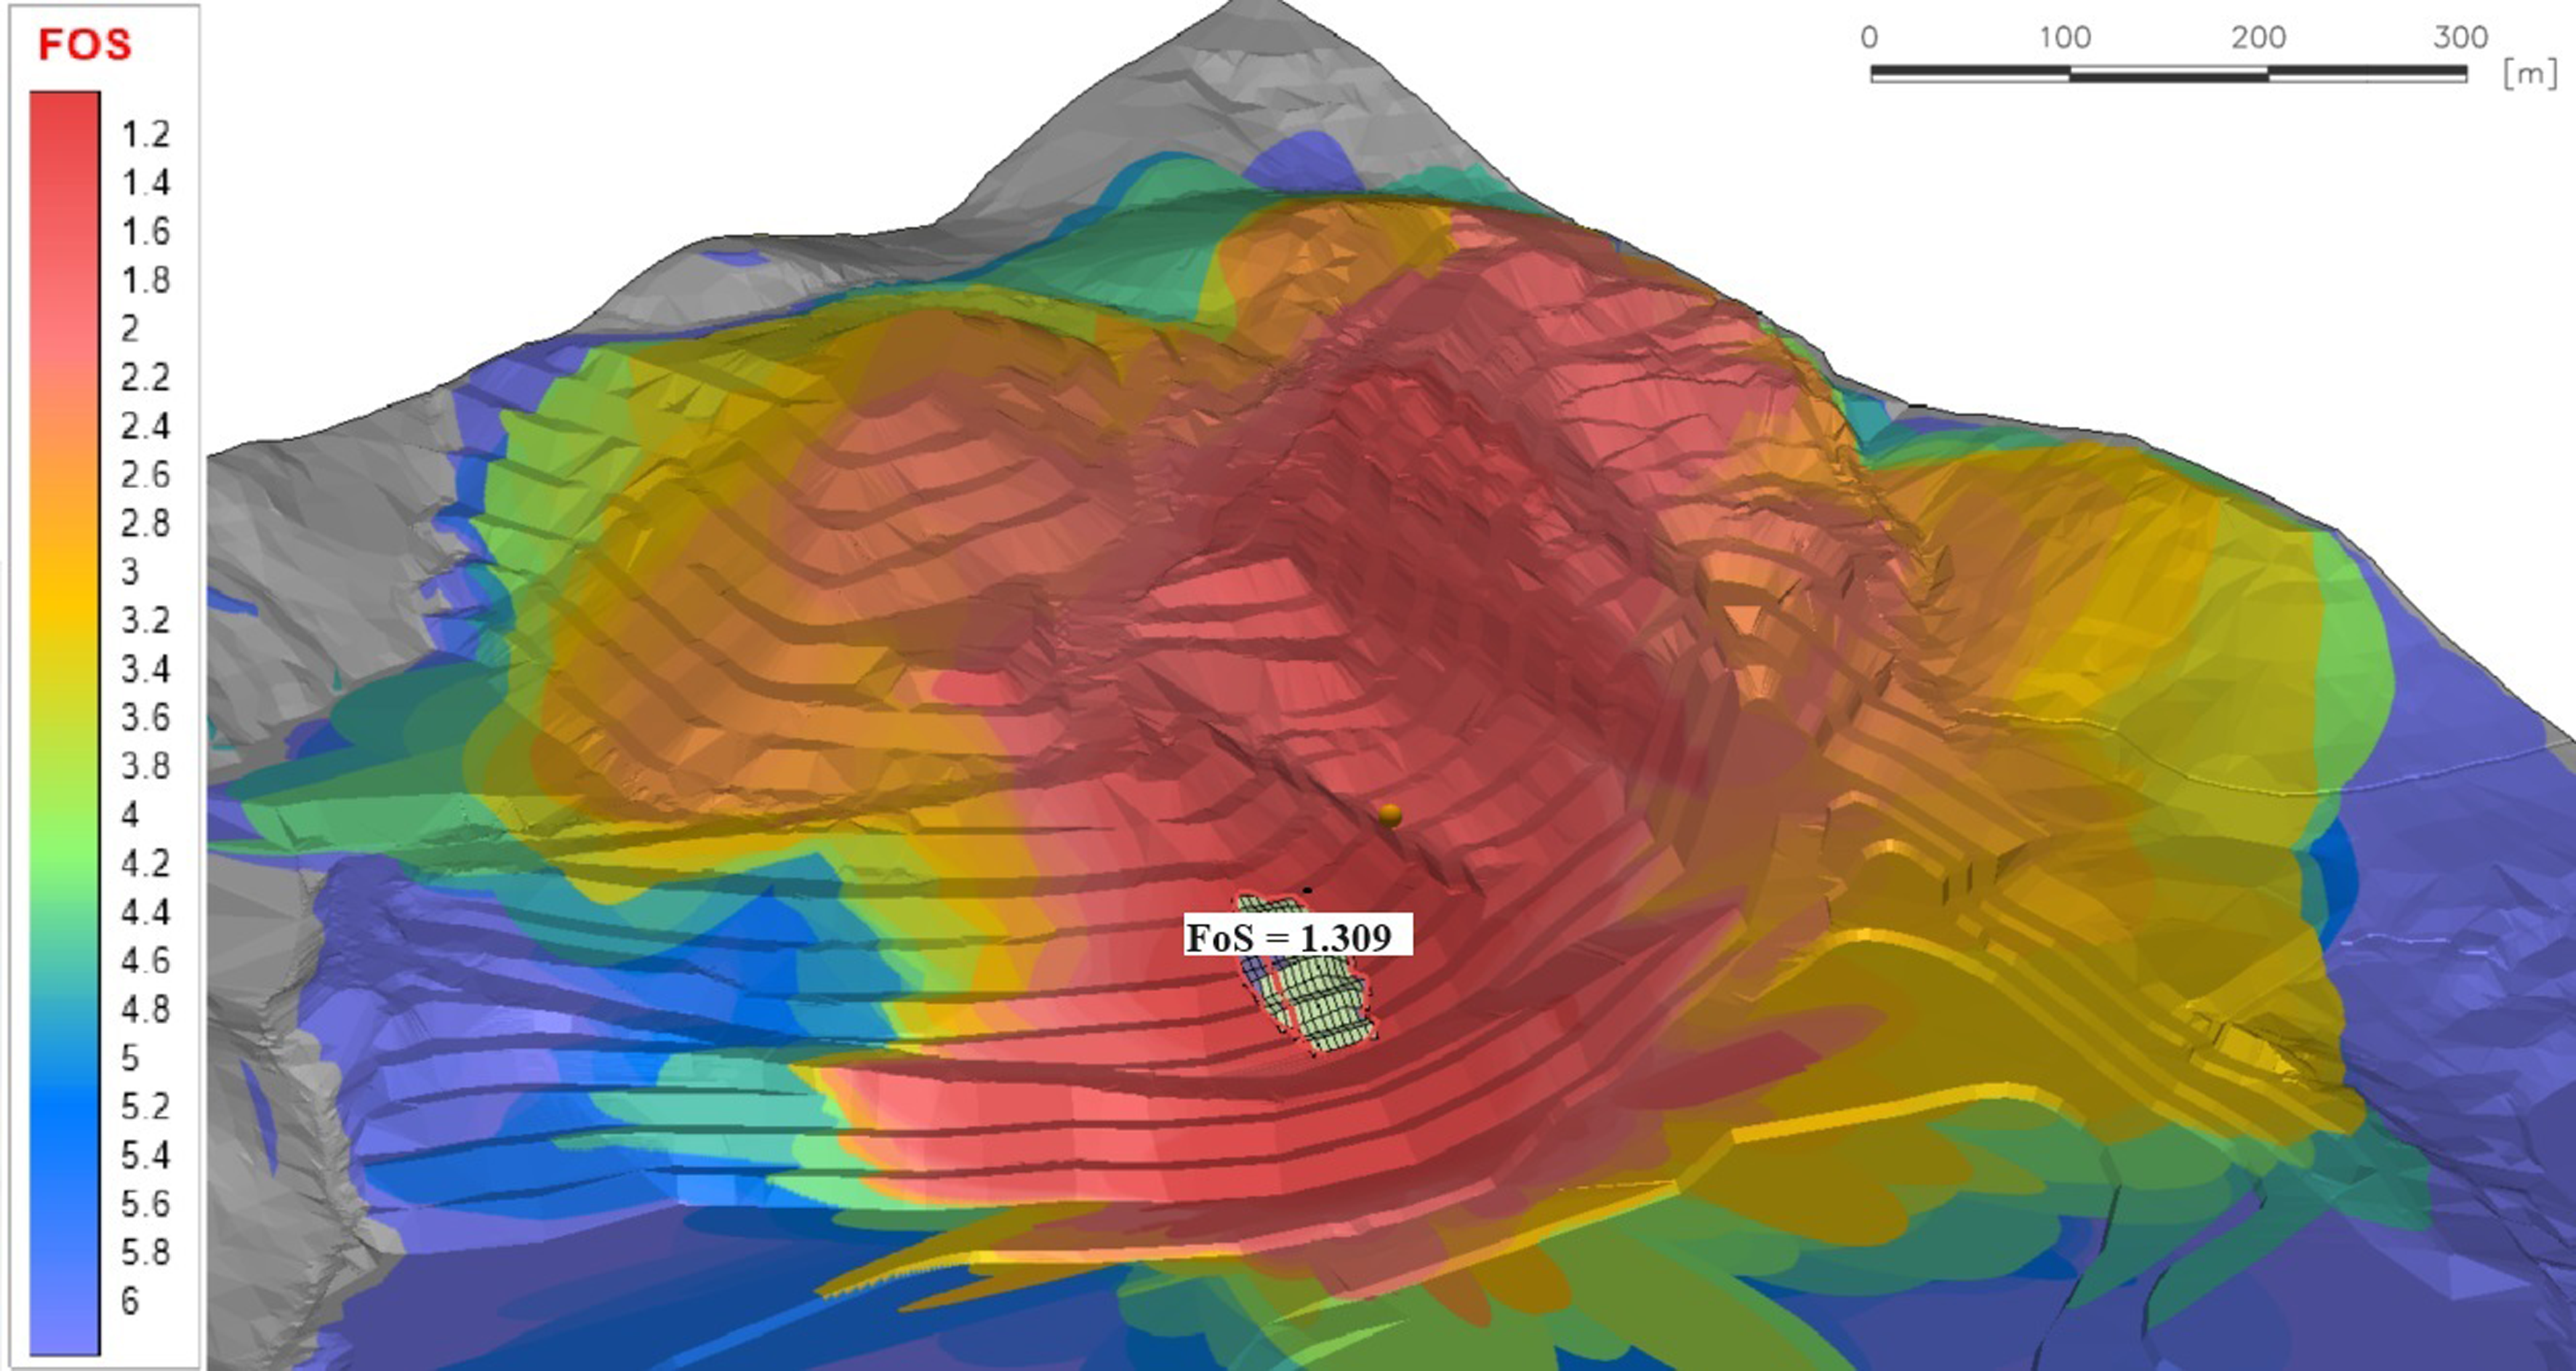
3D stability analysis of the suggested new 5-year operating pit.
In relation to the comparison between the results obtained with the application of the methodology, an economic analysis and an evaluation of tonnes and grades of the resources contained in the pits (original and new) were performed to quantify the tonnes of ore and waste and the average grades of the lithologies, as well as to verify the impacts on the NPV. For the comparison to be representative in the analyses of the new pit, the same techno-economic parameters of the original pit and the same weightings regarding the cut-off grade and the mineral inventory were used.
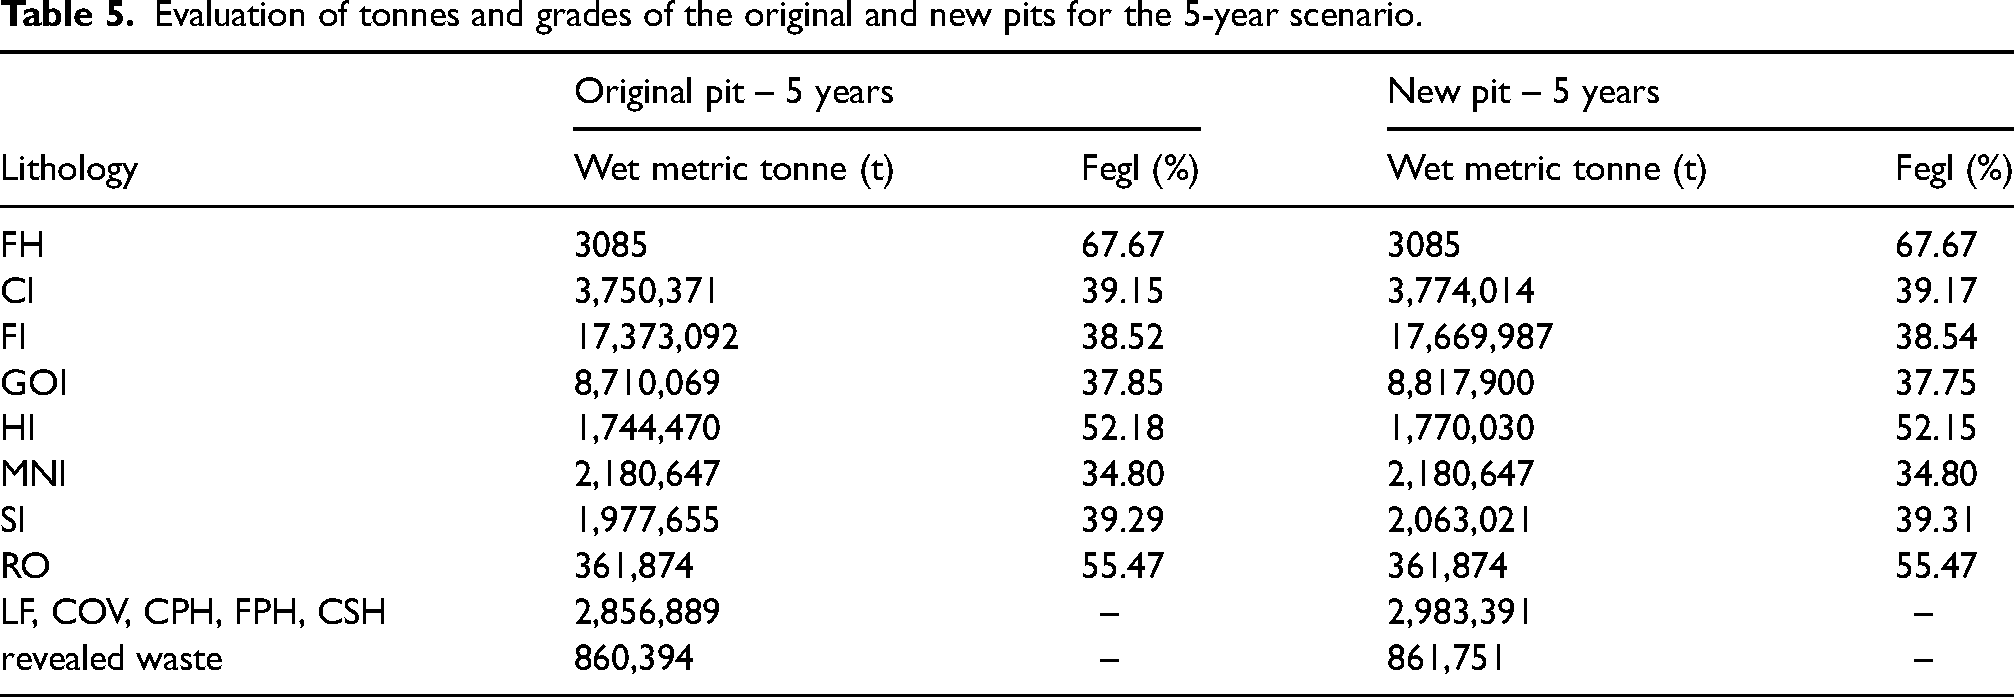
The evaluation of tonnes and grades of the original and new pits in the 5-year scenario, broken down by lithology, can be observed in Table 5. A summary of the ore and waste's tonnes, together with the NPV values, can be observed in the graph in Figure 11. It should be noted that this NPV does not consider the capital costs, as it only considers the operating costs and other parameters mentioned above. It also represents a more general picture, as if the ore from the 5-year-old pit were mined all at once, without considering the pushbacks and sequencing, which tend to reduce the NPV at each stage given their imposed constraints if taken into consideration.
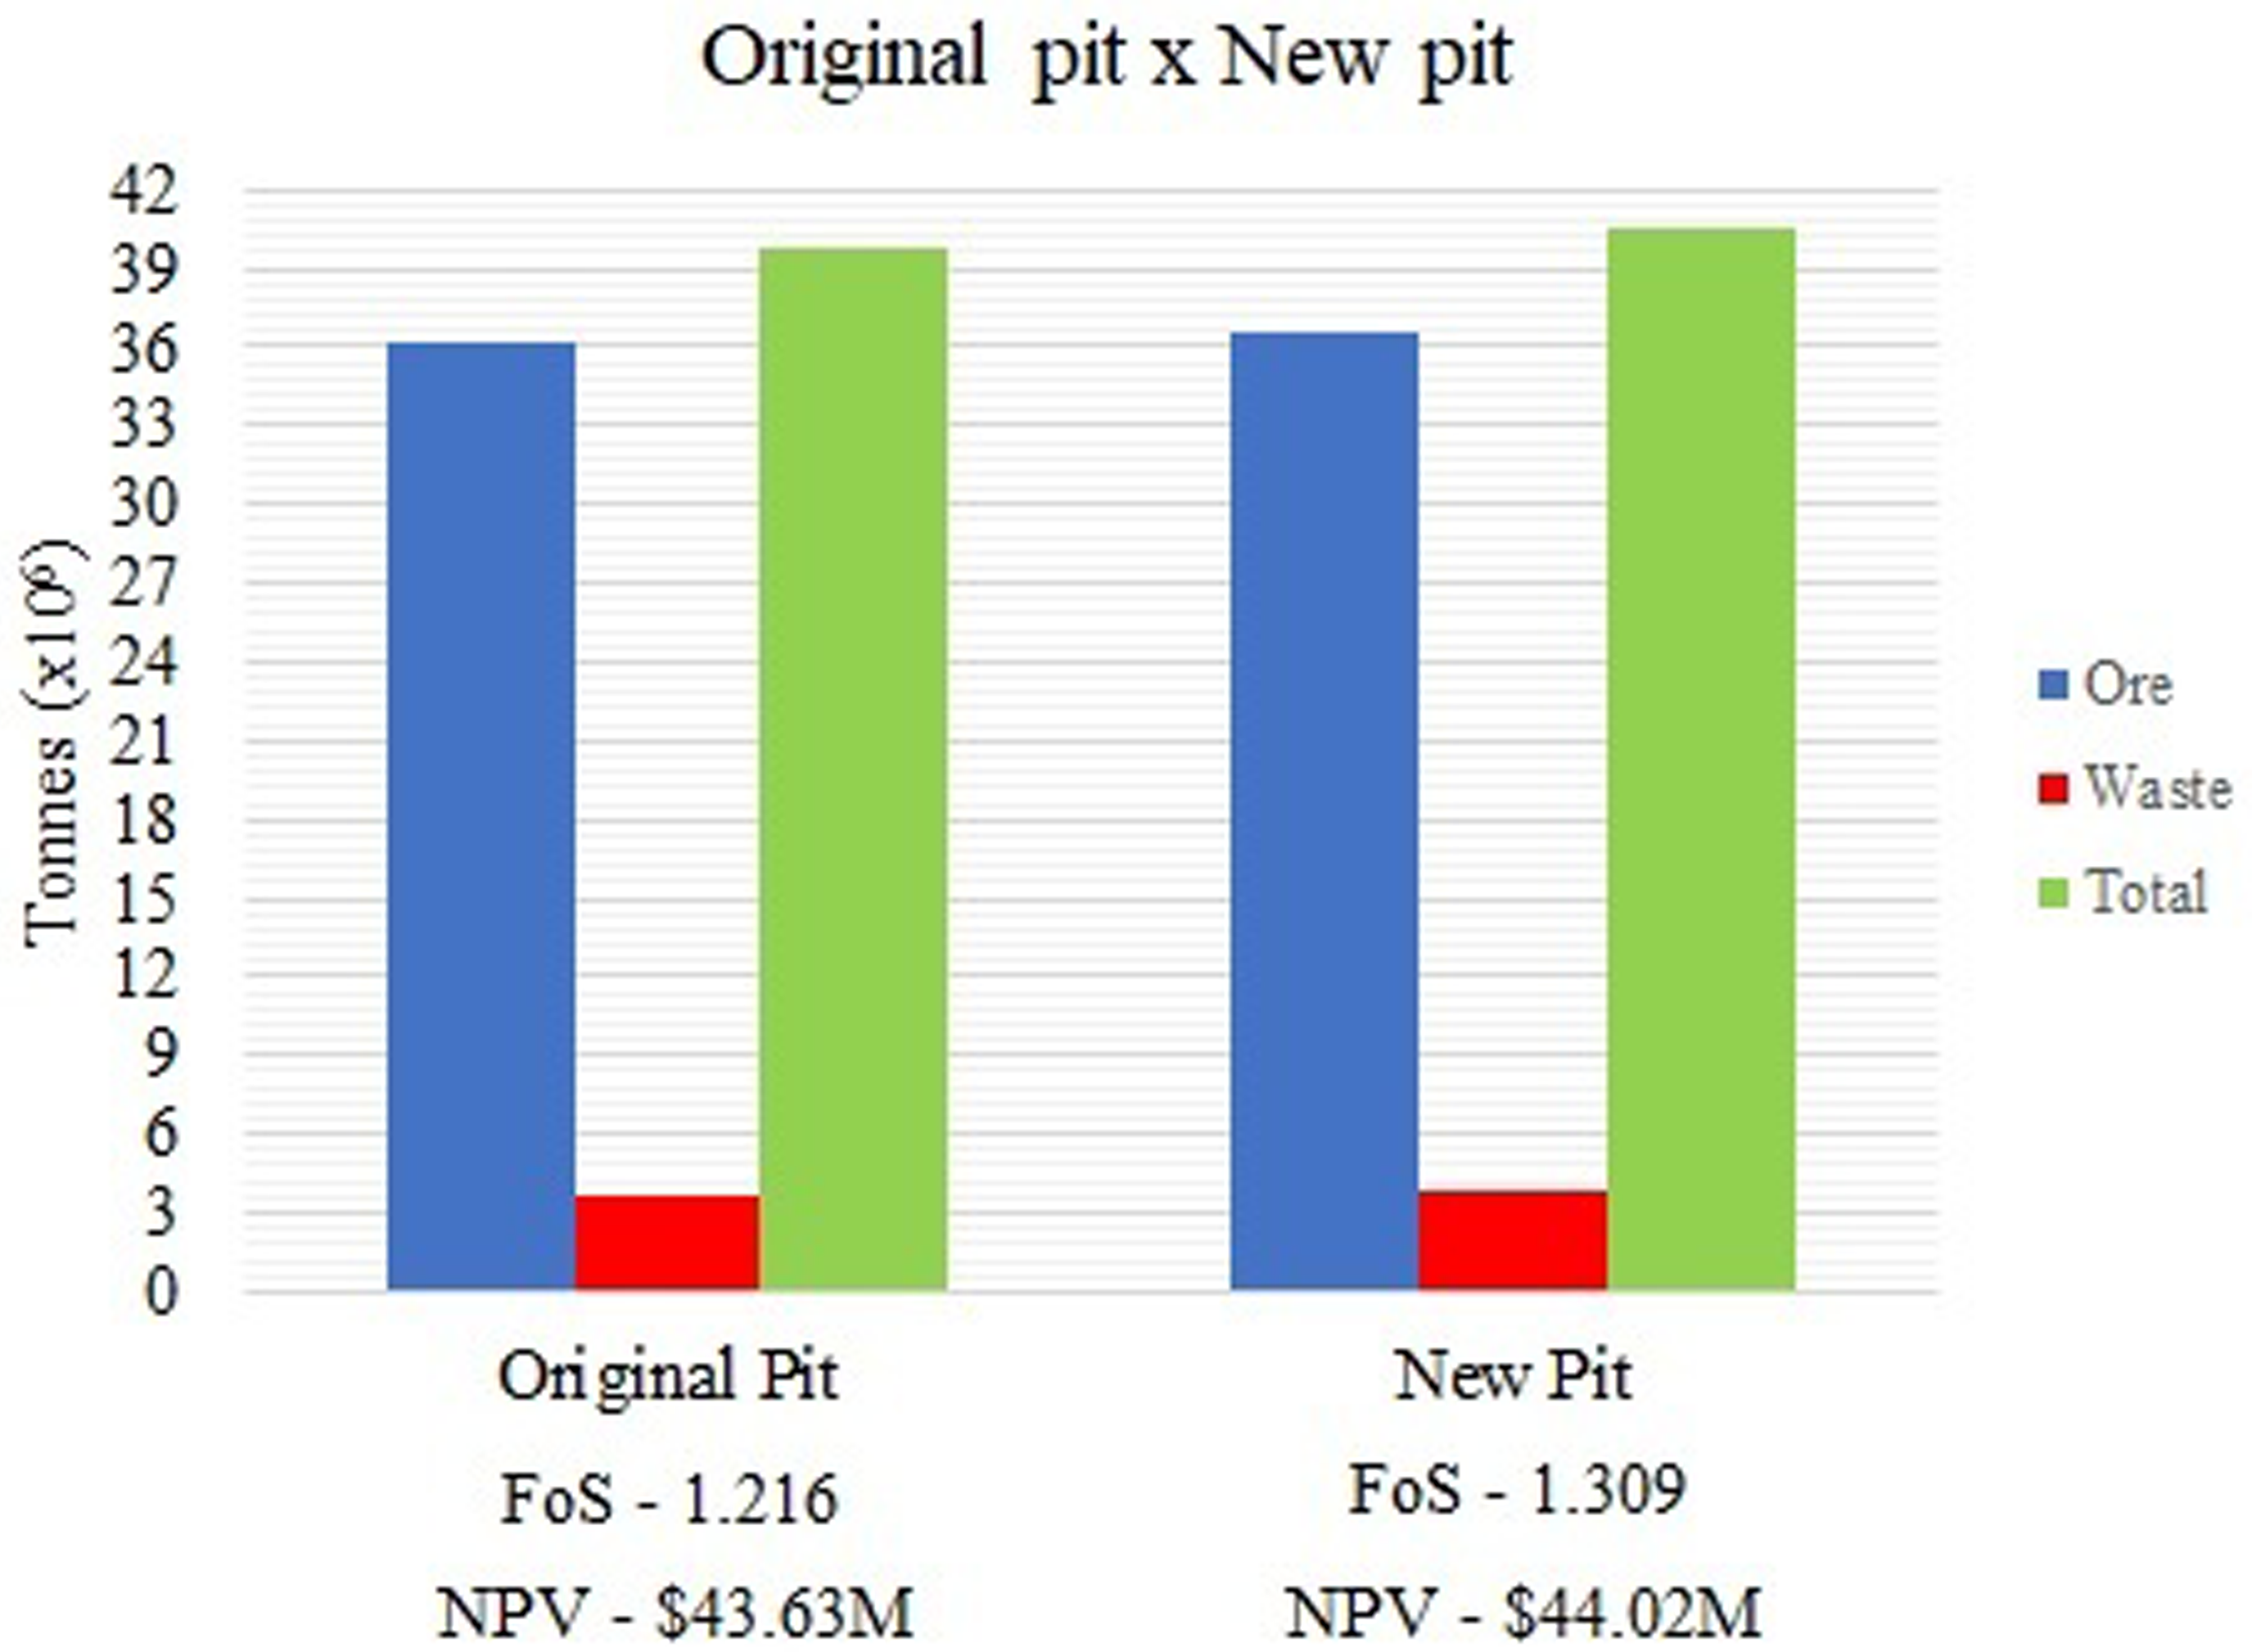
Summary of the tonnage for the original and new pits in the 5-year scenario, with associated NPV values.
Evaluation of tonnes and grades of the original and new pits for the 5-year scenario.
The proposed new pit suggests a greater availability of ore compared to the original pit in the 5-year scenario, totalling 539,296 tonnes (1.49%). On the other hand, there was also an increase in waste in the amount of 127,860 tonnes (3.44%). This ore availability represents an increase in NPV of US$ 392,687 (0.90%). Figure 12 present a section that illustrates the ore available after the adjustment of the slope geometries.
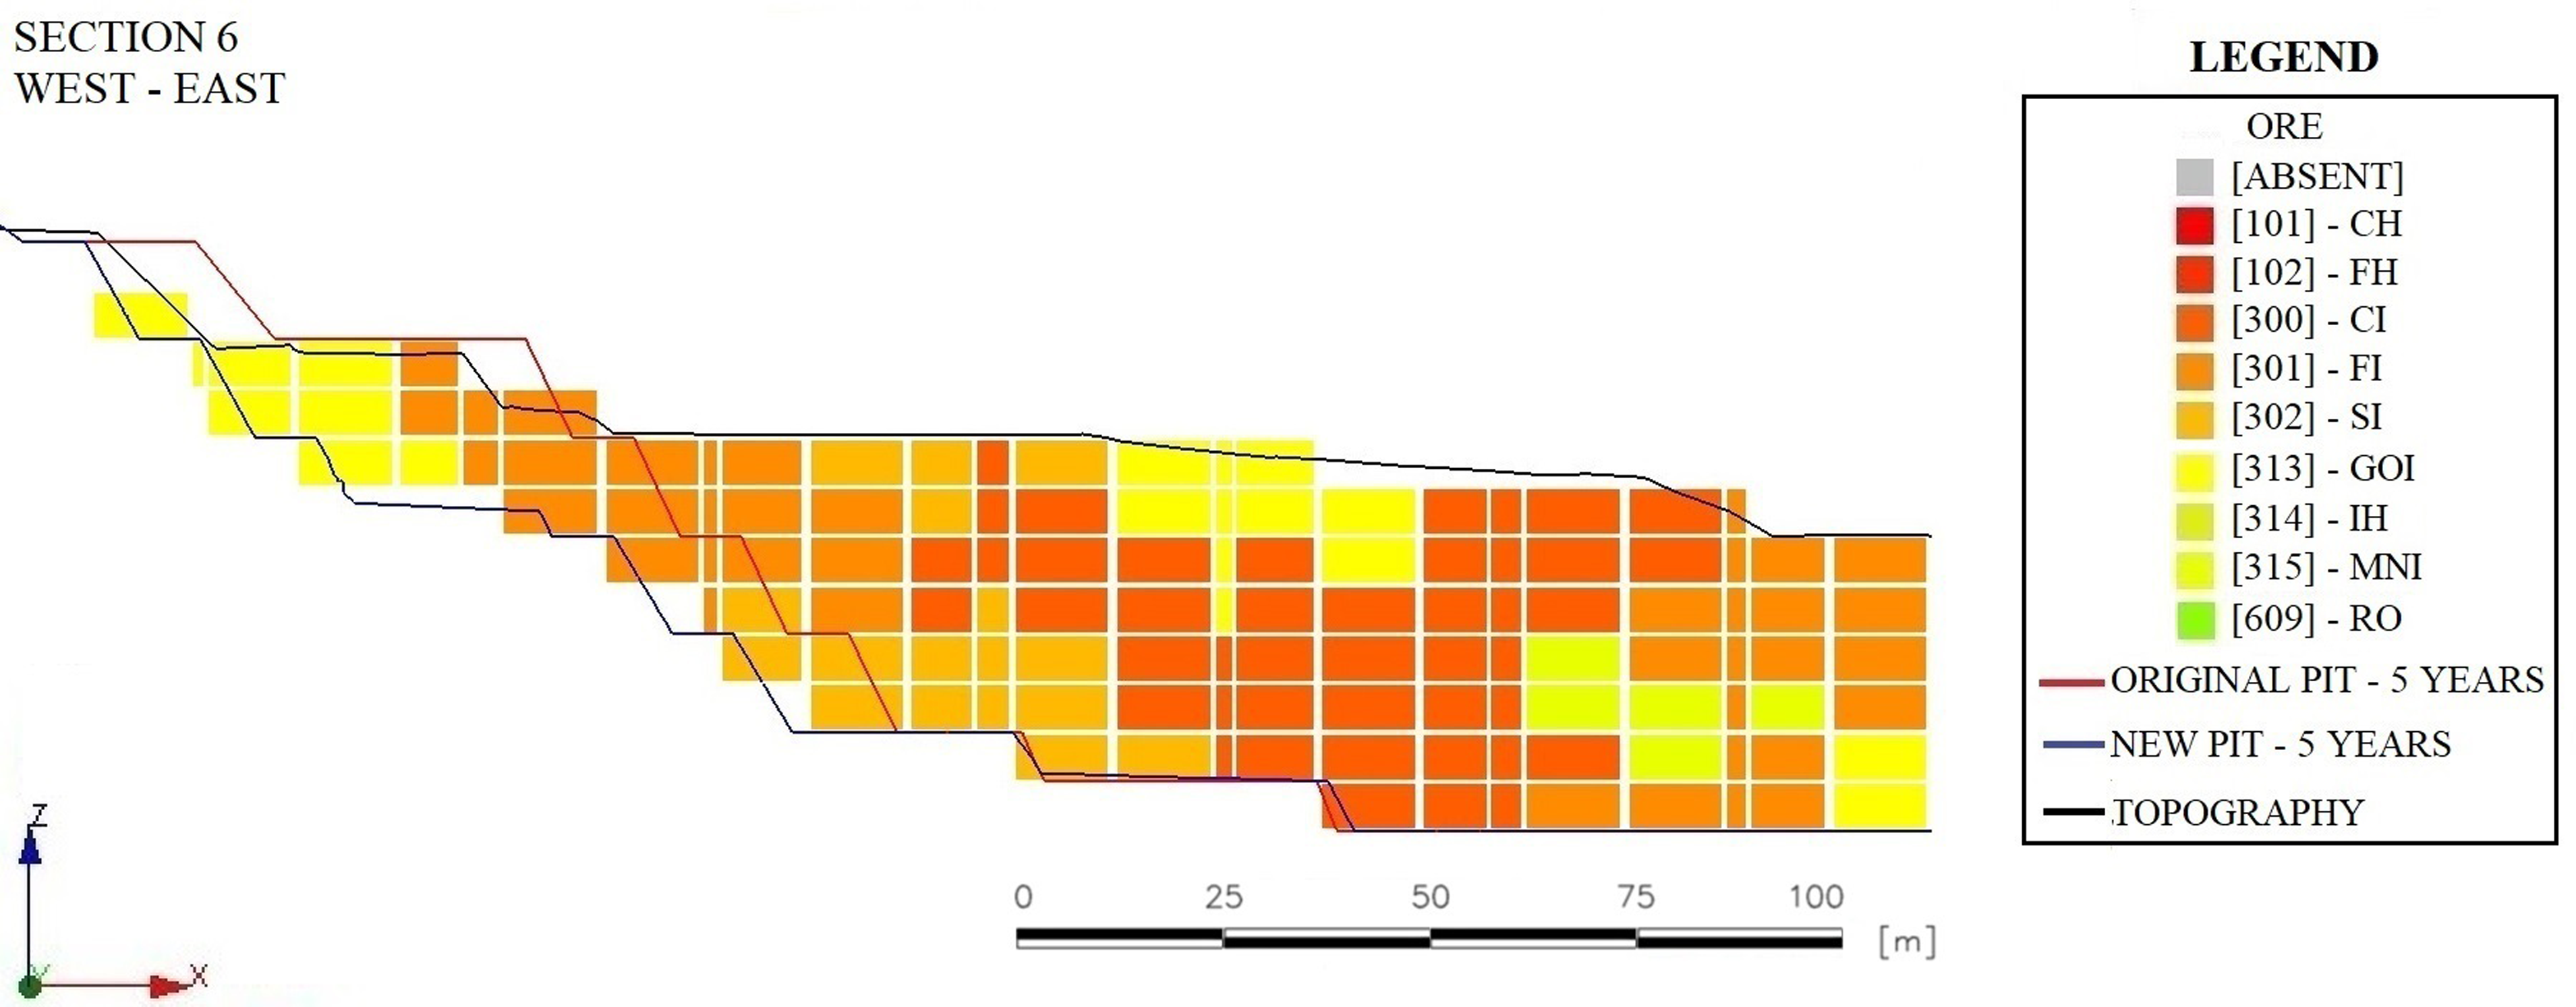
Section 6 presenting the availability of ore with the new suggestion of geometry of the slopes in the 5-year scenario.
Conclusions
The initial validation of the proposed methodology in an example of application, considering the geotechnical study of the slopes of the pit through 3D modelling, for a 5-year planning, shows encouraging results that can contribute to the improvement in planning uncertainty and can generate gains in efficiency and ore reserves.
When evaluating the stability conditions of the slopes of the original 5-year-old pit using a 3D geotechnical model, it was observed that there were regions in a critical situation, sometimes with FoS outside the acceptability limit (<1.3) and sometimes with overestimated FoS (>1.3). New geometries were then suggested for the slopes, which ensured an FoS of 1.3. In addition, these changes in geometry indicated a greater availability of ore for the mine: 539,296 tonnes, with an increase of US$ 392,687 in the NPV.
Considering this medium-term scenario, the availability of ore indicates an early use of mineral resources and an anticipation of financial gains, depending on the company's strategy and operating capacity. For long-term periods, more aggressive slope angles allow for ore gains at greater depths, increasing the amount of reserves and mine life and, consequently, the financial gain.
Footnotes
Acknowledgements
The authors thank the Vale Institute of Technology and Vale SA for the material and resources used in the preparation of this study.
Data availability statement
Not available.
Declaration of conflicting interests
The authors declared no potential conflicts of interest with respect to the research, authorship and/or publication of this article.
Funding
The authors received no financial support for the research, authorship and/or publication of this article.