
Abstract
The stability of the dump slope depends on many parameters, mainly the shear strength of the dump material. Obtaining strength parameters of dump material is vital in dump stability analysis. Dump material consisting of particles of varying sizes, as large as 1000 mm, is typical. It is challenging to obtain the material strength properties of such large particles in the laboratory. Extrapolation of the material strength properties of the modelled samples prepared by parallel gradation technique is used to calculate the dump material strength properties in this study. A closer agreement is found between the predicted and calculated values of the angle of internal friction. Numerical modelling has been carried out with the obtained material properties using RS2 V9.0, a finite element package, to analyse the stability of a dump slope. It is observed from the results that FOS (factor of safety) increase with an increase in dmax (maximum particle size), keeping the shape of the PSD (particle size distribution) curve constant. The paper develops a slope stability analysis methodology considering particle size's effect on slope stability. The proposed method can be used for accuracy and reliable results for slope stability analysis.
Introduction
The latest advancement in mining machinery and a rise in demand for raw materials led to ease of mining and an increase in the opencast mining, respectively. Compared to underground mining, the opencast mining share is gradually growing to ensure maximum possible mineral production and recovery (Kumar Behera et al., 2016). In the opencast mining, the mineral at some buried depth is extracted by removing the top overburden (OB) material. The OB material is usually blasted and dumped at a site using dumpers or draglines as a waste dump. The waste dump can be an internal dump formed by dumping into a pit parallel to a cavity created by extraction or an external dump formed at a location remote from the mineral-bearing area (Dash, 2019). External dumping has serious problems, such as the need for additional land, high reprocessing costs, stability, and on-site reclamation (Kainthola et al., 2011; Upadhyay et al., 2007). Day-to-day increase in the opencast mines increased the volume of minerals and waste rocks, causing the growth of waste dumps. Thus, mining activities generate large volumes of blasted rockfill with the increase in coal production at a high stripping ratio. This has to be accommodated within the lease boundary (Gupta et al., 2021). The height of the dump is increasing continuously as the mining goes deeper and deeper to fulfil the demand. This resulted in the mine dump being highly hazardous (Koner and Chakravarty, 2010). Failure of these slopes increases the risk in terms of damage to machinery and, sometimes, loss of life and property. Due to the instability of dump slopes, several incidents were reported in recent years that resulted in the loss of human life, productivity, and machinery, as well as harm to the environment and surrounding property (Adibee et al., 2013; Gao et al., 2017; Kainthola et al., 2011; Kumar Behera et al., 2016; Shakesby and Whitlow, 1991; Sharma and Roy, 2015; Siddle et al., 1996; Ulusay et al., 1995; Zhao et al., 2012). Therefore, the stability of the dump slope is analysed to find the causes of failure and factors affecting the strength of the slope. Proper design of the dump should be carried out considering a representative sample of the OB dump.
The dump material is a rock fill composed of a soil–rock mixture. As the blasting of OB material forms the dump material, it is also termed blasted rockfill. The geotechnical characterisation of blasted rockfill is one of the leading issues in geotechnical engineering but seldom receives attention (Dorador et al., 2020). Moreover, the particle size varied from very fine to a huge boulder. Therefore, calculating shear strength and other geotechnical properties is difficult to predict accurately (Varadarajan et al., 2006). The dump material consists of particles as large as 1000 mm. The specimen size for these tests in the laboratory is very minute compared to the size of the particles in the dump. Thus, these test results are ambiguous. Large particles are required to make a specimen size representing the dump material. Testing dump material of large-size particles in a laboratory requires large, heavy equipment and laborious (Varadarajan et al., 2006).
Gradation techniques were developed to overcome this challenge in rockfill embankments. Since the rockfill materials have large particle sizes, some modelling techniques are used to reduce the size of the particles before preparing the samples for testing. Through extrapolation using the particle size as a reference, the material parameters from the tests are used to obtain the parameters for large-size field particles. The method implicitly presupposes that all variables influencing the rockfill material's strength can be connected to particle size. The particle size and size distribution are determined by sieve analysis using the sieves containing a screen with square holes. Popularly known gradation techniques are scalping, parallel gradation, replacement and quadratic grain size. The scalping technique has been used in prior studies to determine the relation between the shear strength properties of rockfill and maximum particle size (Bagherzadeh-Khalkhali and Mirghasemi, 2009; Deiminiat et al., 2020b; Ovalle et al., 2014, 2020; Marachi et al., 1972; Matsuoka and Liu, 1998; MotahariTabari 2018; Varadarajan et al., 2003; Wang et al., 2019). Many researchers use the parallel gradation technique to determine rockfill material shear strength and geotechnical properties (Deiminiat et al., 2020a; Gupta, 2009; Honkanadavar and Sharma, 2011; Marachi, 1969; Vasistha et al., 2013).
This article outlines the novel approach for determining the stability of a dump slope using numerical modelling considering the role of particle size. The stability analysis of the dump slope is using a down gradation curve. Since the in-situ testing of the dump material is not feasible owing to the large and variable size of particles, an effort has been made to incorporate the parallel gradation technique in dump slope stability analysis to obtain a reliable result. Laboratory tests have been conducted on modelled samples prepared using the parallel gradation technique for obtaining material properties of the dump slope. Numerical simulations have been carried out using the obtained material properties. This method will be reliable in getting accurate slope stability results.
Methodology
The parallel gradation technique is suggested by Lowe (1964). The oversize particles that are larger than the permitted maximum particle size are rejected in this method. However, the rejection is further modified to yield a particle size distribution (PSD) curve parallel to the field material.
For instance, the ratio N is computed to create a modelled sample of the parallel gradation approach with a dmax value of dmax.m from a field material with a dmax value of dmax.f

The grain size of the modelled sample is derived as follows for a certain percentage passing p:

The required mass for each range of particle sizes can be derived after the desired parallel gradation curve has been established by taking into account the required portion and the overall mass of the modelled sample. Likely, some of the particle size values found in equation (2) are not present in the sizes of ordinary sieves that are accessible. In this situation, the sieves with sizes closest to those predicted by equation (2) should only be used as a rough guide.
Figure 1 displays a sample model's particle size distribution curve (PSDC) using the parallel gradation technique and field data. The desired dmax of the parallel gradations sample is 25.4 mm; however, the field material's dmax value is 1000 mm. The shift distance between the gradation curves of the field material and the modelled sample is log(40) along the logarithm axis of particle size. The ratio between the dmax value of the field material and the modelled sample is 40. Two materials with different particle sizes can be physically considered similar, with the same compactness and parallel grain size distribution (GlobalData, 2021).
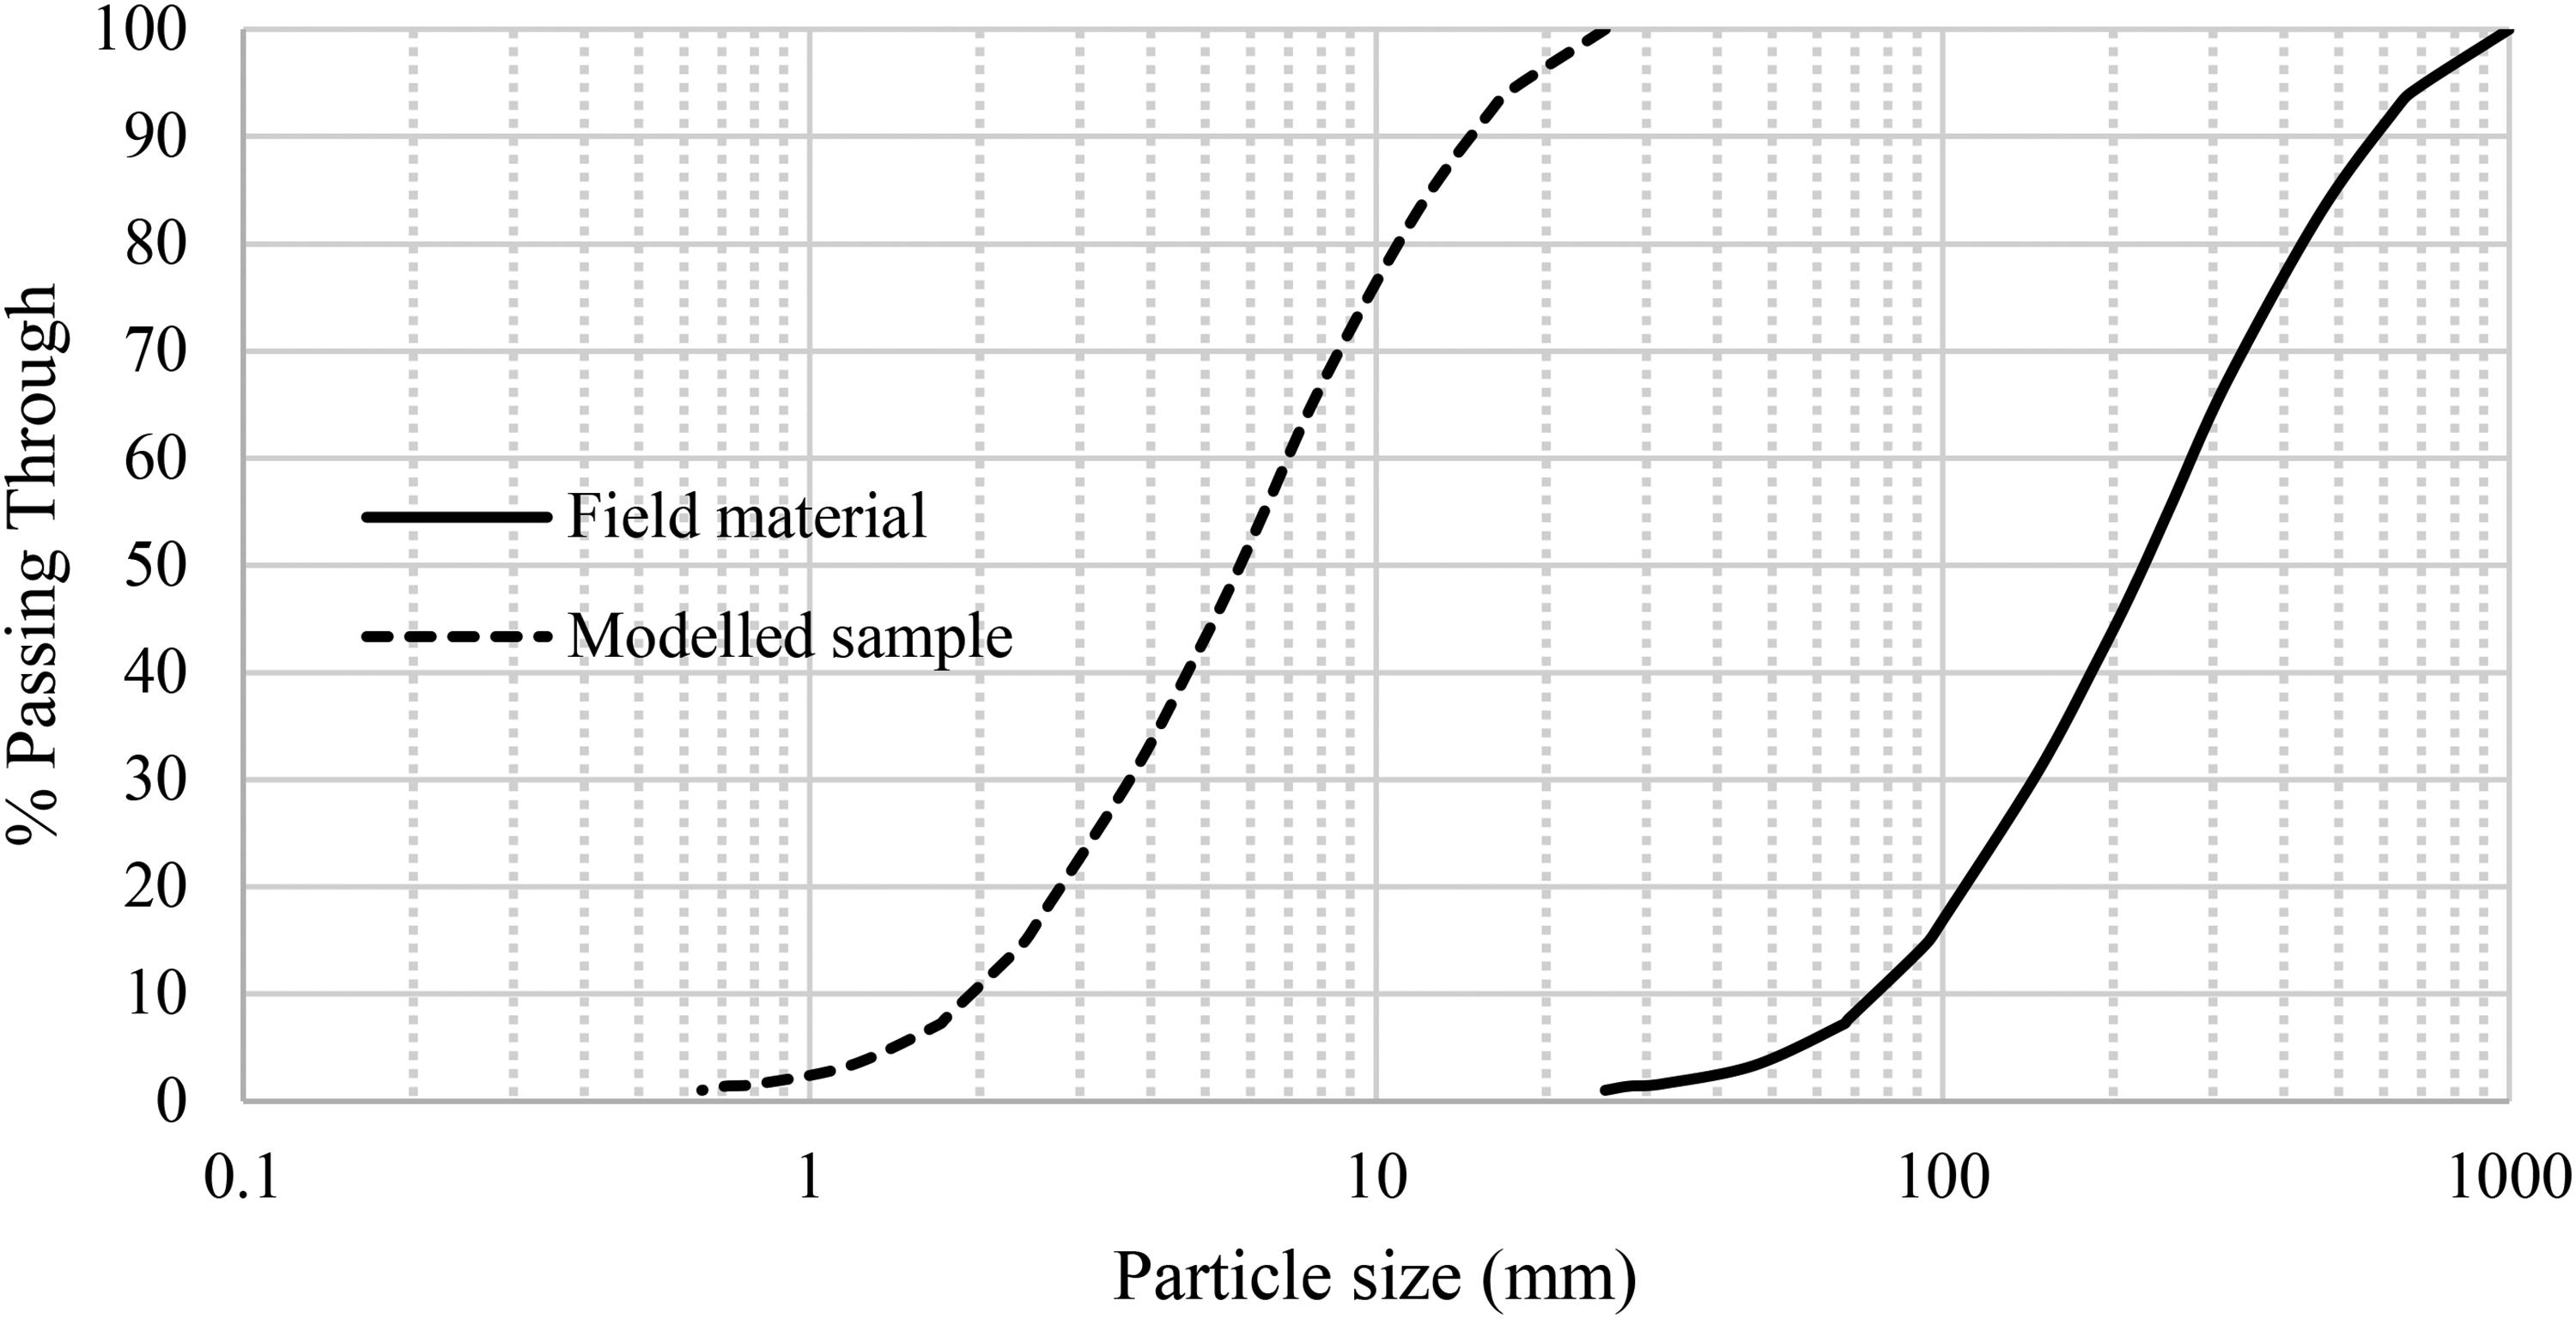
Particle size distribution of field material and modelled sample.
Laboratory and in-situ tests
Photos of the blasted rock were taken at the location using a camera. A square scale of 1 m in length is placed in the field while capturing each photo, as shown in Figure 2 for image analysis. The PSDC of the blasted rock at each different location has been obtained from the photos using the ‘WipFrag’ software. WipFrag image analysis software allows instant PSD analysis of digital images collected at the muck pile after a blast, a closer-up sample of a stockpile, a laboratory sample or even drone/UAV images. With auto-scaling capabilities, WipFrag is safe, cost-effective and the most accurate fragmentation analysis tool. The average PSDC of the field material from PSDCs at the location is presented in Figure 3.
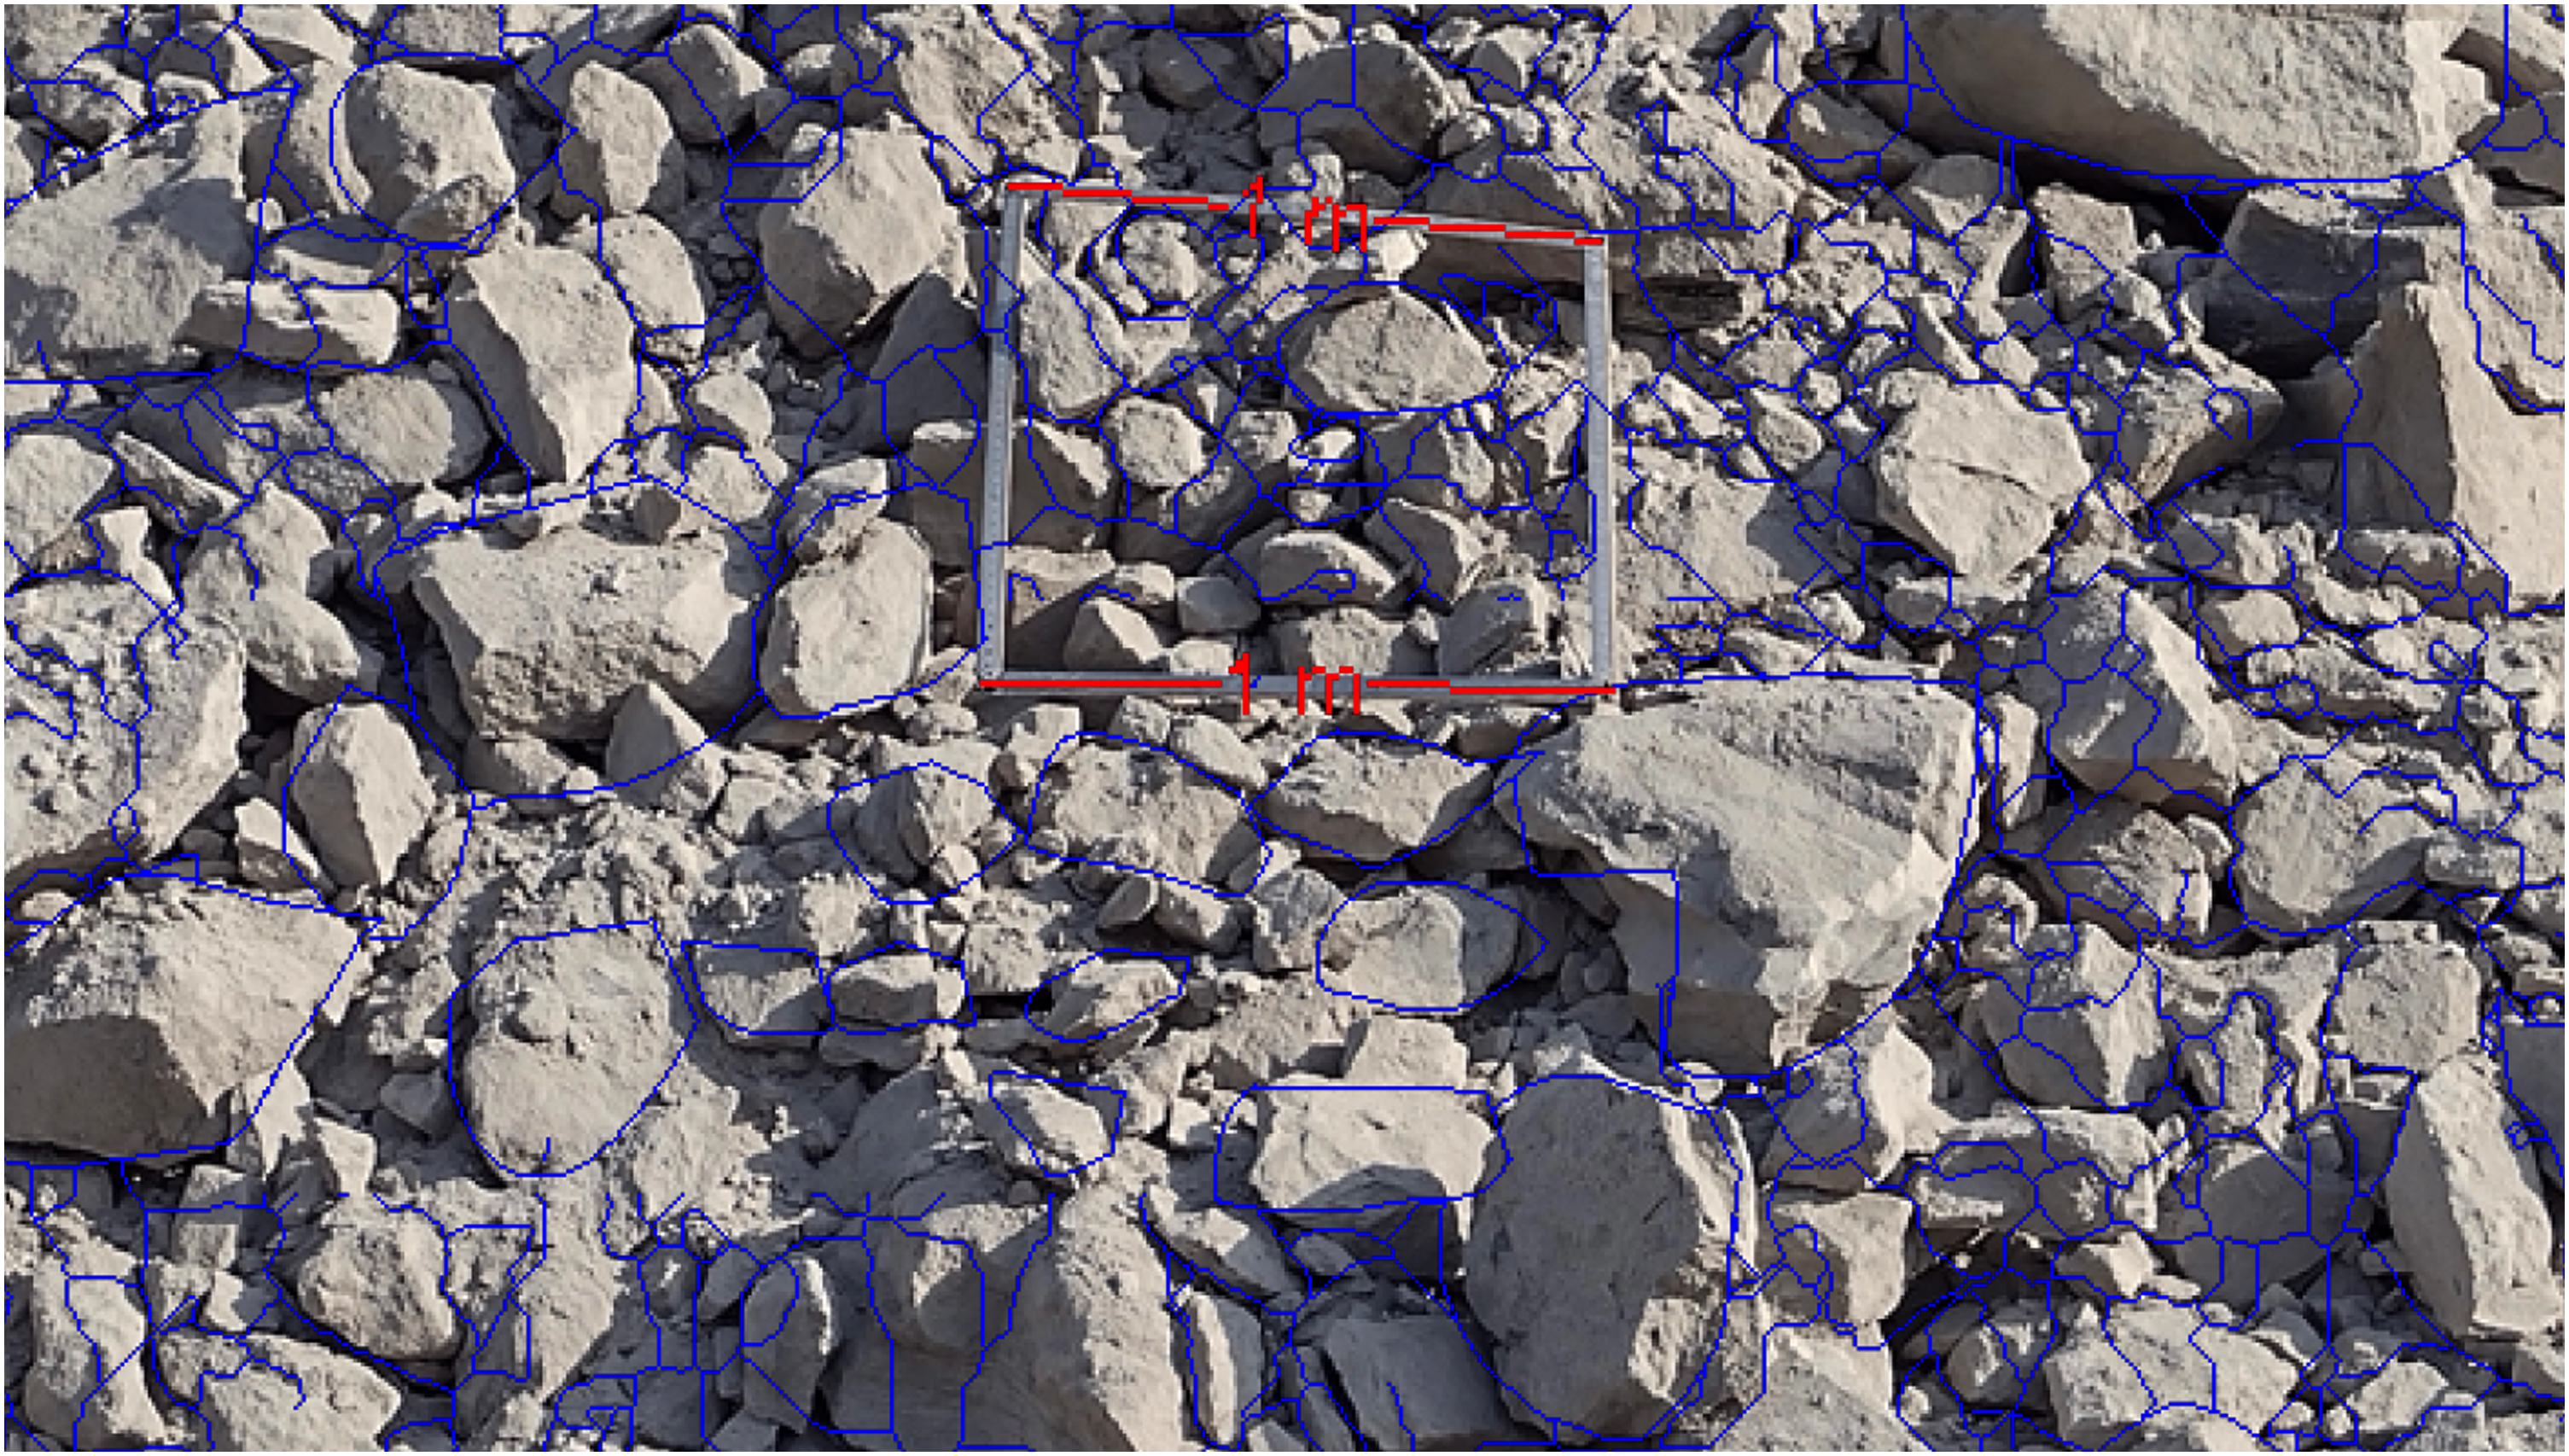
Image analysis of blasted rock using WipFrag.
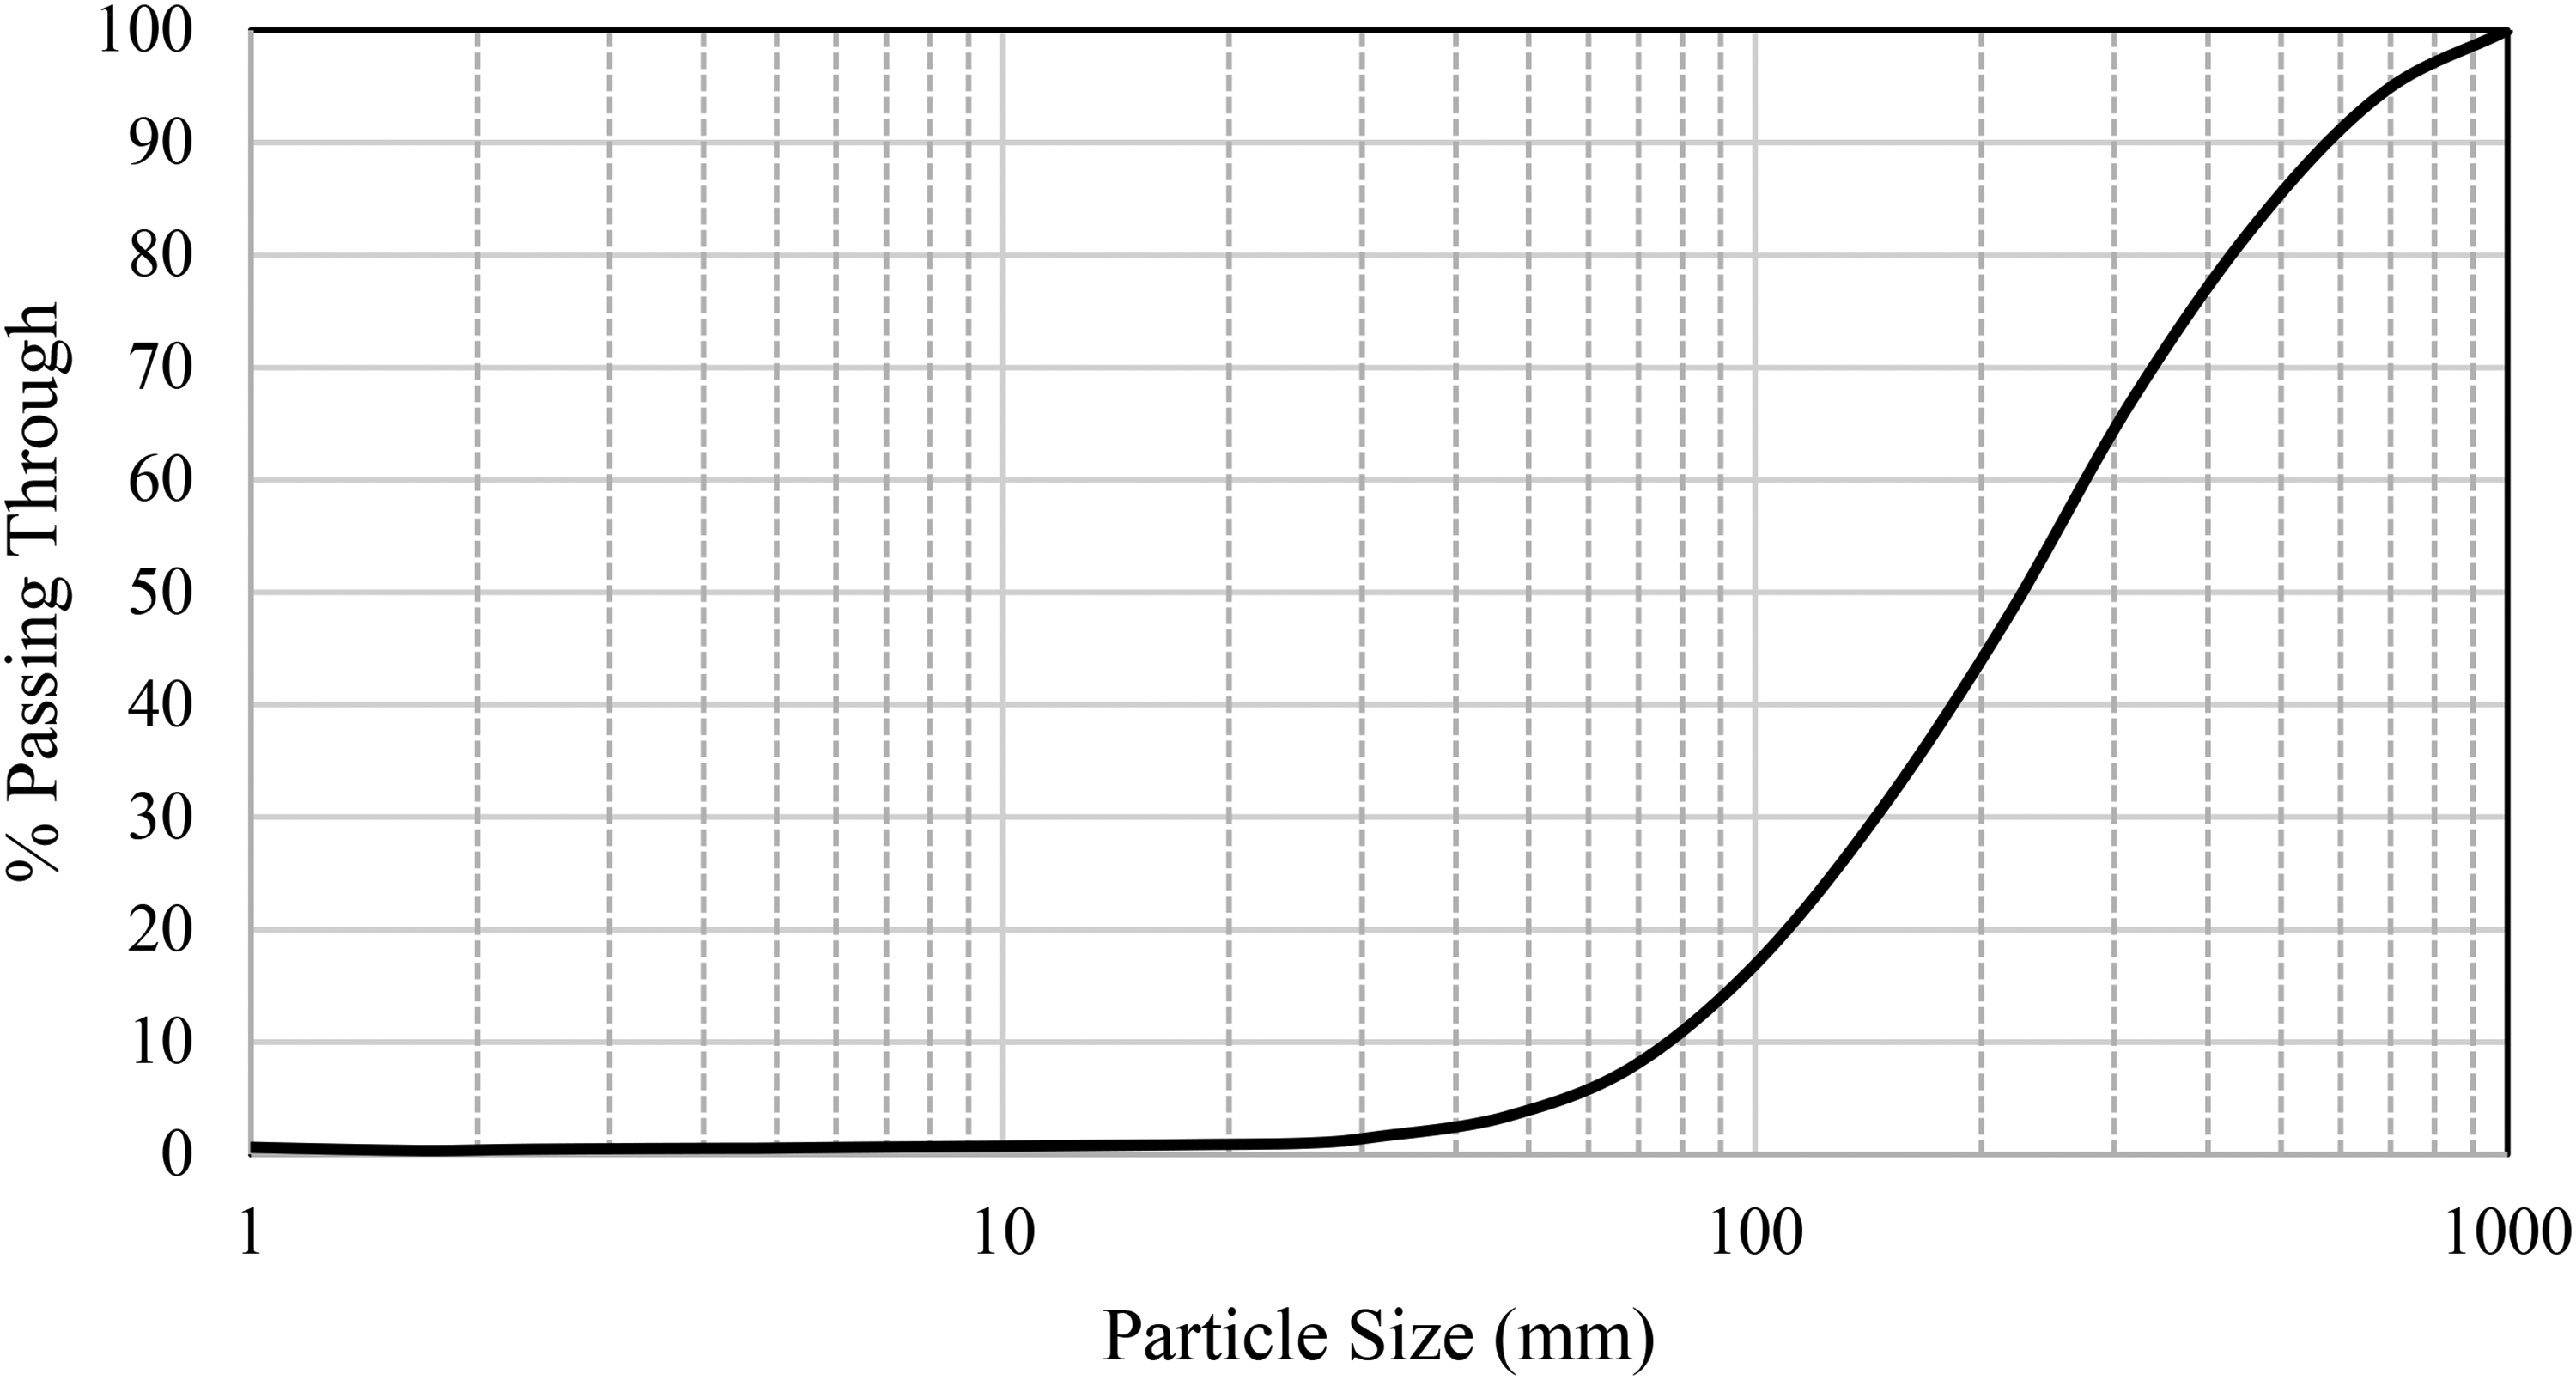
Average PSDC of the dump material.
The density of the dump material is calculated as 1.7–1.8 t/m3 using the sand replacement method at the site (Figure 4). When a material is sieved with any standard size of sieves (USA, India or UK), it will give the same PSDC. In this study, dump material is sieved using US standard size sieves and collected from the site such that each bag contains a particular size material like 25.4–16 mm, 16–6.35 mm, 6.35–4.75 mm, 4.75–2.36 mm, 2.36–1.7 mm, 1.7–1 mm and below 1 mm. Nearly 2 tonnes of the dump material has been transported from the site to the laboratory in a truck.
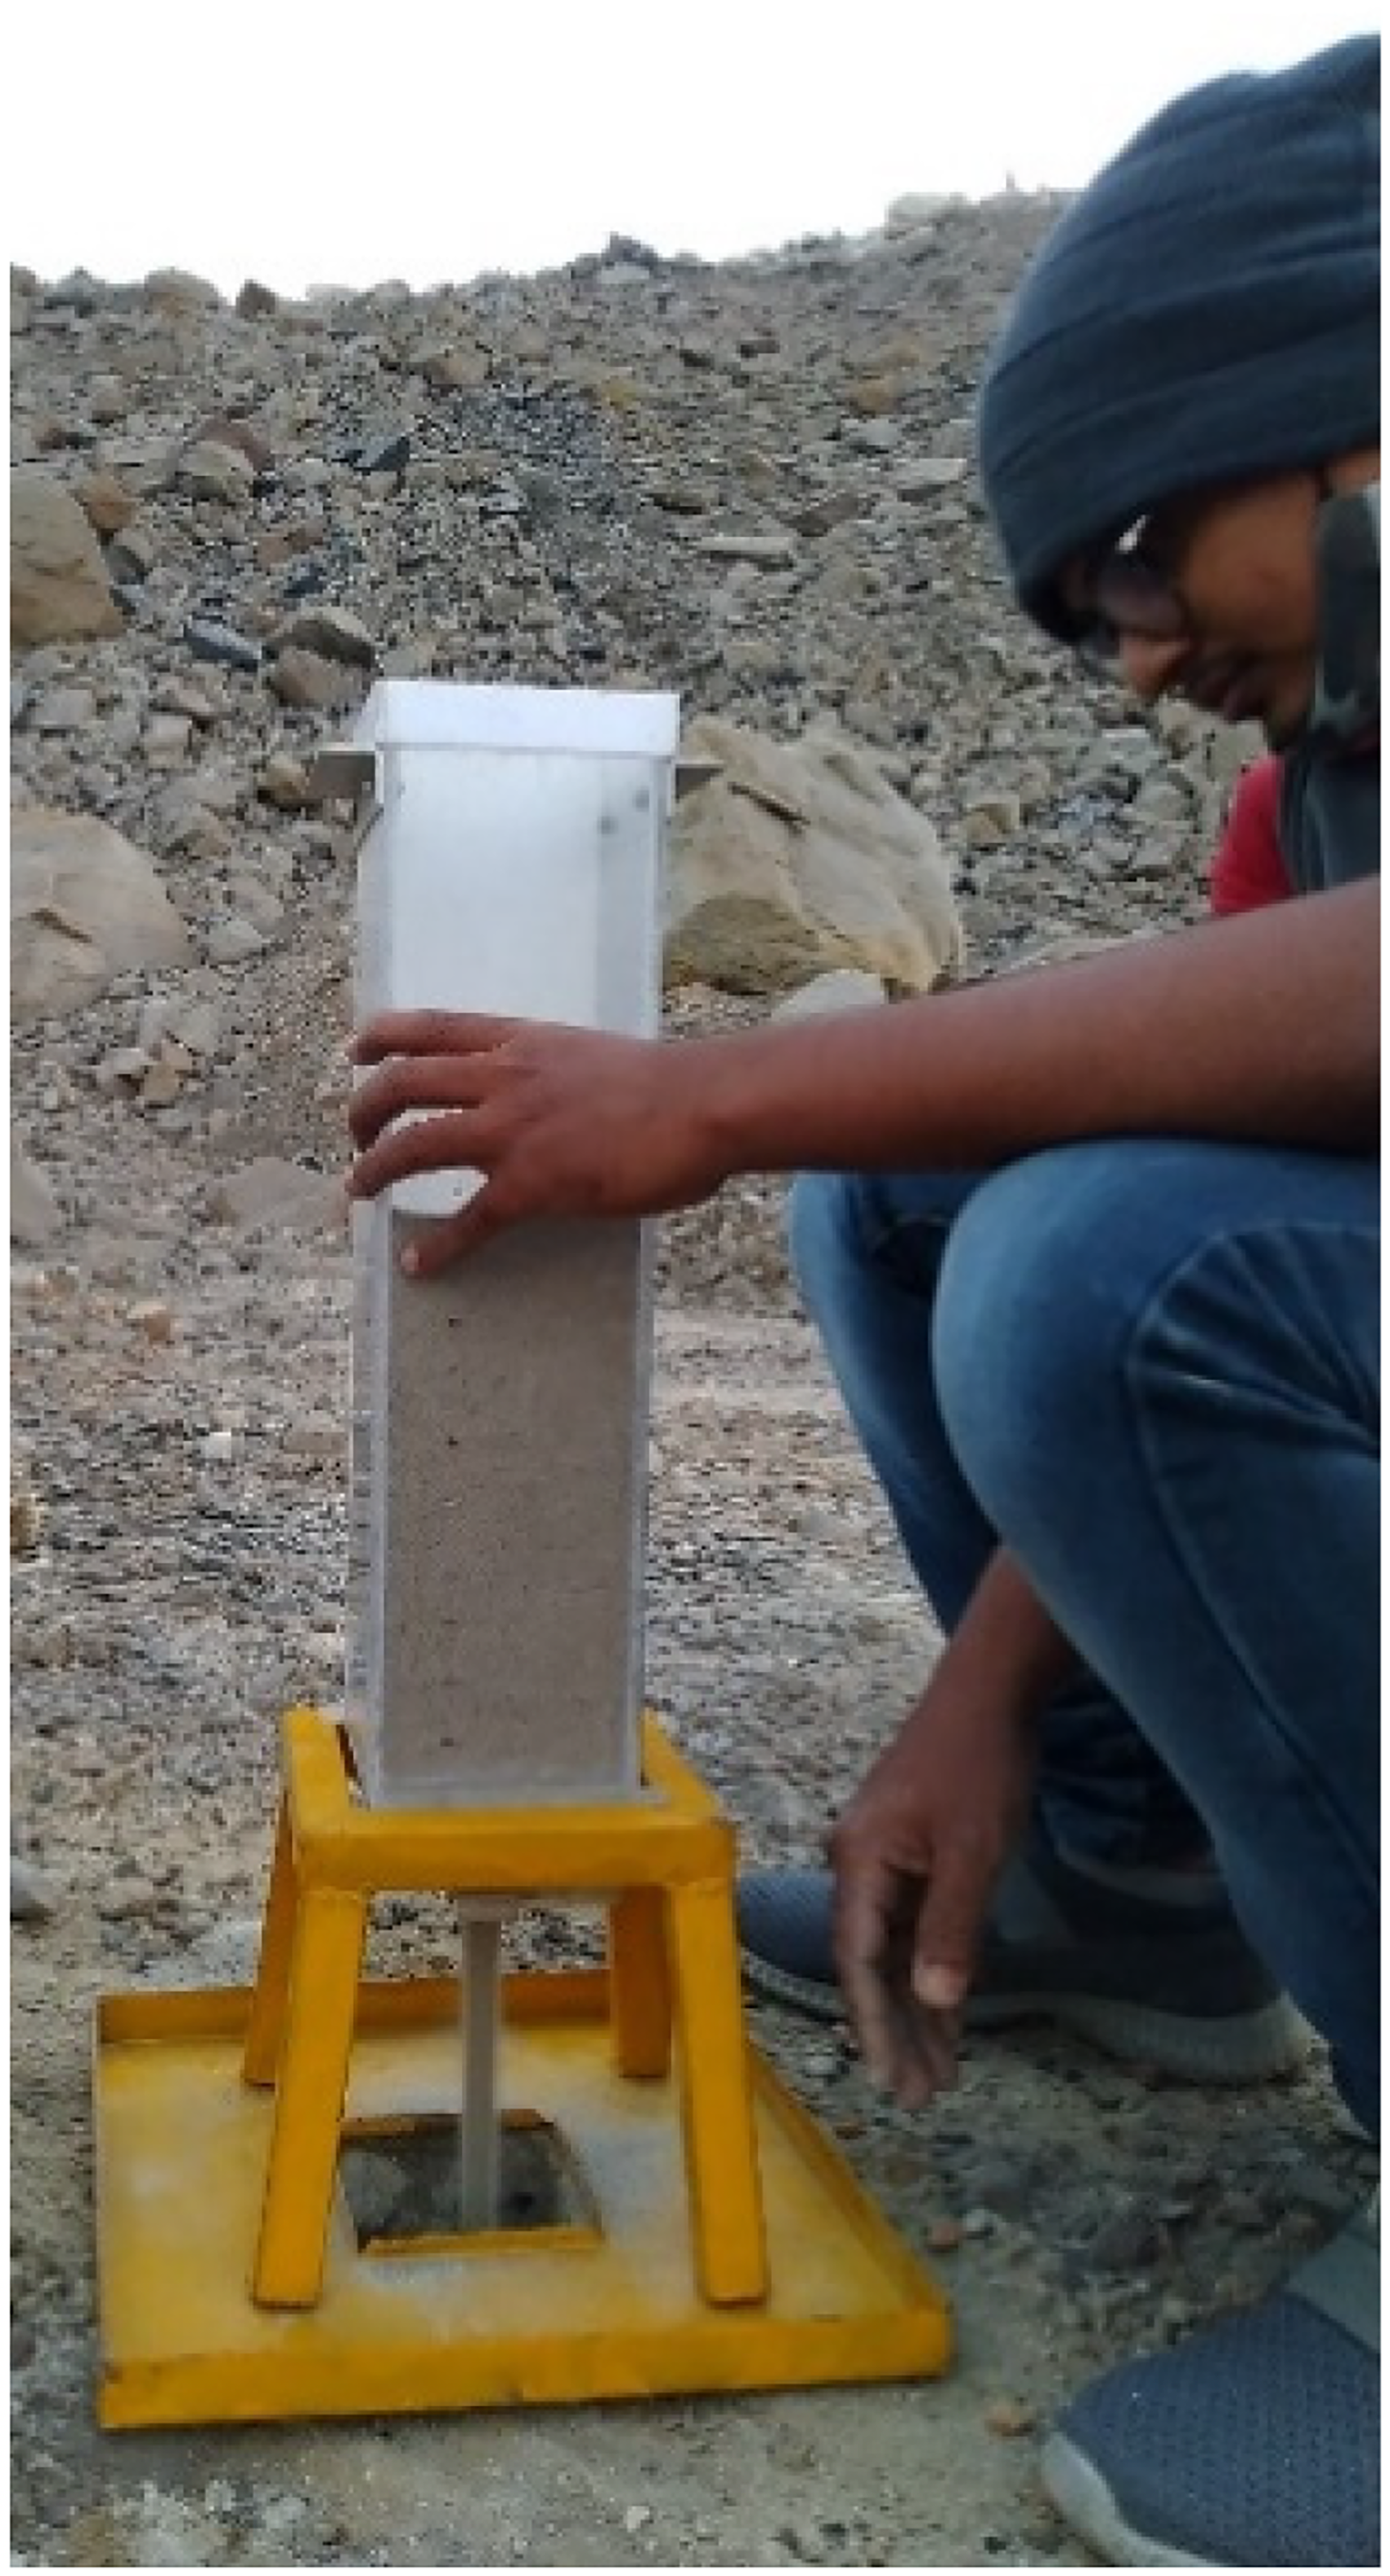
Performing sand replacement method at the site.
Parallel PSD curves with a maximum particle size of 25.4 mm, 16 mm, 6.35 mm, 4.75 mm, 2.36 mm, 1.70 mm and 1 mm were drawn using the parallel gradation formula. Parallel curves and the PSD of the dump material are shown in Figure 5. Required modelled samples have been prepared using the parallel PSD curves.
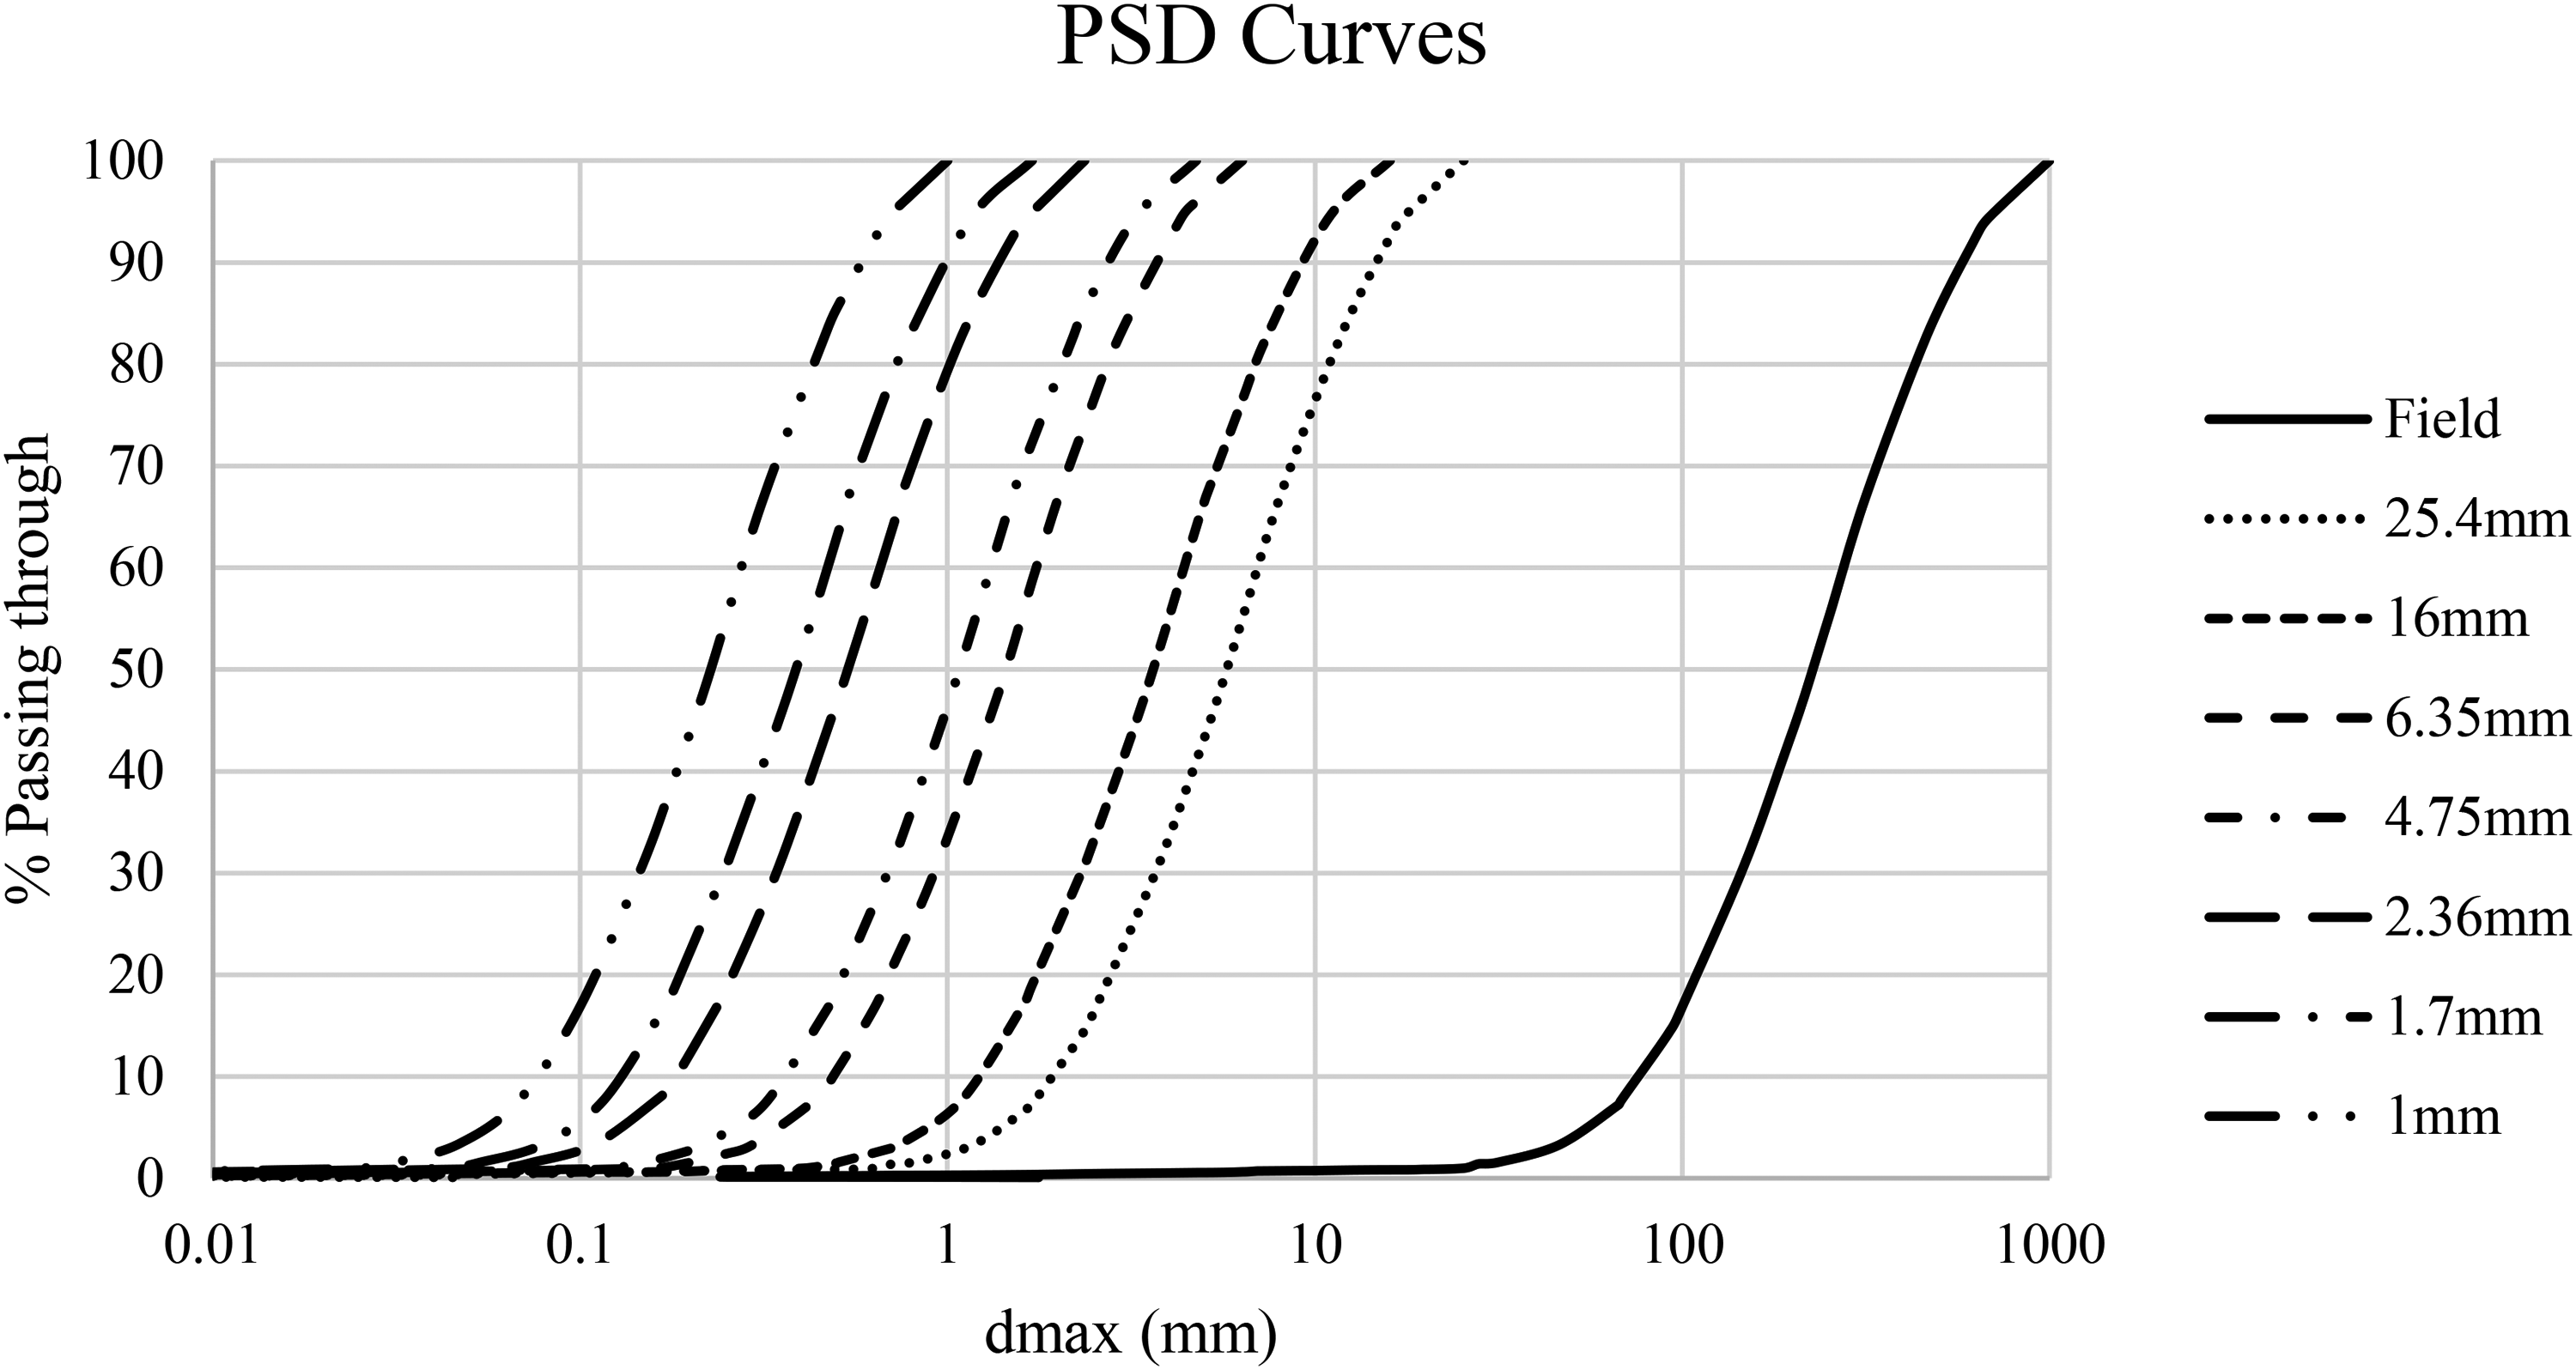
Obtained modelled PSD curves along with field PSD curve.
The average moisture content of the dump material was calculated by drying samples in an oven and found to be 9%. The modelled samples were dried in an oven to remove moisture from the sample, and 9% of water was added before undergoing a direct shear test. The modelled material is compacted layer by layer to obtain the density of the dump material. A small direct shear testing machine with a size 6 cm × 6 cm shear box with a height of 3 cm is used for samples with a maximum particle size of less than 4.75 mm (Figure 6(a)). A large direct shear testing machine with a shear box of size 30 cm × 30 cm with a height of 20 cm is used for the modelled samples with a maximum particle size of 6.35 m, 16 mm and 25.4 mm (Figure 6(b)). Normal loading on an older mine dump can increase to 196–245 kPa. However, the dump analysed in the present case was a working one. Hence, that much level of compaction has yet to be achieved. Thus, we have performed the testing under a normal load of 49.03 kPa, 98.06 kPa and 147.09 kPa based on field experience. Each result is acquired by performing three direct shear tests with each normal load of 49.03 kPa, 98.06 kPa and 147.09 kPa on each sample to yield cohesion and friction angle based on field experience.
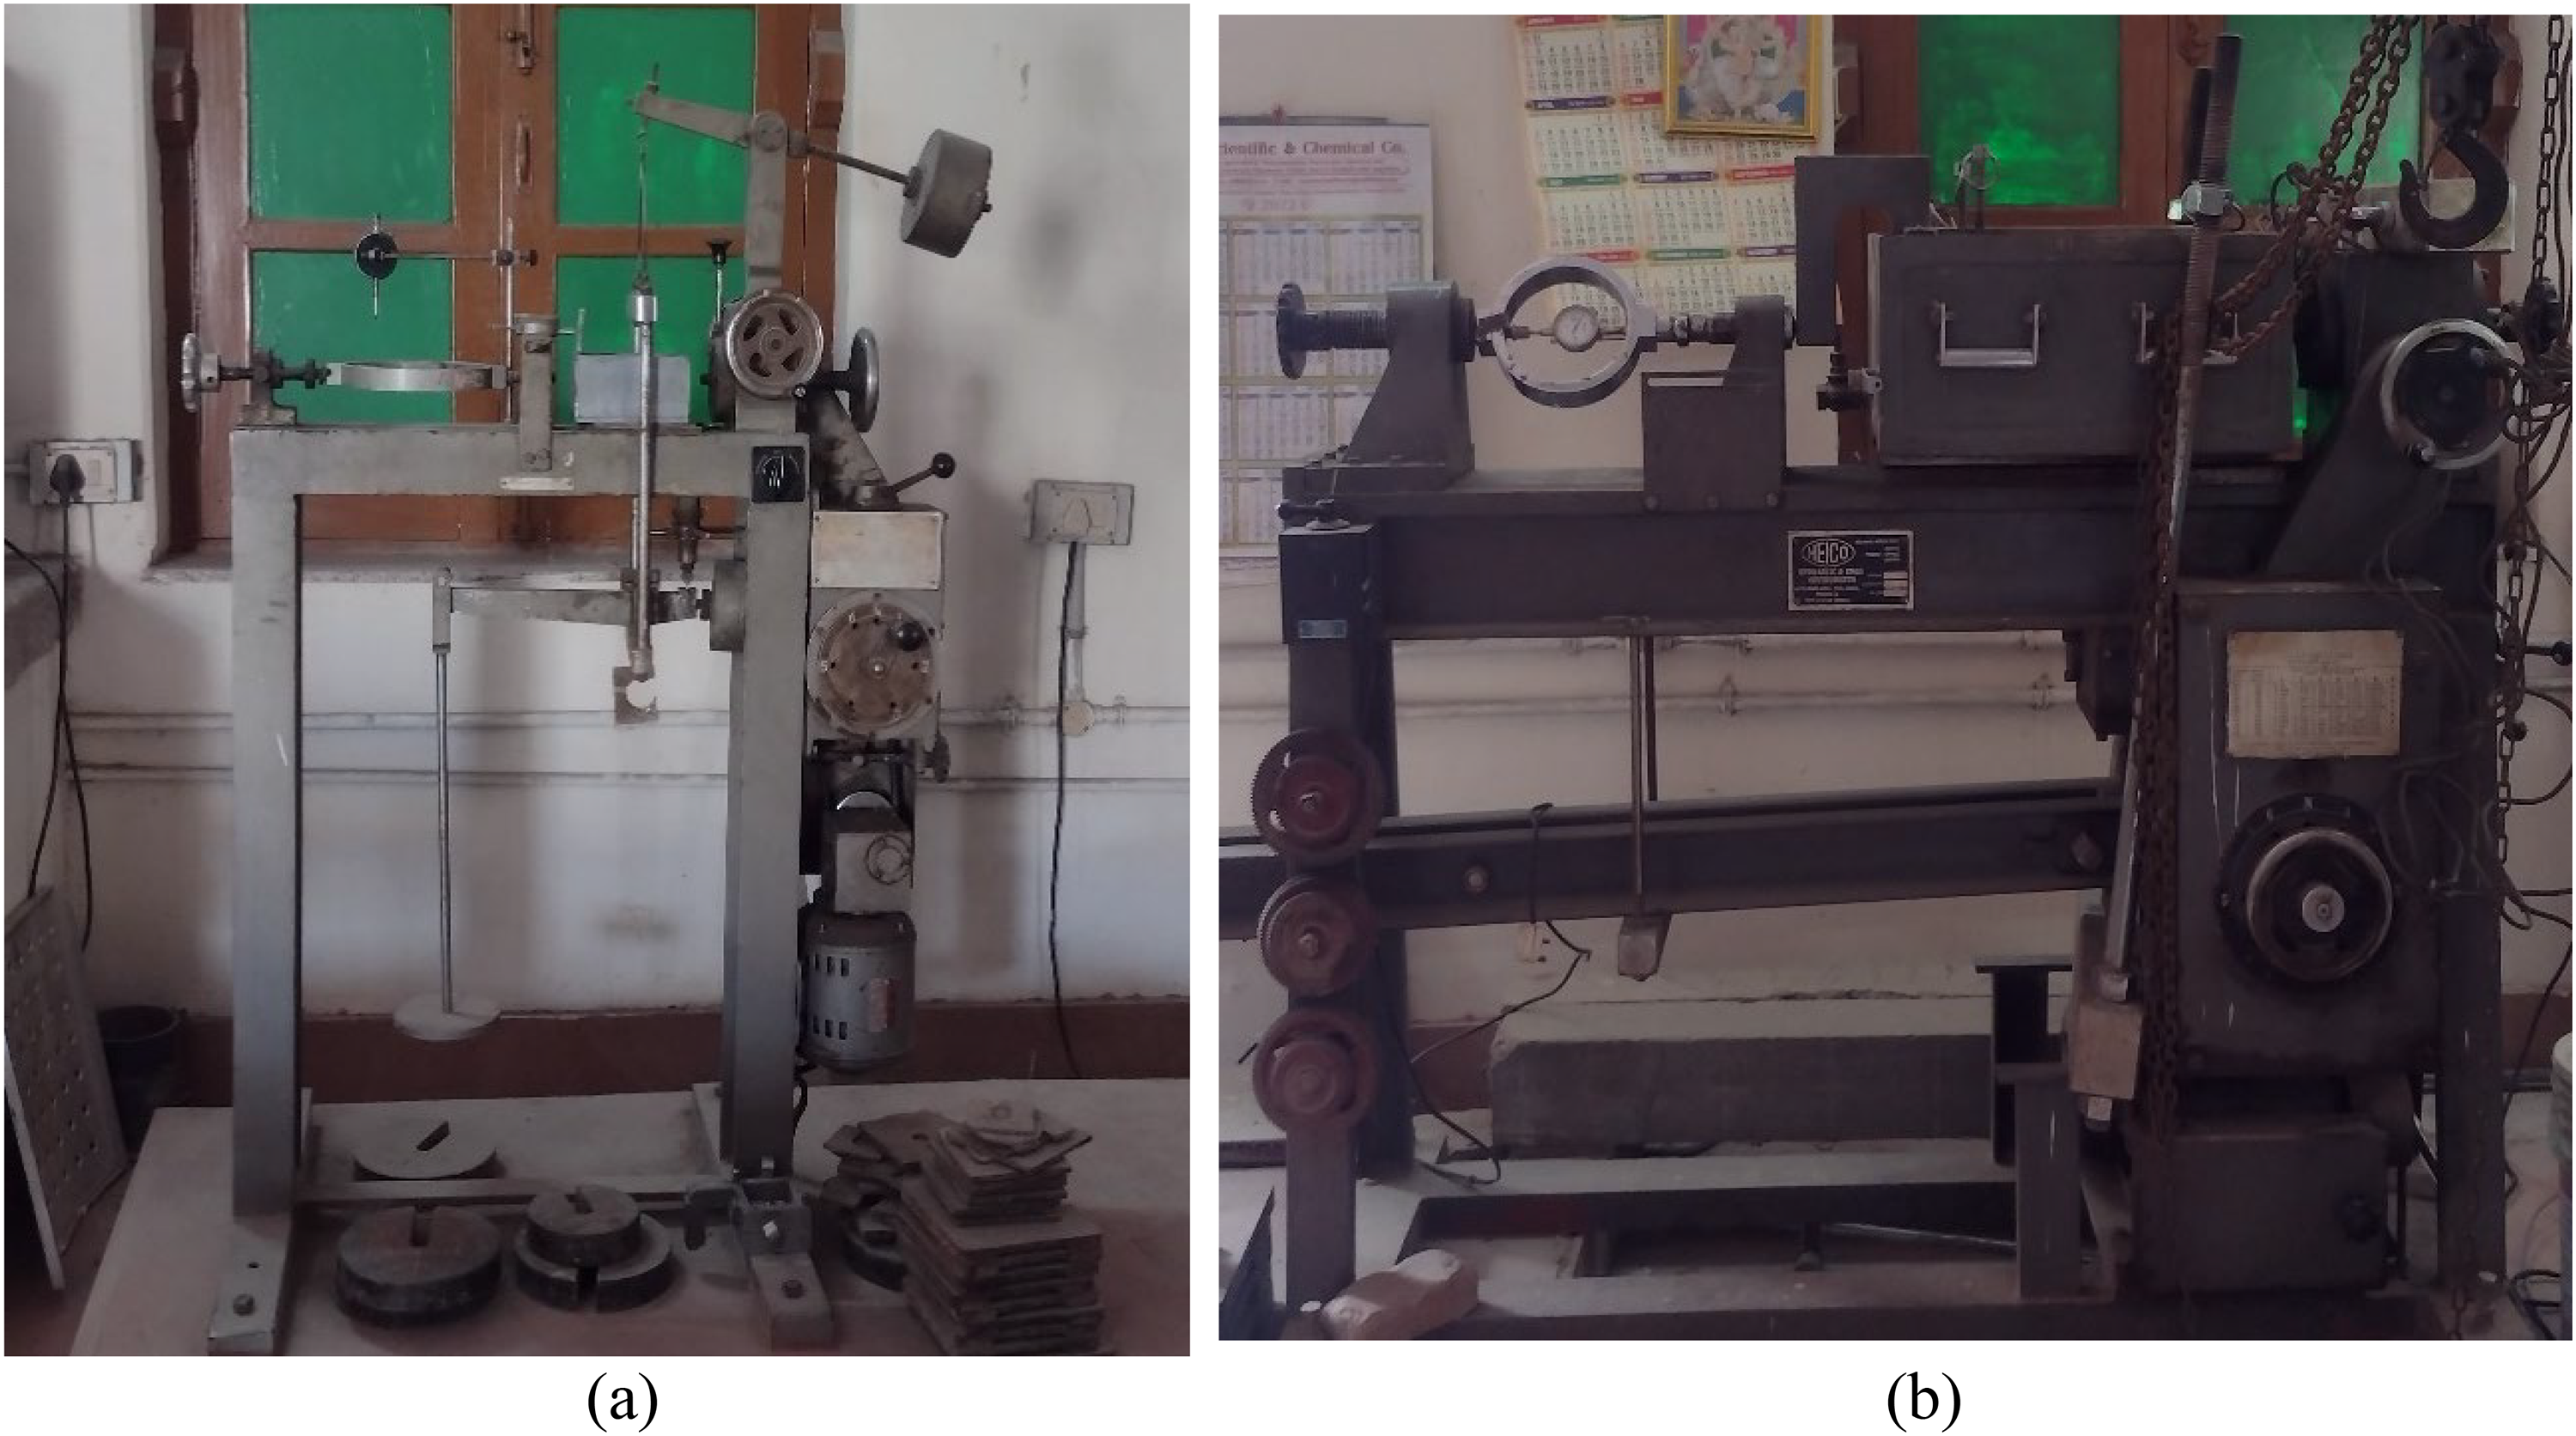
(a) Small direct shear test machine. (b) Large direct shear test machine.
Numerical simulation
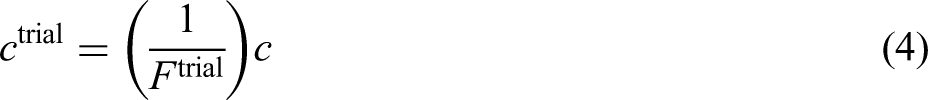
Numerical modelling is one of the reliable tools for assessing the structural stability of dump slopes. The shear strength reduction (SSR) method is used in most scientific studies using finite element and finite difference models to determine the stability of dump slopes (Bharati et al., 2020; Farias and Naylor, 1998; Kumar Bharati et al., 2021; Matsui and San, 1992; Rai et al., 2012; Ray et al., 2020a, 2020b; Zhigang et al., 2020; Zhu et al., 2016; Zou et al., 2018). SSR automatically finds critical slip surfaces and fulfils translational and rotational equilibrium conditions. A series of iterations using trial values of strength reduction factor Ftrial (Equations. (4) and (5)) vary the cohesion (

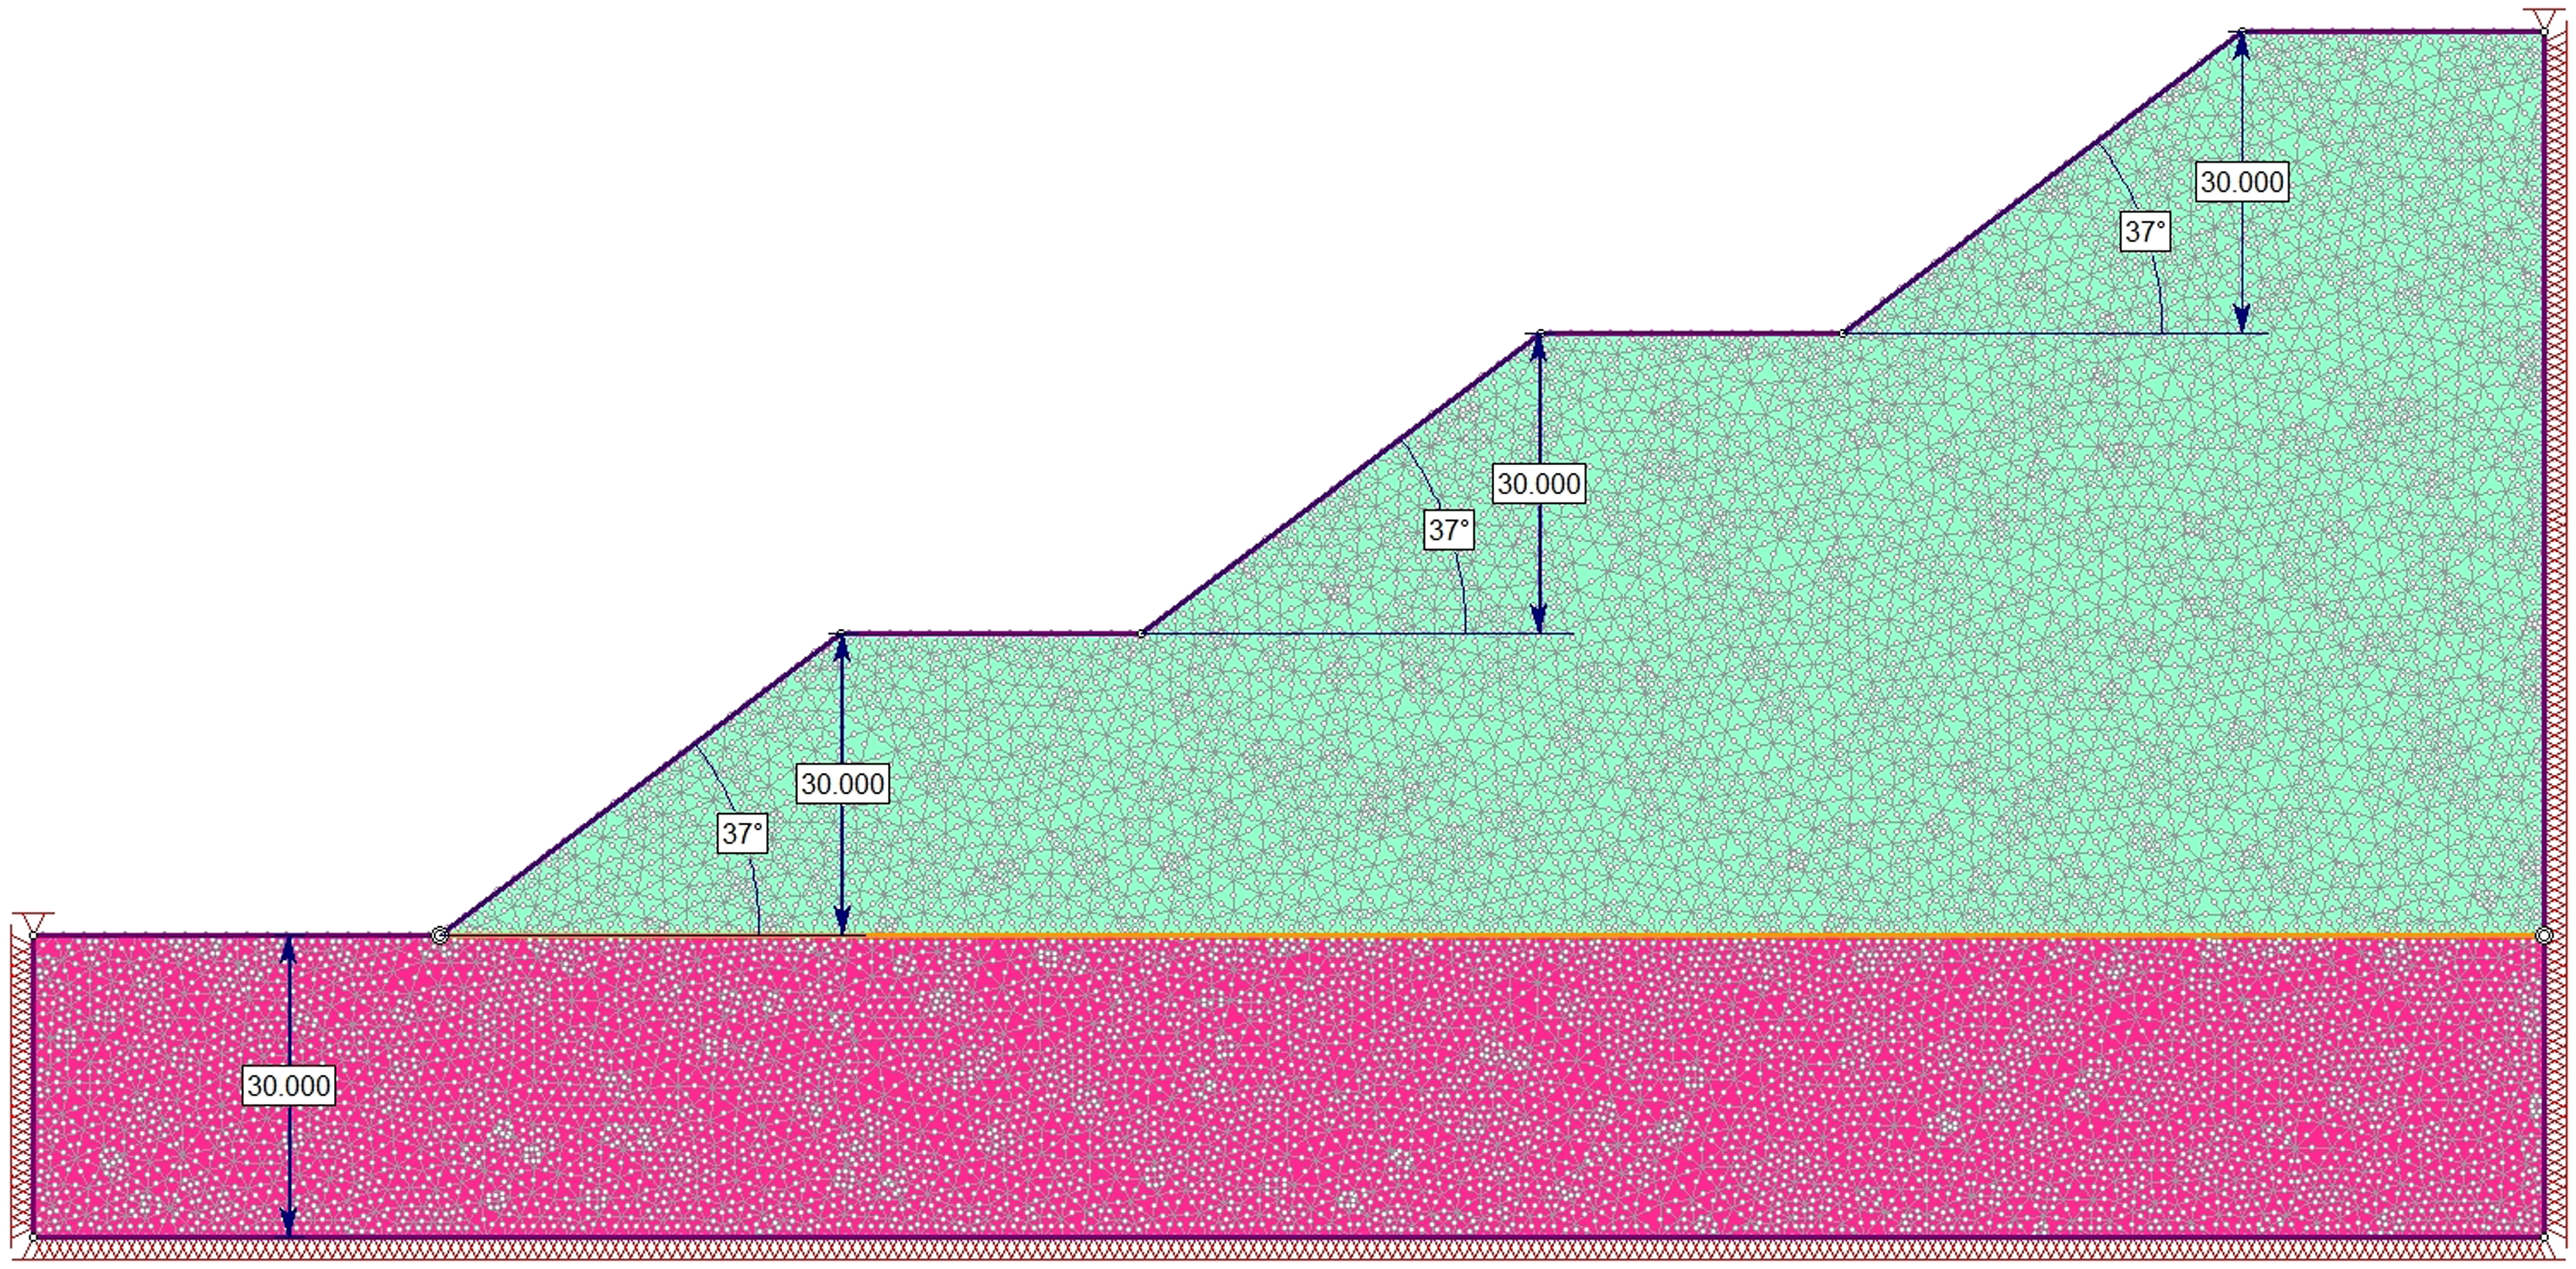
Numerical model used for stability analysis.
Validation procedure
India is the second largest producer and consumer of coal after China in FY 2021 (April 2020–March 2021) (GlobalData, 2021; Worldometer, 2022). The opencast coal mines are one of the significant sources of dump slopes.
Khadia is the opencast coal mine project in the Singrauli region of Northern Coalfields Limited, which has been taken as a case study for the present research, as shown in Figure 8. Singrauli shares boundaries with two states, namely Uttar Pradesh and Madhya Pradesh. Blasting is carried out to remove the OB material above the coal. The blasted material is transported to the dumping area through the dragline and shovel–dumper combination. The top-down construction method of dump slope is followed. Samples were taken from different parts of the dump of the Khadia mine in the Singrauli region to represent the entire dump area of the Khadia mine.
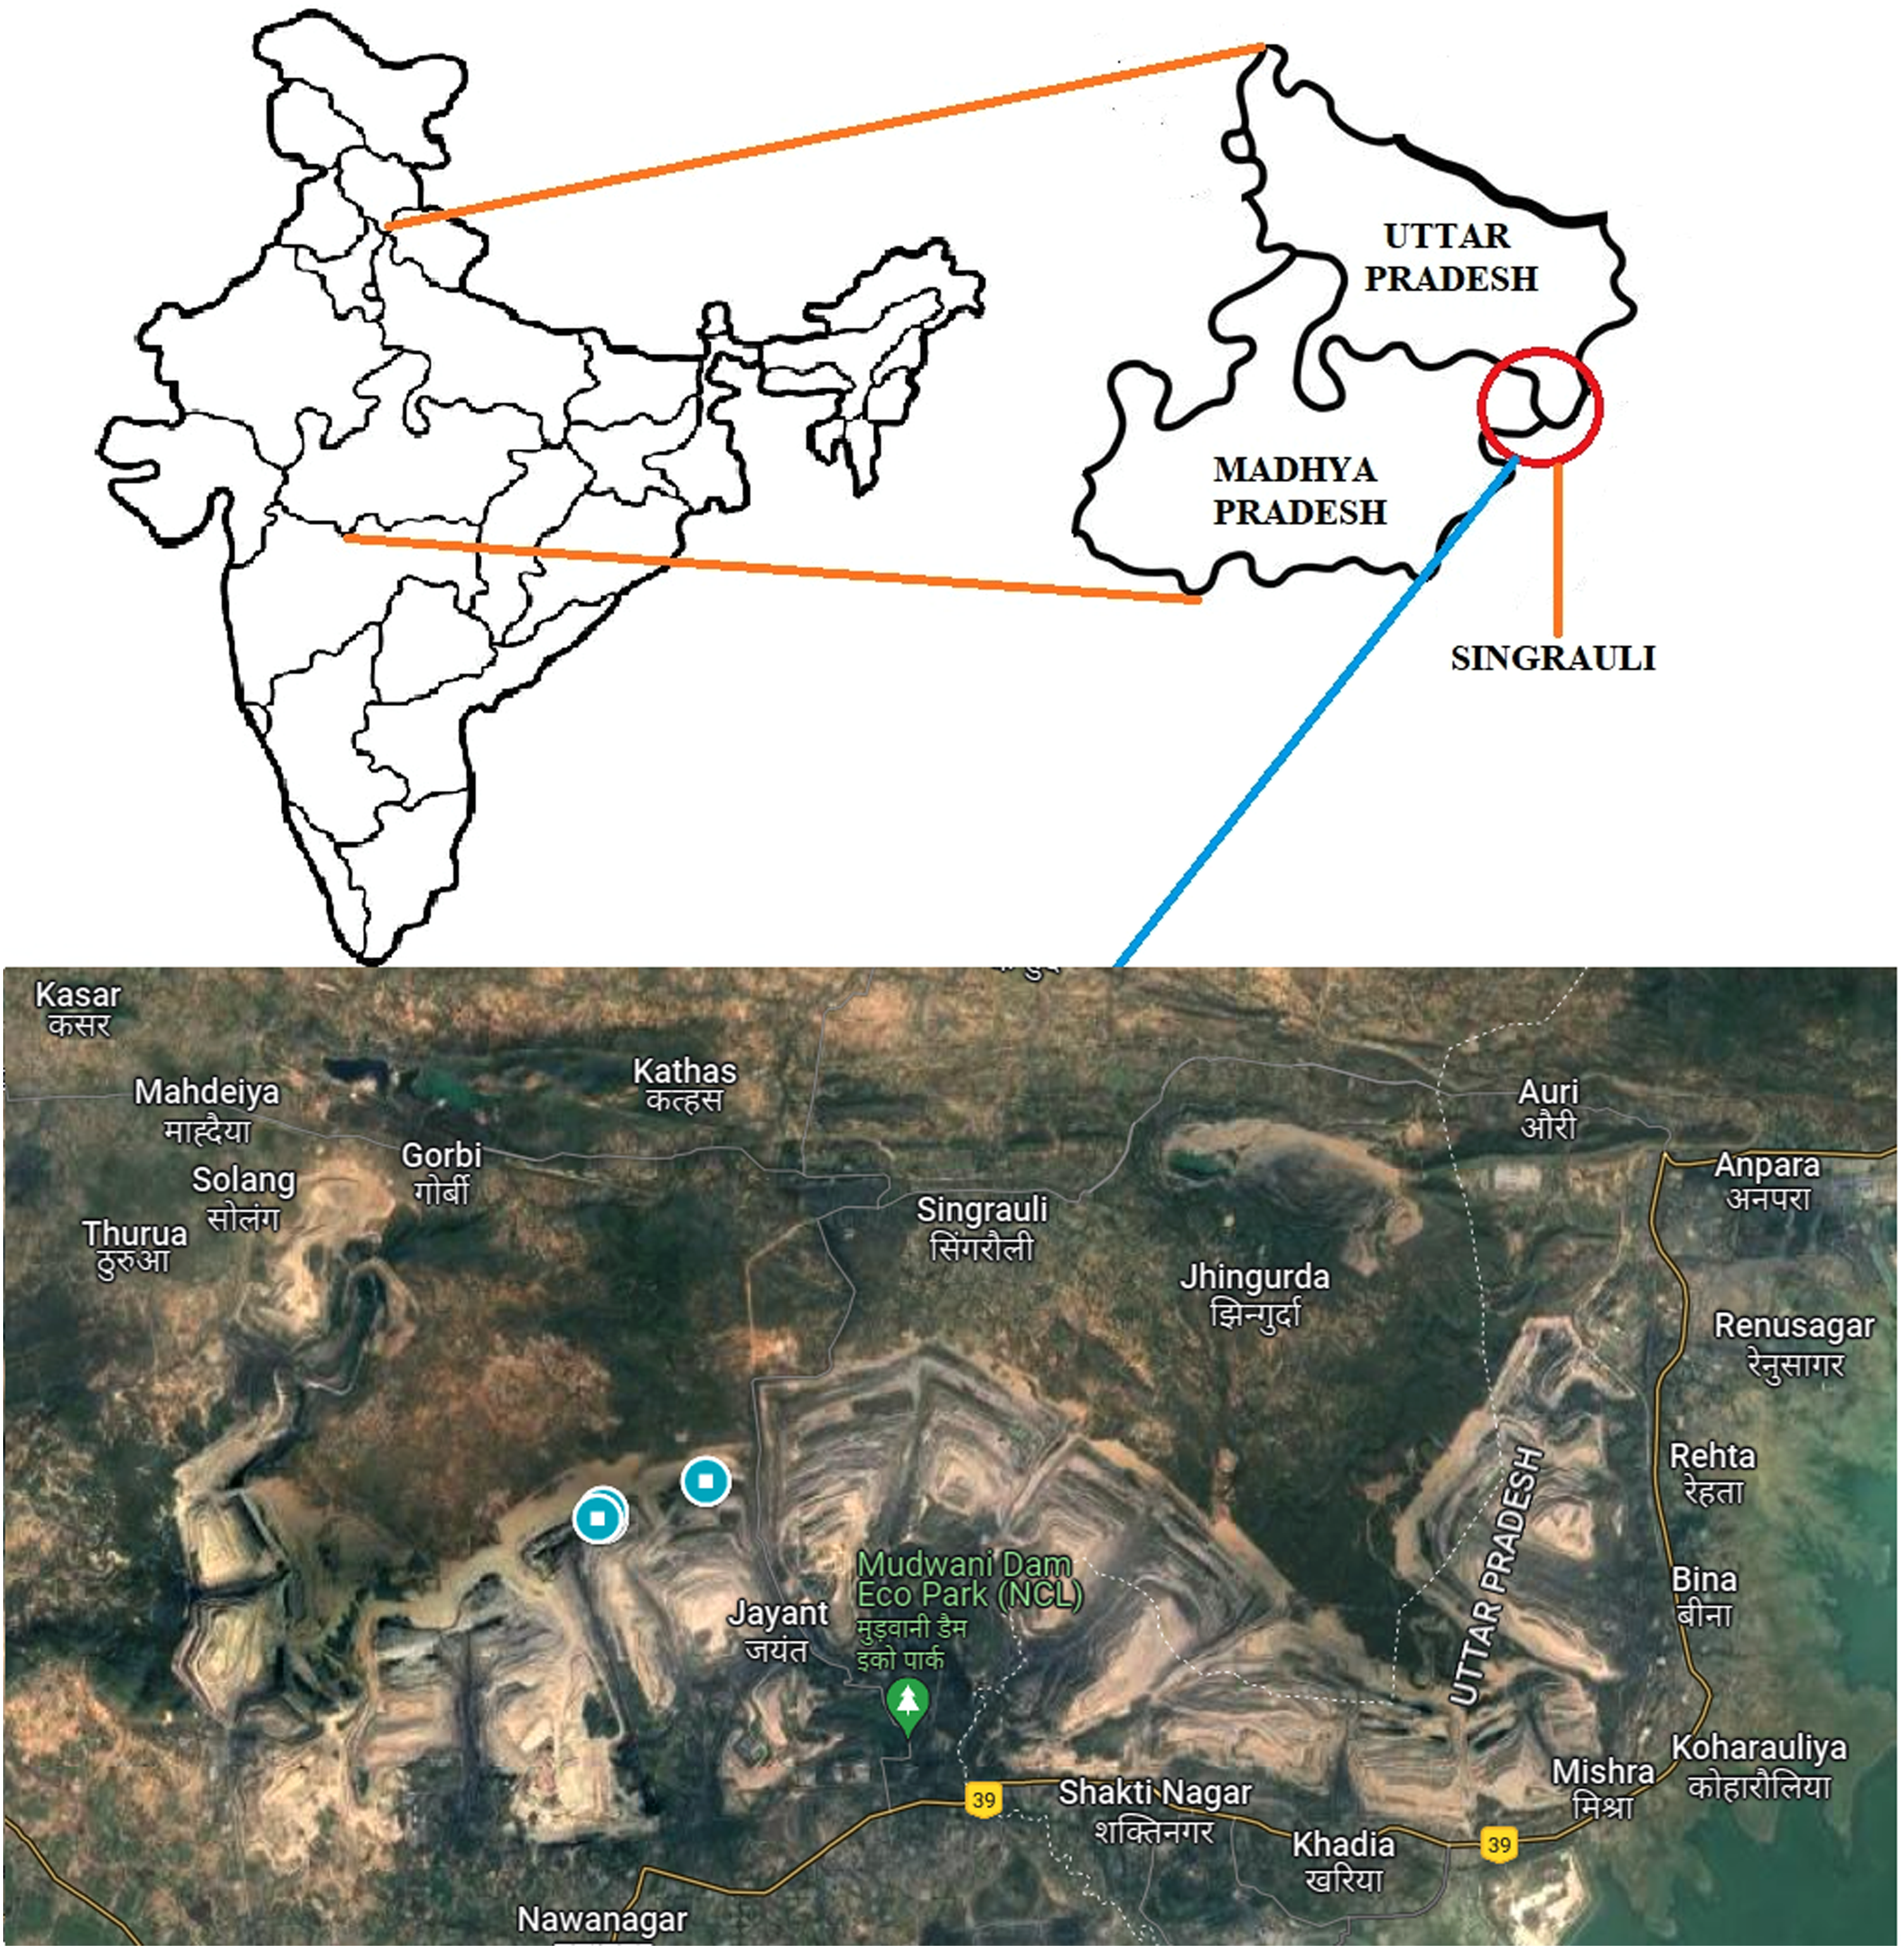
Location map of the study area.
Table 1 shows the measured and predicted friction angles by extrapolating the best-fitting curve. A logarithmic relationship has been observed between dmax and friction angle (
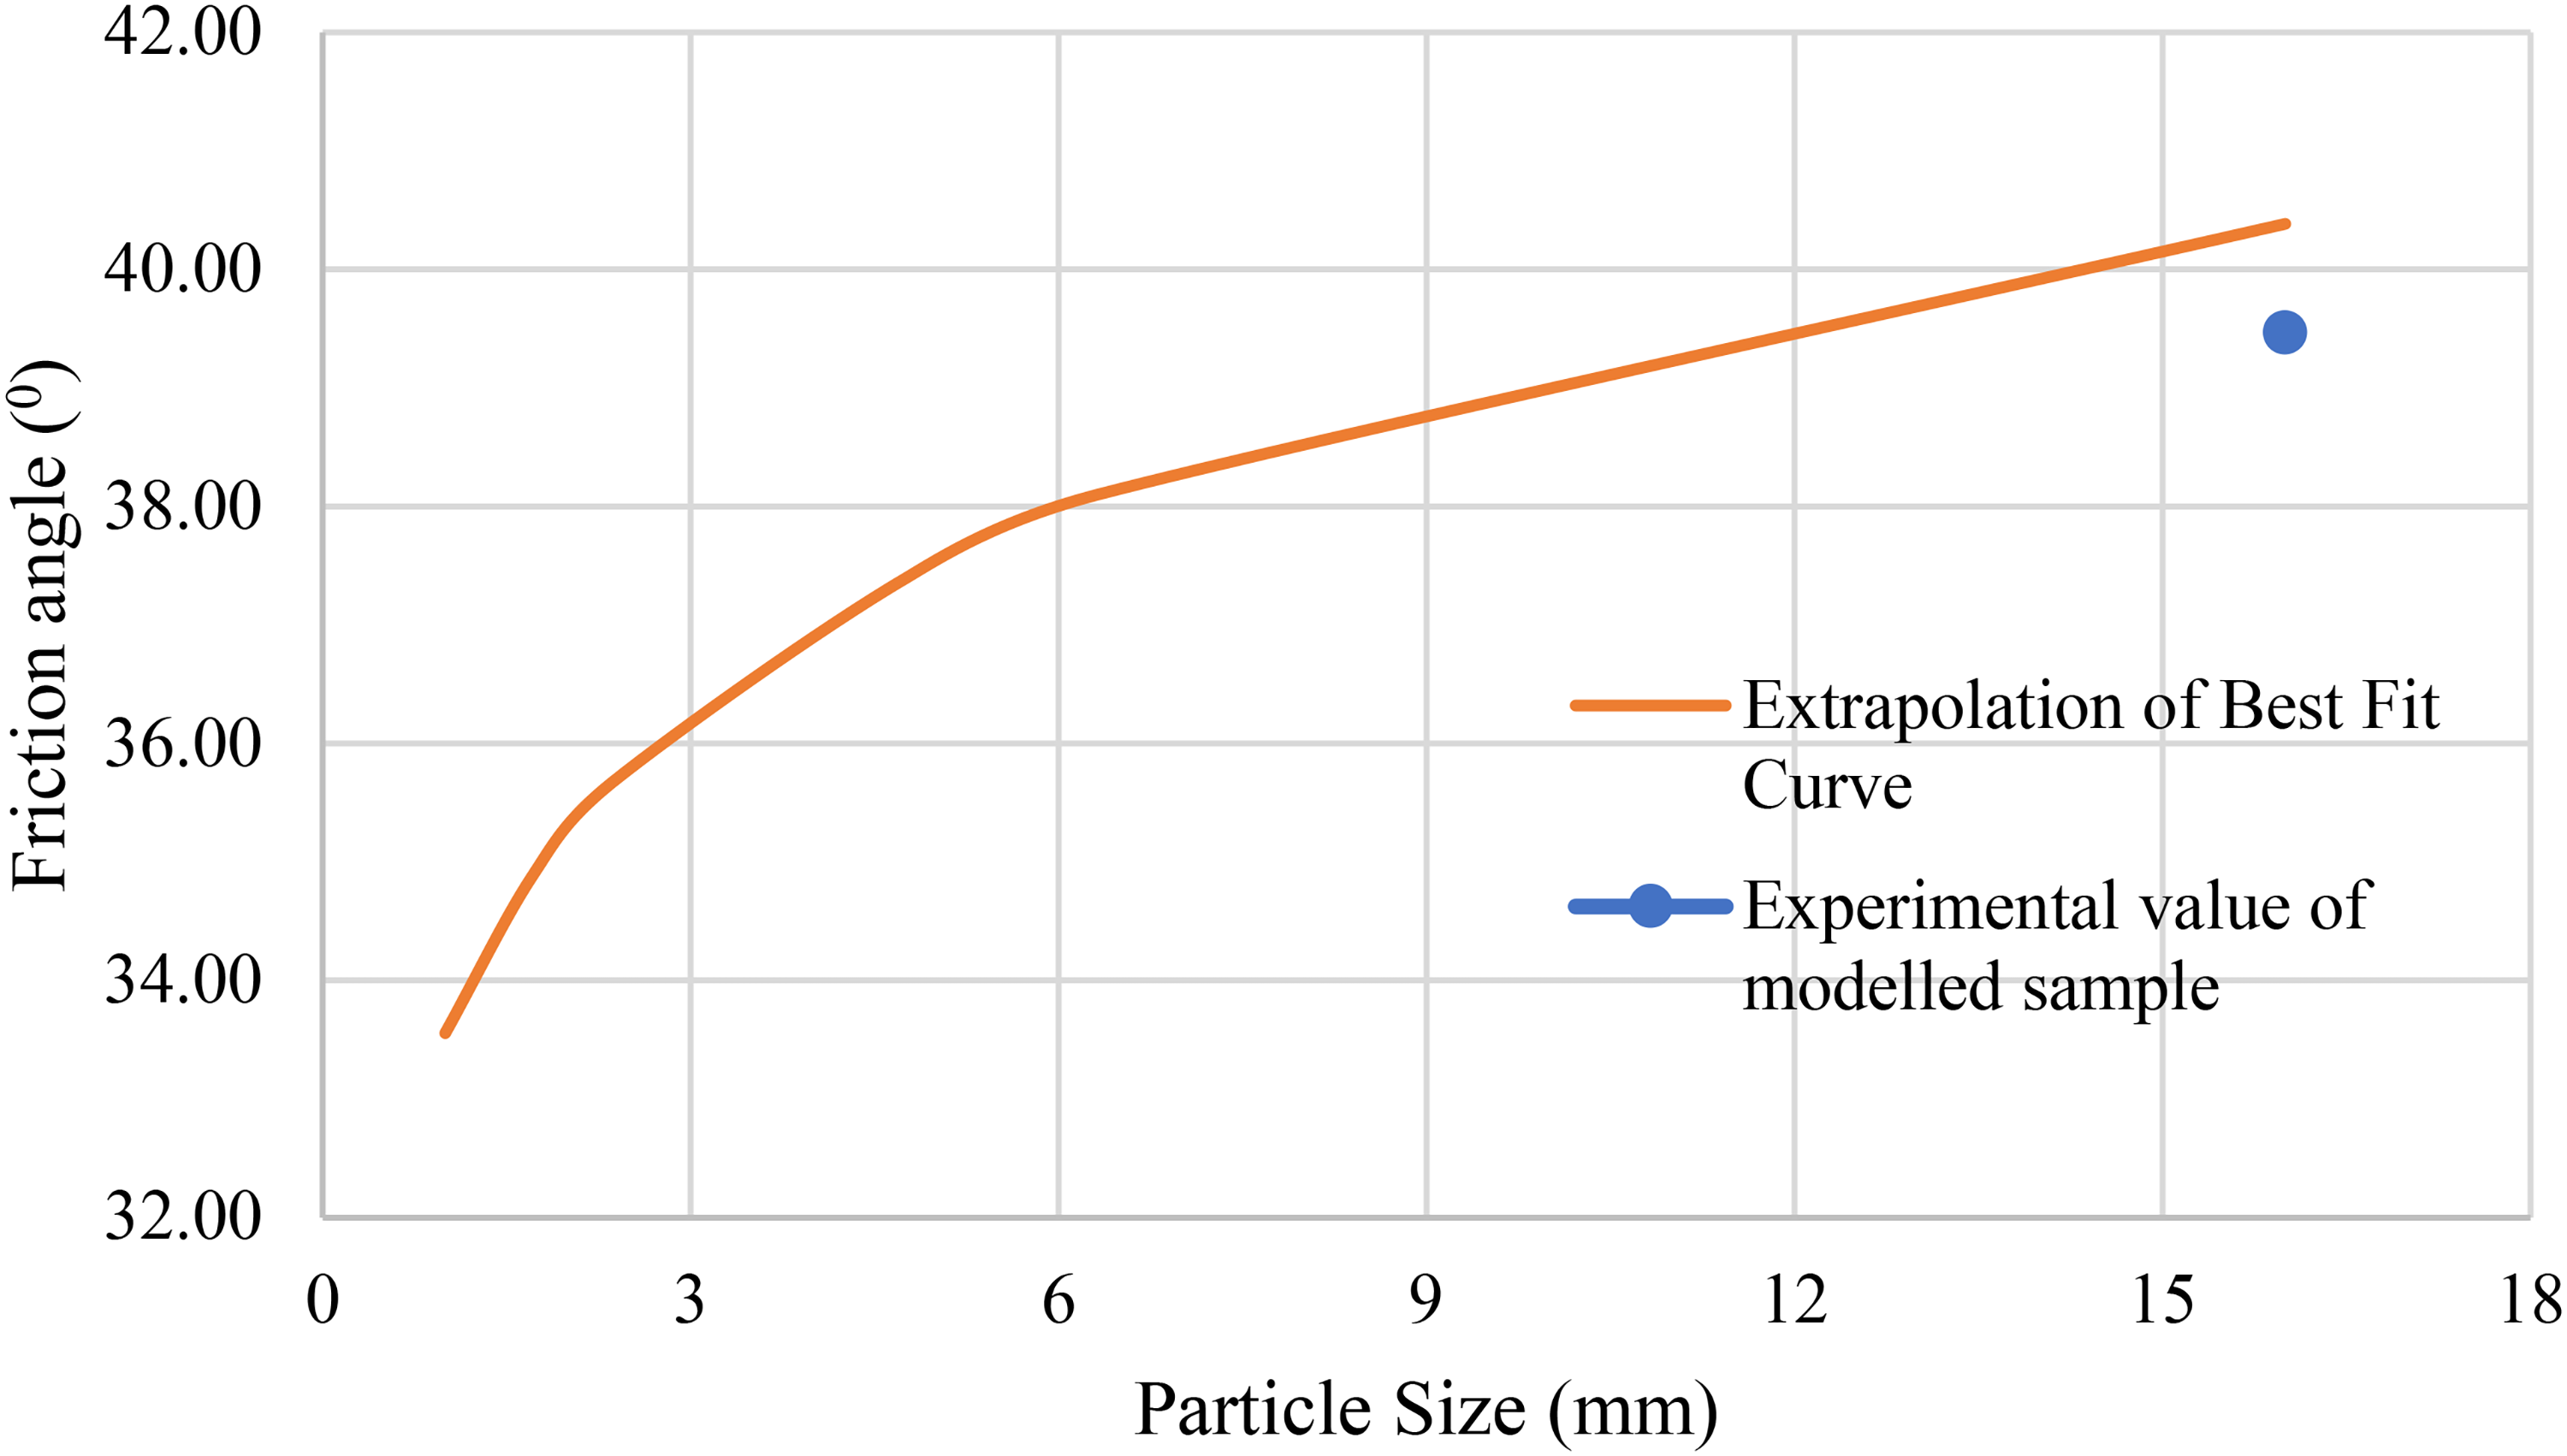
Experimental value of friction angle of the modelled sample having dmax = 16 mm along with the extrapolation of the best-fit curve.
Experimental and predicted values of friction angle.
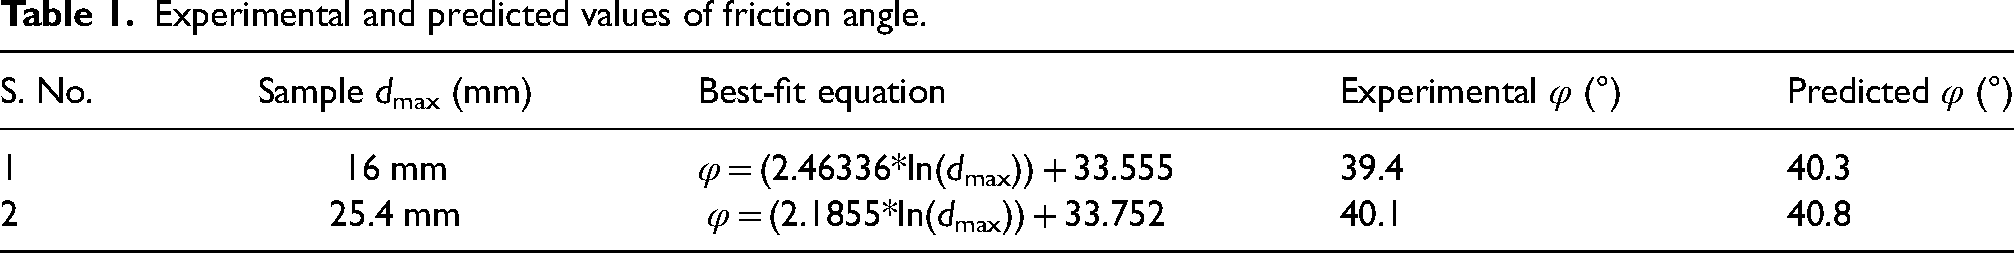
Similarly, the same procedure has been followed with the experimental friction angle values of the samples having dmax less than or equal to 16 mm. Extrapolation of the best-fit logarithmic curve predicted the friction angle (
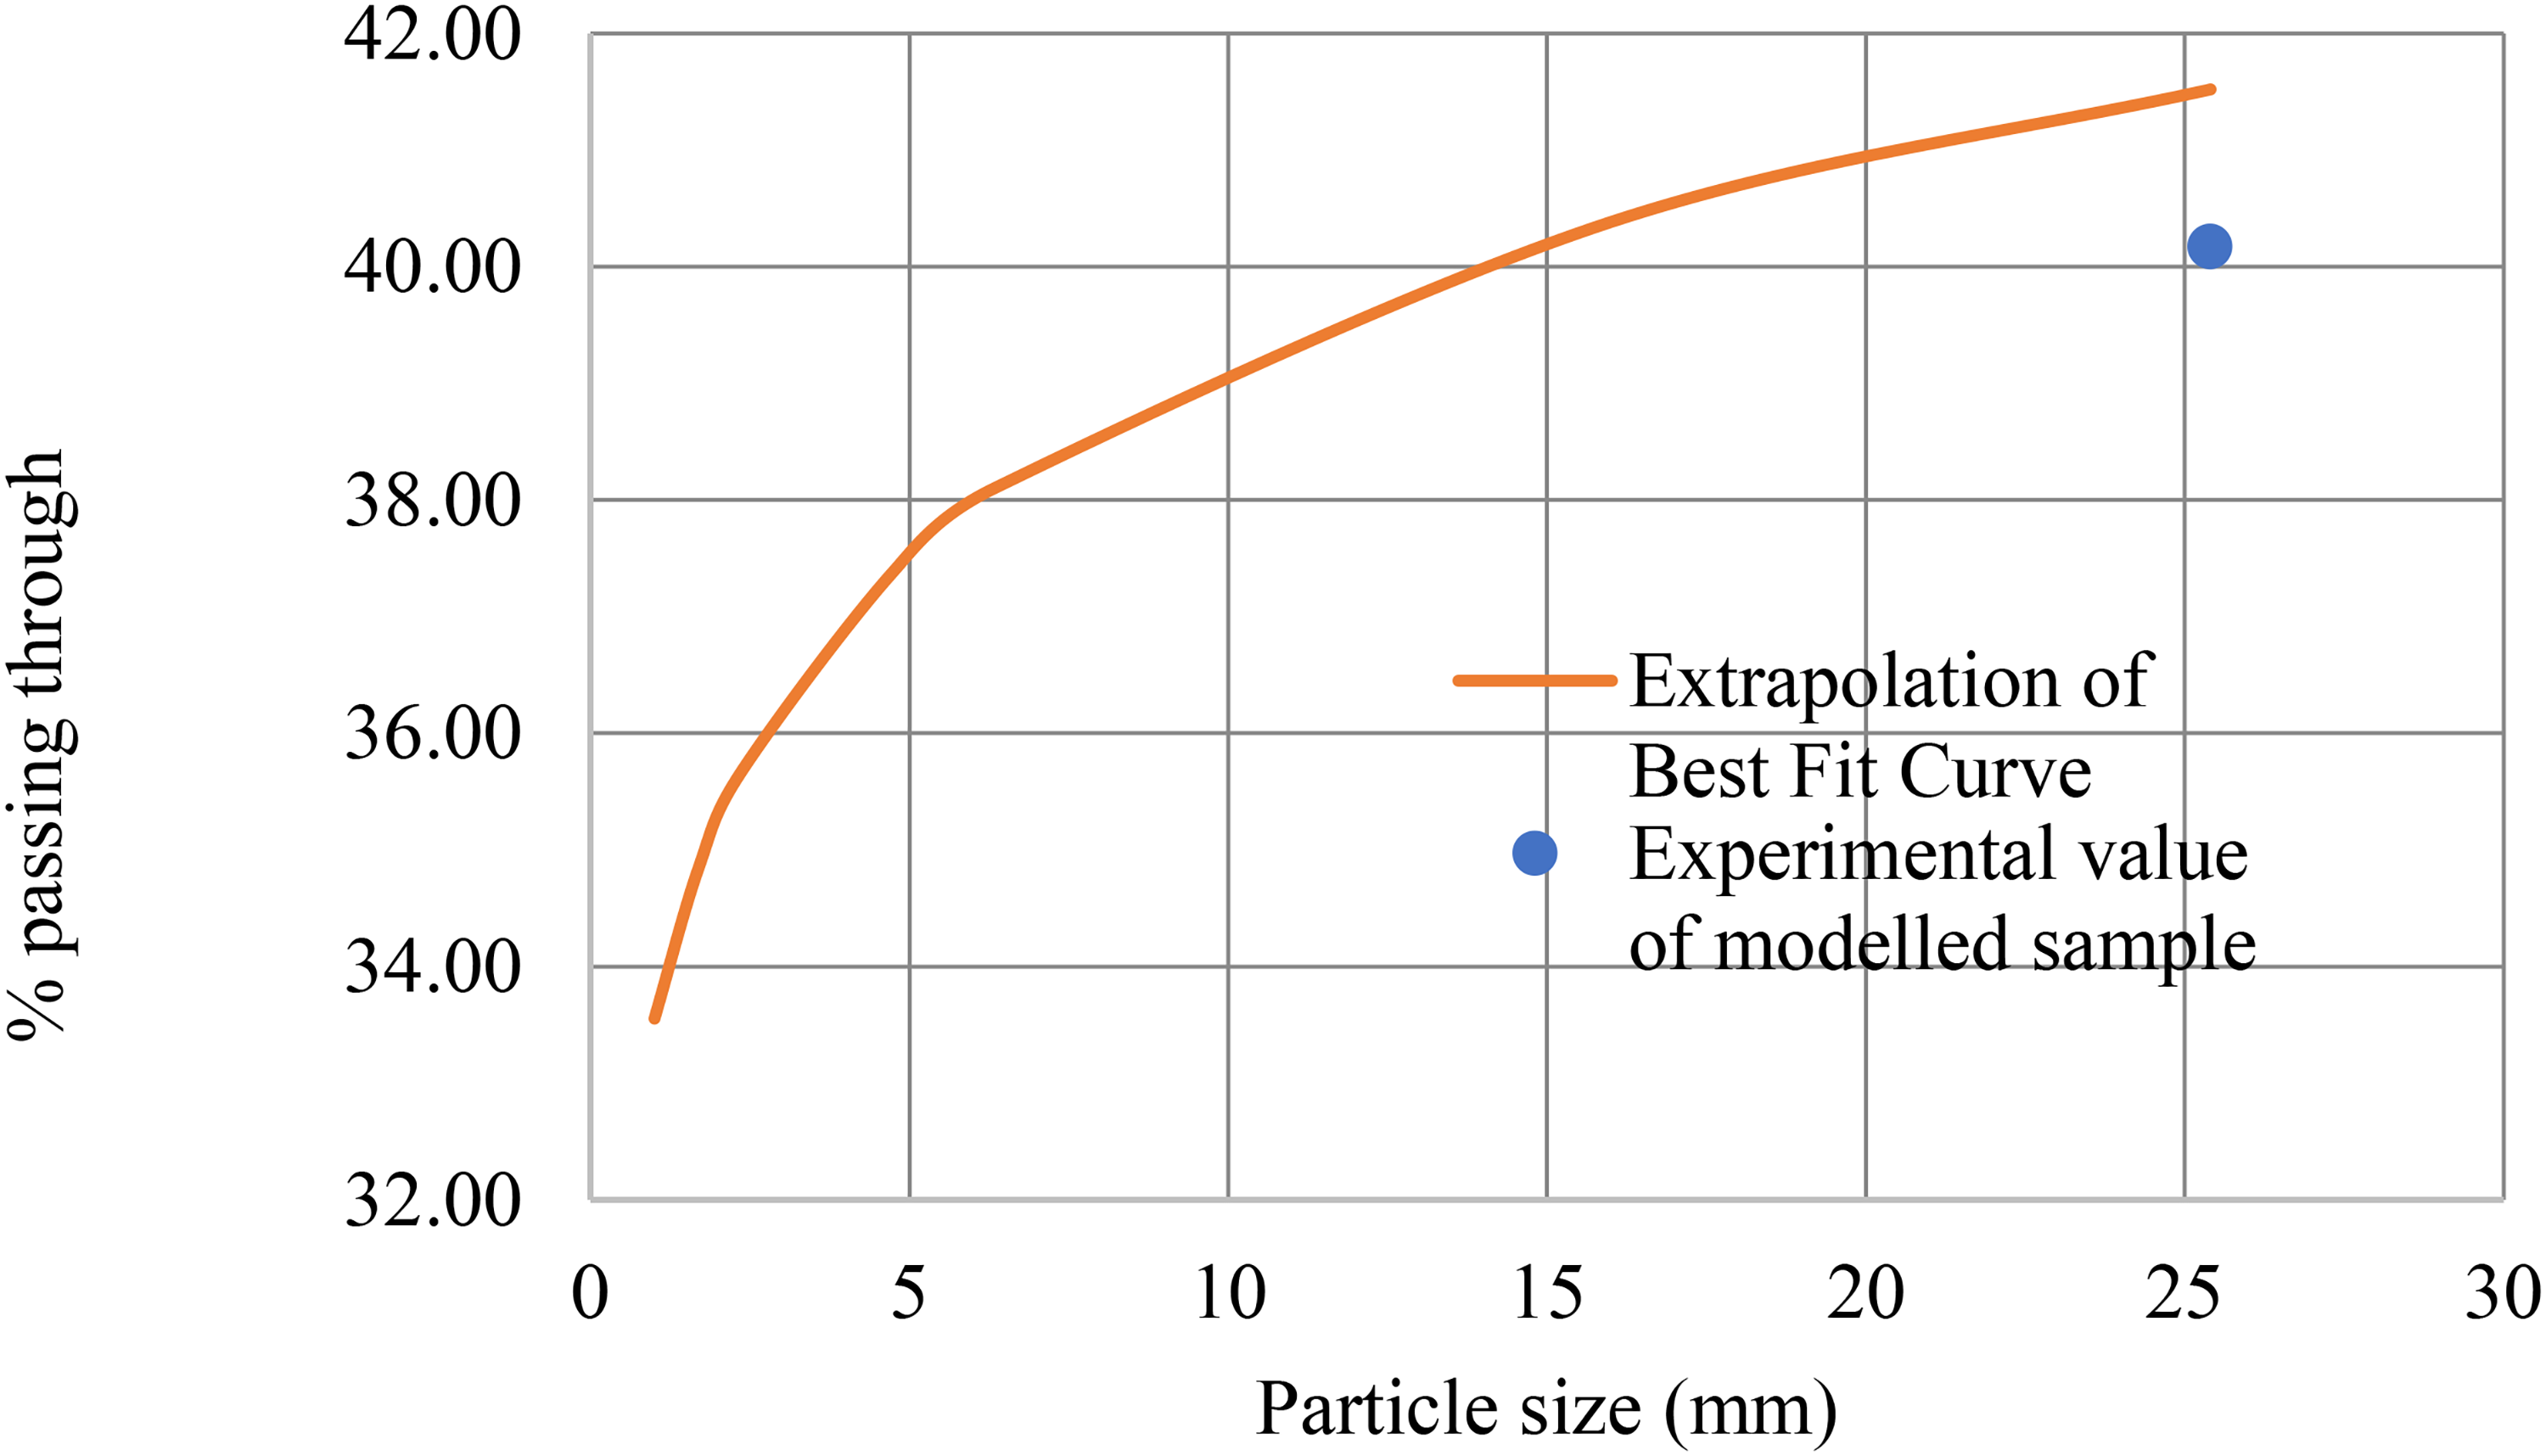
Experimental value of friction angle of the modelled sample having dmax = 25 mm along with the extrapolation of the best-fit curve.
Results
Three peak shear strength values can be achieved for each sample with three shear stress–shear displacement curves derived from direct shear testing under three normal stresses. A linear fit on the three points is used to calculate the friction angle. The results of the shear strength properties by experiment are shown in Table 2. A best-fit logarithmic relationship between dmax and friction angle (
Material properties.
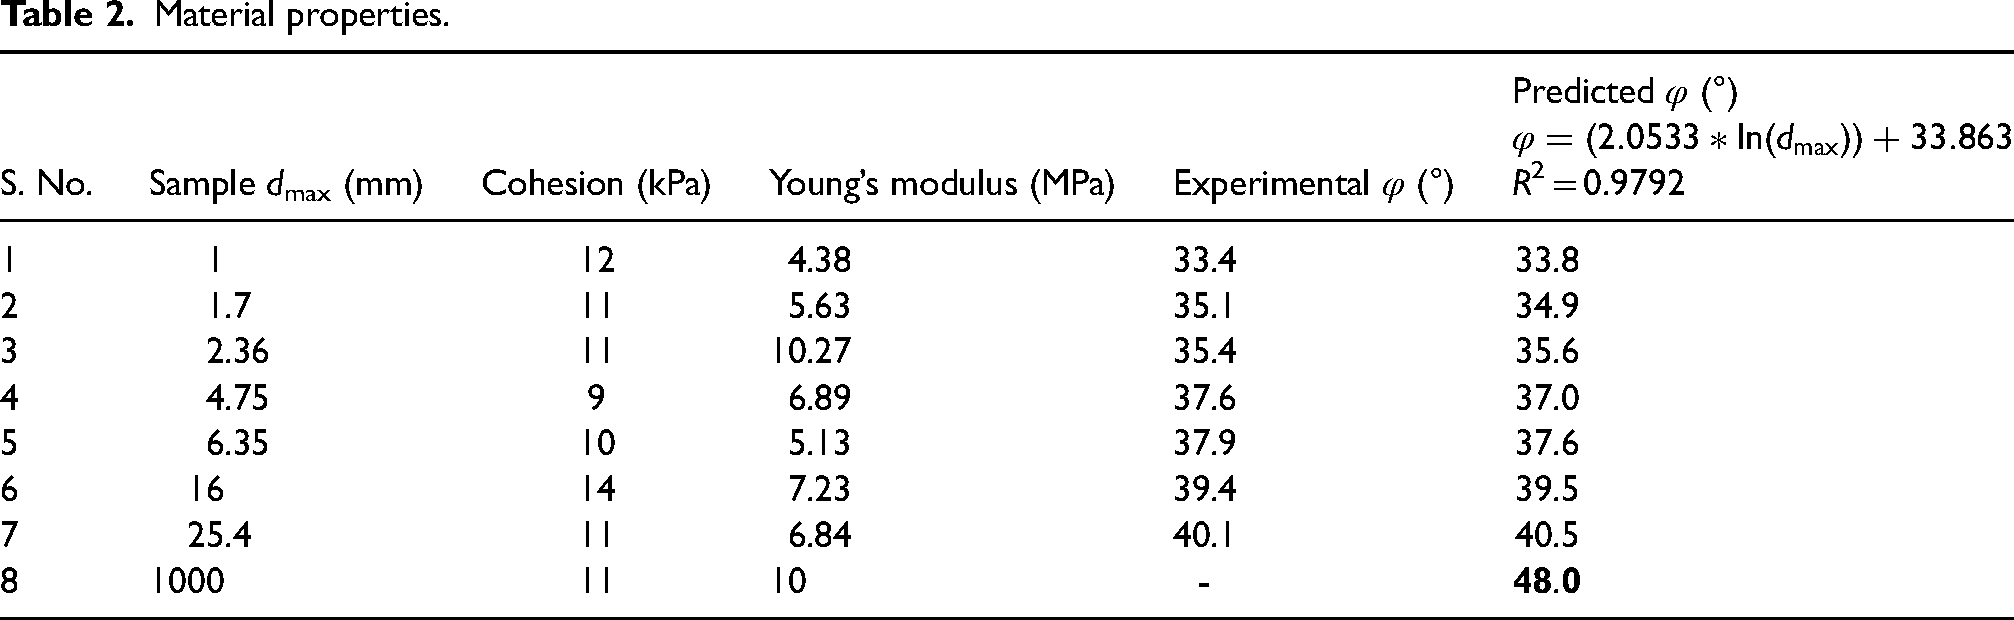
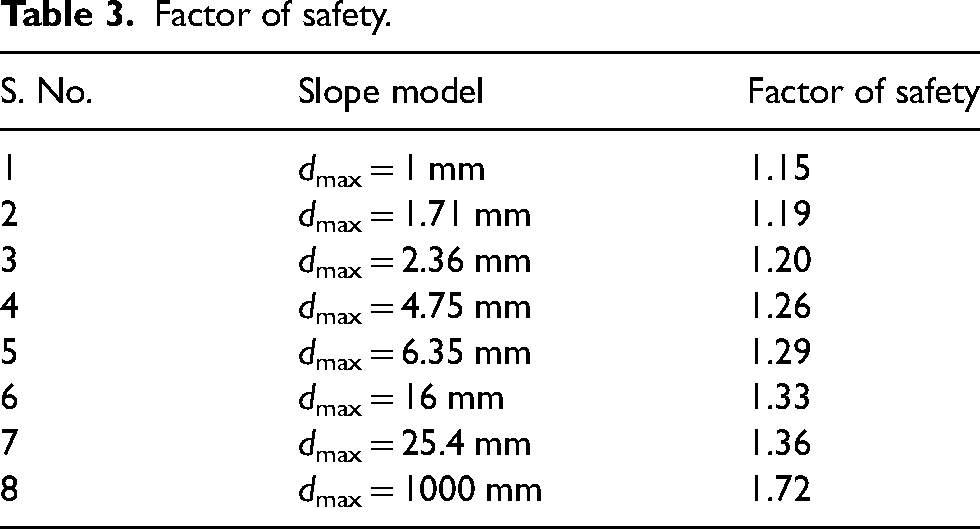
It has been observed from the literature that there is minimal mention of the particle size of the sample used to obtain the material strength parameters in the case of slope stability analysis (Kainthola et al., 2011; Kumar Behera et al., 2016; Poulsen et al., 2014; Sazid et al., 2012; Sharma and Roy, 2015; Vatanpour et al., 2014). In this study, the material properties are obtained by laboratory experiments and extrapolation of the best-fit curve considering the effect of the particle size. Numerical analysis has been carried out using the material properties obtained experimentally for slope models 1 to 7 (i.e. dmax = 1–25.4 mm), whereas predicted have been used for slope model 8 (i.e. dmax = 1000 mm). The values of the FOS of the models have been tabulated in Table 3. The probable failure plane or slip circle, along with the FOS, is shown in Figure 11.
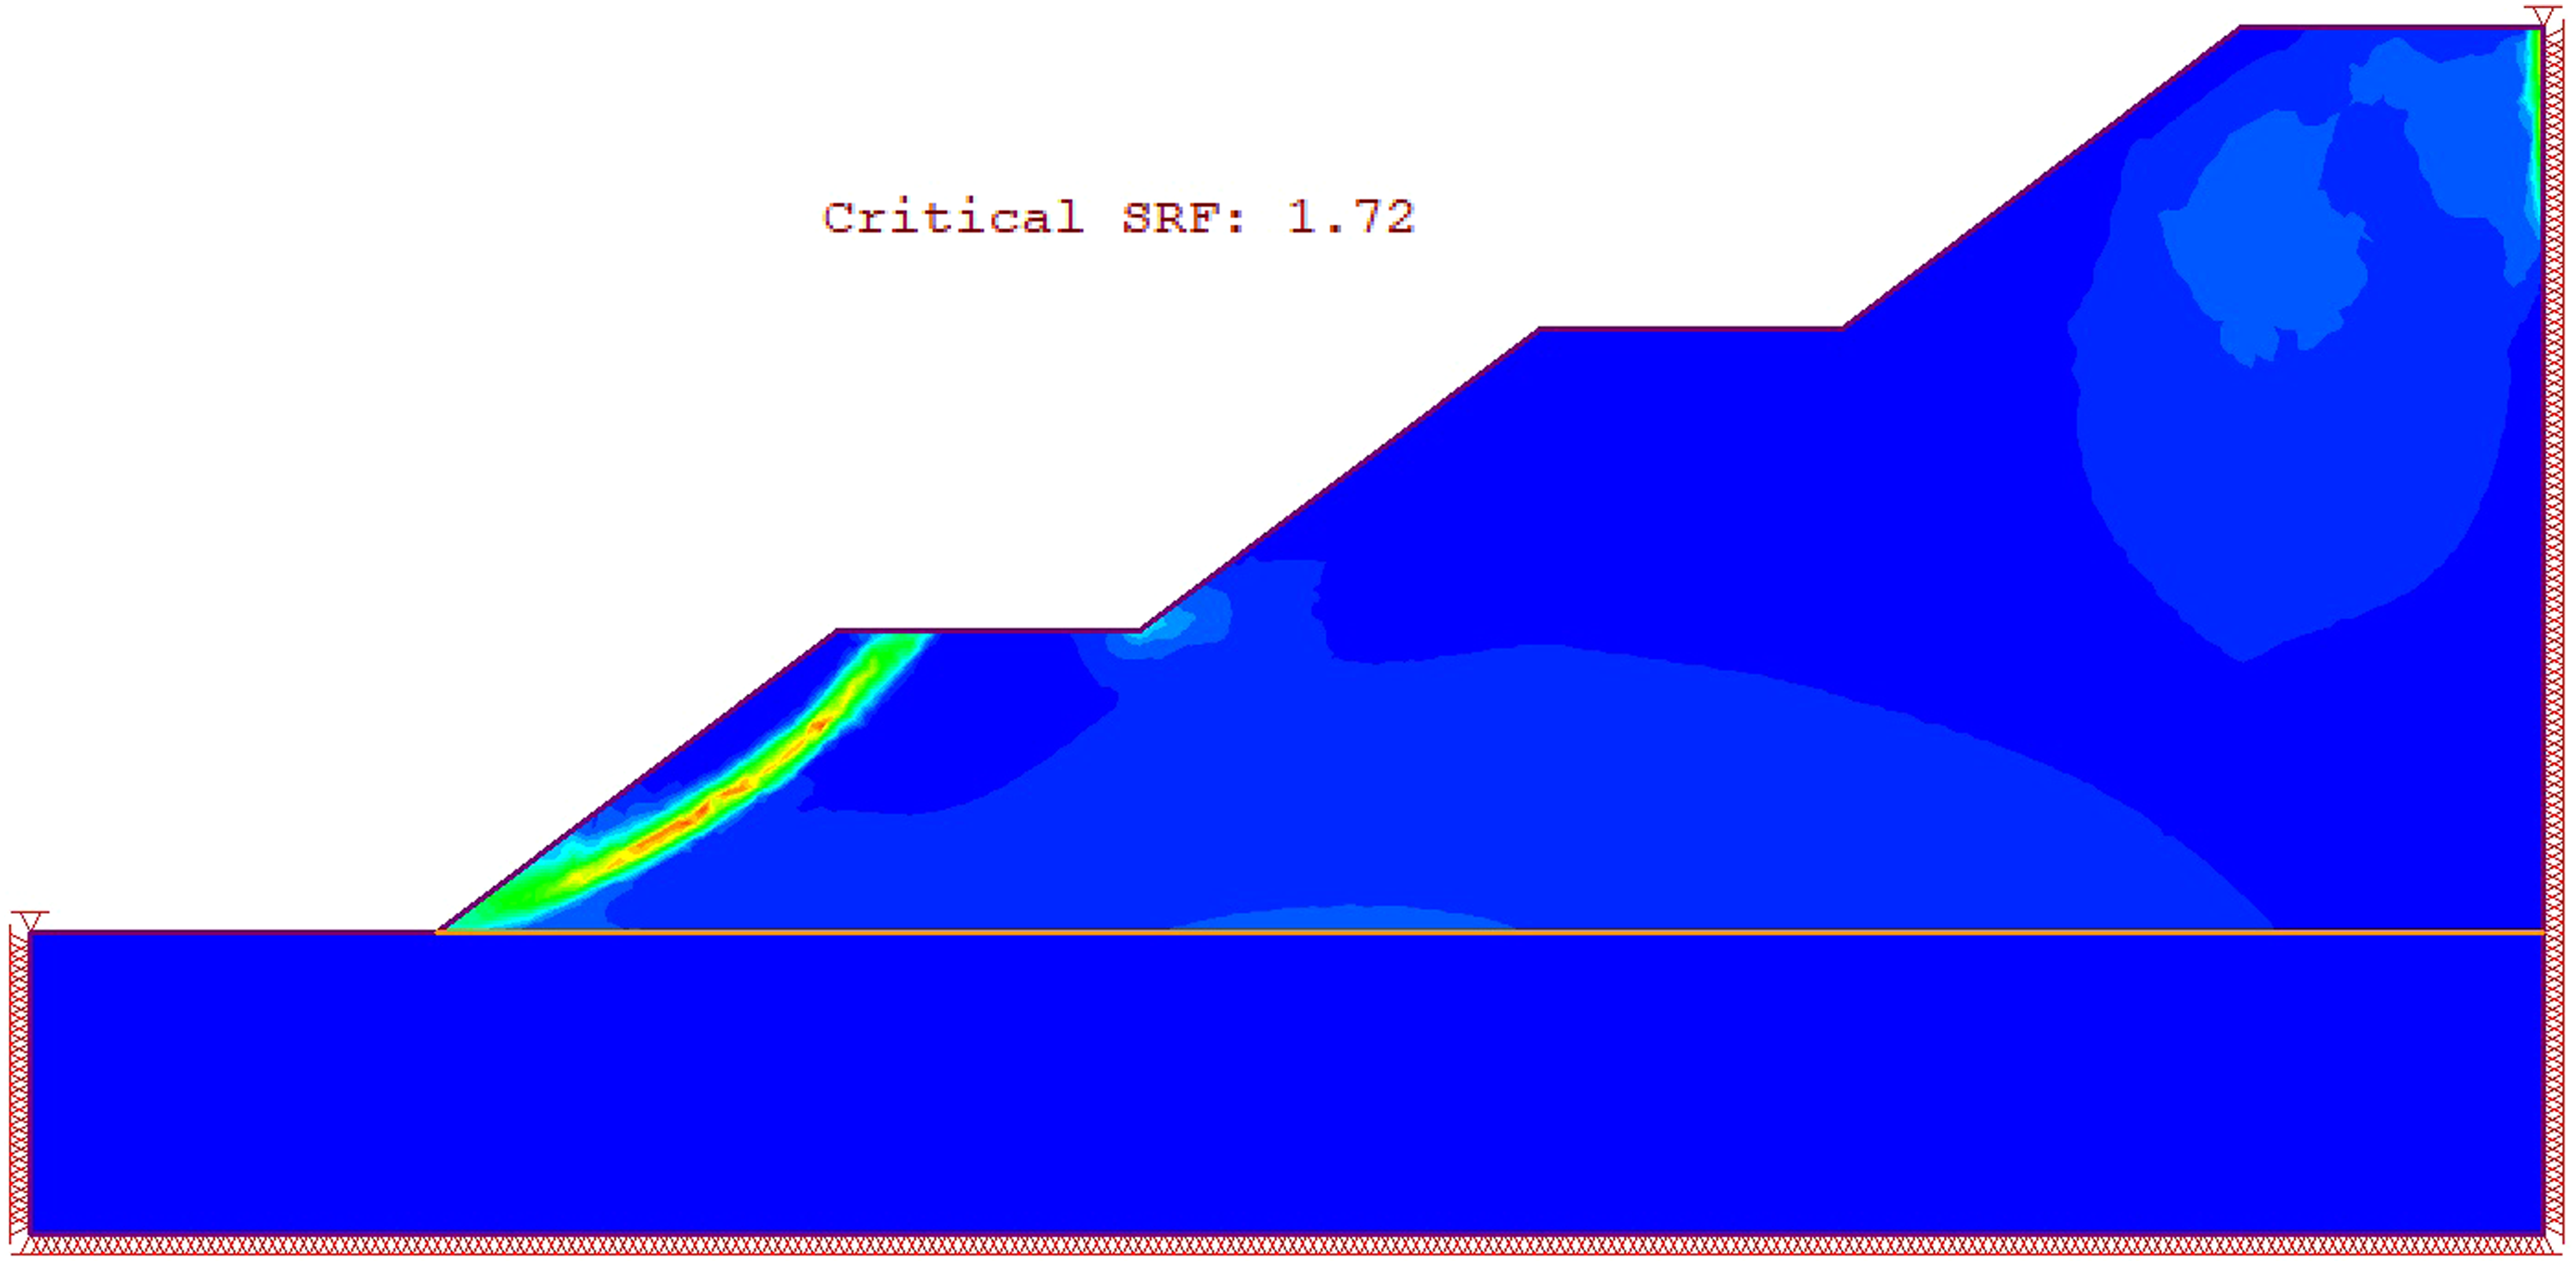
Shear strain and factor of safety of the dump slope.
Factor of safety.
Discussion
Slope stability analysis shows an increase in the FOS of the dump slope with an increase in the dmax of the dump material. It has been observed that FOS increased from 1.15 to 1.72 as the dmax increased from 1 mm to 1000 mm (Table 3). This states that the slope is stable as all the FOS values exceed one. This also shows an increasing tendency of friction angle with an increase in dmax. Usually, a decreasing tendency with an increased friction angle of blasted rock particles as dmax increases is observed. However, practical results with blasted rock particles in this observation display increased friction angles as maximum particle size increases. This difference may be due to the large confining pressures in the previous studies. Crushing of the particles during applying confining or shear stresses or both might be an associated and reported phenomenon. The friction angle decreases with increasing maximum particle size, which the breakage of rock particles has explained. The friction angle of coarse-grained materials decreases with increasing the maximum value of particle size. However, in this study, the maximum normal stress value is 147.09 kPa. There is no particle breakage or smashing during or after applying the normal and shear pressures, as evidenced by the PSDCs of the tested materials before and after shear tests in Figure 12. Rock strength size effects were excluded. Sand typically has a lower friction angle than rockfill in the same compact state because the former typically has lower dmax values than the latter, according to the trend in friction angle reported in this study.
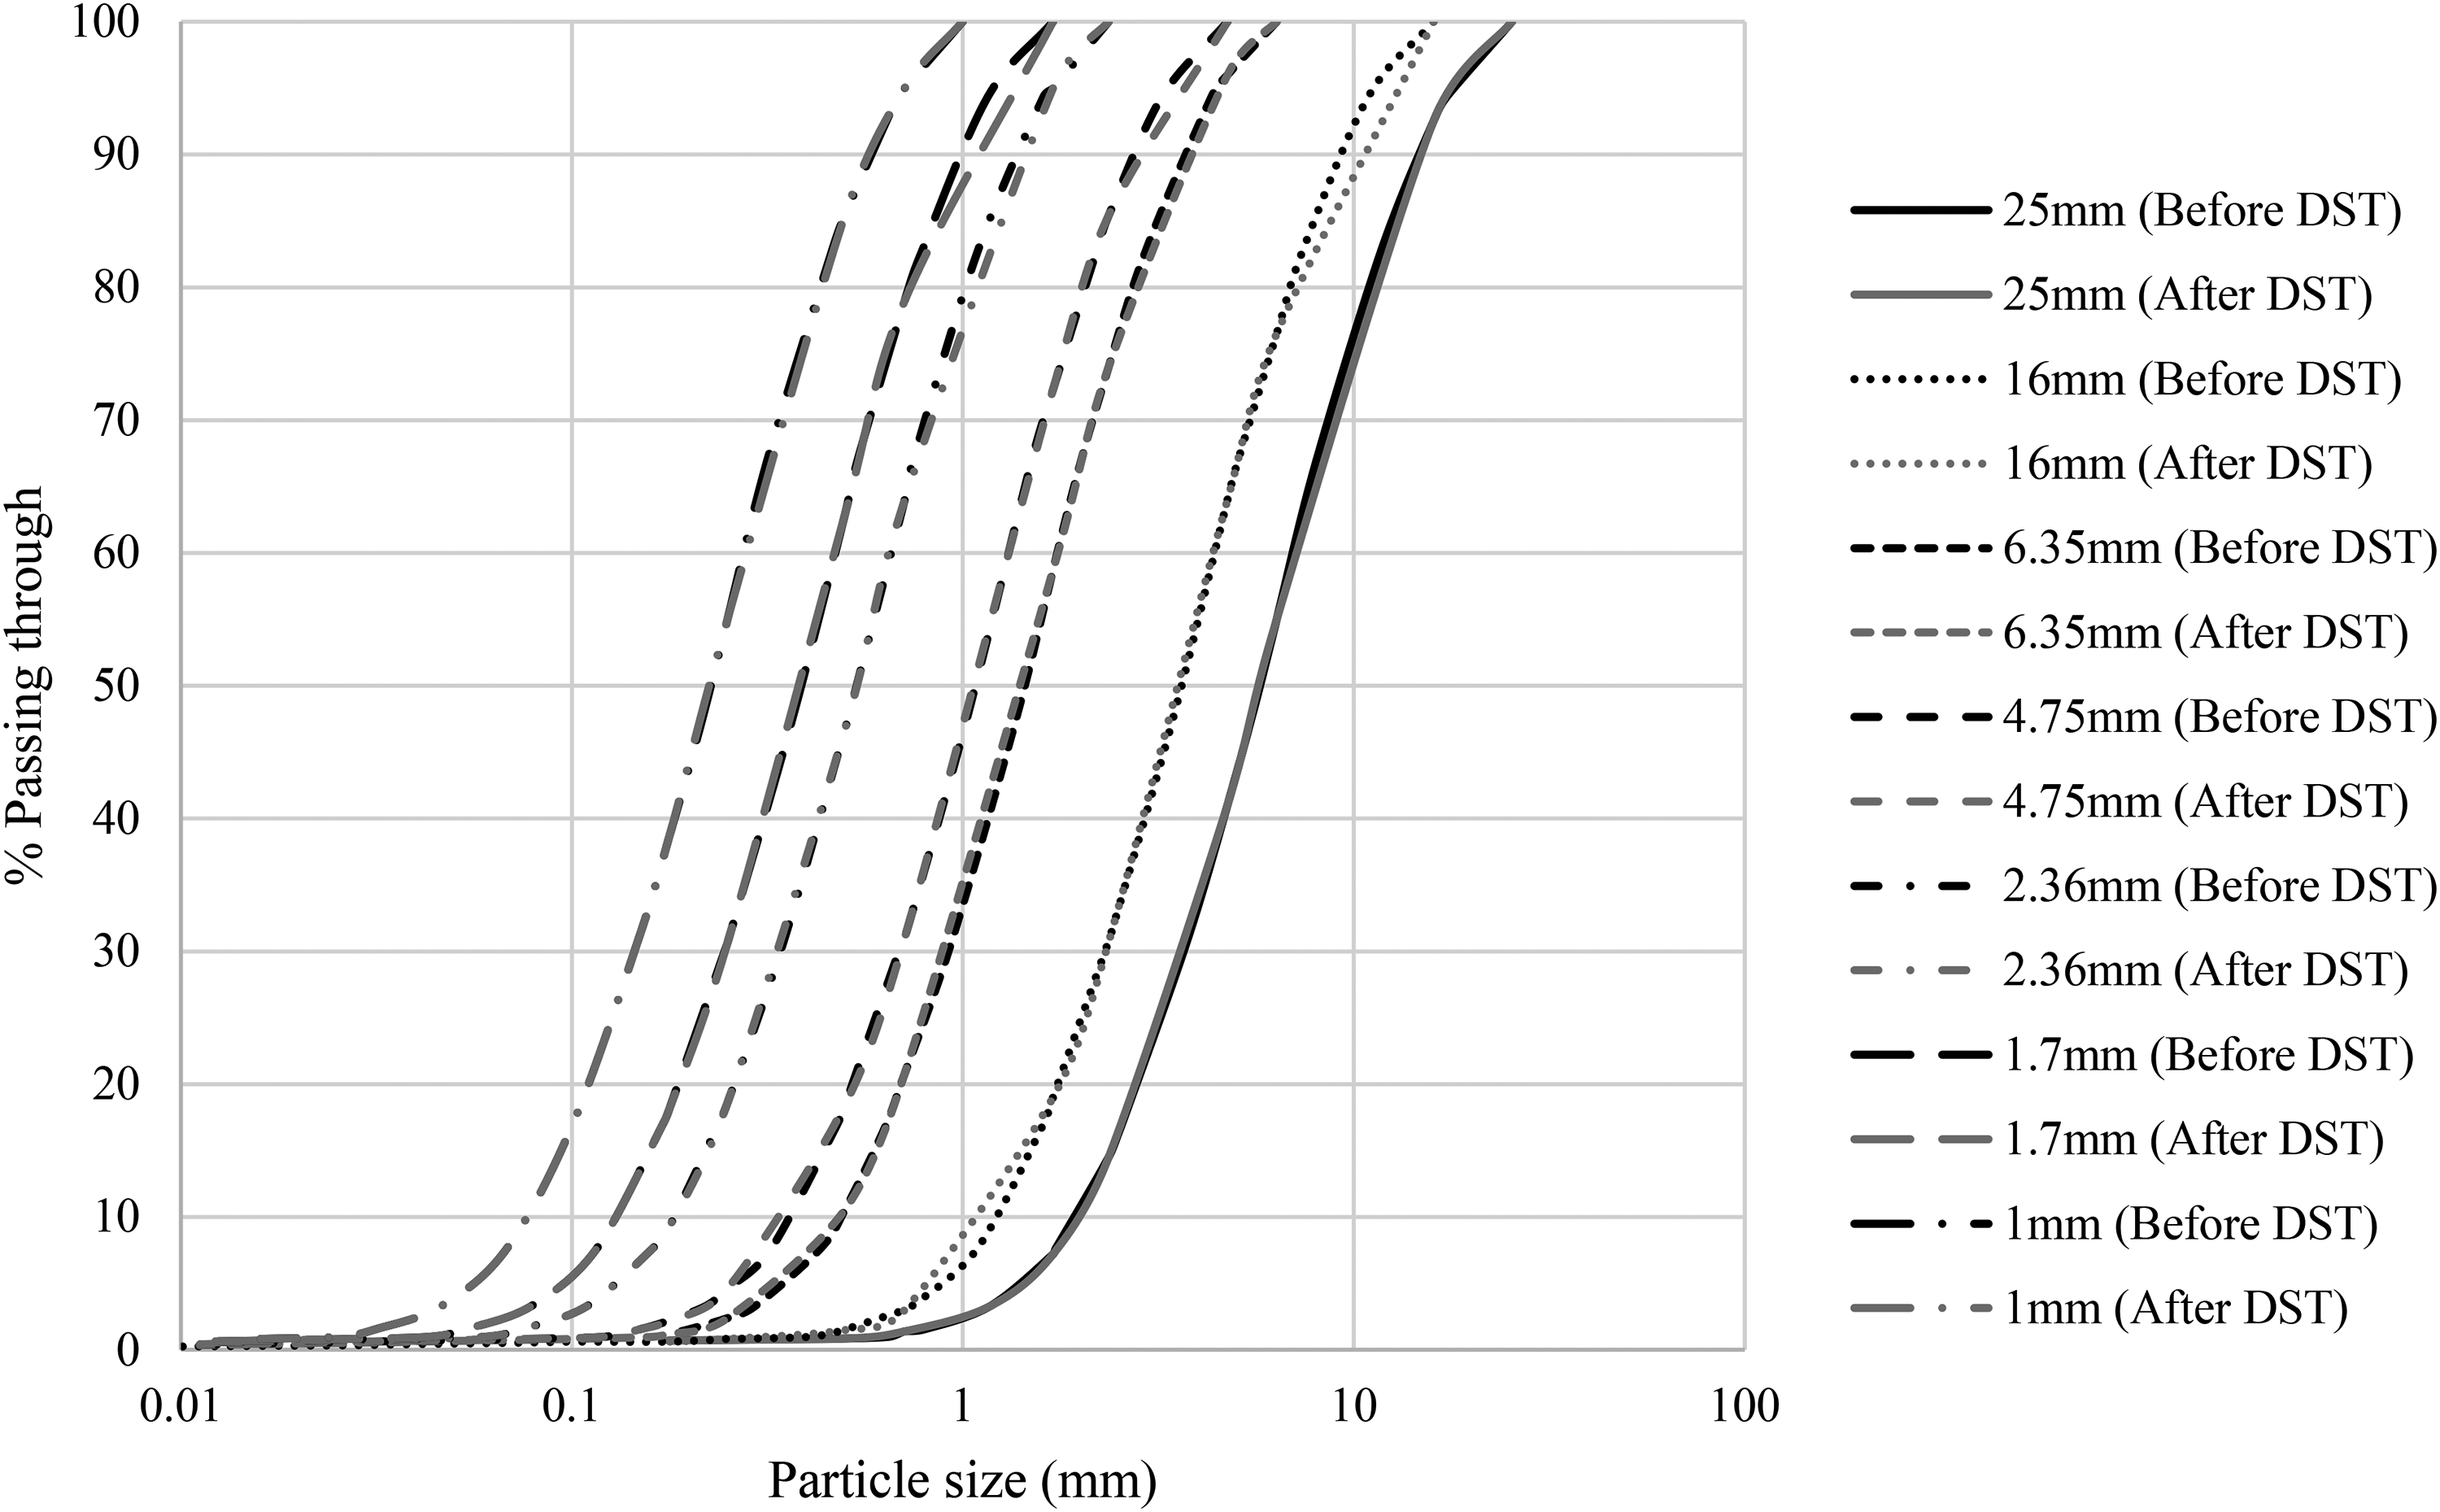
Two PSD curves before (thick lines) and after (dash lines) the direct shear tests were conducted.
Conclusions
The parallel gradation method has been used to determine the shear strength of large particles. The validity of the parallel gradation technique has been evaluated through direct shear tests using samples prepared with parallel gradation curves. The FOS has been calculated by using numerical simulation, and the following conclusions are drawn.
The friction angles of modelled samples prepared by the parallel gradation technique increase as the dmax values increase. The angle of internal friction increased from 33.4֒° to 40.1° as the dmax of the curve increased from 1 mm to 25.4 mm. The FOS of the dump slope increases with an increase in the dmax of the dump material. It is increased from 1.15 to 1.72 as the dmax increased from 1 mm to 1000 mm. The varying particle size affects the stability of the dump slope. It is observed that there is a decrement in shear stress with an increase in the maximum particle size.
Footnotes
Declaration of conflicting interests
The authors declared no potential conflicts of interest with respect to the research, authorship and/or publication of this article.
Funding
The authors received no financial support for the research, authorship and/or publication of this article.