
Abstract
Coal Fly ash (CFA) is an industrial waste but it contains packets of values such as alumina and rare earth elements (REEs) which can be extracted for use. The aluminosilicate phase constitutes a barrier to extraction of REEs from CFA during acid leaching. As a preliminary preparation for extraction of the entrapped REEs, this study examines a comparative two-stage process for low temperature extraction of silica conducted on Nigerian CFA samples. Samples were roasted with NaOH pellets at 100, 200 and 300 oC. The roasted products were subjected to room temperature leaching with the use of NaOH solution for the extraction of silica. Optimum silica extractions of 16.31%, 16.81% and 17.84% were obtained at 6 M, 90minutes, 30 mL/g; 6 M, 90minutes, 30 mL/g; and 3 M, 60minutes, 20 mL/g conditions of base conc, time and liquid-solid ratio for samples roasted at 100, 200 and 300°C respectively. A progressive quantitative silica extraction was observed with temperatures.
Introduction
The seventeen array of the lanthanides on the periodic table identified as rare earth elements (REEs) form essential components in clean energy technologies including electric vehicle battery, wind turbines and solar panels. 1 In view of the depleting virgin REE resources vis-a-vis the demand for the elements for clean tech industrial applications, there is now a growing interest in coal fly ash as a potential alternative source. Coal fly ash is a by-product of coal combustion process. It is a fine-grained, powdery particulate material carried off with flue gases during coal combustion and has several notable advantages for REE recovery; its enrichment in REE minerals (monazite, xenotime, zircon and CaO mineral phases), its relatively low radioactive content and its availability in fine particle sizes which supports hydrometallurgical processes.2,3 In addition, the use of coal fly ash as a resource for REEs minimizes the cost of prospecting, exploration, blasting, haulage and the general impact of mining REEs from primary sources on the environment. 4 However, REE contents in coal fly ash (CFA) are often in the range 500 to 3000 ppm and the extraction is susceptible to the challenges of inefficiency and sub-optimal recovery.
Recent study on rare earth contents in some Nigerian coal fly ashes by the authors indicates averages of 941–2145 ppm with dominant presence of cerium, yttrium, neodymium and lanthanum. It is therefore necessary to develop cost effective REEs extraction technologies since the country is endowed with an estimated 639 million metric tons of coal deposits.
However, the complexity and variability in composition of CFA are the major factor responsible for complications in REE extraction process. To this end, the presence of various interfering substances and the physical nature of CFA requires specialized recovery processes to maximize REE extraction. Some of the previous recovery process required the direct use of strong acids which are not without the associated complications of waste management, high energy and reagent costs5,6). This has led to a retinue of pre-treatment processes with base to enable dissolution of the REE-trapping aluminosilicate phase in CFA for maximum extraction during acid leaching while minimizing energy costs and carbon footprints.7–10
The current study proposes a two-stage pre-acid leaching process consisting of fly ash roasting with NaOH pellets (ratio 1:5) and subsequent extraction of silica (desilication) and alumina via room temperature leaching with NaOH solution. Previous studies on desilication by 11 reported a 10% increase in extraction over roasting temperature of 250 °C to 800 °C. However, same study reported the occurrence of caking at a fly ash pre-treatment temperature of 900 °C. In addition, these high temperatures have accompanying high energy consumption and carbon footprints. It is against this background that the current study made the choice of a lower roasting temperature range (100 to 300 degrees) as well as 1:5 roasting additive to fly ash ratio. The choice of the mentioned ratio is predicated on the extensive work on effect of roasting additive ratio on REEs extraction as reported by. 12 The said study noted that there was no significant change in extraction when additive ratio was varied between 1:1 and 1:6, hence our choice of working with 1:5 during the roasting stage is justified. In the long run, the pre-acid leaching process may be considered cost-effective for two reasons; one, several folds increase in concentration of acid would be needed for subsequent extraction of REEs if left untreated bearing in mind that more material is needed to prepare reagents of higher molarity; two, the inevitable higher concentration of impurity ions associated with direct leaching with acid could reduce the market value of the end product. The choice of same reagent for the sequence roasting and room temperature desilication makes this work unique and it brings to bear a convoy of advantages namely; (i) increase in efficiency since the use of same reagent could streamline process of extraction thereby minimizing the energy and time requirements for each stage, (ii) improvement in selectivity in elements of interests thereby minimizing the uptake of unwanted materials (iii) reduction in overall costs of regents while also minimizing the costs of waste generation and disposal and (iv) reduction in reagent incompatibility at different stages. It is against this background this study compares the findings of the quantitative extraction of silica and alumina from the fly ash samples treated at 100, 200 and 300°C as well as the mineralogical and morphological changes associated with the oven treatments, all of which aimed at selecting the sample with highest desilication for subsequent acid leaching to be reported in part B of this work.
Materials and methodology
Materials
Fly ash samples generated from coals mined from major coal fields in Benue and Kogi States in Nigeria were used in the study. The samples were randomly sourced from a coal fired power plant operated by a manufacturing company in Jamatta near Lokoja, Kogi State, Nigeria with average particle size ranging from 10–30microns.
Mineralogical, morphological and ICP-OES analyses
To study the crystal structure and atomic spacing of the samples, the X-ray Diffraction (XRD) technique was used. X-ray diffraction is based on constructive interference of monochromatic X-rays and a crystalline sample. Patterns were recorded by a PANalytical X´Pert Pro X-ray diffraction equipment using monochromatic CuKα1 radiation (λ = 1.5406 Å) at 45 kV and 40 mA. Diffractograms were collected in the 2θ range 6–90° at 0.017° intervals and with scan step time of 60 s. The crystalline phases and structures were analyzed by HighScore Plus software (Version 4.0, PANalytical B. V., Almelo, The Netherlands).
In understanding the surface characteristics (morphology) of the fly ash samples at each stage, they were analyzed using a JEOL JSM-7900F Schottky Field Emission (FE) Scanning Electron Microscope (SEM). The elemental mapping was performed using energy dispersive X-ray spectrometer (EDS) and AZtec software of Oxford Instruments. EDS provided localized information about small areas in samples as well as their quantitative and qualitative information. The combination of SEM with EDS was to make provision for imaging and elemental analyses simultaneously. The analysis was done at 15 kV and working distance around 10 mm.
Silica and alumina compositions of samples after reactions were determined with the use of the Inductively Coupled Plasma Optical Emission Spectroscopy (ICP-OES; Agilent 5110). The flux used for the fusion is di-Lithium-tetraborate (Spectromelt A-10, EM Science, Gibbstown, NJ). Reagents are HNO3 69–70% (Fisher ACS plus grade), HF 48–52% (Baker ACS reagent grade), HClO4 67–71% (Fisher Trace Metal Grade), and H2O2 (Baker ACS Reagent). The HF was further purified before use by sub-boiling teflon-still distillation. Deionized water produced from a Nanopure analytical grade water system (Barnstead/Thermolyne) was used. Powdered samples were mixed with an equal amount of lithium tetraborate flux (typically 2 g), placed in a carbon crucible and fused at 1000° C in a muffle furnace for 30 min. After cooling, the resultant fusion bead was briefly ground in a carbon-steel ring mill and a 250 mg portion is weighed into a 30 ml, screw-top Teflon PFA vial for dissolution. The acid dissolution consists of a first evaporation with HNO3 (2 ml), HF (6 ml), and HClO4 (2 mL) at 110° C. After evaporating to dryness, the sample was wetted and the sides of the vial rinsed with a small amount of water before a second evaporation with HClO4 (2 ml) at 160° C. After the second evaporation, sample was taken into solution by adding approximately 10 ml of water, 3 ml HNO3, 5 drops H2O2, 2 drops of HF and warmed on a hot plate until a clear solution was obtained. The sample was then transferred to a clean 60 ml HDPE bottle diluted up to a final weight of 60 g with de-ionized water.
Roasting of fly ash
Three separate 40 grams of fly ash samples held in small crucibles were each mixed with 8 grams of crushed NaOH pellets (VWR Chemicals, AnalaR NORMAPUR) amounting to ratios 5:1. The mixtures were then heated in an oven at 100, 200 and 300 degrees Celsius over a soaking time of 1hour. This roasting is targeted at breaking the alumino-silicate mineral phase which often encapsulates the elements of interest (REEs) and creates barriers to acid leaching.
Leaching with NaOH solution
The silica extraction (with co-alumina) regime using NaOH solution was conducted based on Taguchi OA L9 design. Factors considered are liquid-solid ratio, base concentration and reaction time. The experimental variables involved are liquid-solid ratio (10, 15, 20 mL/g), base concentration (3, 6, 9 M) and reaction time (60, 90 and 120 min). It implies that 10 mL of 3 M base NaOH solution was added to 10 g of oven treated fly ash sample over a 60 min reaction time. NB: The value of 10 mL/g given was only meant for the purpose of experimental design. Corresponding higher quantity of reagent to ash powder was used during the actual experiment. The mixture was centrifuged for 10 min and subsequently filtered using a 0.45μm pore nucleopore membrane. This procedure was repeated for all other variables at room temperature. This was followed by storage of leachate samples in falcon tubes in the refrigeration room as well as oven drying of the desilicated residues at 80 oC. The dried residues were then stored in plastic papers for analyses. Samples were analyzed for silica and alumina with the use of Inductively Coupled Plasma Optical Emission Spectroscopy (ICP-OES). Efficiency of silica and alumina removal, was calculated using equation 1. This procedure was established by.13,14
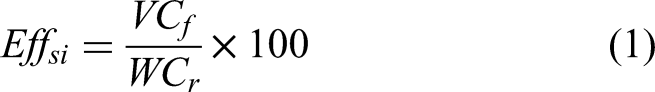
V represents the volume of filtrate in mL,
Results and discussion
Mineralogy of as-received fly ash
Table 1 shows the mineral counts of the untreated fly ash. The mineralogical study indicates the dominant presence of crystalline mullite (3Al2O3–SiO2) and quartz (SiO2) minerals in the fly ash. The presence of a significantly high crystalline phase in the sample signifies that not all minerals in the coal melted upon combustion. 15 The presence of crystalline phases herein indicates that some minerals in coal retained their structures in spite of the prolonged exposure to high temperatures in the course of combustion. Also, it is a known phenomenon that high temperature in coal power plants boilers promotes formation of glasses-containing fly ash along with quartz. In order to understand the mode of distribution of REEs in fly ash, studies by [2;4] indicated that REEs in coal upon combustion, are encapsulated in fly ash glasses which are mostly characterized by the presence of a silica and alumina compound (mullite) and may be referred to as aluminosilicate glasses. 16 similarly reported the phenomenon by listing some mineral constituents in fly ash as; 1. aluminosilicate glasses, 2. aluminosilicate glasses that are also enriched in calcium, iron, or a combination of both, 3. iron oxide minerals and 4. quartz. The current mineralogical study suggests the presence of aluminosilicate glasses (mulltie), iron oxide minerals and quartz which corroborates Scott and Kroller's report. The XRD peaks also suggest the presence of other minor mineral phases namely, kyanite and muscovite. Kyanite being a member of the alumino-silicate family may have been deposited from the pre-existing sedimentary mineral in the combusted coals.
Percentages of minerals detected by XRD in the As-received fly ash.
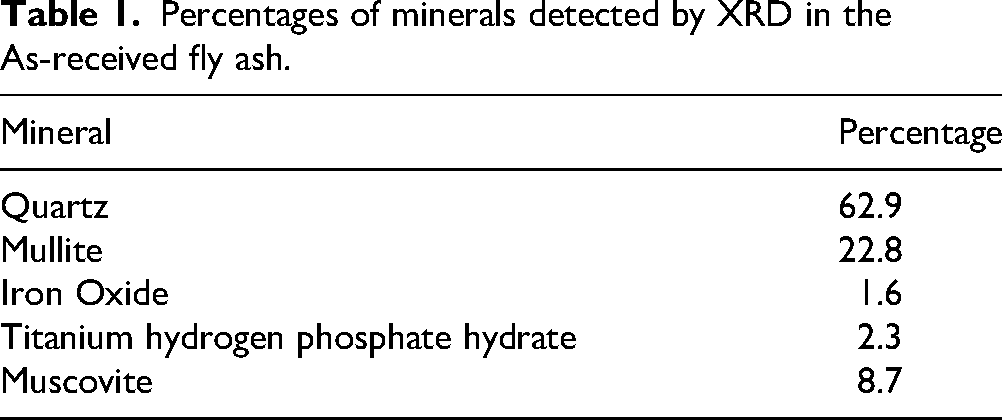
The presence of iron oxide may be as a result of its incorporation in fly ash glasses during coal combustion: In power plants, there can be occurrences of temperature changes from 1000 degrees Celsius to 200 degrees in few seconds. This sudden temperature decrease promotes rapid nucleation of hematite minerals within the glass. 17 Further understanding of the phenomenon of formation of iron-oxide minerals in coal fly ash at low temperature indicated that iron oxides present in form of Fe2+ are characterized by lower melting temperature. When iron is embedded in glass silicates, there is a rapid decrease in melting temperature 18 ). Therefore, the presence of the hematite mineral phase in the XRD peaks is not surprising.
Aside from the identified crystalline phases, namely; quartz, mullite, hematite and others, coal fly ash is primarily an amorphous waste. The amorphous phases are as a result of the partial hub observed in the background at low diffraction angle.
Morphological characteristics of fly ash samples
Owing to variations in coal composition and combustion temperatures, fly ash is prone to variation in morphology. It was therefore necessary to broadly investigate this property as it could provide direction for use of the fly ash. The data derived from this study can form a basis for understanding the mechanical and physical properties of the material as well as the economics of their use.19,20
Surface characteristics of as-received fly ash
Figure 1 presents the SEM-images of the as-received fly ash while Figure 2(a) and Figure 2 (b) respectively present typical SEM images of pulverized coal combustion fly ash (PCCFA) and the fluidized bed combustion fly ash FBCCFA. As shown in Figure 1(i), the morphological structure is made up of organic and inorganic matter that forms agglomerates. The inorganic constituent is the quartz and other minerals dominated crystalline mineral phase as showcased in Figure 1. ii, iii, iv and v. 15 The EDS as shown in Figure 1 (vi) provides the elemental composition of the as-received fly ash. In addition, the SEM images of the untreated fly ash indicate a predominantly coarse and irregular/angular-shaped particles of residual carbons which is a typical characteristic of fly ash derived from the fluidized bed combustion (FBC) technology which may herein refer to as fluidized bed coal combustion fly ash (FBCCFA). 10 This is as a result of the lower combustion temperature of 700–900 oC used in the technology which is insufficient to melt coal particles to the finer, spherical shaped glassy particles as in the case of the pulverized coal combustion fly ash (PCCFA) as shown in Figure 2(a).
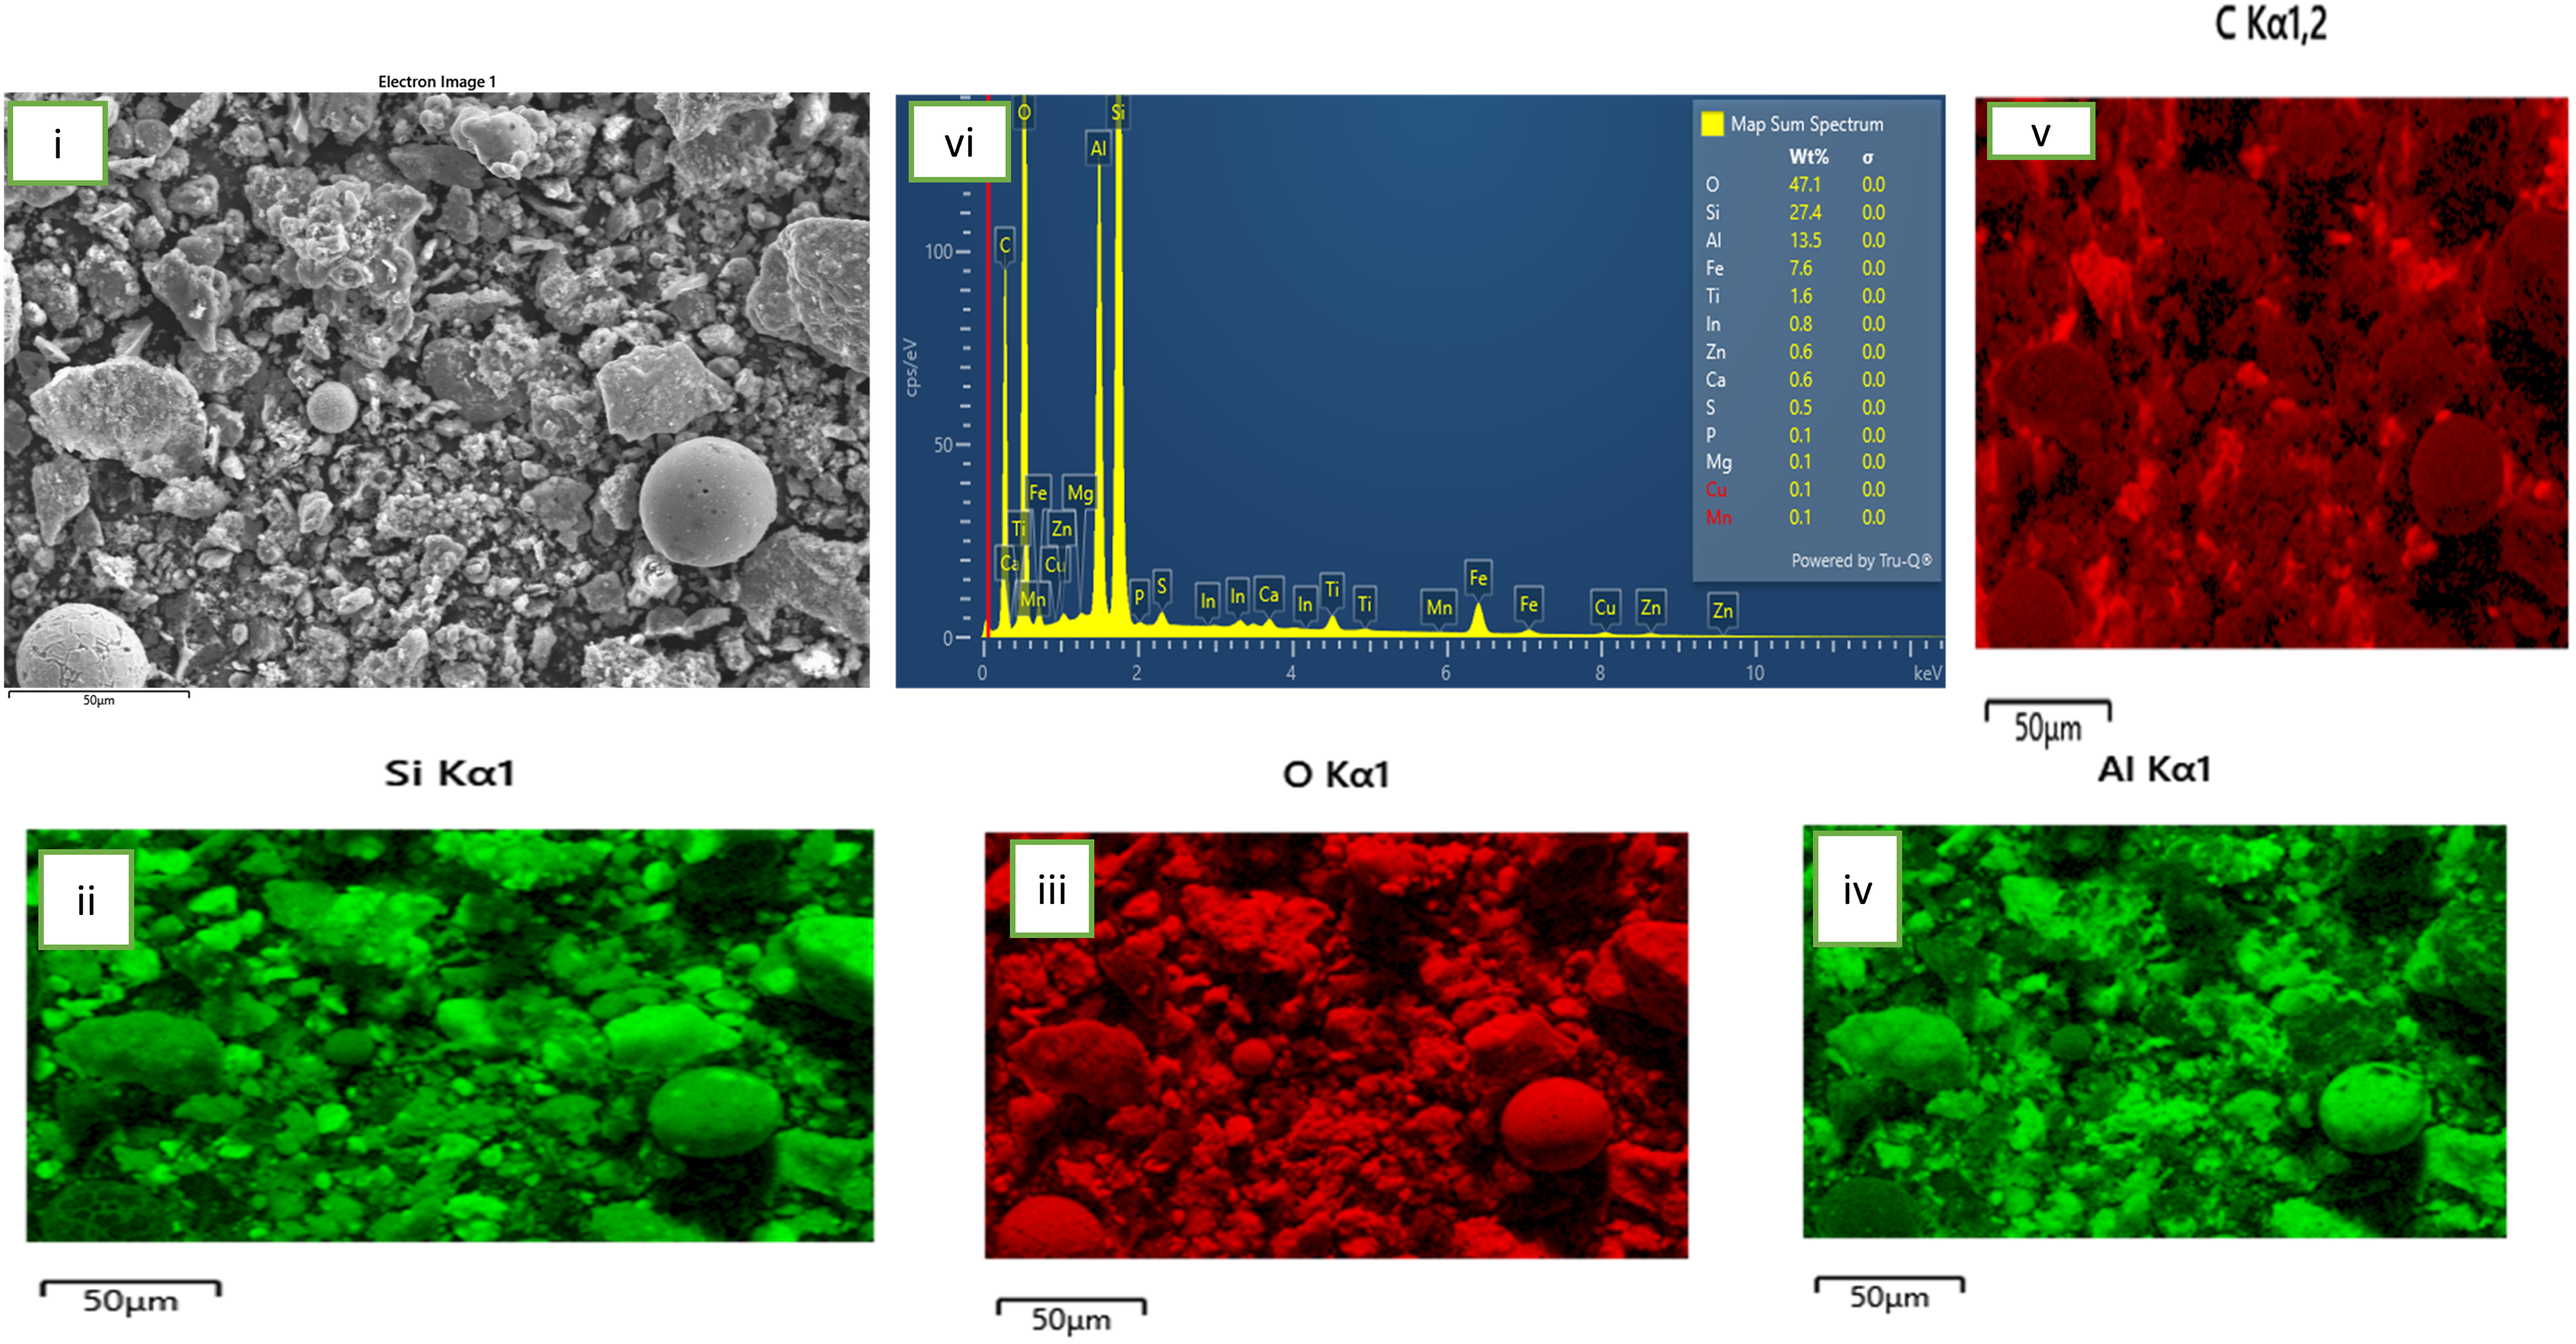
SEM-EDS images of the As-received fly ash.
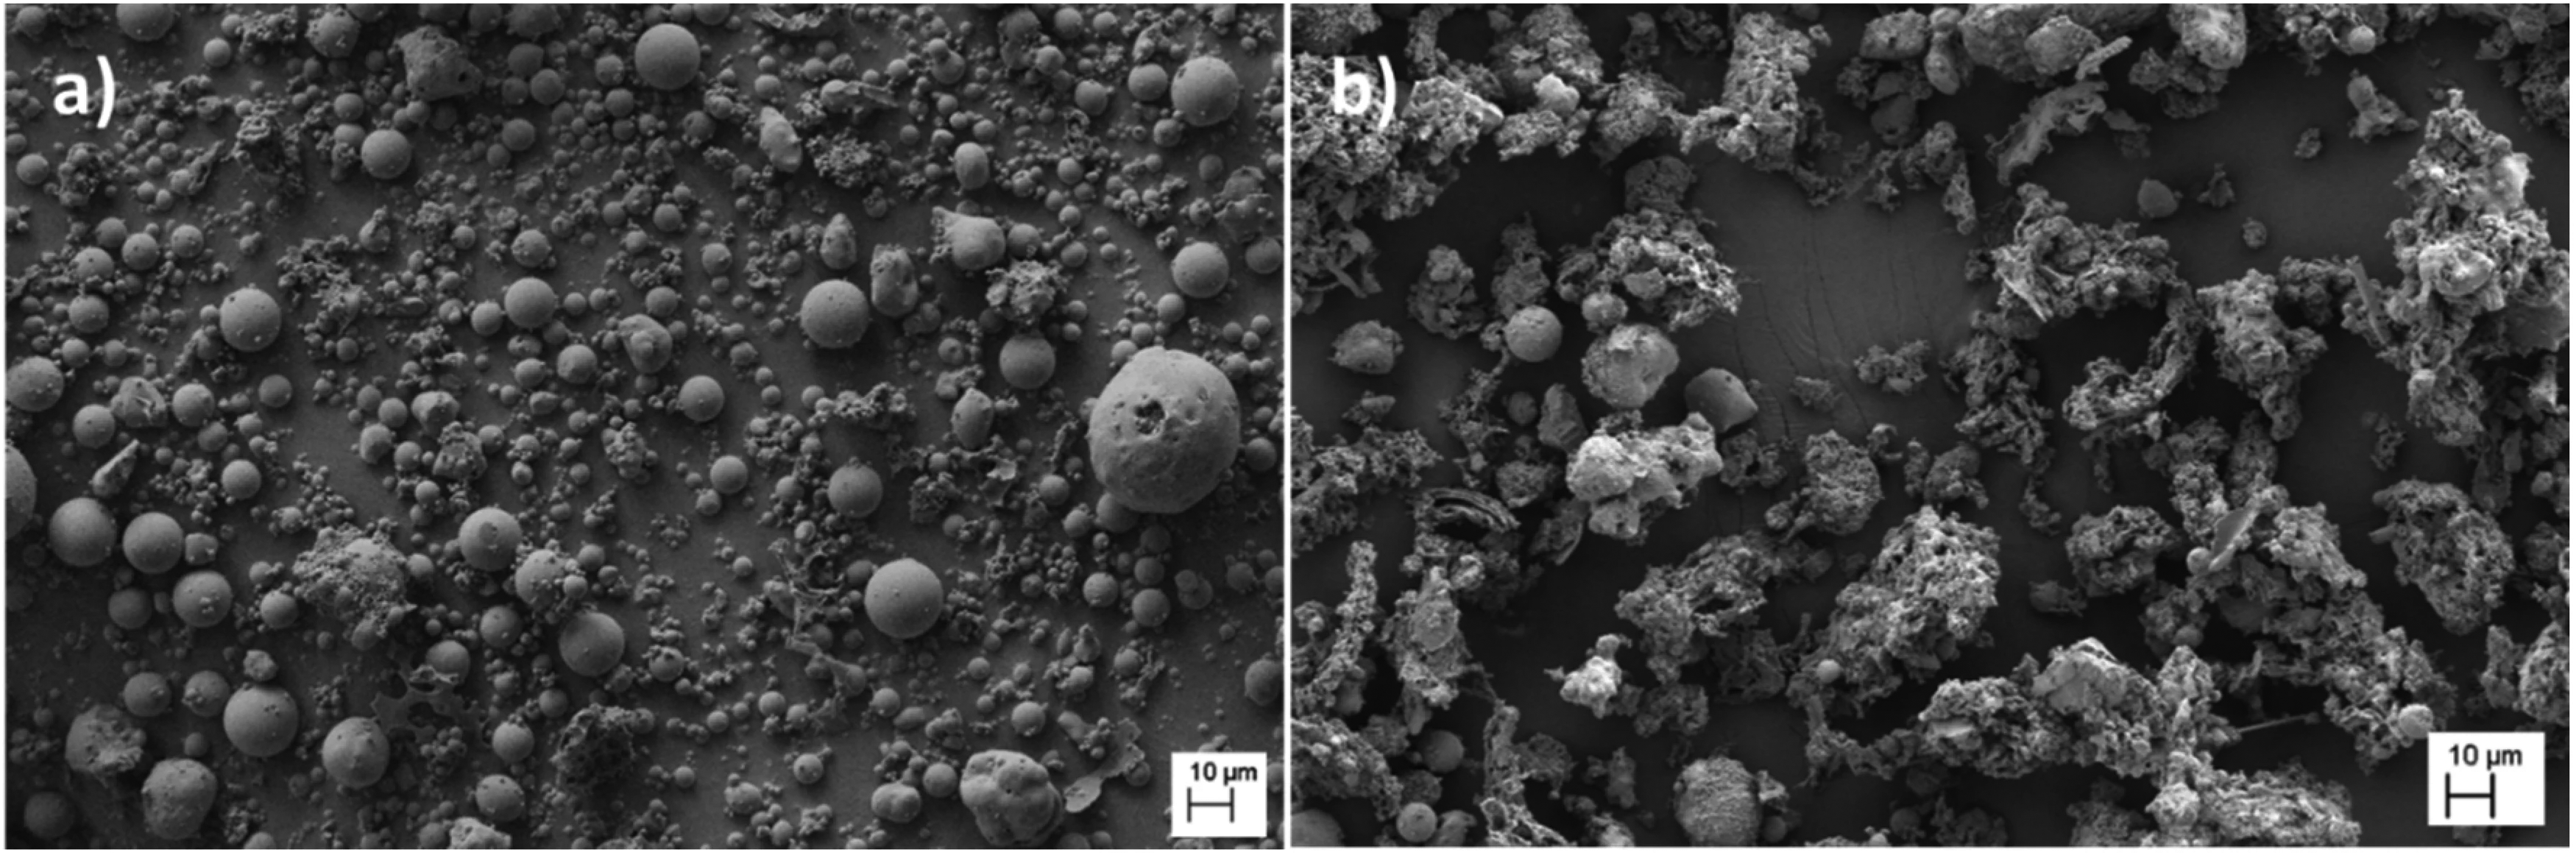
Typical SEM images of pulverized coal combustion fly ash PCCFA (a) and fluidized bed coal combustion fly ash FBCCFA (b) compared 21 : CC by license].
Figure 2 (a and b) provides a further comparison between SEM images of PCCFA and FBCCFA respectively. The fuel composition in the FBC technology which often comprises of low melting biomass, calcite (or dolomite) and low rank coals 21 may have also been responsible for the dominant irregular shaped and coarser ash particles indicated by the SEM images of the untreated sample.
Surface characteristics of furnace roasted samples
This section presents SEM images of fly ash-NaOH mixtures sintered at 100 oC, 200 oC and 300°C for 60 min at experimental condition of additive to fly ash ratio 1:5. On the choice of roasting time 22 : reported a wide range investigation of the effect of the roasting time on Silica and Alumina yields from coal fly ash where time varied as follows (5, 10, 20, 40, 60, 90, 120 min). The outcome of the study noted that the rate of extraction increased rapidly when the roasting time was extended from 5 min to 60 min before reaching a peak. 48.73% and 93% yields were recorded at roasting time of 5 min and 60 min respectively. However, with a further extension of the roasting time, there was little improvement in the rate of extraction, which suggests that 60 min is adequate for activation of the fly ash. Any further extension of time could increase energy consumption, process time involved and may affect process efficiency. Hence, the justification of our choice of 60 min roasting time for the current study.
On the choice of roasting temperatures: 23 conducted similar extensive study on silica and alumina extraction from coal fly ash by varying temperatures between (264°C, 320°C, 340 oC, 360 oC, 380 oC, 400 oC, 420°C) The study reported that an improved extraction of the elements was recorded as the temperature increased within the range of 300–400 oC. However, a decrease in yield was obtained when the temperature reached 420°C. Obviously, increase in roasting temperature promotes greater intensity of roasting additive decomposition resulting in its volatility and those of oxides present which cannot meet the requirement for the decomposition of the fly ash and thus negatively impacts the activation of target elements. 22 In other words, excessive increase in the roasting temperature may work against the process. While, higher temperatures appear to promote reaction, it can cause loss of reagent via evaporation and without the reagent, fly ash won’t get properly broken down, thereby minimizing the efficiency of target elements extraction. The study added that higher temperatures greatly increased the amount of energy used and found 400°C as the optimum roasting temperature for fly ash activation. Bearing in mind that the boiling point of NaOH used as roasting additive in the current study is 320 oC, our choice of roasting temperatures within the range 100 oC, 200 oC and 300 oC is therefore justified.
The choice of the roasting ratio of 1:5 in this study is predicated on the extensive work on effect of roasting additive to solid material ratio on extraction of Si from coal fly ash being a pre-requisite for acid leaching as reported by. 12 The said study noted that there was no significant change in extraction when additive ratio was varied between 1:1 and 1:6, hence our choice of working with 1:5 during the roasting stage is justified.
Surface characteristics of sample roasted with NaOH at 100 oC
Figure 3 presents the SEM-EDS images derived from a roasting condition of 100°C and duration of 60 min of fly ash-NaOH mixture. Figure 3(i) shows that the roasting regime initiated an agglomeration between the particles. Figure 3(ii) and 3.3a(iii) indicate the respective precipitates of silica and alumina particles upon roasting. Figure 3(ii, iii and v) respectively identified particles of alumina, silica and sodium at the surface of the material upon roasting. This suggests that alumina and silica so found are the partially dissolved particles of the alumino-silicate mineral found in the fly ash sample upon roasting. Valuable information about the chemical composition of the material upon roasting at 100 oC was obtained via EDS analysis as shown in Figure 3(iv). It also shows that the materials appearance and morphology further demonstrate the phenomenon of alkali fusion. The images confirm acceleration of the rate of mass transfer of fly ash-NaOH occurrence as promoted by the melt at 100°C, confirming the reactions in equation 2.
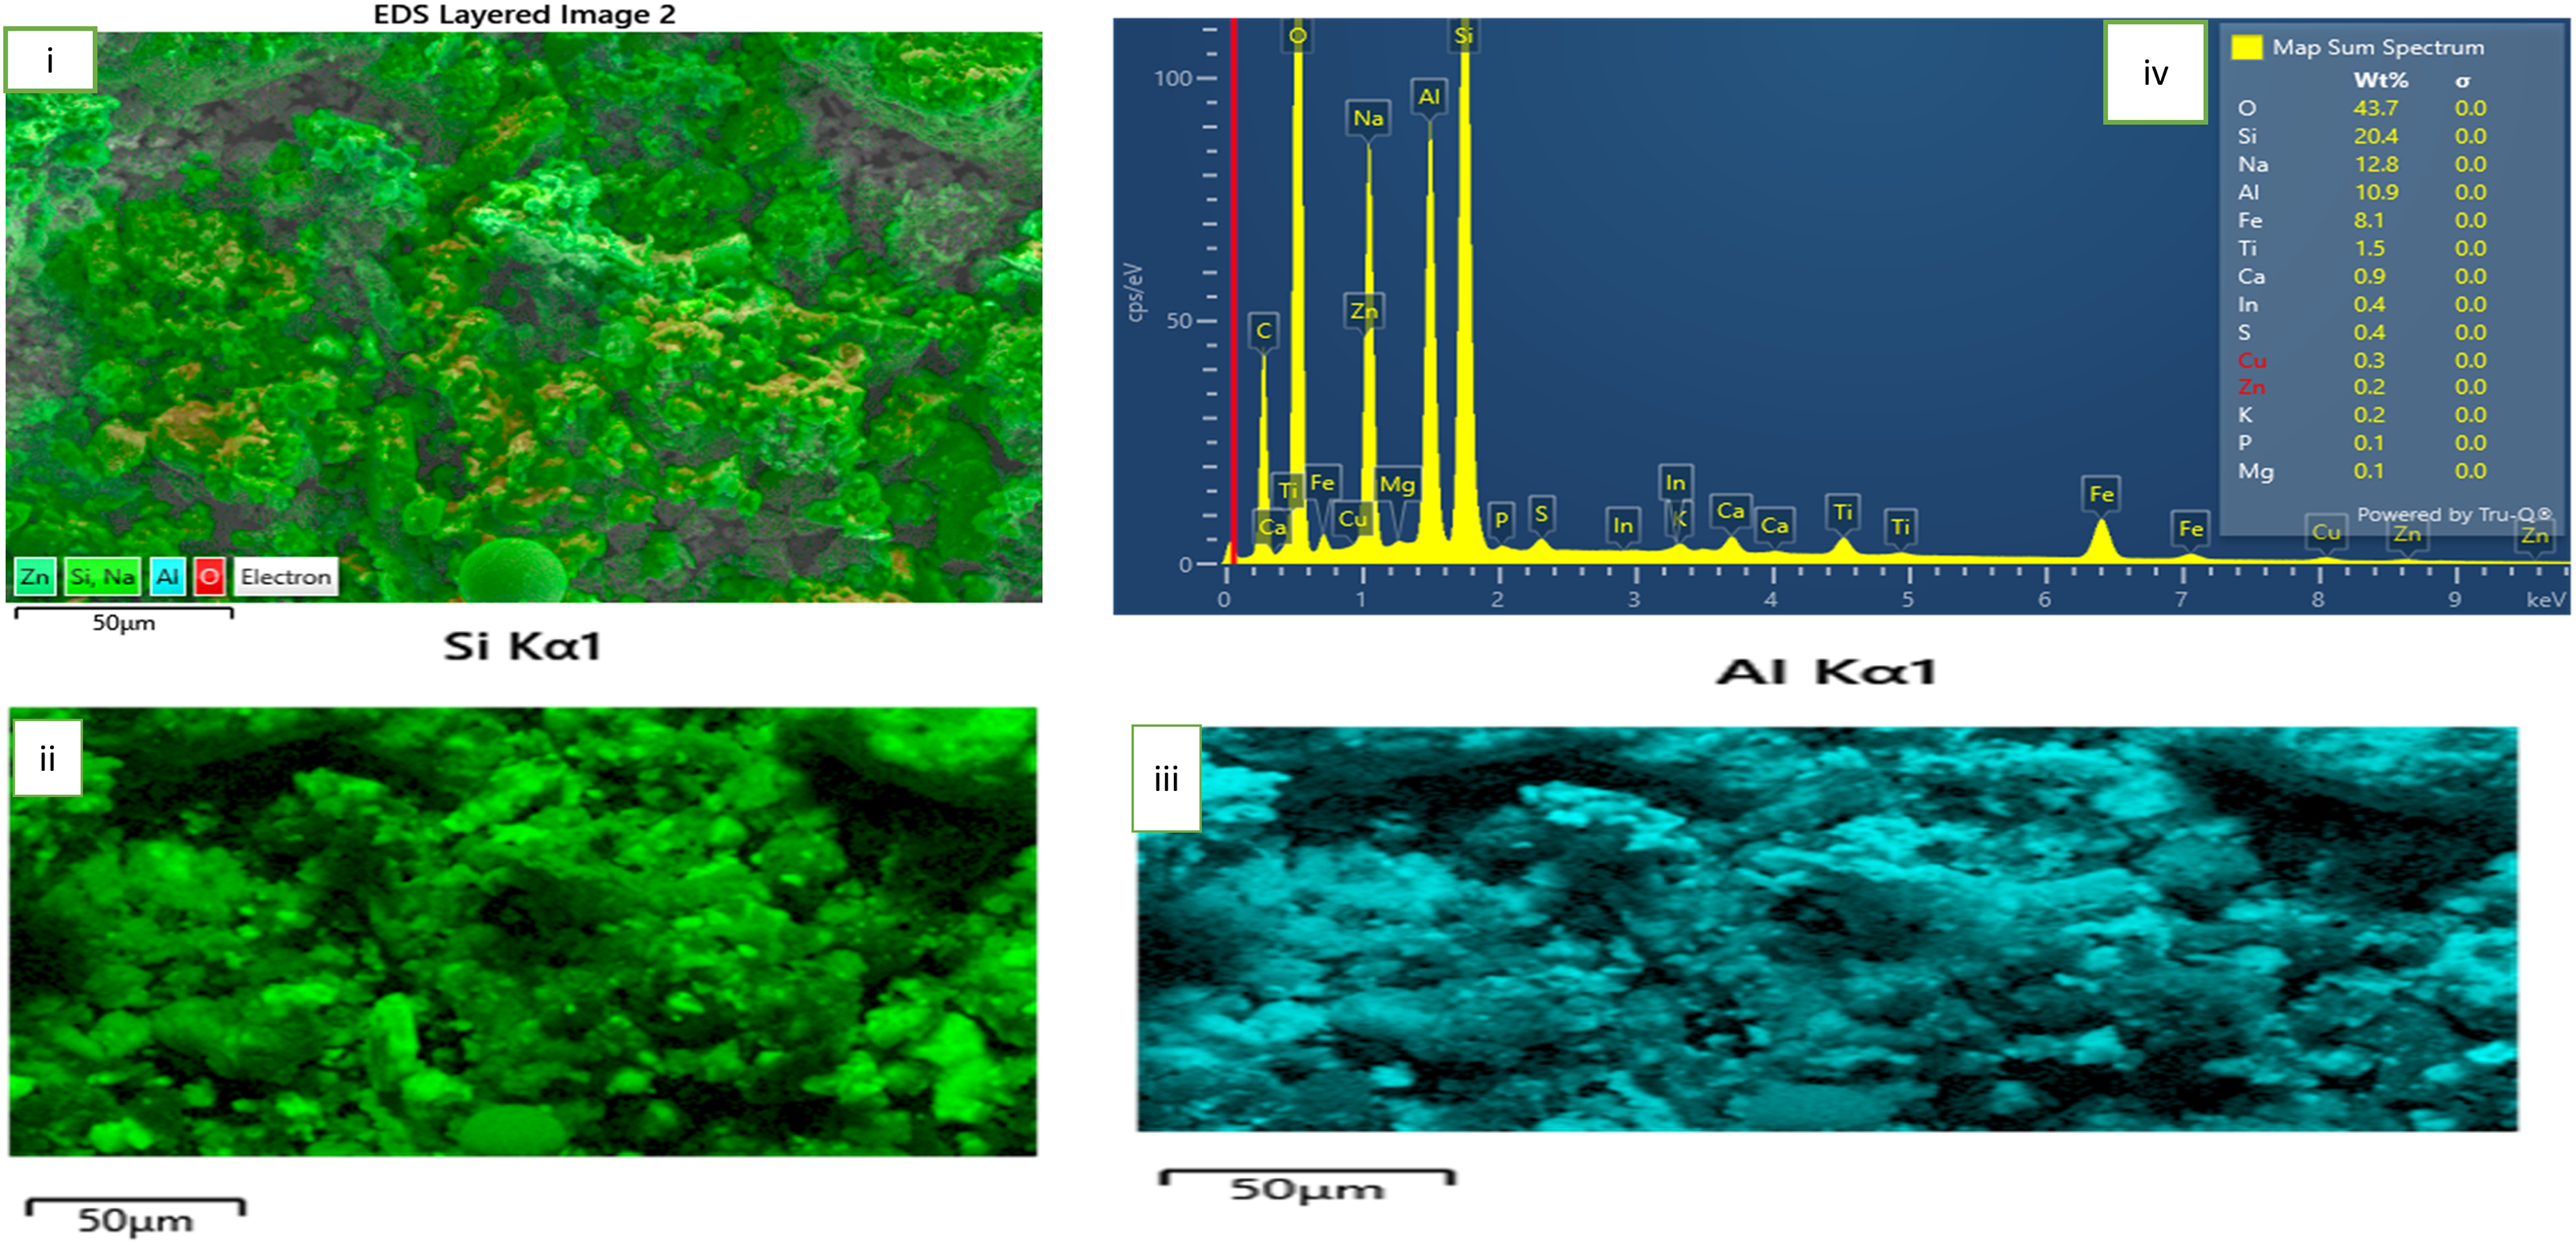
SEM-EDS of fly ash sample roasted at 100 degrees celsius.
Correspondingly, the main phases of activated material contained sodium silicate and sodium aluminum silicate indicating that alumino-silicate particles had reacted with NaOH to form soluble salts also confirming the occurrence of the reaction in (equation 2). 23
Surface characteristics of roasted sample at 200°C
Figure 4: SEM-EDS of Fly Ash Samples Roasted at 200 degrees Celsius. An accompanying ESD analysis is also presented. In the condition of 200°C temperature and duration of 60 min, the SEM images of fly ash-NaOH mixture are shown in Figure 4. Figure 4(i) similarly shows that the roasting regime initiated an agglomeration between the particles. The Figure also shows that the materials appearance and morphology further demonstrate the phenomenon of melt agglomeration with loose, irregular shaped and somewhat flaky structure indicating the extent of fusion. 24 The results further confirms that the mass transfer rate of fly ash-NaOH was accelerated and the occurrence was promoted by the melt at 200 oC confirming the reactions in equation 2 as earlier shown. Figure 4 (ii, iii, iv) presents the respective precipitates of silica, alumina and sodium particle on the material's surface upon roasting. It is supposed that alumina and silica found are the partially dissolved particles of the alumino-silicate mineral found in the fly ash sample upon roasting. The sodium particles observed is as a product of incomplete melting of the NaOH pellets used for roasting Figure 4 (v) presents an elemental composition of the material upon roasting at 200 oC.
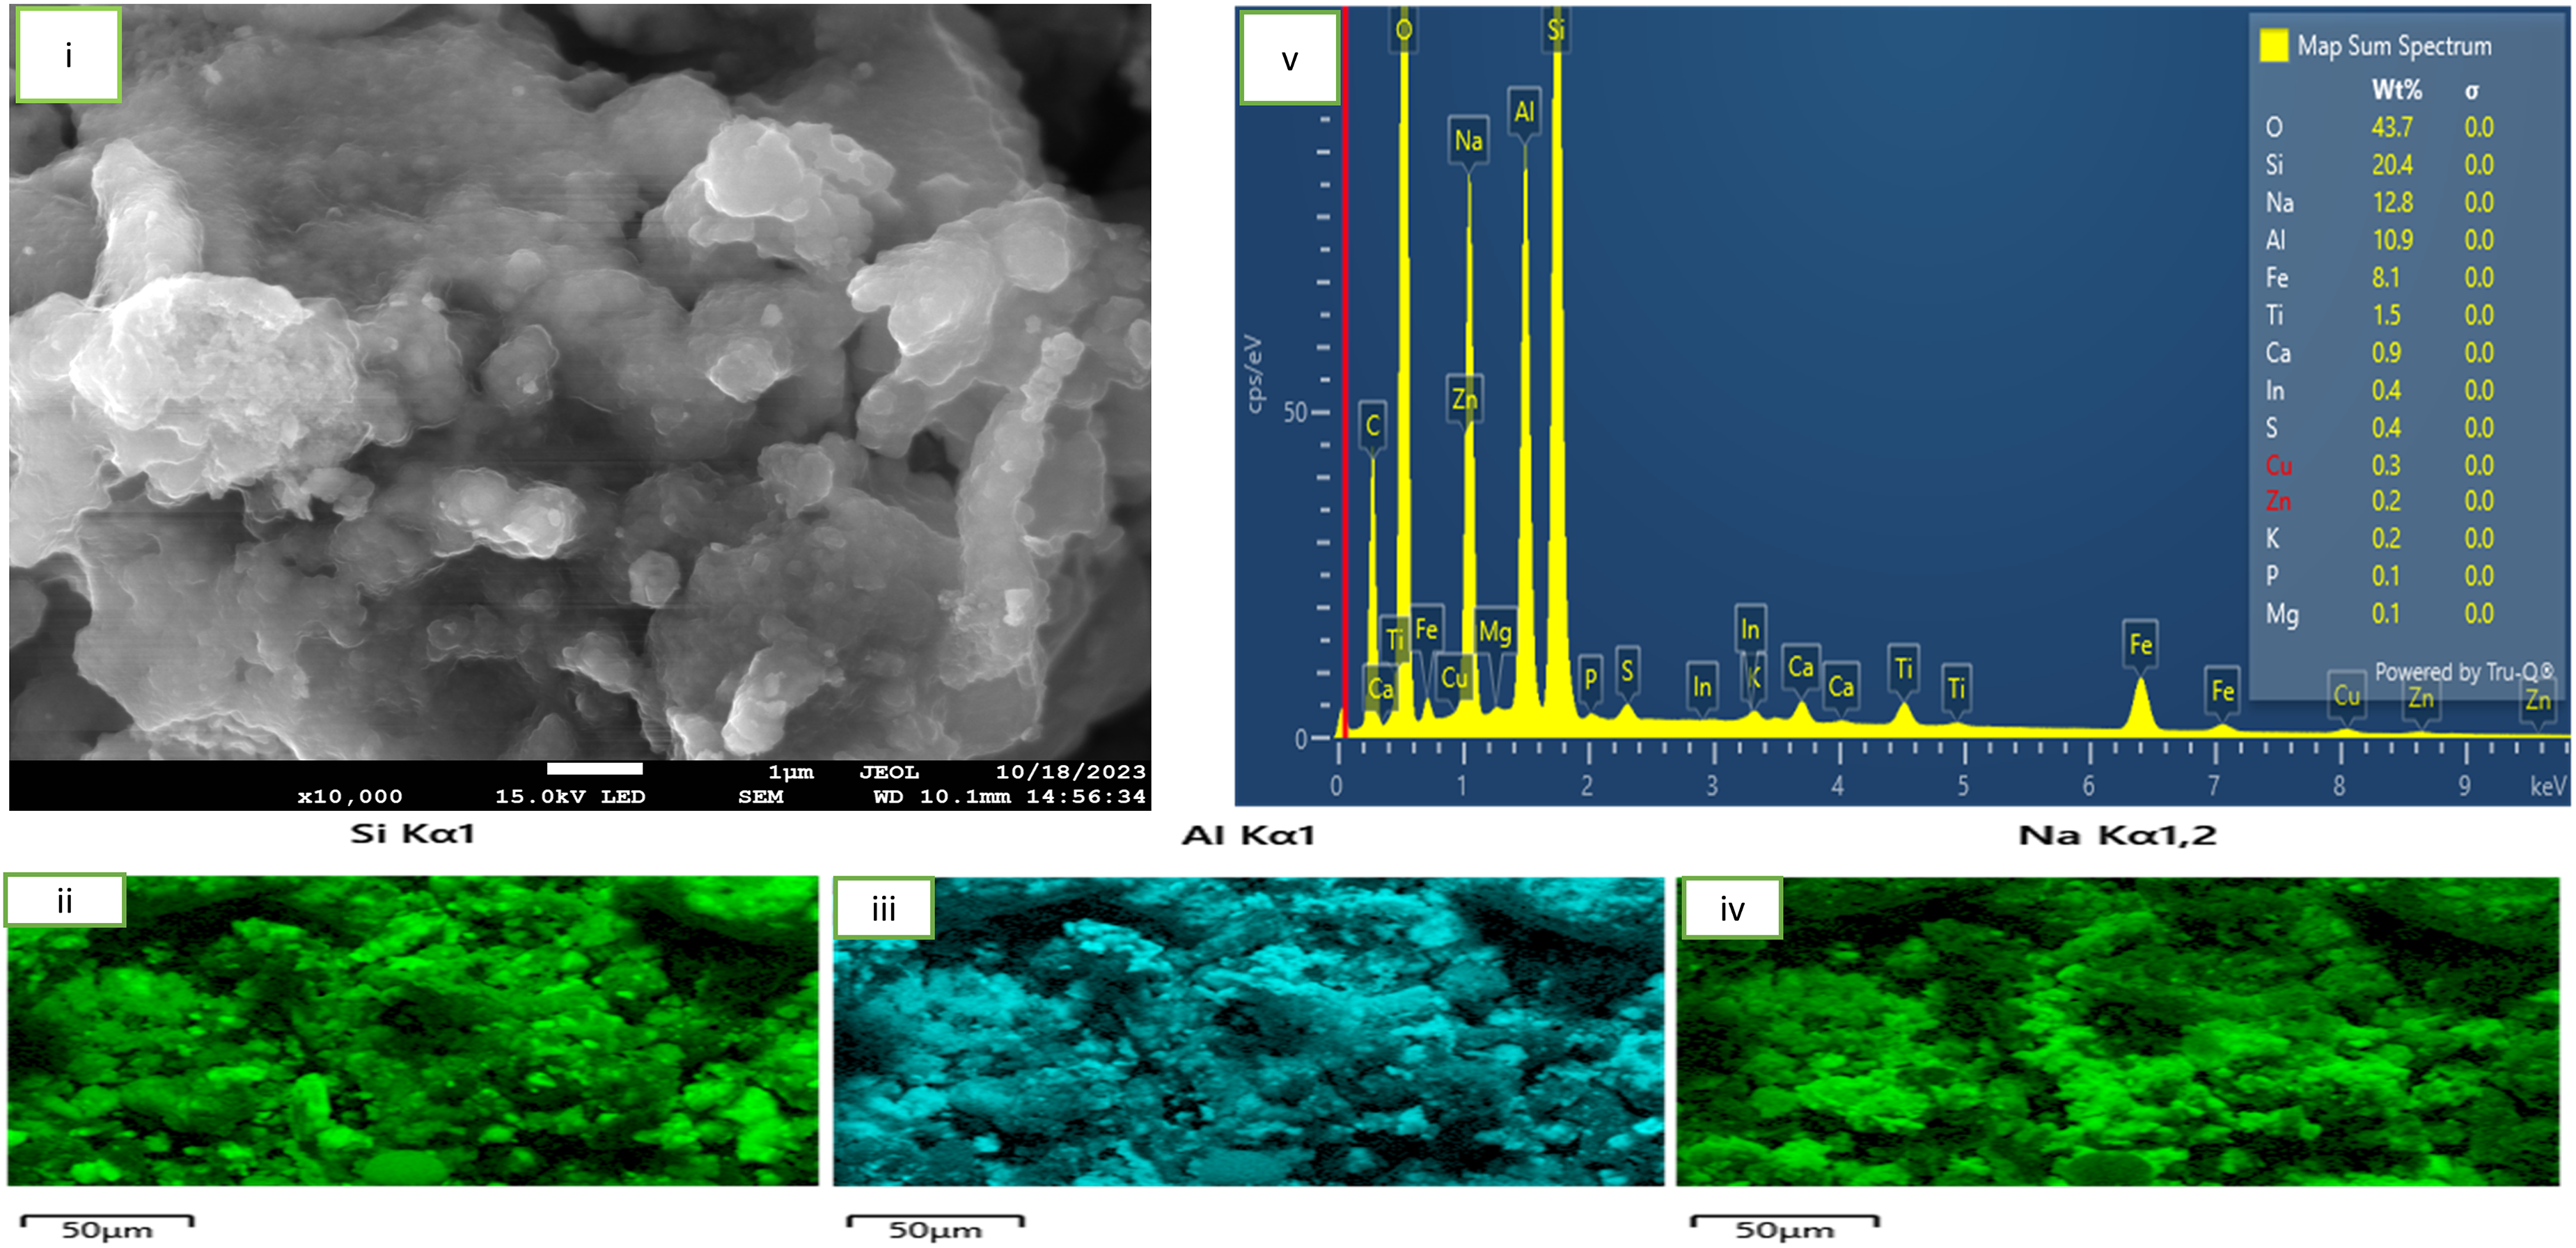
SEM-EDS of fly ash samples roasted at 200oC.
Morphological characteristics of fly ash sample roasted with NaOH at 300°C
This section provides the effect of fly ash roasting with NaOH at 300 oC on its morphology. Figure 5 provides details of the analysis. Under a roasting temperature condition of 300 oC and soaking time of 60 min, the SEM images of fly ash-NaOH mixture are shown in plate Figure 5 (i). The Figure indicates that the roasting regime initiated an agglomeration between the particles appearing to have a comparably more serve dissolution of NaOH. The Figure also indicates that the materials appearance and morphology further demonstrate the phenomenon of alkali fusion. The images yet confirm that the mass transfer rate of fly ash-NaOH was accelerated and the occurrence was promoted by the melt at 300 degrees confirming the reactions in equation (2) as earlier shown. Figure 5(ii, iii and v) respectively identified particles of alumina, silica and sodium at the surface of the material upon roasting. We suppose that alumina and silica found are the partially dissolved particles of the alumino-silicate mineral found in the fly ash sample upon roasting. The sodium particles observed are a product of incomplete melting of the NaOH pellets used for roasting. EDS-analysis identified a number of elements on the material's surface as shown in Figure 5 (v).
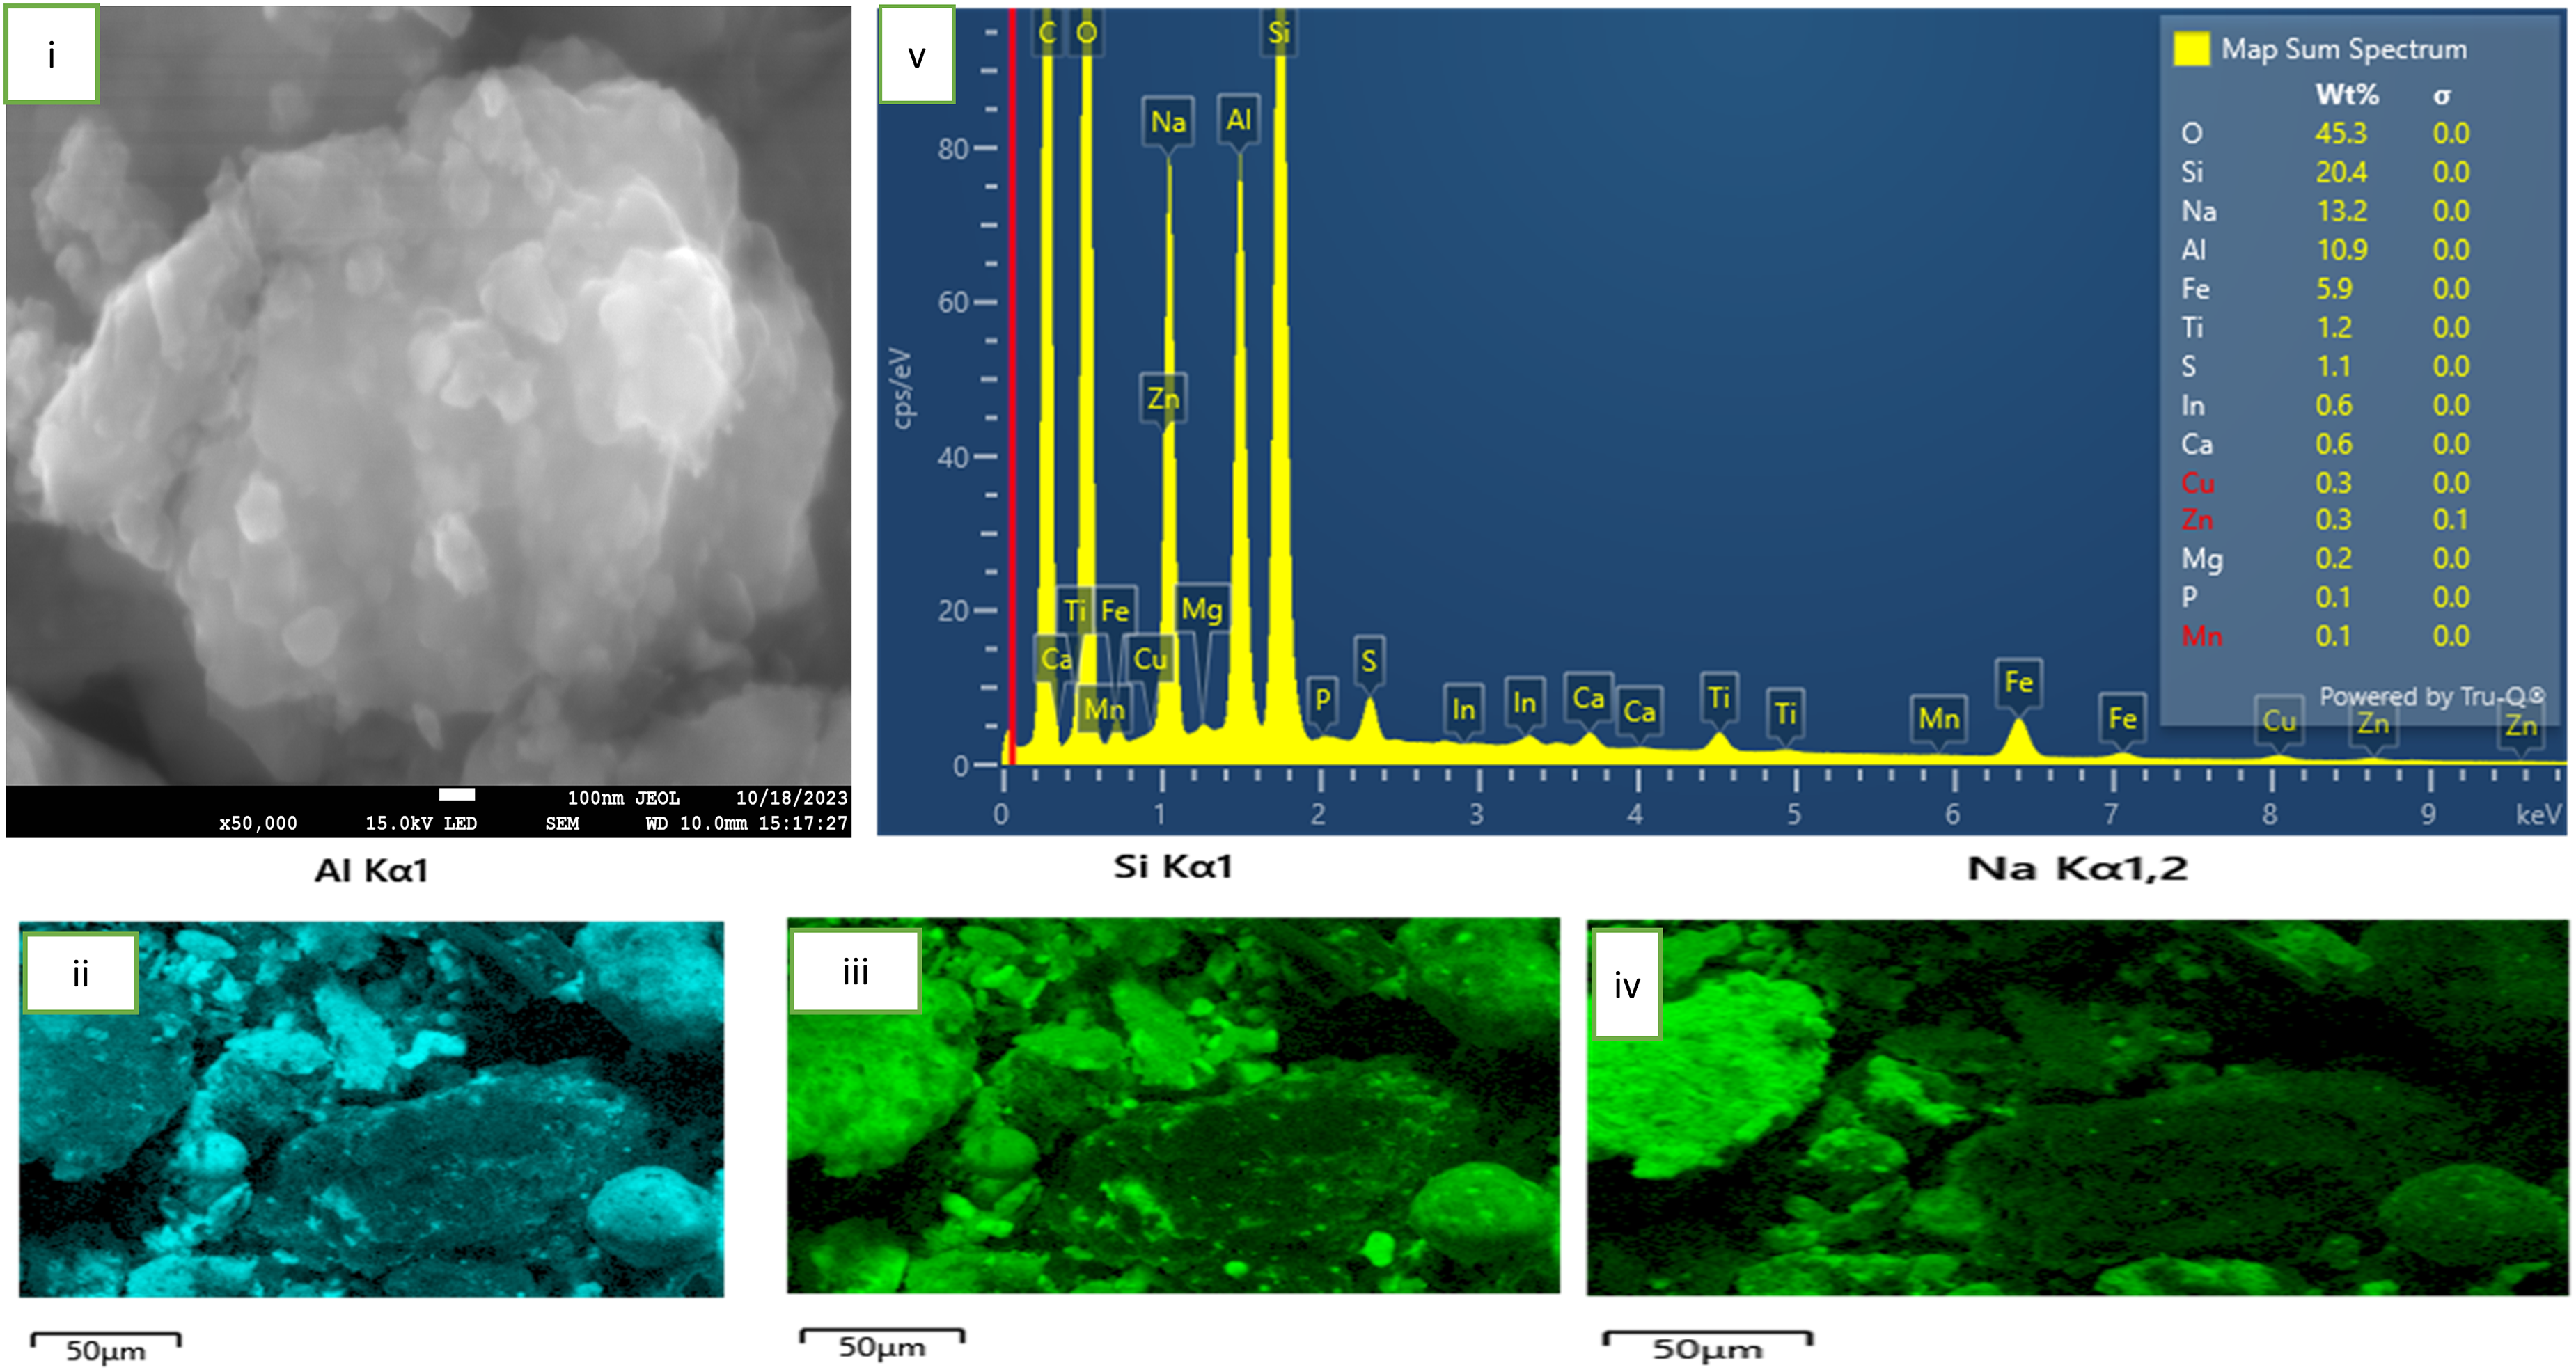
SEM-EDS of fly ash sample roasted at 300°C.
We generally observed a continuous but incomplete disappearance of irregular particles in roasted fly ash samples as shown in the SEM images, which indicates a relatively high conversion of fly ash. 10 Studies on SEM-EDS images also showed that preliminary roasting promoted dissolution of the mass of the amorphous glass from the surface of the spherical agglomerates. 25 Morphological changes were observed as temperature increased. 26 It may be further concluded by mentioning that the microscopic observations of all fly ash samples permitted us to distinguish between the transformed minerals phases (Figures 2, 3, 4 and 5) as follows; spherical solid, irregular solid, irregular porous and fine. 20 The plate of roasted fly ash indicates that the roasting regime indeed initiated fusion between the particles of fly ash and NaOH. A progressive severity in particle fusion was observed.
Mineralogy
Mineralogy of roasted samples
The X-ray diffraction spectra which emanated from the process of roasting NaOH with the As-received coal fly ash obtained under similar test conditions of 1:5 (NaOH: CFA) and 1hour (soaking time) are discussed as phase transitions associated with different roasting temperatures in this sub-section. Figure 6 compares XRD patterns of the untreated and treated fly ash samples. Several diffraction peaks were observed after roasting at 100 oC (B), 200 oC (C) and 300°C(D) which are different from those present in the As-Received sample (A). (Original XRD patterns of the As-Received and roasted samples are labelled in attachment one in the supplemntary data) .We may qualitatively predict the influence of roasting temperatures on the relative proportion of each phase (including the amorphous aluminosilicate glass) by observing the variation in intensity of the diffraction peaks. 27 The diffractograms of the samples B, C and D show disapperance of the initial crystaline mullite phase in the material after the reaction which was desirable to maximize silica removal when roasted with NaOH and minimize same in the subsequent recovery of target rare earth elements in the acid leaching stage. Significant dissolution of other minerals (as earlier shown in Table 1) found in the as-received sample was obseved as temperature increased retaining the obviously “stubborn” quarzite. As temperature increases, furnace thermal activation promotes the removal of any unburnt carbon. 28 ascribed this transformation to entrapment of metal ions within the aluminosilicate structures. This proceedure may as well refer to as alkali fusion which is a conventional method of decimating silica in fly ash. 29 The low melting flux (NaOH) used played the role of an activator during fusion which is theoretically believed to form soluble silicate and aluminate salts (Na2SiO3) and (NaAlSiO4) respectively 30 as earlier shown in equation 2. In addition, for the 300°C -roasted sample D, the highest dissolution of NaOH was observed after reaction in the original diffraction spectrum as shown on Figure 5(v), indicating a better performance.
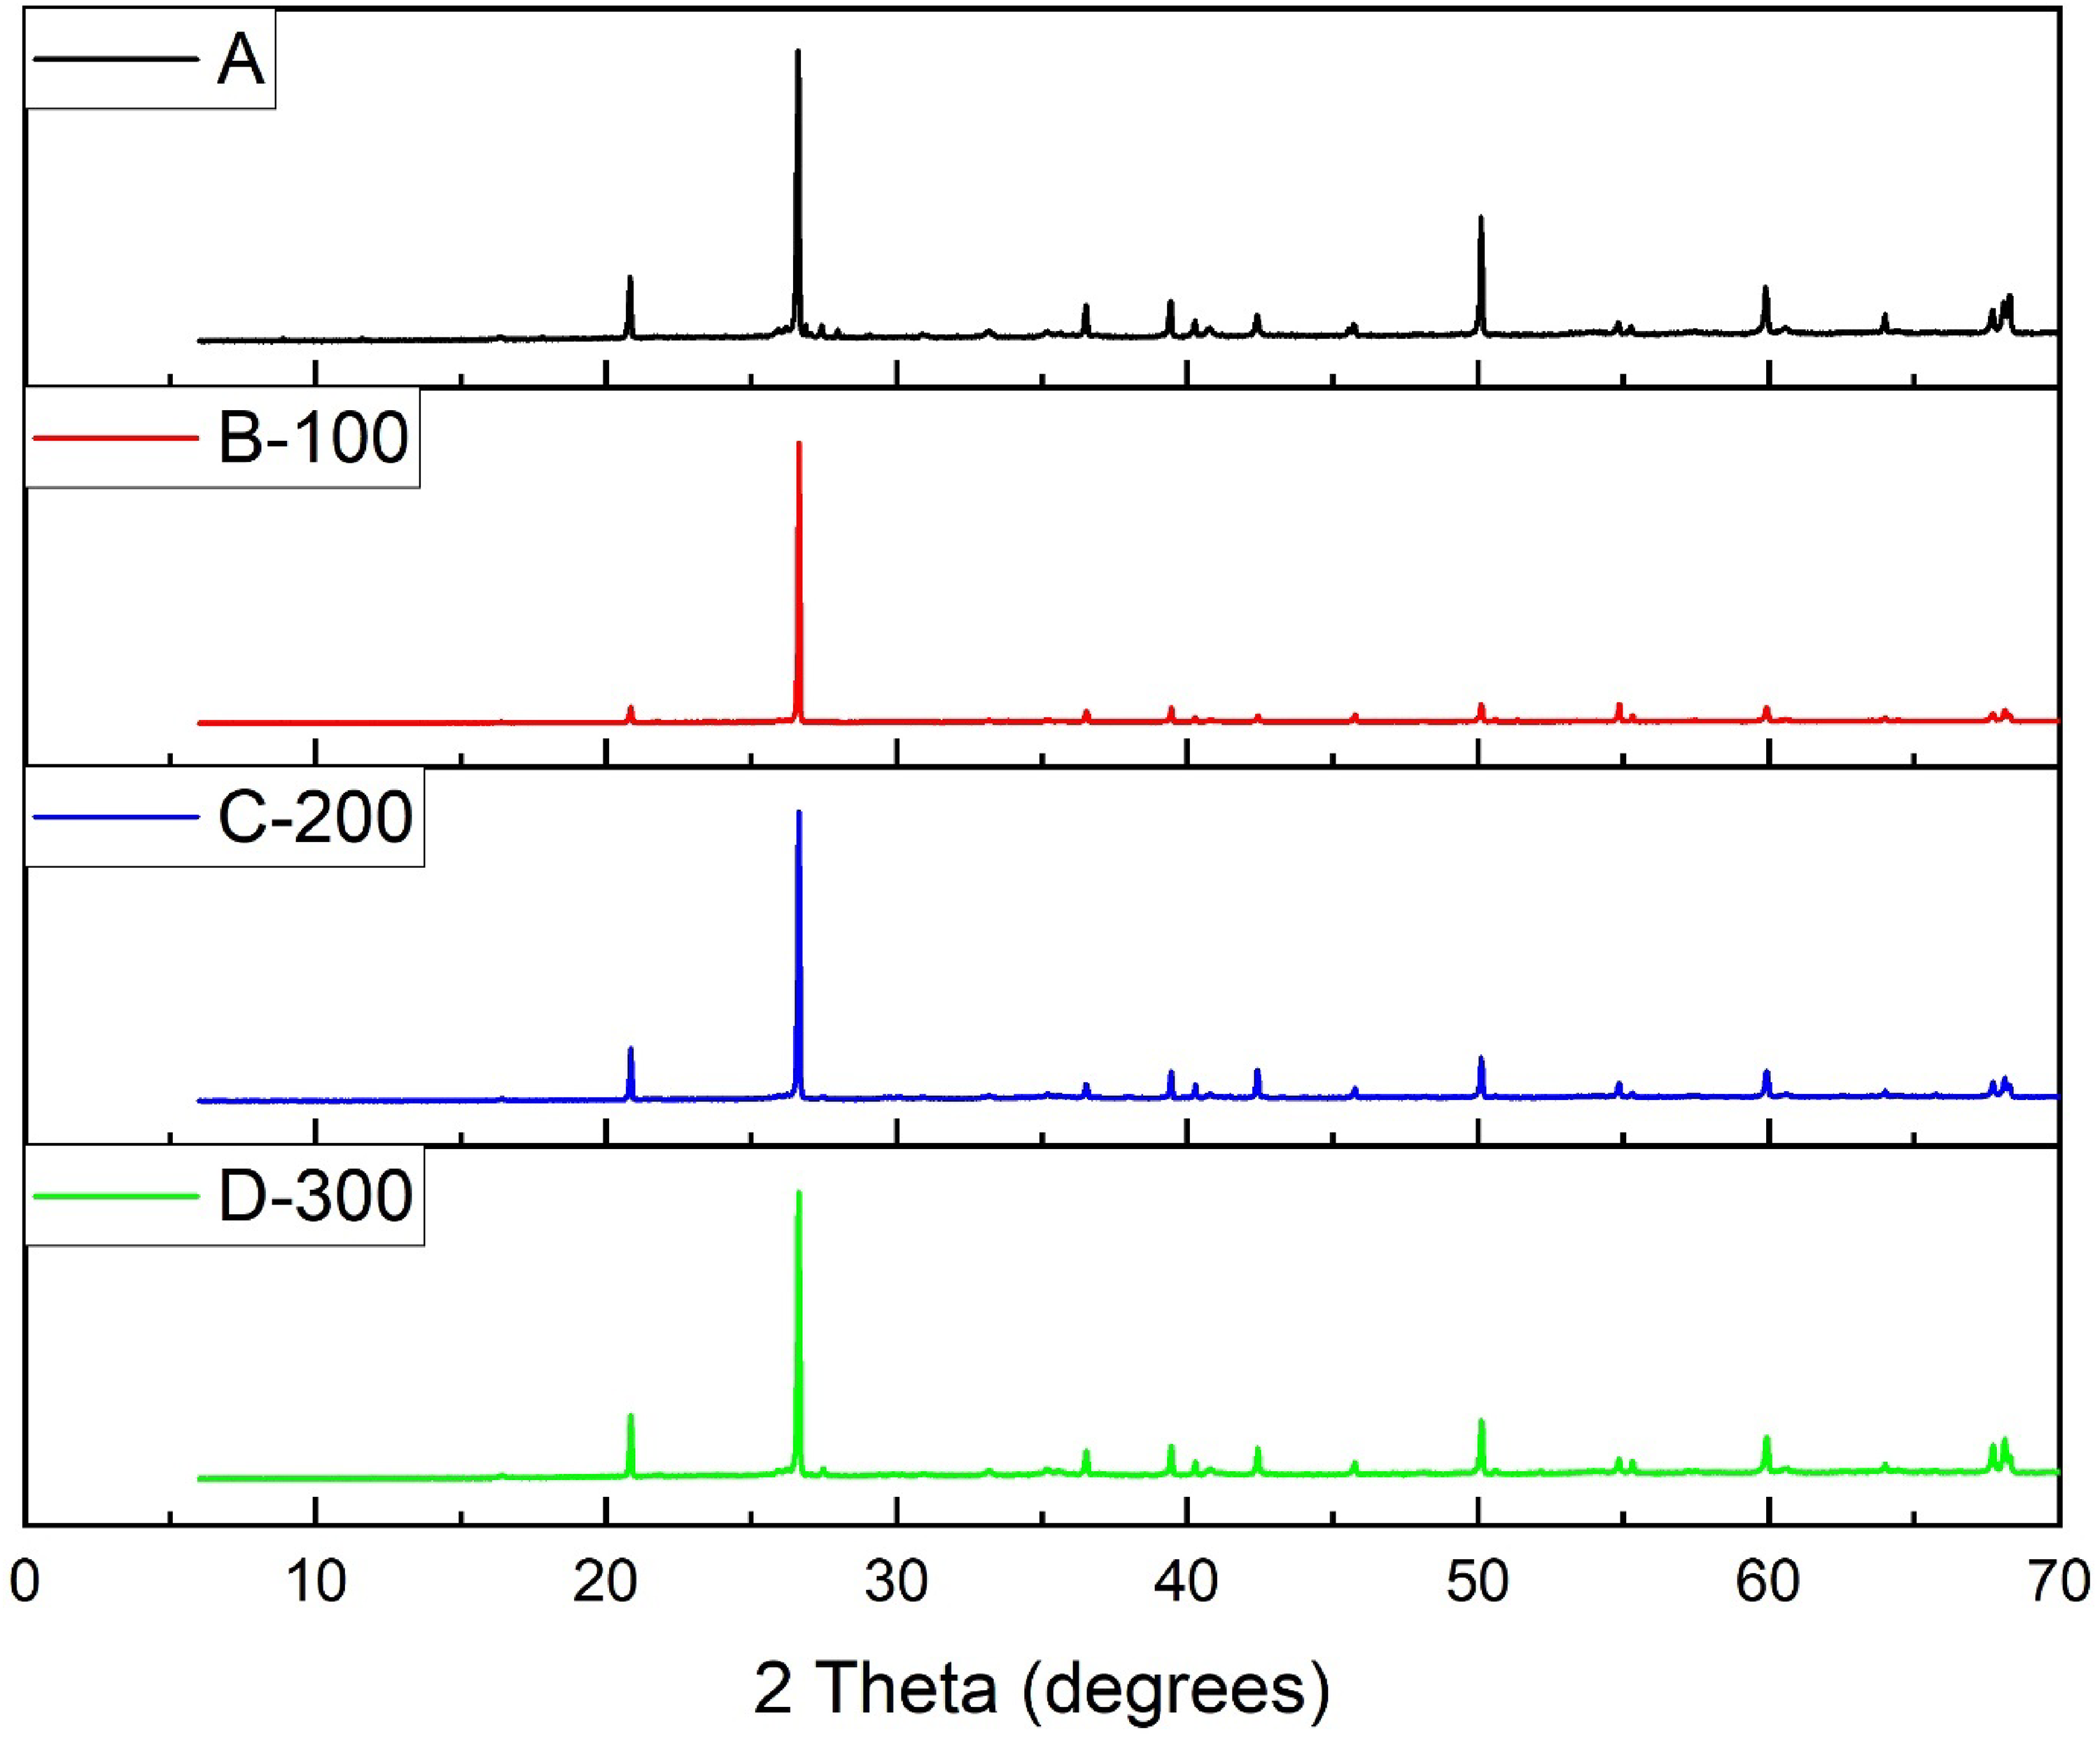
Stacked XRD patterns of the roasted and unroasted samples’ mineral phases.
Reaction between NaOH and quartz + mullite is difficult to achieve at ambient temperature. Diffraction peaks of quartz and mullite were seen to be strong prior roasting indicating that they are the principal mineral phases in the fly ash. The continuous disappearance of the chemically inert phase at higher temperature may be ascribed to the destruction of the crystal structure of these phases with the resultant effect of SiO2 and Al2O3 release. 31 In addition, roasting with NaOH provides a basis to ridding the fly ash of organic matter impurities and amorphous carbon which can culminate to improved purity of the end product.
Efficiencies of silica removal and alumina recovery
The cost of the downstream processes in hydrometallurgical extraction of REE as well as the efficiency is influenced by the ratio of contaminant ions to REE found in leachate. In the end, purity would determine the market value of the REE product.32,33 Impurity removal therefore represents a very important integral aspect of the process circuits of REE.34,35 This necessitated the choice of this second stage of the current study which may herein refer to desilication or silica removal. In this research, this stage of the process focused on improving on the first stage of roasting by measuring the quantitative removal of silica and the corresponding alumina recovery at “room temperature” since the effect of the mentioned sequence on subsequent REE leaching with acid is not well known.
In this stage of the present work also, maximizing silica removal was the main target. Studies on the effects of process parameters (reaction time, base concentration and liquid-solid ratio) on silica removal and alumina recovery from the oven-roasted fly ash samples were therefore conducted and the efficiencies of silica and alumina yield with NaOH are presented.
Effects of process parameters of extraction of silica and alumina from sample B
Figure 7 presents the effects of process parameters on extraction of silica and alumina from sample roasted at 100 oC (sample B).
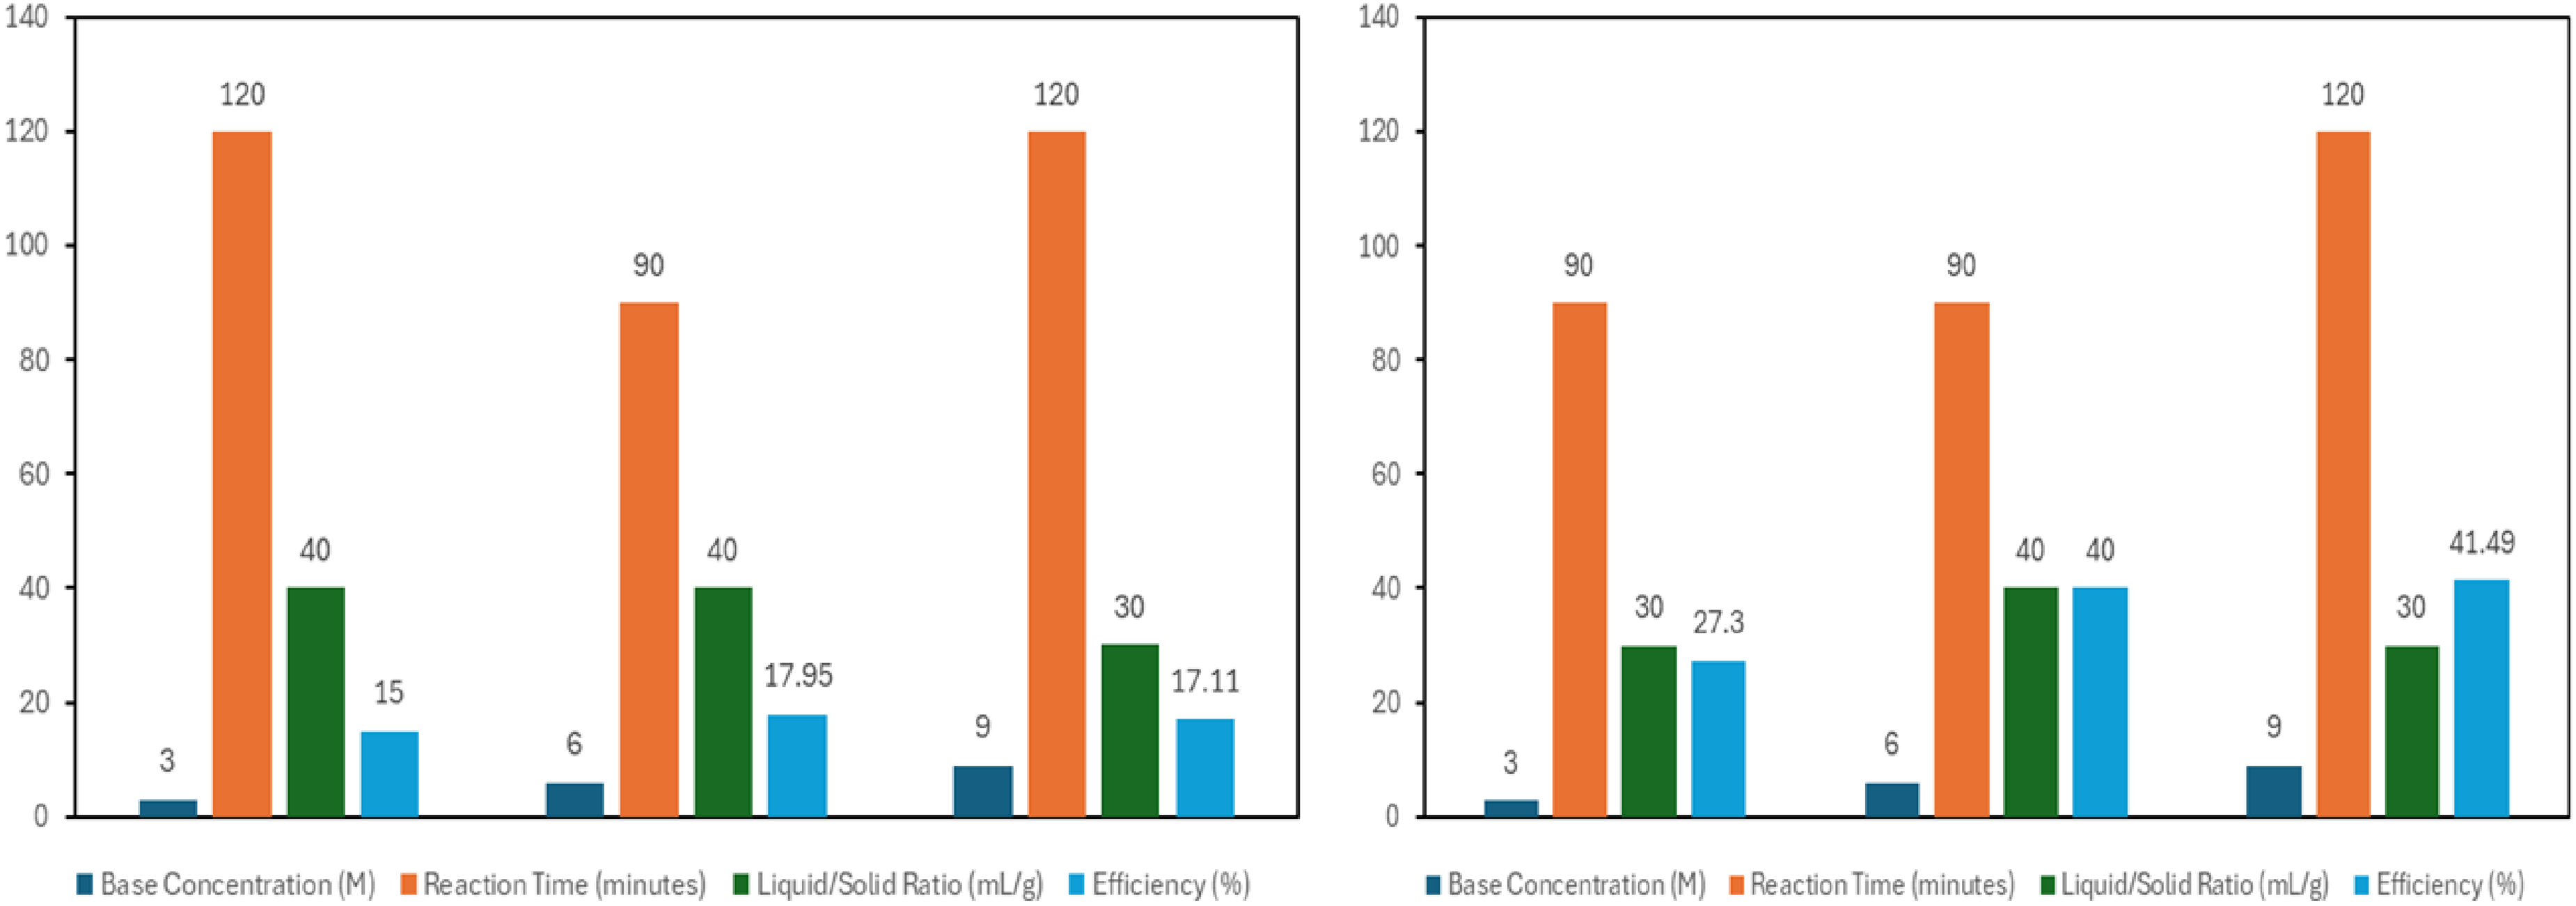
Efficiencies of silica and alumina extraction from sample B.
Effect of reagent concentration
As shown in Figure 7, varying NaOH concentrations ranging from 3 M to 9 M were used to investigate the effect of the base on the leaching of silica and alumina at room temperature. For the 3 M NaOH concentration experimental runs, peak silica and alumina extraction efficiencies of 15% and 27.3% were respectively obtained. For the 6 M base concentration, the peak silica and alumina extraction efficiencies respectively recorded were 17.95% and 40% suggesting a progressive increase in extraction efficiencies for both oxides with increase in base concentration. However, we observed a slight decline in extraction efficiency of silica to 17.11% with the application of the 9 M NaOH concentration but with a corresponding increase in alumina extraction to a peak value of 41.49%. A report by 36 suggests that the potency of reagents in solute dissolution increases under temperature and reaches a saturation point in the absence of heat. Thus, the slight decrease in silica extraction, among other factors may be ascribed to the absence of heat in the process. 37 indicated that reagent viscosity increases with concentration and therefore imposes limits on its ability to dissolve solute particles due to increased surface tension. 38 opined that the solubility of silica in alkali solution increases with the degree of amorphization. Amorphization herein refers to the state of fineness of the material which may have been influenced by experimental samples brief storage in sample bottles. We therefore suppose that the decline in extraction of silica after the application of the 6 M NaOH concentration in the current study may have been due to any of the following factors or a combination of both; (i) the limitations of greater surface tension imposed by increased viscosity arising from higher reagent concentration (ii) marginal reduction in the degree of amorphization of the fly ash samples used for the particular experimental batch during temporary storage in sample bottles prior the process.
Effect of reaction time
Figure 7 also presents the findings of the effect of time on silica and alumina extraction from sample B. Optimum silica extraction efficiency of 17.99% was recorded after 90 min. The decrease in silica extraction after 90 min is not particularly an unusual phenomenon in chemical reactions and may be ascribed to the following factors; (1) extractant saturation (2) reaction getting to a state of equilibrium in which the extraction rates equate back-extraction, culminating in a reduction in overall extraction and (3) degradation of the compound of interest overtime which lead to reduced efficiency. From the same sample, alumina extraction efficiency reached a peak of 41.49% after 120 min. This indicates an increase in extraction rate as time increased.39,40 Higher extraction efficiency is promoted by increase in residence time because there is sufficient opportunity for more solute molecules to dissolve and transfer from the solid phase into the solvent, achieving a greater equilibrium between the solute and solvent phases. 41
Effect of solid–liquid ratio
Figure 7 presents the effect of reagent volume to solid matter ratio on the extraction of silica and alumina from oven-roasted fly ash sample B. We observed that the 40 mL/g liquid–solid ratio yielded a peak silica extraction efficiency of 17.95% while a peak alumina extraction efficiency of 41.49% was recorded at 30 mL/g. In leaching process, the liquid to solid material ratio significantly influences the efficiency of the extraction of the compound of interest from the solid material. Higher liquid–solid ratio generally promotes greater availability of solvent which is needed for interaction with the solid providing a consequent increase in extraction efficiency. A point however reaches where further increase in reagent volume would only initiate diminishing returns such that the solid becomes saturated with the leachate: In as much as more solvent permits more solute dissolution, this can only occur to a point and is dependent on the solubility of the compound of interest in the leachate. 42 This may explain why optimum alumina extraction was observed at 30 mL/g liquid solid ratio and not at a highest liquid-solid ratio of 40 mL/g.
From the preceding discussion, we may conclude that the condition for the optimum extraction of silica from the 100 degrees-treated sample B are 6 molar base concentration, 90 min reaction time and at a liquid-solid ratio of 40 mL/g . The corresponding condition for optimum extraction of alumina from same sample is 9 molar base concentration, residence time of 120 min and at a 30 mL/g liquid-solid ratio.
Extraction of silica and alumina from sample C
Figure 8 provides a graphical explanation of the influence of process parameters on extraction of silica and alumina from sample C.
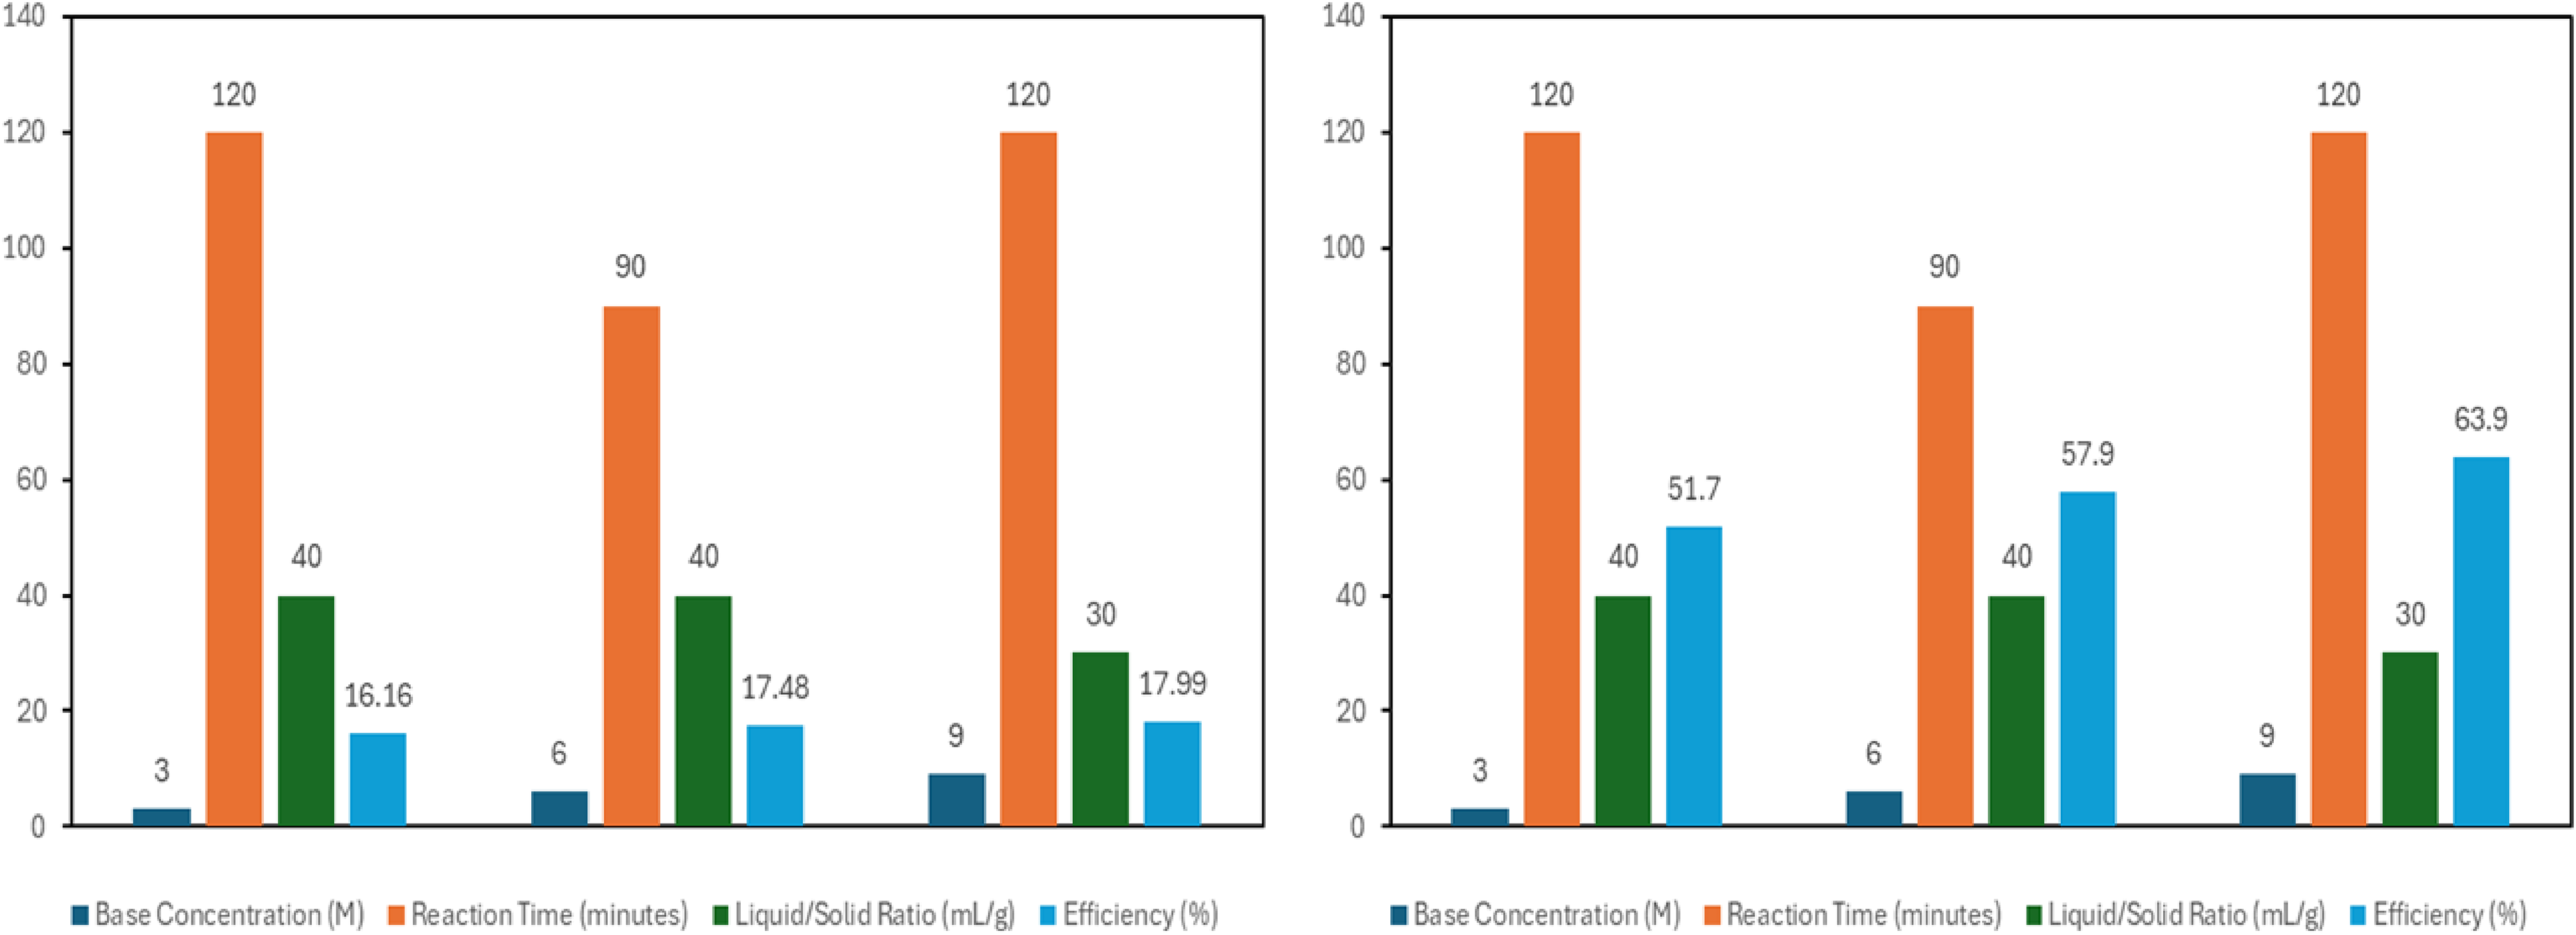
Graphical explanation of the influence of process parameters on extraction of silica and alumina from sample C.
Effect of reagent concentration
Figure 8 presents the effect of NaOH concentration on extraction of silica and alumina from sample C. Under the condition of 3 molar base application, silica and alumina extraction efficiencies reached values of 16.16% and 51.7% respectively. The 6 M NaOH concentration application resulted in silica and alumina peak yields of 17.48% and 57.9%. Silica and alumina optimum yields of 17.99% and 63.9% were respectively obtained under the condition of the 9 M base concentration. This indicates a progressive increase in extraction of both oxides with increase in base concentration. This trend may be ascribed to a number of factors namely; solubility and Le Chatelier's principle. Increased reagent concentration promotes higher solubility such that more of the solute is dissolved and extracted. 43 From the perspective of the Le Chatelier's principle, as reagent concentration increases, there is shift in the equilibrium towards the products, thereby increasing the amount of substance to be extracted. Higher reagent concentrations promote faster reaction rates which lead to higher efficiency of extraction. 44
Effect of time
The effect of silica and alumina extraction from sample C is also presented in Figure 8. We observed that silica and alumina extraction efficiencies reached respective peaks of 17.99% and 63.9% after 120 min, indicating increases in extraction with time. This phenomenon is in any case desirable in chemical reactions and may be ascribed to the following factors; (1) increased mass transfer in which, extended reaction time permits sufficient mass transfer between the reacting phases (2) adequate solubilization of the compound of interest (3) effective diffusion of the target compound from the solid phase to the liquid phase.
Effect of solid–liquid ratio
The effect of silica and alumina extraction from sample C is presented in Figure 8. We observed that silica and alumina extraction efficiencies reached respective peaks of 17.99% and 63.9% after 120 min, indicating increases in extraction with time. This phenomenon is in any case desirable in chemical reactions and may be ascribed to the following factors; (1) increased mass transfer in which, extended reaction time permits sufficient mass transfer between the reacting phases (2) adequate solubilization of the compound of interest (3) effective diffusion of the target compound from the solid phase to the liquid phase.
Efficiencies of silica and alumina extraction from sample D
Figure 9 in this section describes the graphical effect of process parameters on responses.
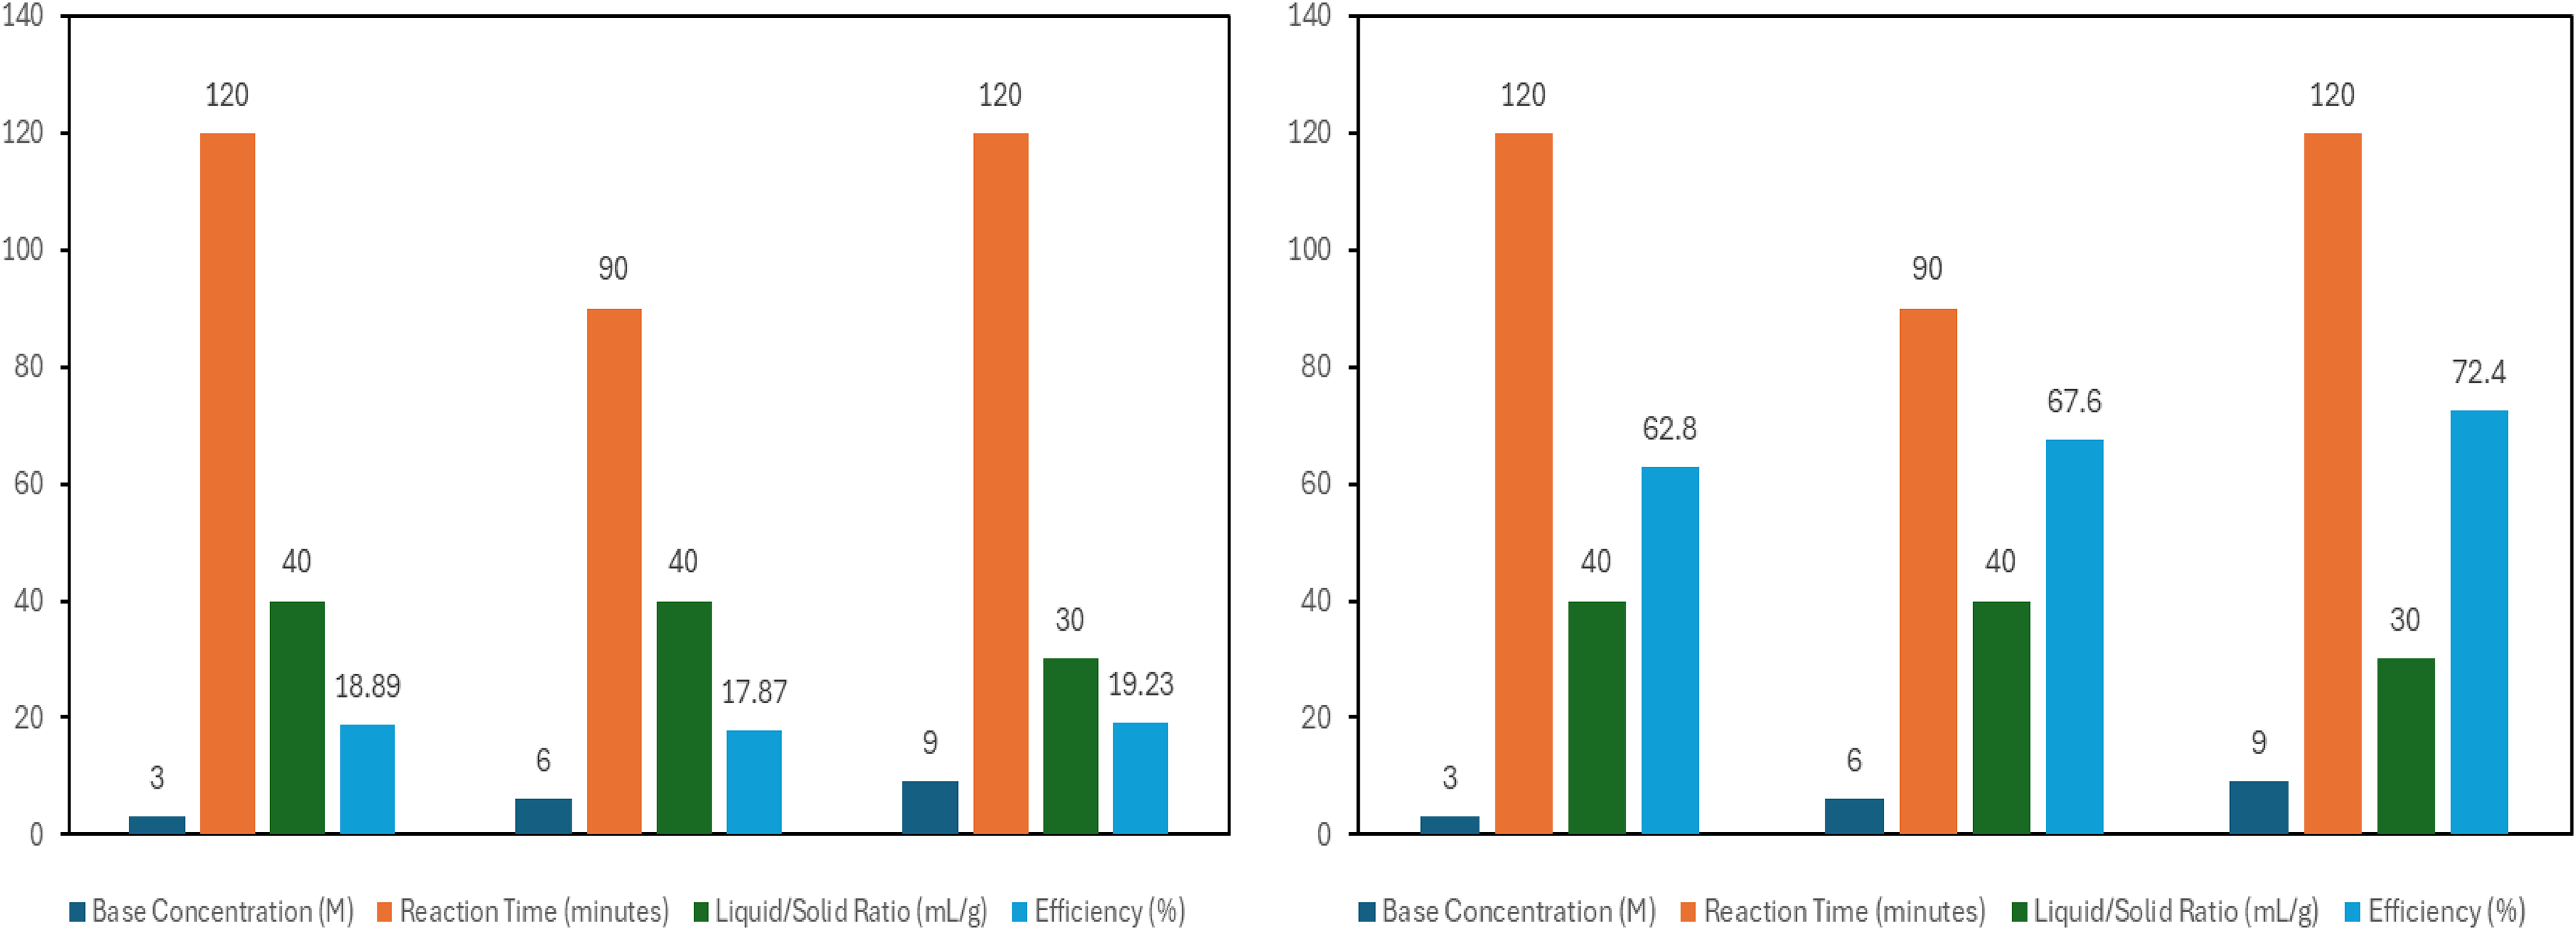
Graphical influence of process parameters on extraction of silica and alumina from sample D.
Effect of reagent concentration
As presented in Figure 9, silica extraction efficiencies of 18.89%, 17.87% and 19.23% were obtained at 3 M, 6 M and 9 M base concentrations respectively. It was expected that the 6 M NaOH concentration batch of the experimental runs would yield higher silica extraction than the 3 M concentration batch. The slight decline may be ascribed to coating of the surface of the reagent by iron-oxide present in the fly ash during the reaction which slowed the rate of silica dissolution for the 6 M base concentration experiment batch. This phenomenon of iron-oxide coating of the surface of the base is called armoring. Additional reason for this has been previously provided under the discussions of effects of reagent concentration on silica extraction from samples A and B. For alumina extraction, peak efficiencies of 62.8%, 67.6% and 72.4% were respectively observed at 3 M, 6 M and 9 M NaOH concentrations indicative of a progressive increase in alumina extraction with increase in the base concentration. This corroborates the assertion of 45 that corresponding increase in product yield with increase in reagent concentration is associated with many chemical reactions involving dissolution of solid particles.
Effect of time
Figure 9 shows the findings of the effect of reaction time on extraction of silica and alumina from sample D. The effect of time on the efficiency of silica extraction showed that after 120 min, silica extraction reached its peak values of 19.23%. In the same sample, optimum extraction efficiency of 72.4% was obtained after 120 min for alumina. Consequently, it was observed that silica and alumina extractions increased with time for sample D.
Effect of solid–liquid ratio
Figure 9 also shows the effect of reagent volume to solid fly ash ratio on silica and alumina extraction from sample D. The effect of the ratio of volume of reagent to solid material on the efficiency silica extraction showed that under the condition of 30 mL/g, silica extraction reached an optimum value of 19.23%. As also showcased on Figure 9, alumina extraction reached an optimum value of 72.4% under the solid–liquid condition of 30 mL/g.
We may conclude this section by stating that optimum silica and alumina extraction condition occurred at 9 M NaOH, reaction time of 120 min and at 30 mL/g liquid-solid liquid ratio
Comparative analysis of the desilication studies
The outcome of the desilication study is comparatively presented on Table 2. In addition, SEM-EDS images recorded of the fly ash residues acquired from samples B (Figure S1), C (Figure S2) and D (Figure S3) at optimum conditions are also presented in this section (See Figures S 1, S2 and S3 in the supplementary data).
Comparative quantitative silica and alumina extraction from pre-treated samples at optimum conditions.
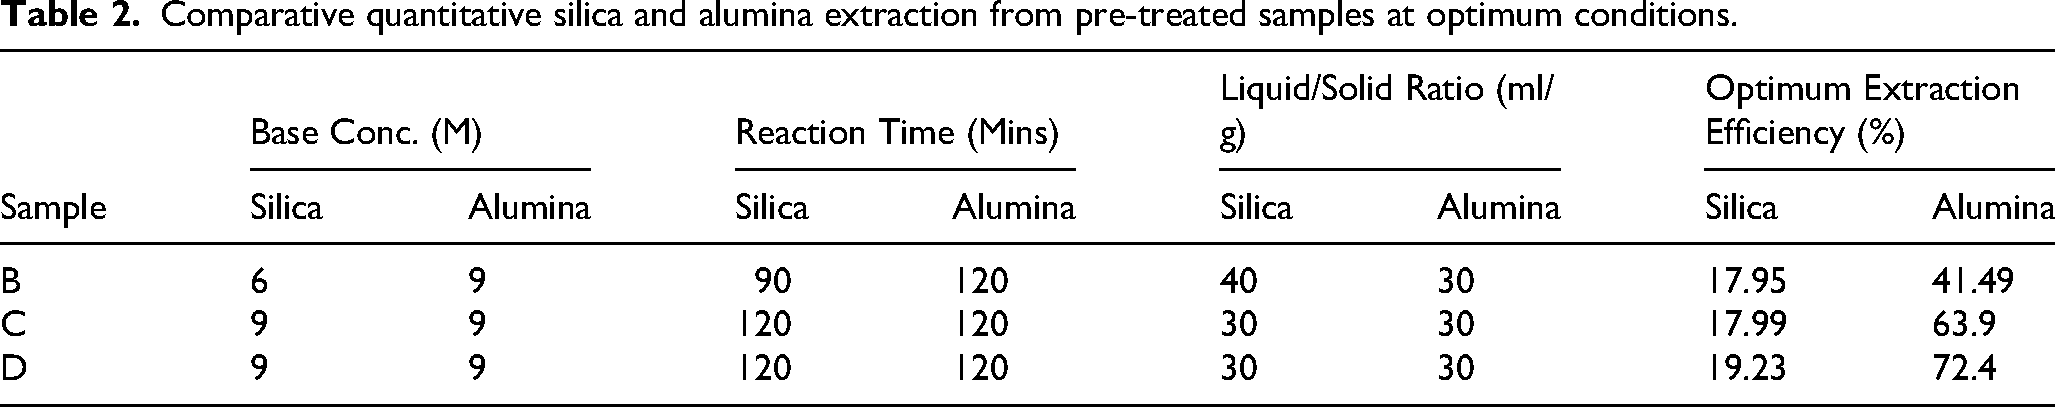
It was observed that the optimum quantitative silica and alumina extractions of 19.23% and 72.4% were respectively obtained from sample D compared to silica and alumina extraction values of 17.99% and 63.9% and 17.95% and 41.49% respectively from samples C and B. A progressive quantitative desilication along with alumina recovery can be observed over temperature changes associated with samples B, C and D. In addition, the SEM-EDS images recorded of the fly ash residues acquired from samples B (Figure S1 i, ii), C (Figure S2 i, ii) and D (Figure S2 i, ii) at optimum conditions indicated the presence of silica and alumina suggesting that the materials co-extracted were indeed silica and alumina. (See figures S1, S2 and S3 in supplementary data) This validates the claim that silica extraction was greatest for the 300 degrees-roasted sample D. Therefore, the results in the current study show that silica can be successfully extracted from fly ash via leaching with NaOH solution. Given the same leaching conditions, a higher quantity of silica was extracted from sample D. It can be concluded from this comparative discussion that at optimum conditions, silica was successfully extracted from the samples as follows; B (17.95%), C (17.99%) and D (19.23%). On the basis of the forgoing analysis, sample D was chosen for the acid-leaching stage.
Conclusions
We generally observed a continuous but incomplete disappearance of irregular particles in roasted fly ash samples as shown in the SEM images.
Studies on SEM-EDS images also showed that preliminary roasting promoted dissolution of the mass of the amorphous glass from the surface of the spherical agglomerates.
The microscopic observations of all fly ash samples permitted us to distinguish between the transformed minerals phases as follows; spherical solid, irregular solid, irregular porous and fine. The results in the current study show that silica can be successfully extracted from fly ash via leaching with NaOH solution at room temperature.
At optimum conditions, silica was successfully extracted from the samples; B (16.31%), C (16.81%) and D (17.84%) at room temperature. Note that Samples B, C and D are the samples treated at 100, 200 and 300 degrees respectively. Thus, a progressive quantitative desilication along with alumina recovery can be observed over temperature changes associated with samples B, C and D.
On the basis of the forgoing analysis, sample D was chosen for the acid-leaching stage and will be reported in part B of this study.
The study recommends that optimum roasting temperature of fly ash with additive be determined in future studies given that low temperatures may not support adequate breakdown of fly ash while excessive temperature can cause loss of reagent via evaporation which can minimize eventually efficiency of target elements. The authors also recommend future studies on extended thermal treatment with higher quantity of reagent.
Supplemental Material
sj-docx-1-mpe-10.1177_25726641251401706 - Supplemental material for A comparative two-stage, low temperature extraction of silica and alumina from coal fly ash to facilitate acid leaching of rare earth elements
Supplemental material, sj-docx-1-mpe-10.1177_25726641251401706 for A comparative two-stage, low temperature extraction of silica and alumina from coal fly ash to facilitate acid leaching of rare earth elements by Theophilus Ile Ojonimi, Janne Pesonen, Ferdinard Asuke, Ramalan Aliyu Mohammed, Kasim Auwal, Tao Hu and Ilemona Okeme in Mineral Processing and Extractive Metallurgy
Footnotes
Acknowledgements
The Nigerian Tertiary Education Trust Fund (TETFUND) supported the upkeep of the first author during his research visit at the research unit of Sustainable Chemistry, University of Oulu, Finland. The authors would like to thank laboratory technicians Mikko Häkkinen and Markus Väyrynen for the chemical analyses.
Author contributions
Conceptualization: Theophilus I. Ojonimi. Data Curation: Janne Pesonen, Ferdinard Asuke, Aliyu Mohammed Ramalan, Tao Hu. Formal Analysis: Theophilus I. Ojonimi. Funding Acquisition: Theophilus I. Ojonimi and Janne Pesonen. Investigation: Theophilus I. Ojonimi and Janne Pesonen. Methodology: Theophilus I. Ojonimi, Ferdinard Asuke and Aliyu Mohammed Ramalan. Project administration: Theophilus I. Ojonimi and Janne Pesonen. Software: Theophilus I. Ojonimi. Supervision: Ferdinard Asuke, Aliyu Mohammed Ramalan and Janne Pesonen. Writing–original draft: Theophilus I. Ojonimi. Writing–review and editing: Theophilus I. Ojonimi, Janne Pesonen and Ilemona Okeme.
Funding
The authors disclosed receipt of the following financial support for the research, authorship, and/or publication of this article: This work was supported by the Nigerian Tertiary Education Trust Fund,
Declaration of conflicting interests
The authors declared no potential conflicts of interest with respect to the research, authorship, and/or publication of this article.
Data availability
Raw data were generated at the research unit of Sustainable Chemistry, University of Oulu, Finland. Derived data supporting the findings of this study are available on request from the corresponding author, Janne Pesonen.
Supplemental material
Supplemental material for this article is available online.
References
Supplementary Material
Please find the following supplemental material available below.
For Open Access articles published under a Creative Commons License, all supplemental material carries the same license as the article it is associated with.
For non-Open Access articles published, all supplemental material carries a non-exclusive license, and permission requests for re-use of supplemental material or any part of supplemental material shall be sent directly to the copyright owner as specified in the copyright notice associated with the article.