
Abstract
Background
Alzheimer's disease (AD) and vascular dementia (VaD) share overlapping pathophysiological characteristics, yet comparative genetic studies are rare. Understanding these overlaps may aid in identifying common diagnostic markers and therapeutic targets.
Objective
This study identifies shared diagnostic genes and mechanisms linking AD and VaD.
Methods
Datasets GSE5281 and GSE122063 from the GEO database were used to identify differentially expressed genes (DEGs). Intersection DEGs were analyzed using KEGG and GO enrichment to explore signaling pathways. A PPI network was constructed, and LASSO and SVM-RFE were applied to identify core genes. CIBERSORT assessed immune cell composition and their relationship with core genes. Diagnostic efficacy was evaluated using ROC curves, nomogram, and Decision Curve Analysis (DCA). Core genes were used to identify characteristic genes in various brain regions of AD patients.
Results
The analysis identified 9021 DEGs for AD and 373 DEGs for VaD, with 74 co-expressed genes and 8 core genes. ROC curves, nomogram, and DCA indicated high diagnostic accuracy. Core gene analysis revealed differential expression of characteristic genes in various brain regions of AD patients.
Conclusions
This research identified 74 co-expressed genes and 8 pivotal diagnostic genes. These genes likely play roles in signal transduction, neuroinflammation, and autophagy in both AD and VaD. The findings offer potential targets for future research and clinical interventions. Further research should use larger, more diverse datasets and incorporate custom NGS panels to identify novel genetic variants, enhancing precise diagnostic and therapeutic strategies.
Introduction
Alzheimer's disease (AD), the predominant cause of dementia, accounts for 60–80% of cases, 1 marked by senile plaques, amyloid angiopathy, and neurofibrillary tangles.2,3 While a minority of AD cases are early-onset, 4 the majority are late-onset AD (LOAD), influenced by factors such as diet, physical activity, diabetes, and cerebrovascular diseases.5–7
Vascular dementia (VaD), the second most prevalent type of dementia, accounts for 5–10% of cases and results from ischemic or hemorrhagic brain damage due to vascular diseases. The primary etiology involves damage to cerebral blood vessels, leading to insufficient blood supply, oxygen, or nutrients to the brain tissue, subsequently manifesting as symptoms of dementia. 1 Pathophysiological mechanisms include hypoperfusion, oxidative stress, and inflammation, leading to endothelial cell damage, blood-brain barrier disruption, and subsequent brain cell dysfunction. 8 Risk factors for VaD, such as advanced age, hypertension, type 2 diabetes, and hypercholesterolemia, significantly overlap with those for AD. 9
Clinically, AD and VaD manifest similarly, with symptoms like memory loss and personality changes, and both conditions’ incidence rates rise with age, unaffected by gender. 10 Recent studies highlight a pathogenic overlap between AD and VaD, often linked to cerebrovascular abnormalities. In AD patients: Firstly, the prevalence of cerebrovascular disease is higher than in the general population. 11 Secondly, symptomatic dementia patients often exhibit both AD and cerebrovascular pathology in their pathology. 12 Similarly, AD patients with stroke and cerebrovascular-related brain damage are more likely to present dementia symptoms in clinical settings.13,14 Notably, research suggests an increased risk of hemorrhagic stroke and subsequent VaD in AD patients with increased amyloid deposition in cerebrovascular. 15 In VaD patients: Firstly, cerebrovascular lesions are prerequisites for diagnosing VaD. Secondly, compared to elderly individuals without cerebrovascular disease, as age increases, VaD patients accumulate more amyloid-β (Aβ) in the cerebral cortex. The reason may be ischemia-induced cortical arteriole amyloid deposition, the formation of neurofibrillary tangles, induction of disruption in neurovascular coupling, reduced cerebral blood flow, increased susceptibility of neurons to hypoxia-ischemia, ultimately leading to neuronal death. 16 Additionally, recent studies have increasingly recognized that sleep disorders may play a significant role in the progression of both VaD and AD. The glymphatic system, responsible for facilitating fluid flow in the brain, is typically suppressed during wakefulness. The glymphatic system enables fluid and solute exchange between the cerebrospinal fluid (CSF) and interstitial compartments, thereby promoting the clearance of waste and metabolites from the brain parenchyma.17–19 Disruptions in sleep architecture and depth can markedly impair the clearance of CSF and the subsequent removal of protein waste, leading to stagnant interstitial flow. This stagnation fosters the accumulation of Aβ, exacerbating neuroinflammation and accelerating neurodegeneration.20,21 Moreover, cerebrovascular abnormalities can disrupt the balance between local metabolic demand and blood supply, resulting in a reduction of CSF and intracranial fluid matrix, which further impairs waste clearance within the brain. In summary, AD and VaD not only share many clinical and pathophysiological features, but also exhibit significant similarities in their underlying mechanisms, particularly concerning cerebrovascular health and glymphatic system. Despite these similarities, there remains a significant gap in our understanding of their genetic overlaps, highlighting the need for further research to explore these commonalities and improve our approach to diagnosis and treatment.
This study aims to elucidate shared diagnostic genes and potential mechanisms between AD and VaD using datasets GSE5281 and GSE122063 from the GEO database. We identified differentially expressed genes (DEGs) and performed biological pathway enrichment and immune infiltration analyses. Intersection DEGs were used to construct a protein-protein interaction (PPI) network, followed by machine learning techniques to identify core genes. Diagnostic performance was assessed using ROC curves, nomogram, and decision curve analysis (DCA). We further analyzed characteristic genes in different brain regions of AD patients based on these key genes.
Materials and methods
Data source and study procedures
We obtained gene expression datasets from the GEO database (https://www.ncbi.nlm.nih.gov/geo/). The GSE122063 dataset comprises 11 control samples (5 males, 6 females, with an average age of 81.6 years) and 8 VaD samples (4 males, 4 females, with an average age of 78.8 years). 22 These samples were all derived from the frontal cortex or temporal cortex. The GSE5281 dataset includes 74 control samples (43 males, 31 females, with an average age of 83.2 years) and 87 AD samples (46 males, 41 females, with an average age of 79.9 years), 23 collected from six brain regions, including the entorhinal cortex, hippocampus, medial temporal gyrus and more. These datasets were selected based on their relevance to AD and VaD and the availability of comprehensive clinical and molecular data. The research workflow is illustrated in Figure 1.
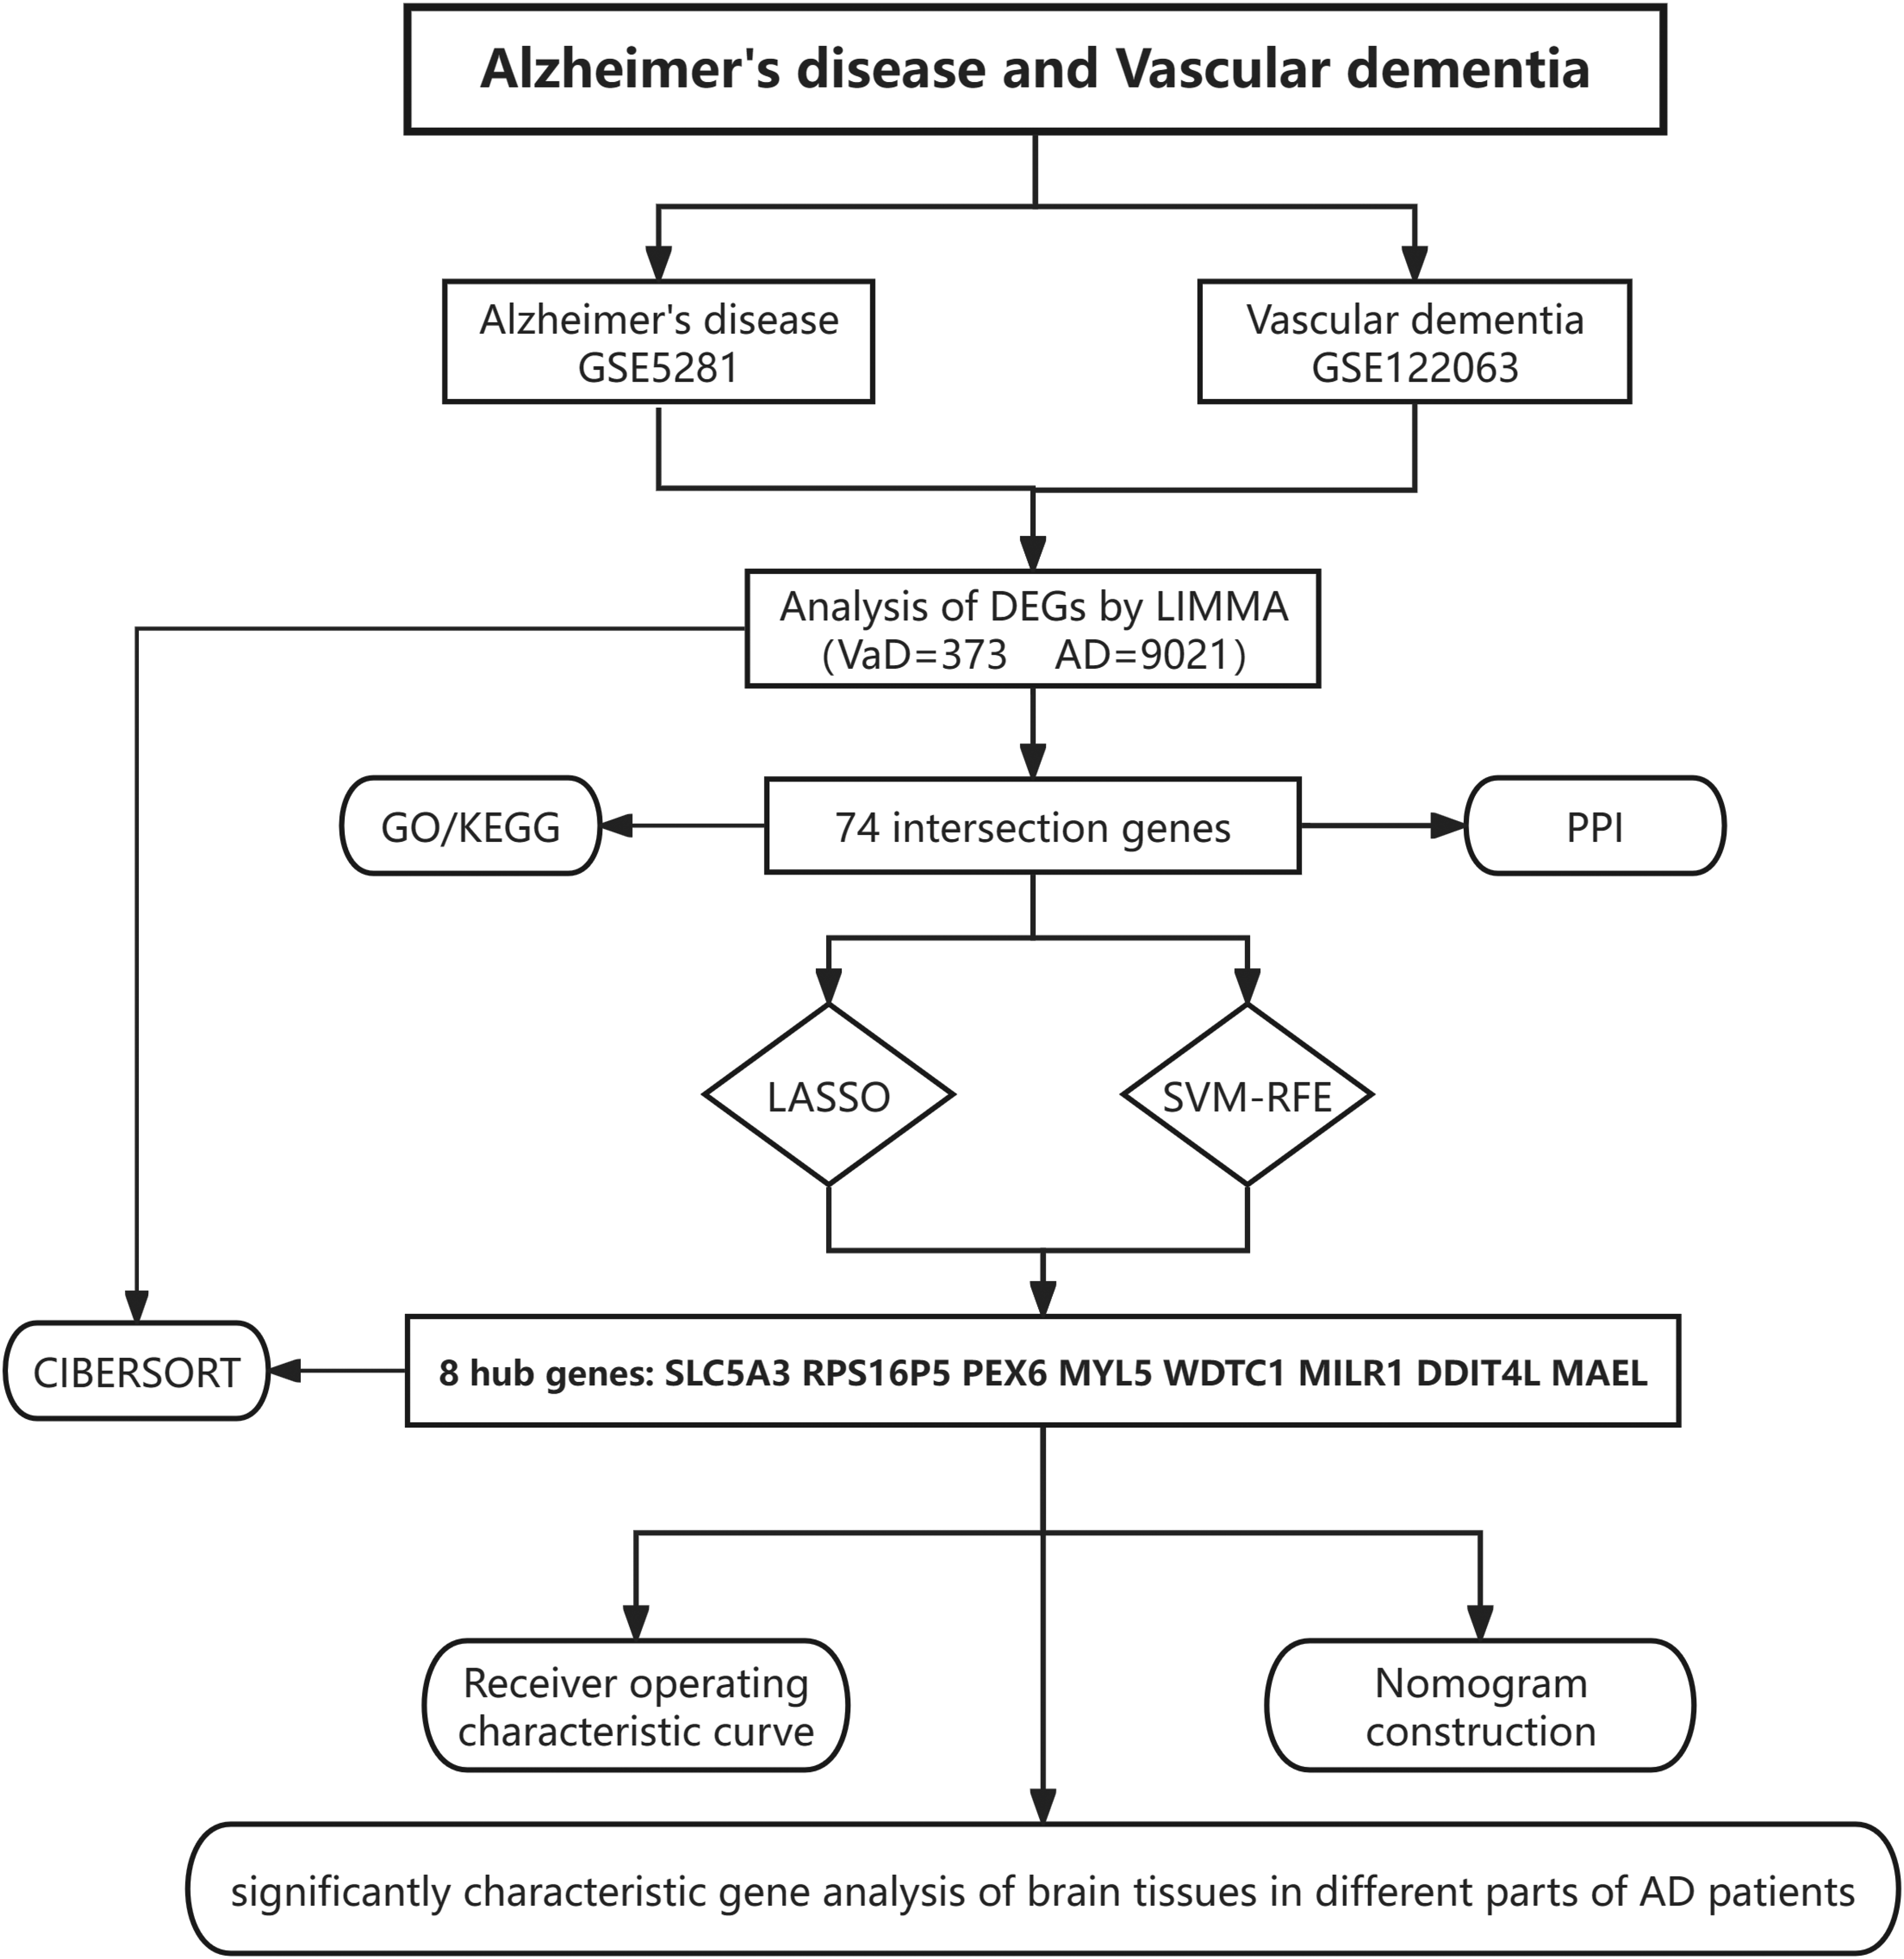
Workflow of the analysis.
Differentially expressed gene screening
We analyzed DEGs between the VaD and control groups using adjusted p-values (padj) < 0.05 and |logFold change (FC)| > 1 in the GSE122063 dataset. Similarly, DEGs between AD and control groups were analyzed with padj < 0.05 and |logFC| > 1 in the GSE5281 dataset. These analyses were conducted using the Limma package in R, which applies empirical Bayes methods to estimate gene expression changes.
Functional enrichment analysis of DEGs
We identified 74 intersecting DEGs. To explore the biological functions of these genes, we used the DAVID online database for Gene Ontology (GO) and Kyoto Encyclopedia of Genes and Genomes (KEGG) analyses. The results were visualized using R software, with padj < 0.05 as the threshold for significance.
Protein-protein interaction network analysis
The STRING database (http://string-db.org/) was used to predict protein functional associations and analyze PPI information. We constructed a PPI network with the 74 co-expressed genes and visualized it using Cytoscape software (http://www.cytoscape.org/), filtering out proteins with low correlation scores to ensure robustness.
Machine learning
To further investigate potential diagnostic genes for VaD and AD, we conducted LASSO (Least Absolute Shrinkage and Selection Operator) and SVM-RFE (Support Vector Machine-Recursive Feature Elimination) analyses. LASSO aids in variable selection by shrinking coefficients to zero, while SVM-RFE is a backward selection method providing feature ranking based on importance. We used the ‘glmnet’ and ‘e1071’ packages in R, employing cross-validation to ensure model stability. The intersection of the results from these two methods identified candidate pivotal genes for diagnosis.
Immune infiltration analysis
To estimate immune cell infiltration based on gene expression profiles, we used the ‘preprocessCore’ package and the leukocyte gene signature set (LM22). We assessed the proportions of 22 immune cell types in both VaD and AD groups. The proportions were visualized using bar graphs in R, and the relationships between hub gene expression and immune cells were depicted through a heatmap.
Diagnosis value evaluation
The machine learning methods identified key diagnostic genes. We initially used ROC curves to evaluate the diagnostic predictive value of the hub genes. Based on the ROC results, those with poor predictive value were excluded. We then employed a nomogram using the ‘ggDCA,’ ‘regplot,’ and ‘rmda’ packages in R. DCA and clinical impact curves (CIC) were used to further assess the clinical utility and impact of the diagnostic genes.
Significantly characteristic gene analysis
In the GSE5281 dataset, gene samples were collected from six different brain regions of both AD patients and normal individuals. To investigate the differential expression of the core genes across these regions, we used R to identify significantly differentially expressed genes, applying appropriate statistical thresholds to ensure robustness.
Results
Identification of DEGs associated with the progression of VaD and AD
In the GSE122063 dataset, we identified a total of 373 DEGs, with a notable number of genes being upregulated (125 genes) and downregulated (248 genes) in the disease group compared to controls. Similarly, in the GSE5281 dataset, a substantial number of DEGs were observed, including 2503 upregulated and 6518 downregulated genes. These findings, as visualized in Figures 2A-D, demonstrate the extensive gene expression changes associated with the progression of VaD and AD, highlighting significant molecular alterations between the control and disease groups. Some genes exhibited very high fold changes, particularly in Figure 2C, where values reached 500 or even 1000. These large fold changes result from substantial differences in gene expression between the control and disease groups, likely reflecting significant alterations in gene activity that occur during the progression of VaD and AD. The heatmaps revealed substructures, likely due to biological variability within the samples. Despite normalization, these patterns suggest that future studies with more homogeneous samples could further clarify the molecular mechanisms of VaD and AD.
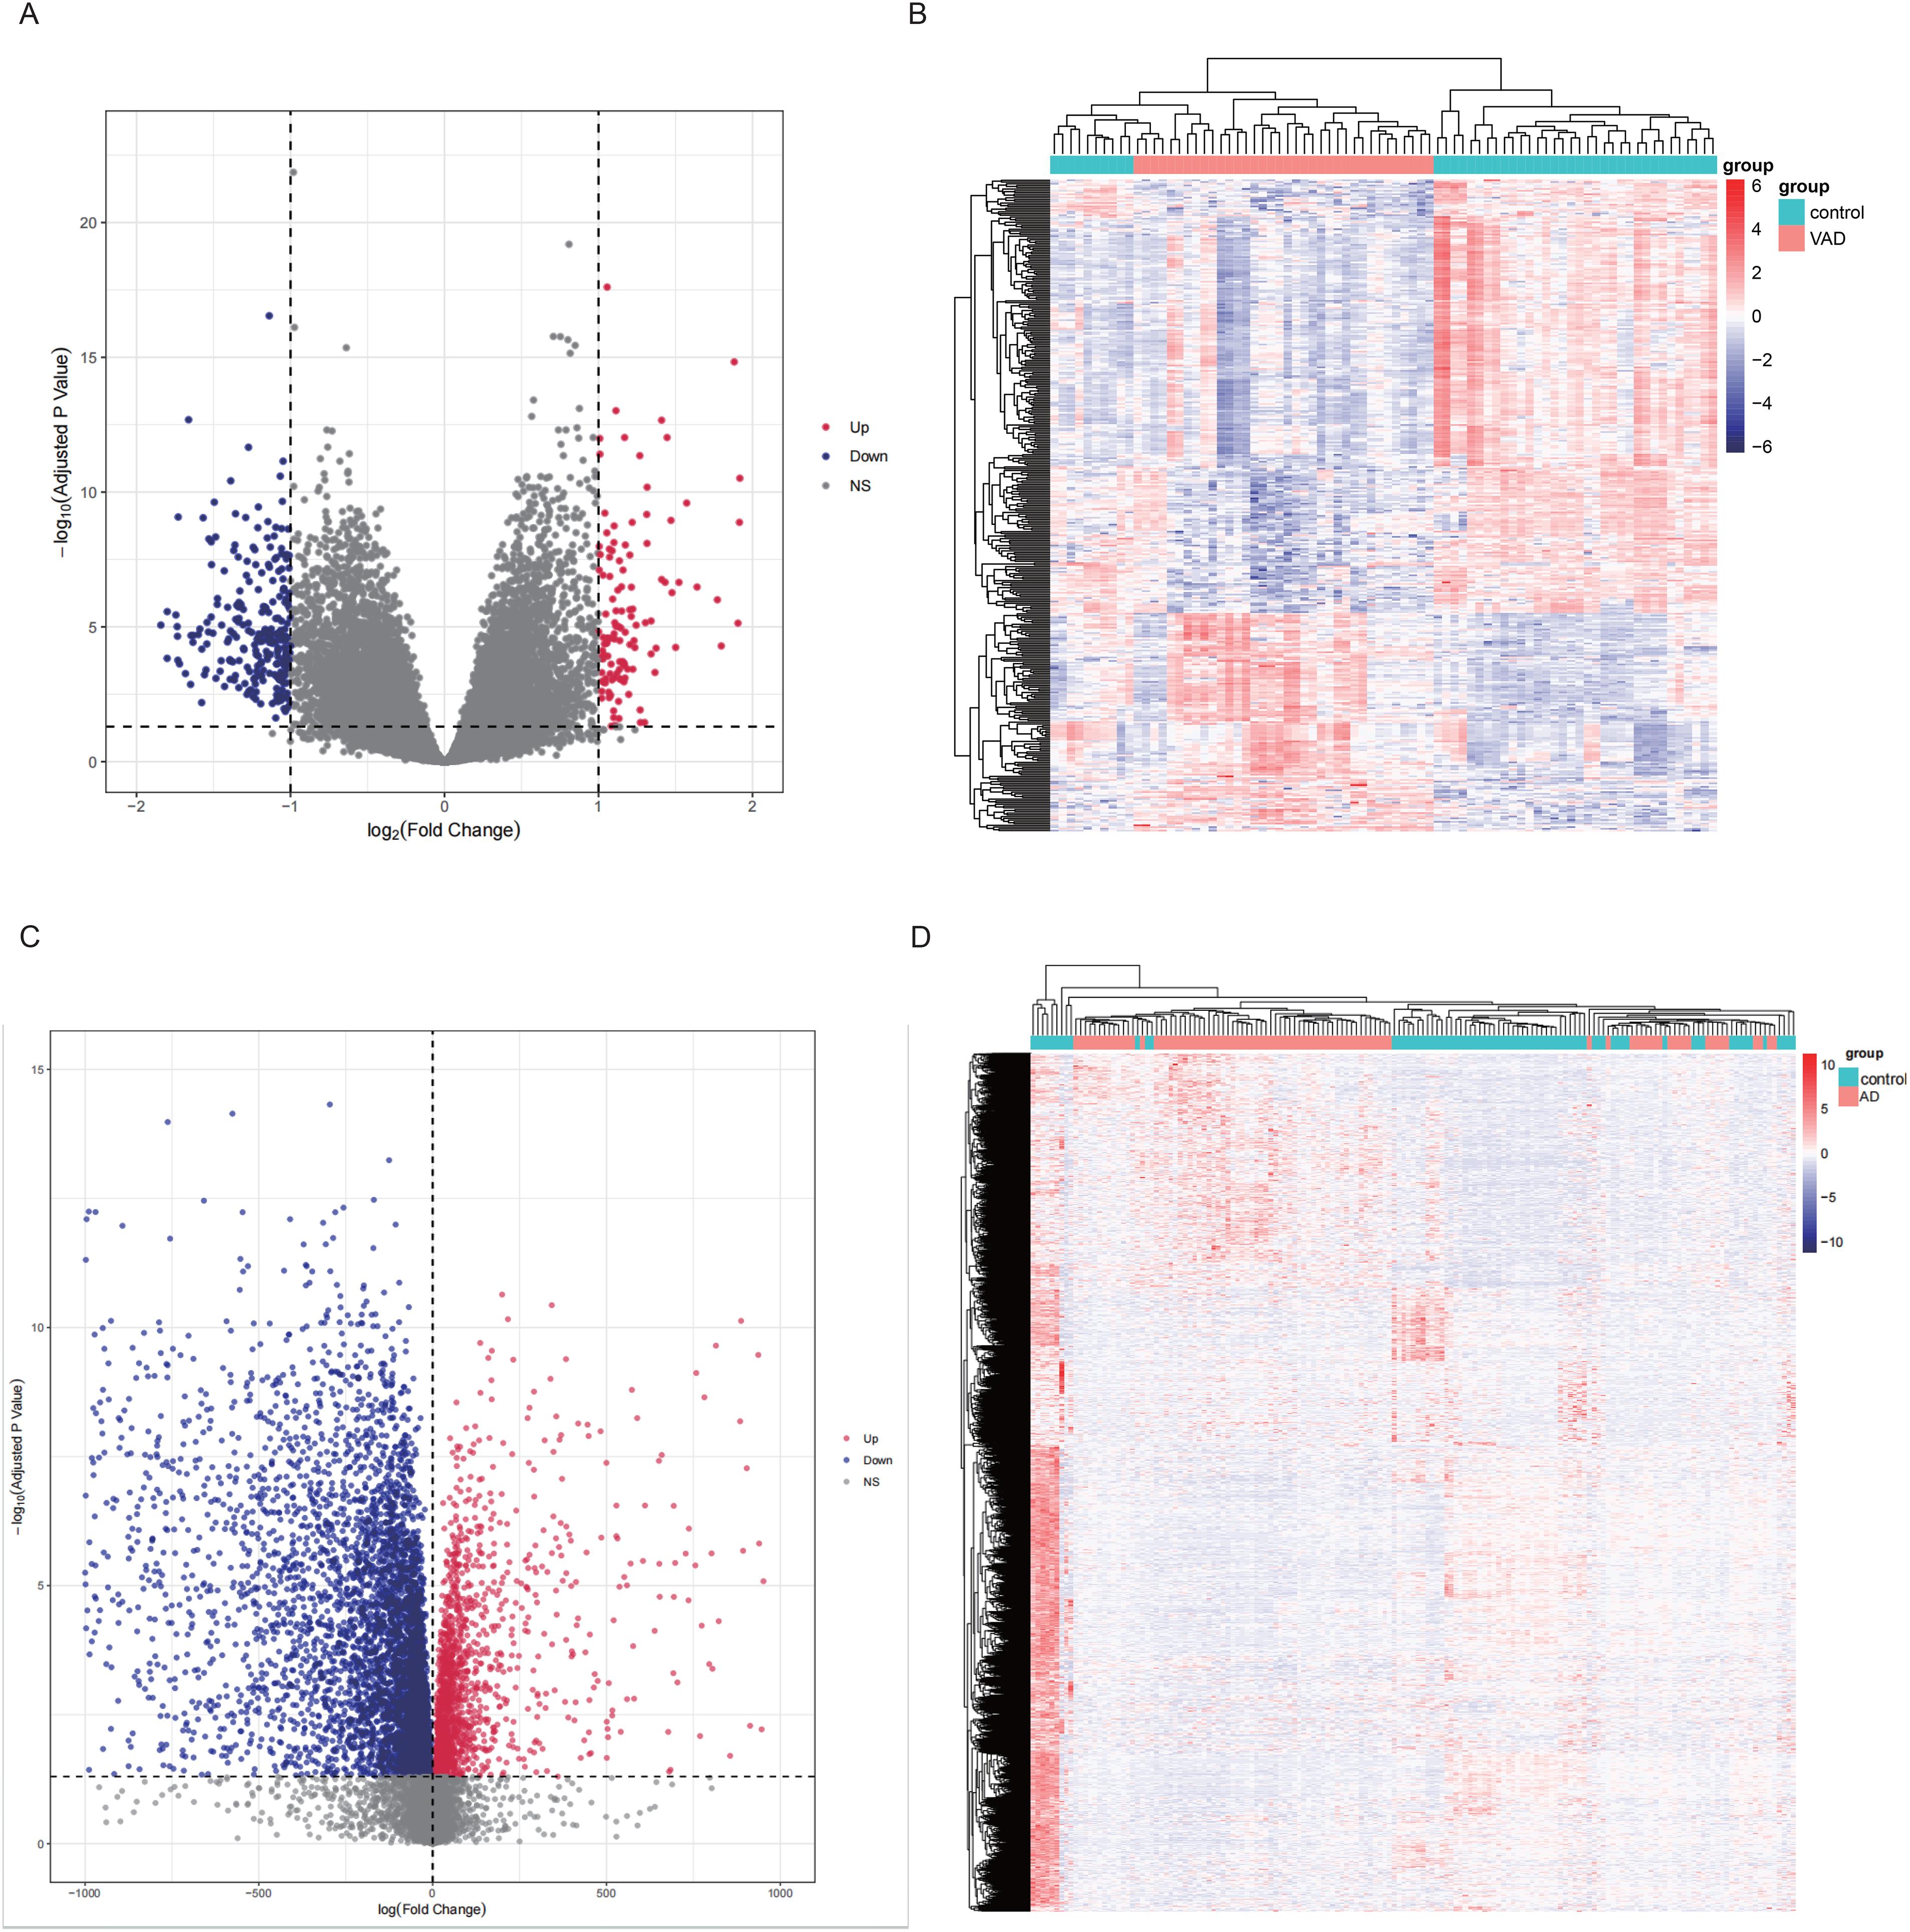
Identification of DEGs associated with the progression of Vad and AD. (A) Volcano plot showing DEGs in VaD patients, with red indicating higher expression and blue indicating lower expression. (B) Heatmap of DEGs in VaD versus control groups. (C) Volcano plot showing DEGs in AD patients, with red indicating higher expression and blue indicating lower expression. (D) Heatmap of DEGs in AD versus control groups.
Functional enrichment analysis in co-DEGs
To investigate the potential mechanisms and commonalities between VaD and AD, we conducted functional annotation and enrichment analysis on the intersecting DEGs. After intersection, we identified 74 co-expressed genes (Figure 3A) and performed GO and KEGG analyses on these genes using the DAVID online database, with the results visualized in R language as shown in Figure 3B. The findings indicate that these 74 genes are involved in several biological processes (BP), including the cytokine-mediated signaling pathway, cell surface receptor signaling pathway, response to insulin, regulation of organ growth, and positive regulation of protein modification process. In the cellular component (CC) category, these genes are closely associated with blood microparticles; in the molecular function (MF) category, they show involvement in manganese ion binding. KEGG analysis suggests that these shared genes may be related to Neuroactive ligand-receptor interaction. Overall, the pathways involving these shared genes are relatively unified, possibly playing a significant role in cell surface receptors, especially about the neuroactive ligand-receptor interactions.
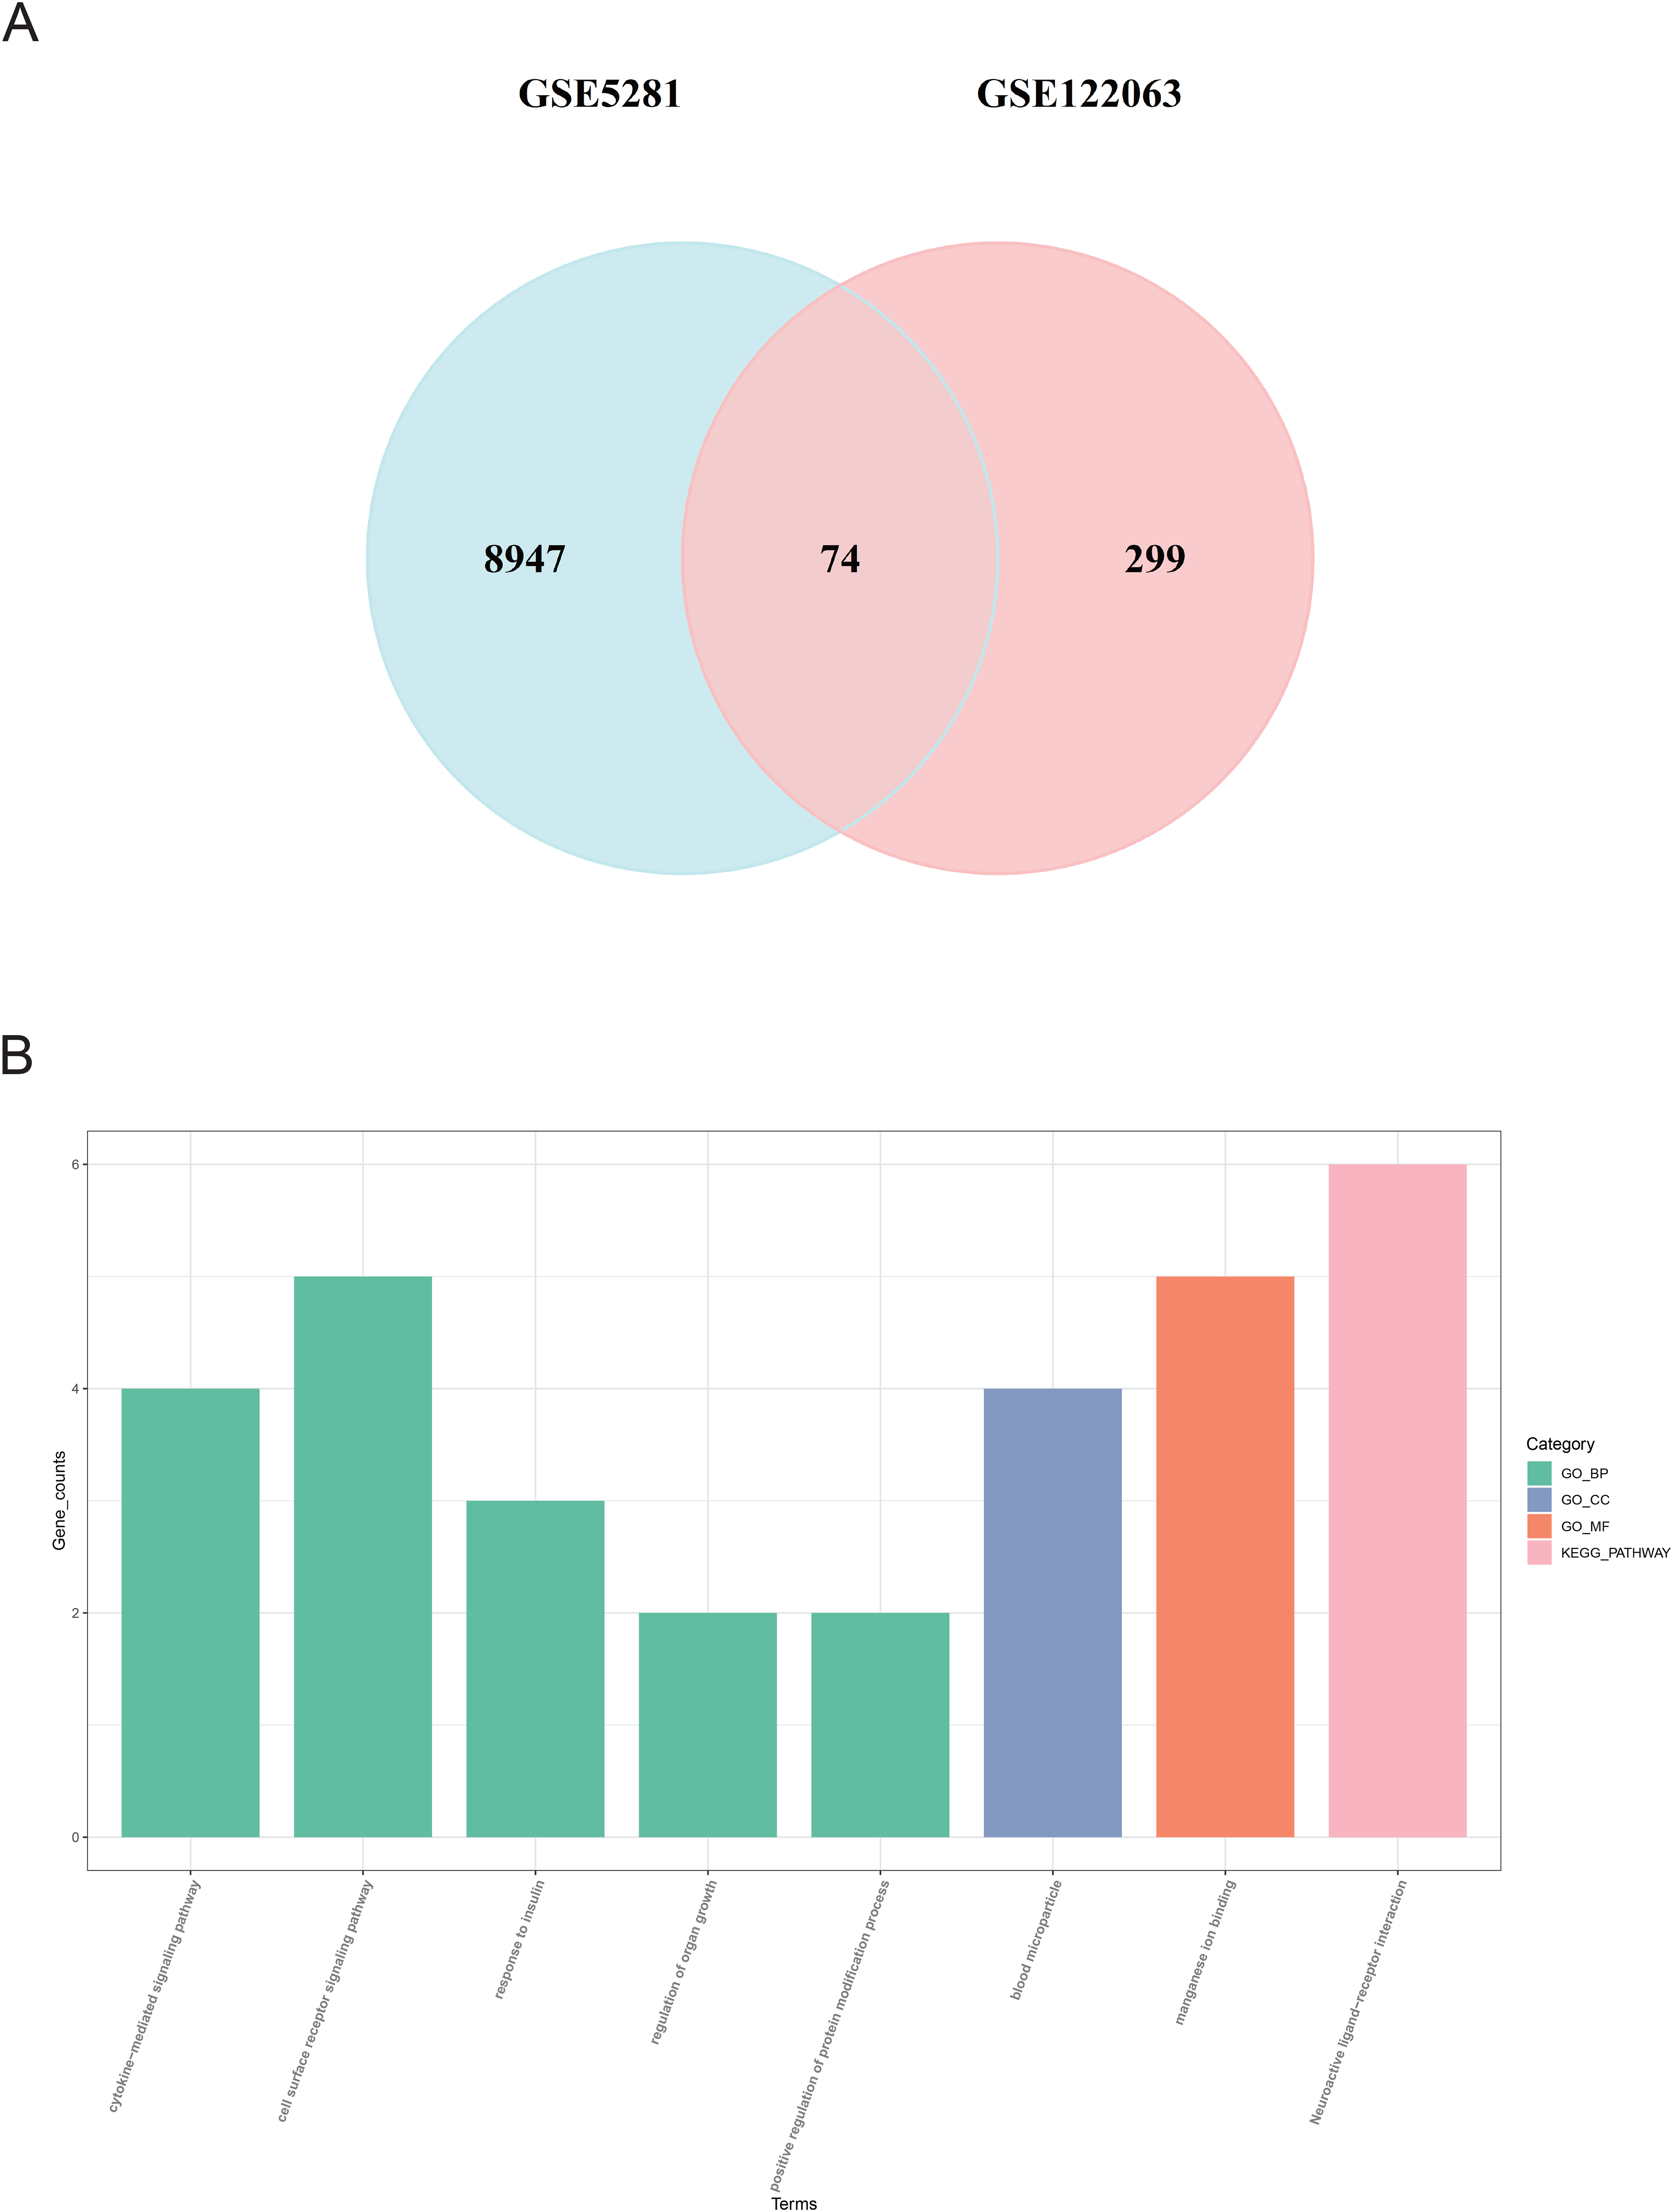
(A) Venn diagram showing the overlap of DEGs between two GEO datasets. (B) GO and KEGG enrichment analysis results using the DAVID online database, with different colors representing different functional categories such as biological processes, molecular functions, and cellular components.
Protein–protein intersection network construction
The 74 intersecting genes were input into the STRING database to predict protein-protein interactions, and the results were visualized using Cytoscape. Genes with lower connectivity were filtered out, and Betweenness Centrality (BC) was used for ranking. The most significant protein identified was Chemokine (C-C motif) ligand 2 (CCL2), a known chemoattractant for various immune cells and a potential therapeutic target for diseases such as atherosclerosis, multiple sclerosis, neuropathic pain, and cancer (Figure 4A). 24
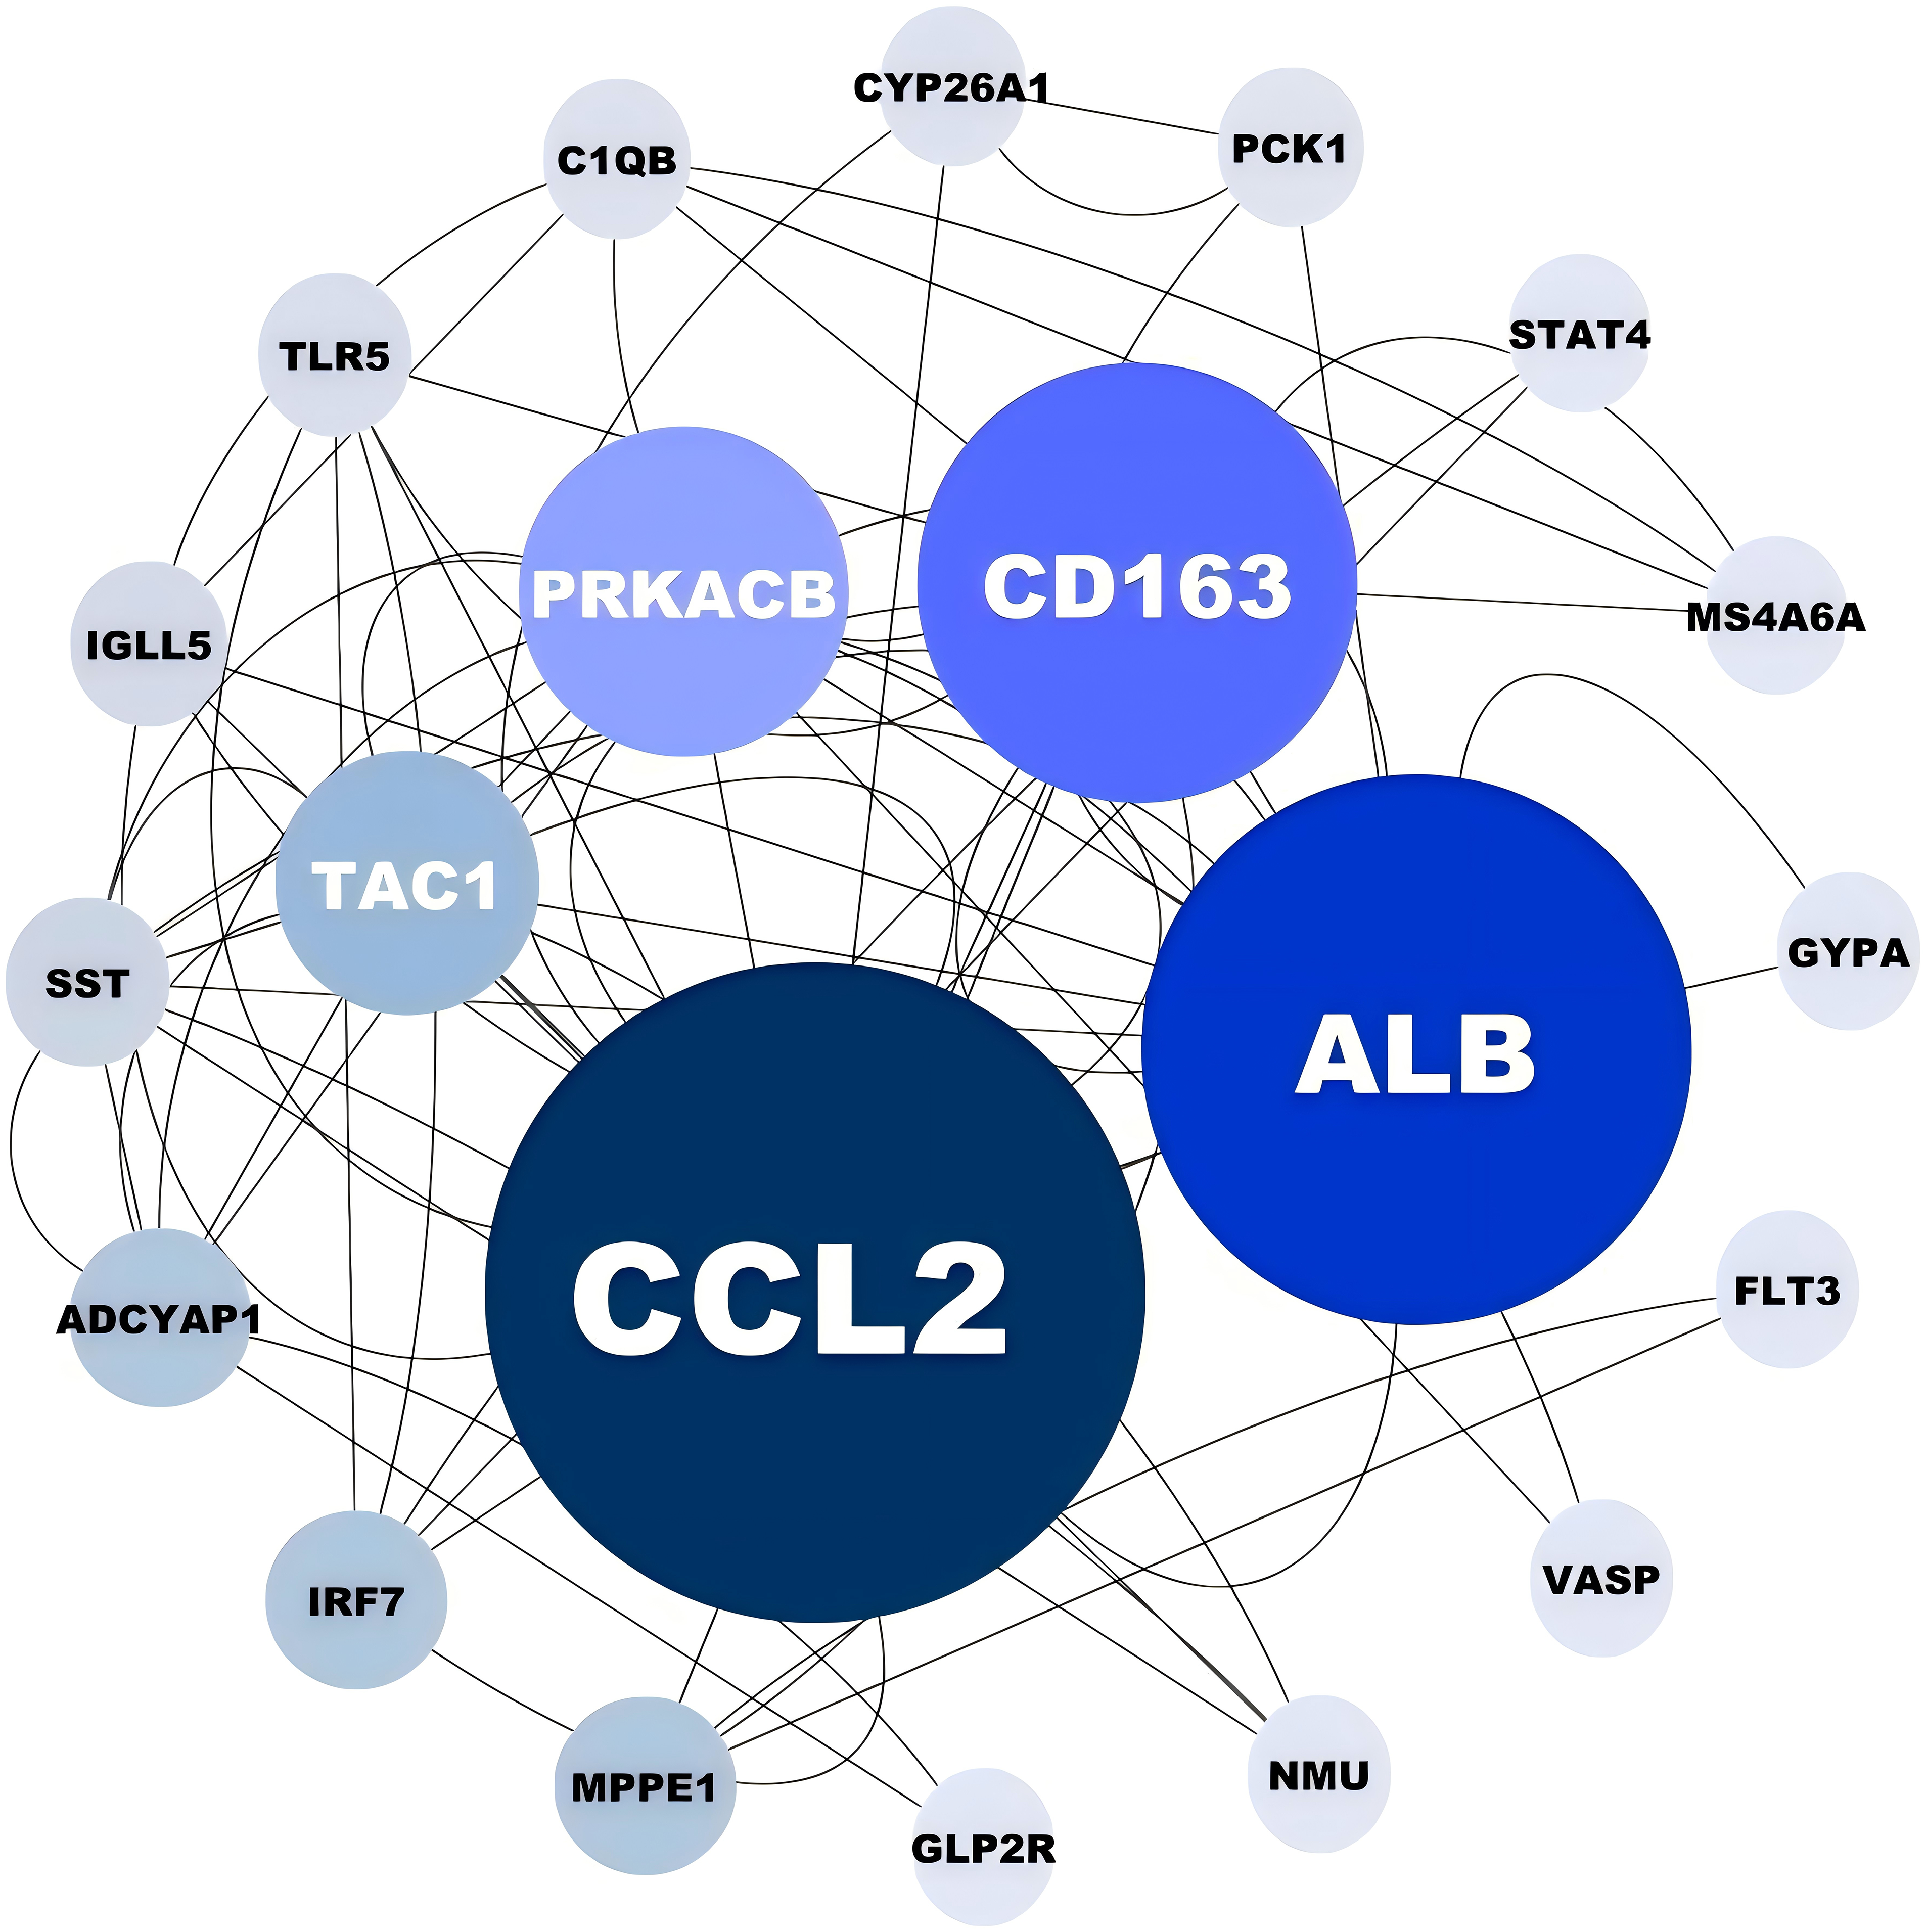
Protein-protein interaction network constructed with co-expressed DEGs. Darker colors and larger bubbles indicate higher node importance based on network centrality measures.
Identification of candidate hub genes via machine learning
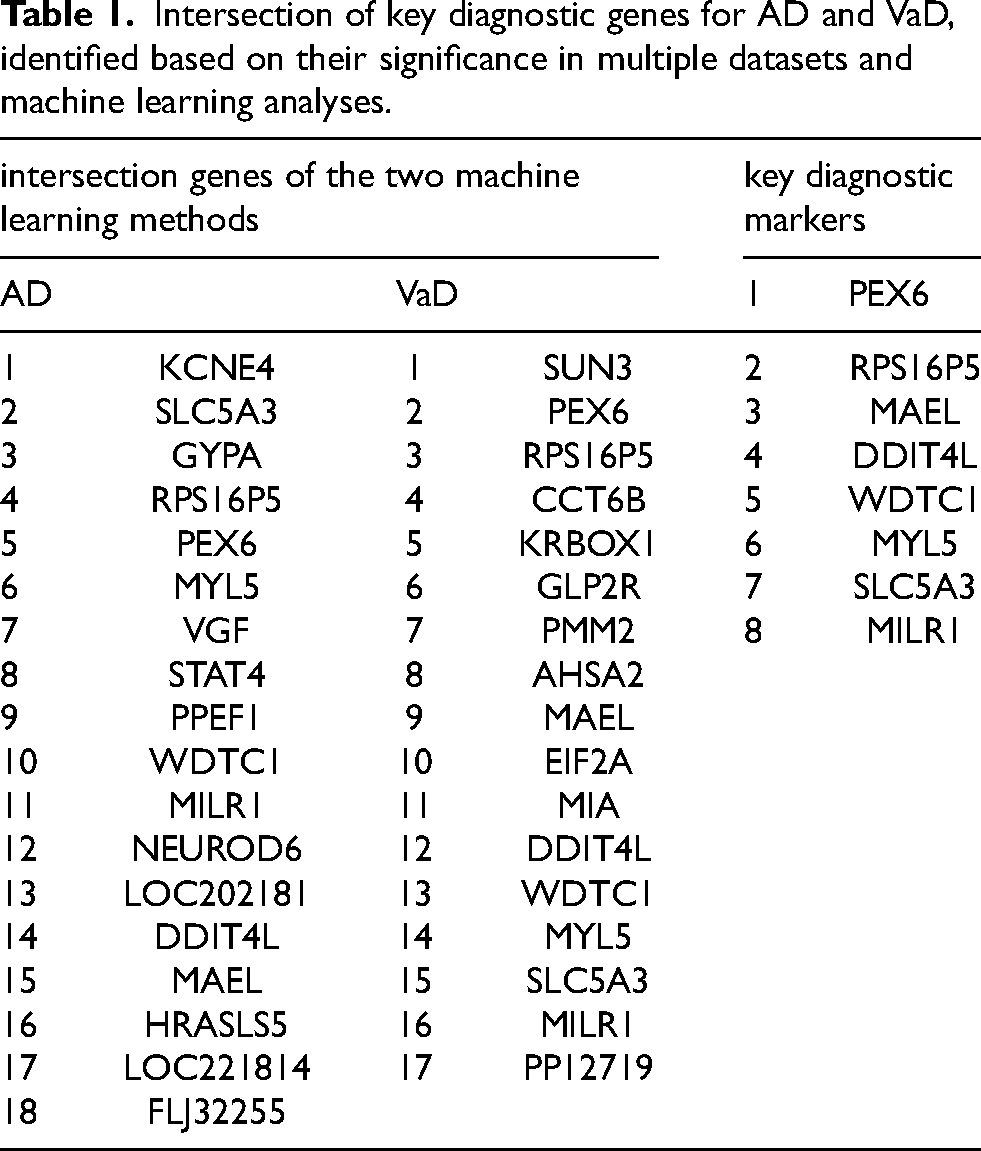
To identify candidate diagnostic genes, we used LASSO to identify 17 important genes in the VaD group (Figures 5A-B). SVM-RFE analysis identified the top 40 feature genes based on the error rate curve (Figure 5C), with 17 shared genes identified at the intersection (Table 1). A similar approach in the AD group identified 18 feature genes (Figures 5D-F). Integrating results from both algorithms, we identified 8 key diagnostic genes as consistent feature genes (Table 1).
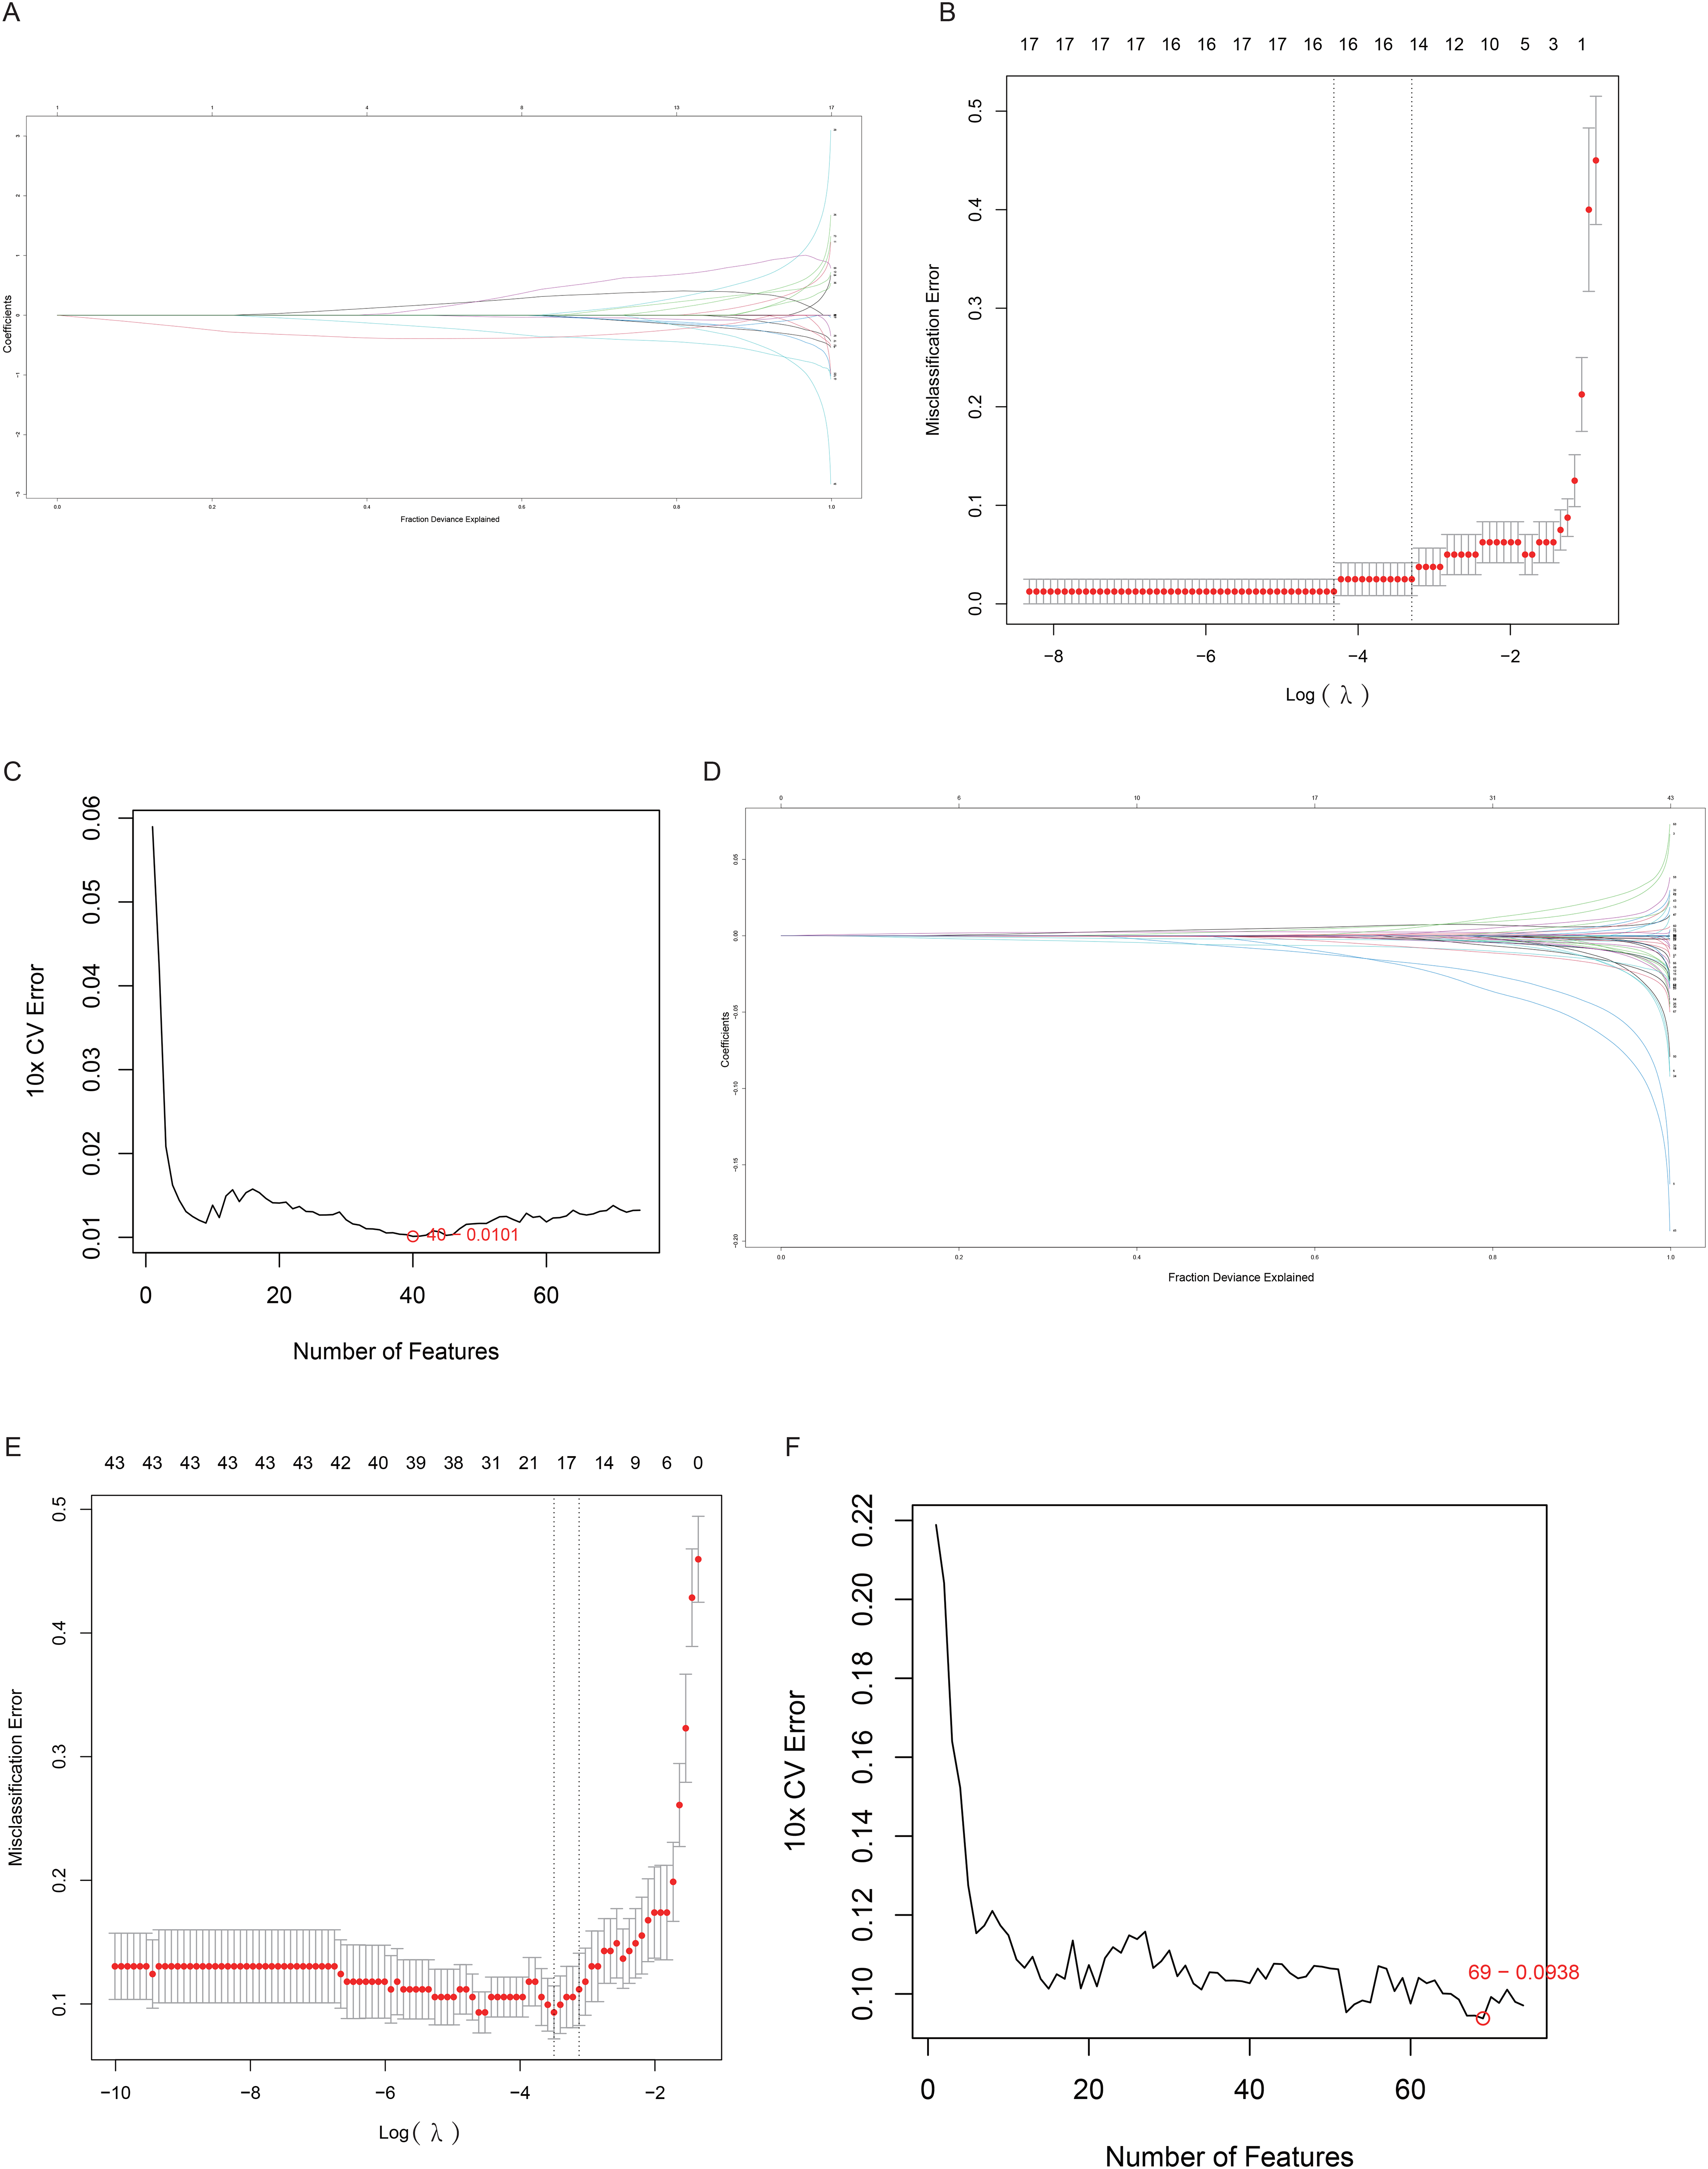
Identification of candidate diagnostic genes for VaD and AD using machine learning algorithms. (A,B) LASSO coefficient curves and optimal parameter selection plots identifying 17 crucial genes for VaD. (C) SVM-RFE algorithm selected 40 crosstalk genes for VaD. (D-F) LASSO and SVM-RFE algorithms applied to the AD group.
Intersection of key diagnostic genes for AD and VaD, identified based on their significance in multiple datasets and machine learning analyses.
Immune infiltration analysis
We used the CIBERSORT algorithm to assess immune cell infiltration levels in VaD and AD. In VaD patients, higher proportions of B cells naive, T cells CD4 memory resting, and monocytes were observed, while AD patients exhibited higher proportions of B cells, CD4 cells, and T cells regulatory (Tregs) (Figures 6A-B). Correlation analysis revealed strong associations between the 8 key genes and immune cells in both diseases (Figures 6C-D). In VaD, these genes were associated with B cells naive and Tregs, while in AD, they correlated with B cells naive, T cells CD4 memory activated, and dendritic cells resting. These findings suggest that variations in immune cell infiltration may offer potential therapeutic targets, with overlapping roles of Tregs, B cells naive, and macrophages M2 in both diseases.
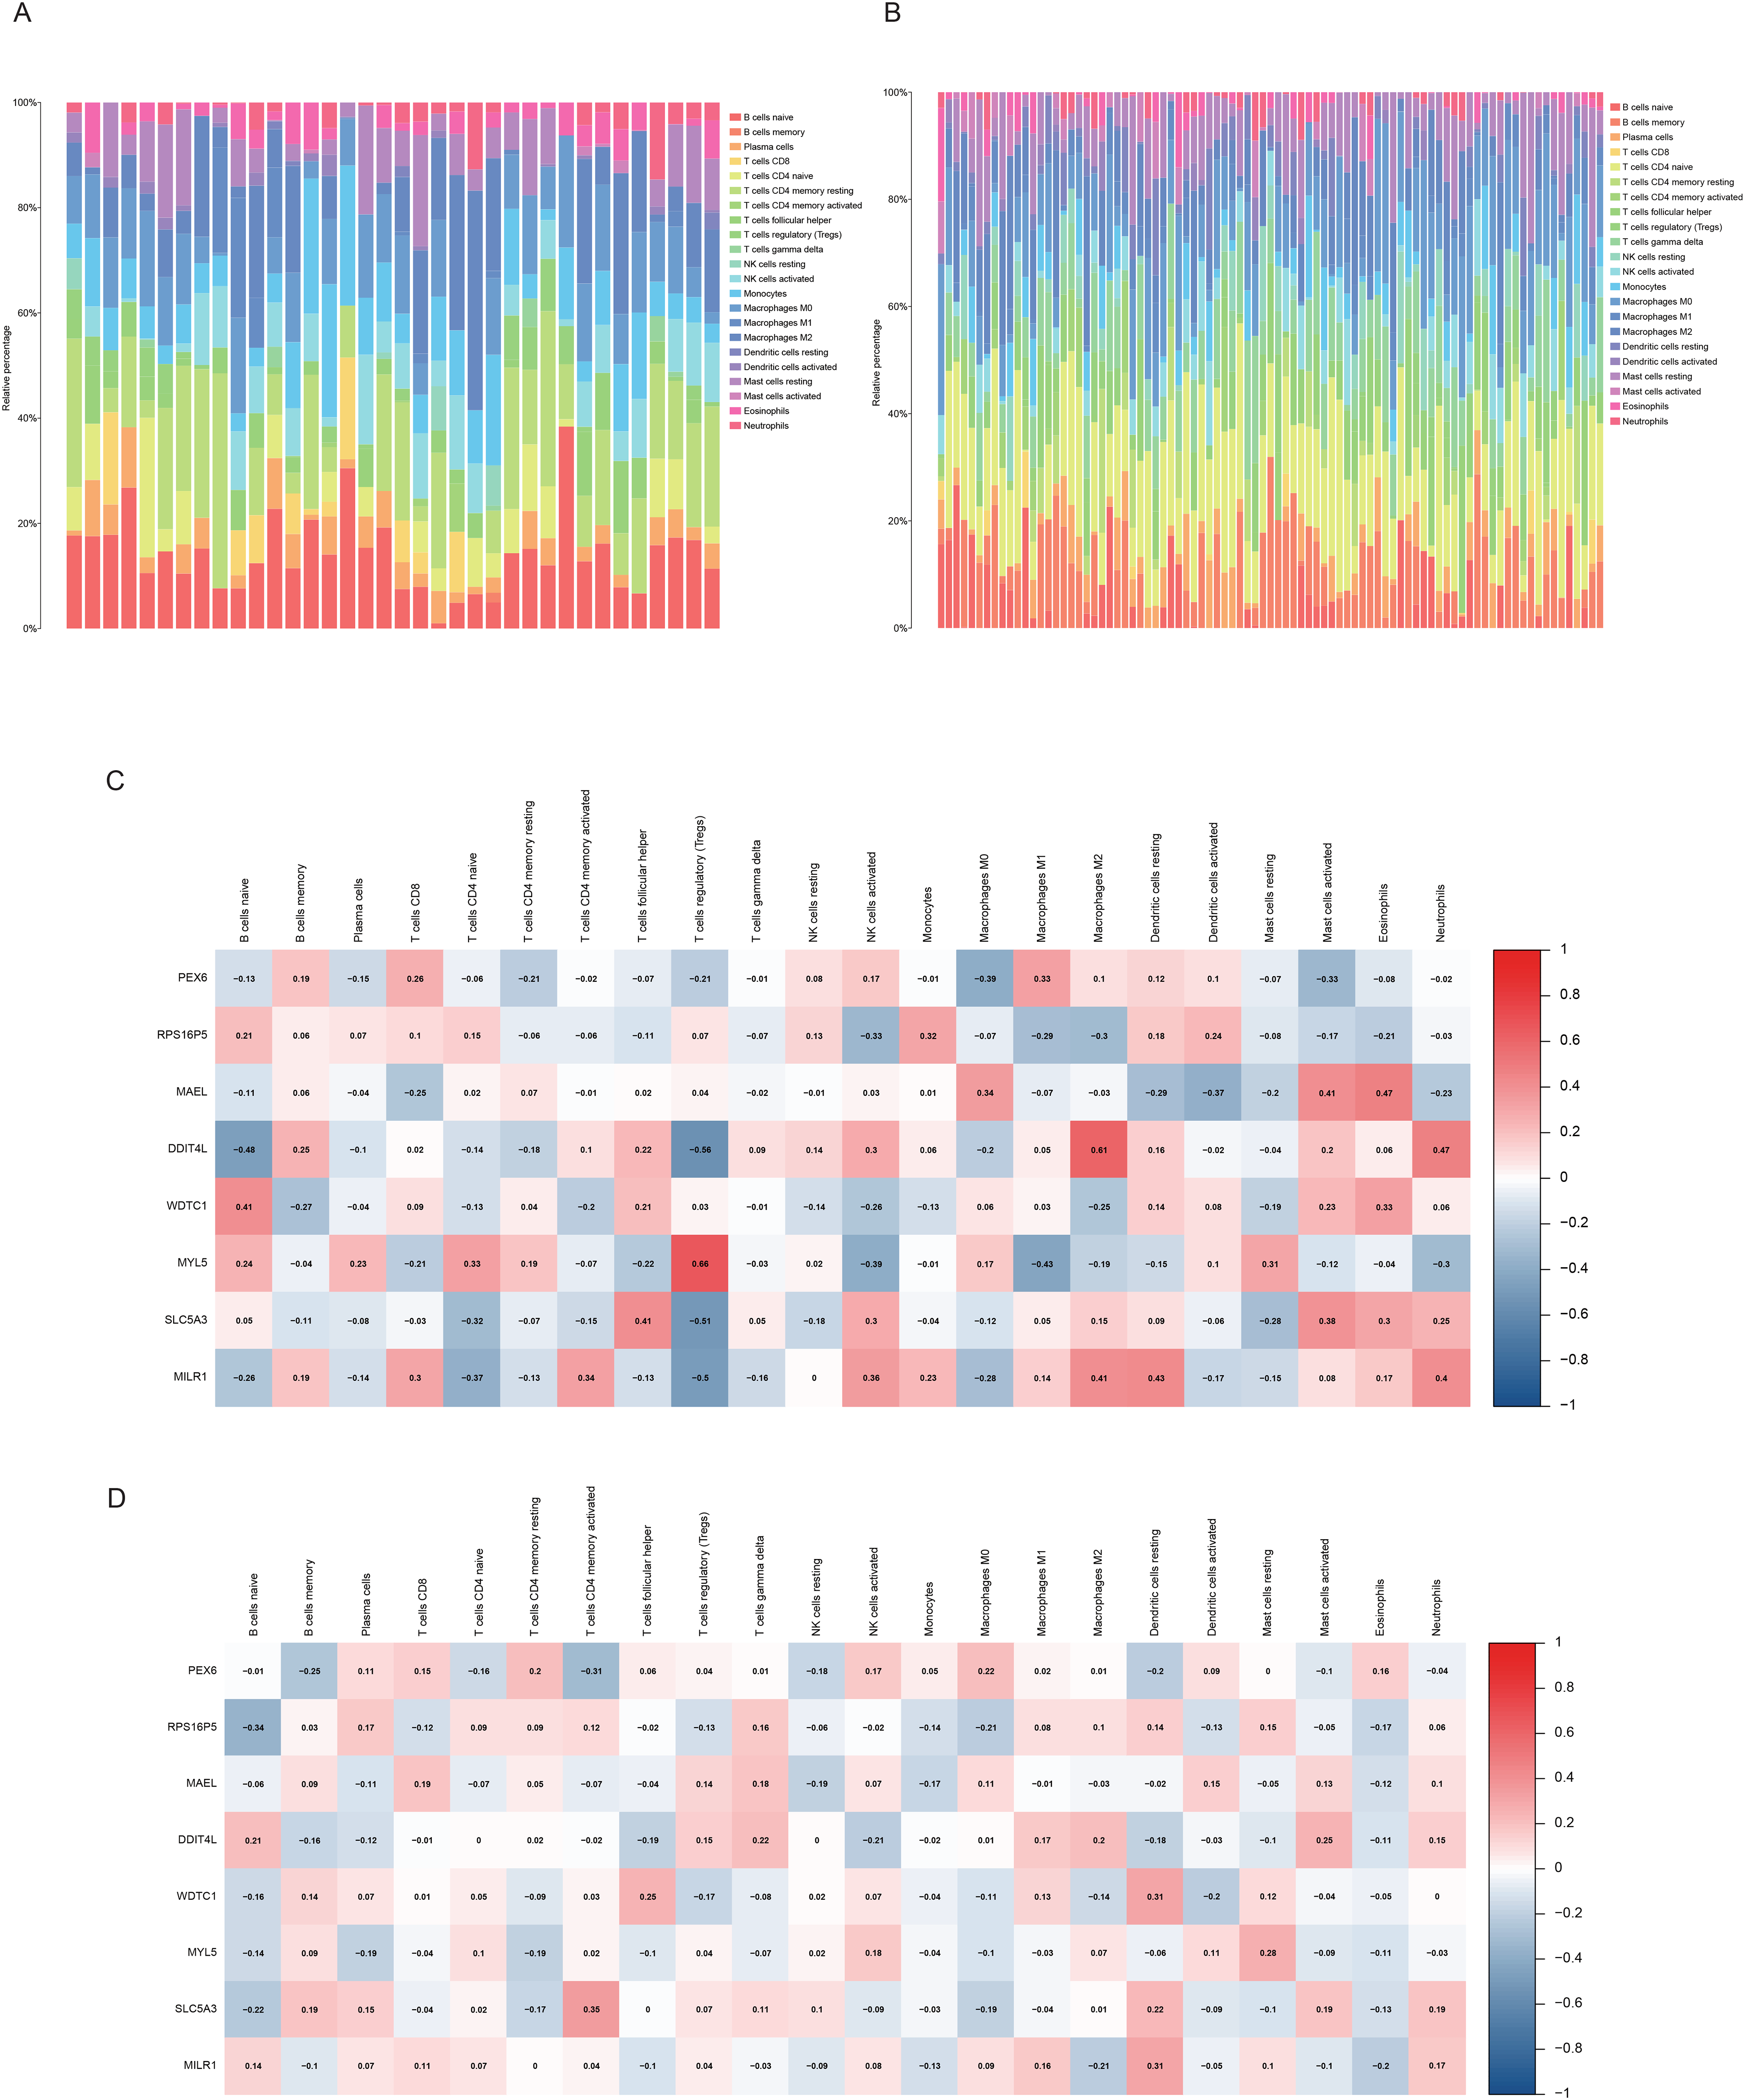
Results of immune infiltration analysis. (A,B) CIBERSORT analysis and visualization of immune cell infiltration levels in DEGs from VaD and AD patients. (C,D) Correlation analysis of the 8 core genes with immune cell infiltration levels. (A,C) Results for the VaD group; (B,D) Results for the AD group.
Assess the diagnostic predictive value of core genes
The ROC curves (Figure 7A-B) demonstrated high predictive accuracy for the 8-gene combinations in both VaD and AD. However, the perfect AUC value in the VaD group suggests the possibility of overfitting, despite efforts to mitigate this through regularization and cross-validation. This highlights the need for further validation with larger and more diverse datasets to ensure the model's robustness. The DCA and CIC further supported the clinical utility of these findings (Figure 7C-J), but caution is warranted given the potential overfitting, underscoring the importance of additional studies to confirm these diagnostic markers’ reliability.
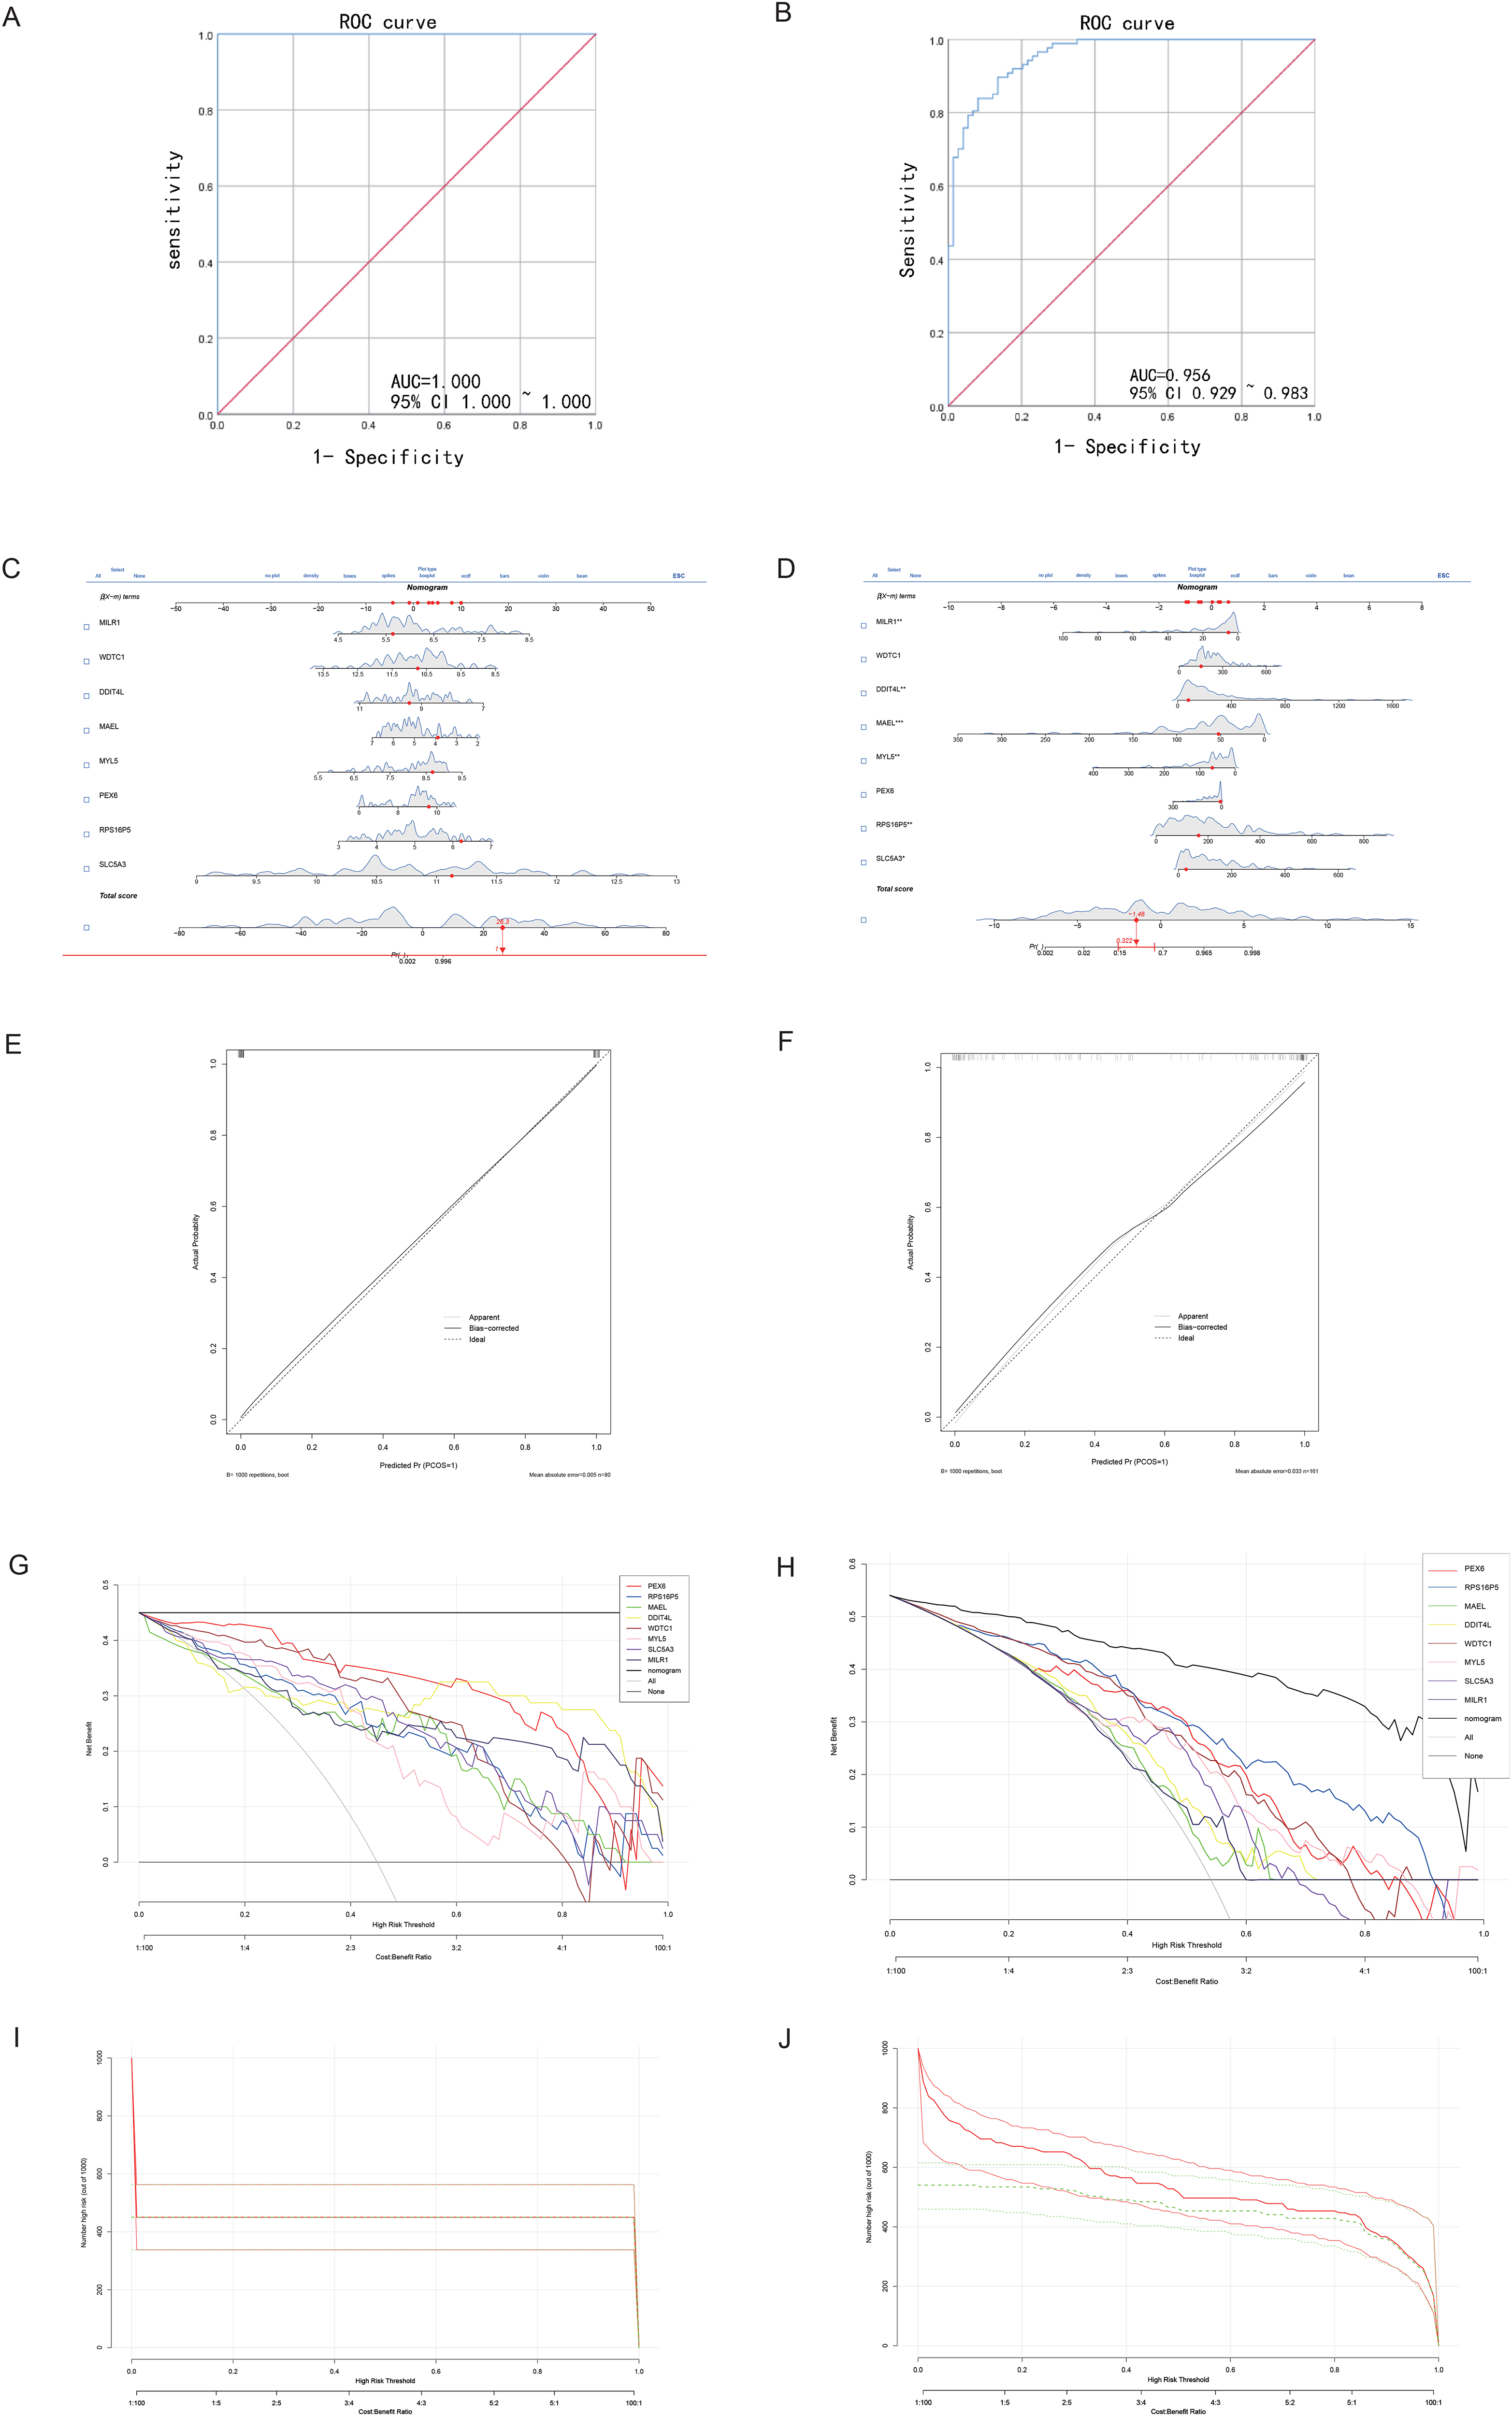
Receiver operating characteristic (ROC) curves and dynamic nomograms for predicting VaD and AD. (A) ROC curves for the 8-gene combinations in predicting VaD. (B) ROC curves for the 8-gene combinations in predicting AD. (C,E) Dynamic nomograms and calibration curves for VaD diagnosis. (D,F) Dynamic nomograms and calibration curves for AD diagnosis. (G,H) Decision Curve Analysis (DCA) and Clinical Impact Curve (CIC) for VaD. (I,J) DCA and CIC for AD, demonstrating high prediction efficiency.
Significantly characteristic gene analysis of brain tissues in different parts of AD patients
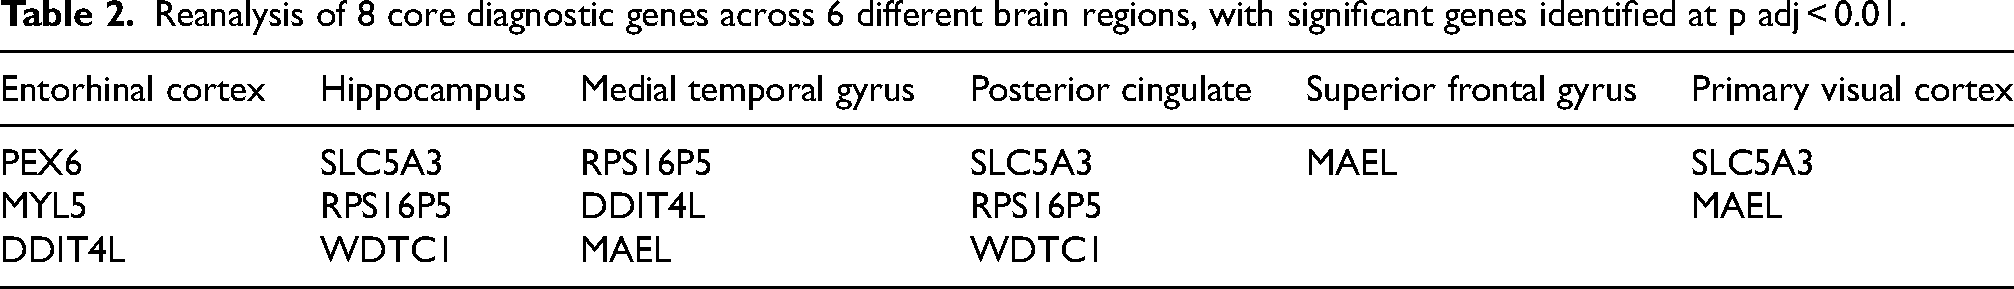
In the GSE5281 dataset, samples were collected from six distinct brain regions of AD patients: entorhinal cortex, hippocampus, medial temporal gyrus, posterior cingulate, superior frontal gyrus, and primary visual cortex. Differential analysis between AD and control groups for each region identified significantly differentially expressed genes (padj < 0.01). The results, shown in Table 2, indicate that characteristic gene expression varies across different brain regions, suggesting that future studies should consider regional differences when comparing gene expression in AD.
Reanalysis of 8 core diagnostic genes across 6 different brain regions, with significant genes identified at p adj < 0.01.
Discussion
Dementia ranks as the seventh leading cause of mortality globally, with AD and VaD being the most prevalent forms. These conditions often manifest with overlapping clinical features, making differential diagnosis challenging. Our investigation revealed 74 genes shared by AD and VaD and identified eight key diagnostic genes: SLC5A3, RPS16P5, PEX6, MYL5, WDTC1, MILR1, DDIT4L, and MAEL. We delved into the regulatory pathways and potential mechanisms underpinning these diseases, utilizing GO, KEGG enrichment analyses, and PPI networks, providing valuable insights into their complex biological landscapes.
However, the ROC curve analysis for the GSE122063 group suggests a potential issue of overfitting, despite implementing strategies like regularization and cross-validation. The limited availability of VaD-specific gene sets constrained our ability to expand the dataset and fully validate our findings. While overfitting may indicate an artificially high model performance, it highlights the importance of developing and validating predictive models with broader datasets. The current model provides a valuable foundation for future research, indicating that with expanded datasets, these core genes may play a crucial role in the accurate diagnosis and understanding of VaD. Additionally, incorporating custom next-generation sequencing (NGS) panels in future research could enhance the identification of novel gene variants associated with dementia. 25 Custom NGS panels enable targeted sequencing of specific genes, providing high sensitivity for detecting rare or novel variants. When combined with the bioinformatics and machine learning approaches used in this study, this technology could not only validate the core genes identified here but also uncover additional genetic factors contributing to the pathogenesis of VaD and AD. Leveraging these advanced tools could allow future studies to develop more precise diagnostic and therapeutic strategies.
In the GO/KEGG enrichment analysis, the 74 co-expressed genes were primarily associated with the “neuroactive ligand-receptor interaction signaling pathway,” a network of receptors and ligands on the cell membrane that are involved in intracellular and extracellular signaling pathways. 26 Neuronal signaling and communication in the neurodegenerative changes are important in dementia. It was found that the accumulation of Aβ plaques in dementia patients disrupts communication between synaptic neurons, while tau tangles obstruct the transport of essential nutrients and molecules critical for the normal function and survival of neurons.27,28
The PPI network analysis highlighted CCL2, Albumin (ALB), and Cluster of Differentiation 163 (CD163) as central nodes within the intricate web of protein interactions, with each protein intimately associated with the inflammatory response. Emerging evidence underscores the significant contribution of neuroinflammation to the pathogenesis of neurodegenerative changes. Neuroinflammation is known to compromise the blood-brain barrier's integrity, induce damage to vascular tissues, and precipitate neurodegenerative processes through various pathways, including glial cell activation and the elevation of pro-inflammatory cytokines.21,29 Moreover, it plays a crucial role in perpetuating a detrimental cycle involving amyloid deposition, neuronal injury, tangle formation, and subsequent neuronal death. 30
The investigation into shared genetic markers underscored potential commonalities between AD and VaD in neurosignaling and inflammatory responses. To further dissect the diagnostic markers and underlying pathogenesis of these disorders, we pinpointed 8 core genes. Notably, DDIT4L, PEX6, and MAEL emerged as intimately linked to the autophagy system, albeit through distinct mechanisms. DDIT4L plays a pivotal role in modulating mitochondrial function and fosters mitochondrial autophagy by suppressing the mammalian target of rapamycin (mTOR) signaling pathway, thereby enhancing the expression of autophagy-related genes31,32; PEX6, categorized within the AAA (ATPases Associated with various cellular Activities) ATPase family, is instrumental in the peroxisomal import system and is implicated in pexophagy.33,34 Meanwhile, MAEL is posited to act either upstream or within various cellular processes and is suggested to facilitate metabolic reprogramming via chaperone-mediated autophagy (CMA). 35
Autophagy, a fundamental cellular mechanism, mediates the lysosomal degradation of cellular components, playing a pivotal role in the elimination of misfolded proteins, protein aggregates, and damaged organelles. This self-digestive process is broadly classified into three primary forms: macroautophagy, microautophagy, and CMA. Additionally, autophagy can exhibit substrate specificity, leading to the categorization into various selective types, such as mitophagy, reticulophagy, ribophagy, and pexophagy, among others.
Alterations in autophagy pathways and autophagy-related genes are implicated in a wide array of human pathologies, including neurodegenerative diseases and various cancers. In AD, aberrations in autophagic processes are frequently observed, notably the proliferation of mitochondria with compromised structural integrity. 36 Research indicates that deficits in mitochondrial autophagy, driven by augmented oxidative damage and cellular energy deficits, contribute to the accumulation of Aβ and tau proteins. This accumulation is linked to synaptic dysfunction and cognitive impairments, which further exacerbate mitochondrial autophagy dysfunction. 37 Interestingly, enhancing autophagic activity is considered advantageous in AD management. For example, activation of the peroxisome proliferator-activated receptor alpha (PPARA) has been demonstrated to regulate pexophagy in the nervous system, yielding cognitive improvements in AD mouse models. 38 Moreover, stimulation of CMA has proven effective in diminishing Aβ plaque burden in the brain, ameliorating AD manifestations. 39 However, the impact of autophagy on VaD remains ambiguous. Autophagy is associated with microvascular lesions, diminished synaptic plasticity, and neuronal degeneration in VaD, suggesting that autophagy inhibition may represent a therapeutic avenue. 40 Nonetheless, VaD frequently encompasses chronic cerebral hypoperfusion (CCH), 41 a condition under which autophagy may contribute to the accrual of misfolded proteins and dysfunctional organelles, leading to cellular apoptosis. On the other hand, as the ischemic process continues, autophagy activity is eventually over-regulated, exacerbating ischemic damage and inducing neuronal apoptosis. 42
In our analysis, DDIT4L expression was elevated in both AD and VaD, indicating that mitochondrial autophagy may play a role in the progression of both diseases. Mitochondrial autophagy is a critical aspect of mitochondrial abnormalities, and the connection between mitochondrial dysfunction and various forms of dementia is increasingly being recognized, supporting the concept of a shared pathophysiological platform between VaD and AD. In AD, several hypotheses, including the amyloid cascade hypothesis and the mitochondrial cascade hypothesis, propose that mitochondrial dysfunction is central to disease progression.43,44 Key features of this dysfunction include abnormalities in mitochondrial fission and fusion, impaired function of mitochondria-associated membranes, insufficient mitophagy, and disrupted protein homeostasis. 45 Even in “pure” VaD, where vascular factors are predominant, mitochondria are affected by ischemic and hypoxic conditions, leading to uncoupling of oxidative phosphorylation and reduced ATP synthesis. These disruptions result in energy deficits, disturbances in mitochondrial calcium homeostasis, and impaired autophagy, ultimately leading to neuronal dysfunction and cell death.46,47 This further supports the idea of a shared pathophysiological platform between VaD and AD and underscores the critical role of autophagy in these diseases.
In addition to the autophagy-related genes previously mentioned, MYL5 and WDTC1 might work together synergistically. MYL5, associated with muscle functions and signaling, and WDTC1, linked to metabolic responses, could influence muscle mass and metabolic processes. Research suggests that maintaining muscle mass could help prevent neurodegenerative conditions, while obesity and diabetes increase their risk.48–53 Moreover, other genes like SLC5A3 and MILR1 play roles in inositol metabolism and mast cell activation, respectively, further connecting metabolic and immune pathways to the development of neurodegenerative diseases.54–56 This broadens our understanding of the molecular dynamics involved in these conditions, offering new avenues for therapeutic approaches.
In conclusion, the 8 genes identified in our study could have significant implications for the progression of both AD and VaD. While existing literature often explores the parallels between AD and VaD, with a particular focus on cerebrovascular alterations and Aβ aggregation, our findings propose that a shared mechanism involving the activation of mitochondrial autophagy might also play a crucial role. However, empirical studies specifically addressing this potential commonality are notably scarce, underlining the pressing need for further experimental investigations to elucidate these mechanisms.
Nevertheless, our study faces certain limitations that should be acknowledged. The availability of datasets for each condition was restricted, with our analysis limited to just two datasets per disease. This limitation is especially significant for VaD, where we could only include 8 disease samples and 11 control samples. The scarcity of VaD-specific gene sets and research further constrained our ability to validate the findings and establish clear causal links between the identified genes and the disease. Despite these challenges, the advanced predictive tools used in our study provide valuable insights, allowing clinicians and researchers to critically assess the potential roles of these genes in clinical practice. This underscores the need for further research with more extensive datasets to corroborate and expand upon our findings.
Conclusion
Through an integrated approach combining bioinformatics analysis and machine learning algorithms, our study successfully identified 74 co-expressed genes and 8 key diagnostic genes: SLC5A3, RPS16P5, PEX6, MYL5, WDTC1, MILR1, DDIT4L, and MAEL. These genes may play roles in regulating signal transduction, neuroinflammation, and the autophagy system, suggesting a potential shared mechanism in mitochondrial autophagy activation across AD and VaD. However, given the small sample size and the preliminary nature of our findings, these results should be interpreted with caution. Further research with larger, more diverse datasets is necessary to validate the clinical relevance and utility of these genes in diagnosing and treating AD and VaD.
Footnotes
Acknowledgments
The authors express their gratitude to all the participants
Author contributions
Shu Wan (Funding acquisition; Project administration; Supervision); Wanning Zheng (Conceptualization; Data curation; Formal analysis; Investigation; Methodology; Resources; Software; Visualization; Writing – original draft); Dongdong Lin (Data curation; Methodology; Supervision; Validation; Writing – review & editing); Shunan Shi (Formal analysis; Investigation; Methodology; Resources; Software); Jiayi Ren (Conceptualization; Data curation; Formal analysis; Validation; Visualization; Writing – review & editing); Jiong Wu (Data curation; Formal analysis; Investigation; Methodology; Supervision; Validation; Visualization); Ming Wang (Conceptualization; Project administration; Resources; Writing – review & editing).
Funding
This research was funded by: Special Support Program for High Level Talents of Zhejiang Province (2022R52038); Key Research and Development Project of Zhejiang Provincial Department of Science and Technology (2021C03105); The Natural Science Foundation of Zhejiang Province, Basic Public Welfare Project (LGF22H090017); The Key Project of Zhejiang Administration of Traditional Chinese Medicine (2023009022).
Declaration of conflicting interests
The authors declared no potential conflicts of interest with respect to the research, authorship, and/or publication of this article.
Data availability
The data used in this paper come from public databases: The original datasets were obtained from Gene Expression Omnibus (GEO) (https://www.ncbi.nlm.nih.gov/geo/). The specific sources of datasets GSE5281 and GSE122063 are: https://www.ncbi.nlm.nih.gov/geo/query/acc.cgi?acc=GSE5281 and ![]() . We extracted data from vascular dementia patients in GSE122063 for analysis.
. We extracted data from vascular dementia patients in GSE122063 for analysis.