
Abstract
In January 2020, Mr. Durai being an amateur investor wanted to diversify his portfolio by adding some fast-moving consumer goods (FMCG) stocks. He has chosen three FMCG stocks, namely Hindustan Unilever, Godrej Consumer Products and Dabur India, based on high trading volume. The capital asset pricing model (CAPM) is one of the widely followed techniques to measure risk and return of equity investment. The risk and return are the key factors that help investors to take an informed decision. To assess the risk and return profile of stocks, Mr. Durai considered monthly stock prices from 2015 to 2019. Beta is a measure of risk that shows the volatility of the stock return with respect to that of market. The beta of a 5-year stock price is more robust than beta of 1 year or 2 years due to heavy market fluctuations. The CAPM also helps investors to identify whether the stock is underpriced or overpriced. Therefore, the investors can avoid the overpriced stocks.
Introduction
The CAPM was developed by Sharpe, Lintner and Mossin. This model quantifies risk and transforms that risk into estimates of expected return. Thus, it helps to determine an appropriate expected rate of return of a stock to make decisions whether to buy, sell or hold stocks. This model builds on the model of portfolio theory evolved by Markowitz. The work of Treynor was also instrumental in the development of this model (French, 2003). Sharpe, Markowitz and Miller jointly received the 1990 Nobel Memorial Prize in Economics for the development of this model (Varian, 1993).
The cost of capital is the cost incurred by the company to raise its capital. In other words, it is a combination of both cost of equity and debt. Sharpe identified that the expected return of an individual stock or a portfolio of stock should be equal to its cost of equity capital. The cost of equity capital is the minimum return expected by the equity investors. Generally, the cost of capital is based on the company’s capital structure. In case a company has no debt capital, then the cost of equity capital is considered as the cost of capital.
Investment Decision
In April 2018, Mr. Sri moved to India after completing his MBA degree from a prestigious business school in London. He wishes to serve his home country and wants to become an entrepreneur as well; thus, he took a franchise from a leading stock broking company in India. Being a finance fanatic, he is fully aware of the risk and return involved in the stock market. He encouraged his clients to discuss about stock market movements from his office premises and thus made all the arrangements. One of his clients, Mr. Durai, is a novice investor and has already invested in information technology (IT) and banking scrips, exposed to CAPM by Mr. Sri as it is an important asset pricing model. He has felt that investing in non-cyclical stock never fails irrespective of the economic conditions. He also knows about the demand and supply of different sectors, which made him more confident on the FMCG sector seeming to perform well under any circumstances. However, he did not want to give the same credit to all the companies under this sector and wanted to do an appraisal before investing in FMCG companies. On 13 January 2020, Mr. Durai gazed at NIFTY FMCG for his stock selection. NIFTY FMCG is an index that expresses the composite behaviour of 15 FMCG companies listed on the National Stock Exchange (NSE). This index reveals the total free float market capitalization of all 15 stocks in comparison to base market capitalization. Out of these 15 stocks, he chose three stocks based on high trading volume. They are Hindustan Unilever Ltd. (HUL), Godrej Consumer Products Ltd. (GCPL) and Dabur India. In fact, there are different factors that add value to the shareholders, namely management efficiency, brand equity, innovation, strategic planning, etc. Leaving the qualitative aspect of value measures aside, Mr. Durai wanted to analyse the market return and risk profiles of these leading FMCG stocks from a quantitative point of view in order to support his investment decision.
Market Overview
The FMCG sector is the fourth largest sector in the Indian economy. The three main segments, namely food and beverages, healthcare and household, and personal care, account for a market share of 19%, 31% and 50%, respectively. The growth drivers of this sector are consumer awareness, accessibility and change in lifestyle. This sector completely relies on the disposable income of the common man, especially rural folk (All India Association of Industries, 2022). The growth of this sector between 2006 and 2013 has been phenomenal. This sector has tripled its size over the past 10 years. The GOI has relaxed 100% foreign direct investment (FDI) in the cash and carry segment and in single-brand retail along with 51% FDI in multi-brand retail. The non-cyclical nature of this industry has created a large employment opportunity in India; thus, it has become one of the key pillars of the economy. The Indian FMCG market is expected to grow at a compound annual growth rate (CAGR) of 14.9% to reach US$220 billion by 2025, from US$110 billion in 2020 (India Brand Equity Foundation, 2022).
Company Overview
HUL is one of the most familiar household names in the market with 80 years of legacy. It has different product lines ranging from beauty and personal care, home care, life essentials to foods and refreshments. It has a wide range of over 400 brands, which play a significant role in everyone’s day-to-day lives. The company has succeeded to introduce innovative products like Surf Excel Quick Wash with an advertising campaign of clean clothes with less water and peoples’ shampoo Sunsilk, which in itself has become a household name. HUL is a subsidiary of Unilever PLC, which acquired Horlicks brand from GlaxoSmithKline plc for ₹30,450 million. HUL made a strategic move to strengthen its health food drinks (HFD) market, and thus it completed merger a with GlaxoSmithKline Consumer Healthcare Ltd (GSK CH India). The equity value of the deal is ₹317,000 million. Thus, the famous health drinks such as Horlicks, Boost, Maltova and Viva became the brand of HUL now. The hard and soft synergies of this deal may enhance its shareholders’ value in the long run.
GCPL is a leading emerging market FMCG company known for its home care, personal care and hair care products. This company is number two in soaps in India, and the number one player in air fresheners in India and Indonesia, and a leader in wet tissues in Indonesia. GCPL is continuously innovating to delight its consumers with more exciting, superior quality products at reasonable price. It serves different geographic regions such as Asia, Africa, Latin America and Europe. The brand portfolio includes Good Knight, Cinthol, Hit, aer, etc. The three new introductions (single-use laundry capsules, dishwasher tablet and anti-mosquito bed nets) are available only via e-commerce platforms to strengthen its e-commerce business with digital brand. The company has also created a great working environment for all its employees.
Dabur India Ltd is an Indian consumer goods company, and it is known for its business based on ayurvedic products. Its products in the FMCG sector range from hair care, oral care, healthcare, skin care and food items. It was able to withstand the various economic conditions despite being focused on Ayurveda as its competitive edge and catering to the niche market, which is laudable from analysts’ points of view. The company has continued to grow starting from being a family-run business to now a professionally managed company despite having a fierce competition in this sector.
Risk and Return
Risk is broadly categorized into two components, namely systematic and unsystematic risks. Systematic risk is a market risk that cannot be avoided. However, it can be mitigated by proper asset allocation strategy. For instance, in order to reduce stock market risk, an investor can have a diversified portfolio, including gold, debt instruments, property, cash, etc. Unsystematic risk is a risk associated with a company or industry; thus, it can be avoided by proper diversification of stocks. The investor should not invest in one company or related industry; rather, it is recommended to invest in multiple companies comprising diverse sectors for a well-diversified portfolio. In such case, even if one company fails, it will not have much impact on the investors’ portfolio return.
Return is the function of risk. Generally, the return will be expressed in terms of percentage. Return may also be negative if the amount invested is greater than the amount to be received from the investment. In the stock market, the return can be computed on a daily, monthly or annual basis.
Daily return = (Today’s price/Yesterday’s price) — 1
The risk–return trade-off expresses that the return increases due to increase in risk. The nature of the stock market is highly volatile; thus, it involves high risk and offers a sizable return when compared to other investment avenues in the long run. The stock market risk can be measured through standard deviation (σ), variance (σ2) and β. However, standard deviation and variance describe the volatility of the stock return, whereas β compares the volatility of the stock return with respect to the market. Thus, β is the most acceptable measure of risk of stocks.
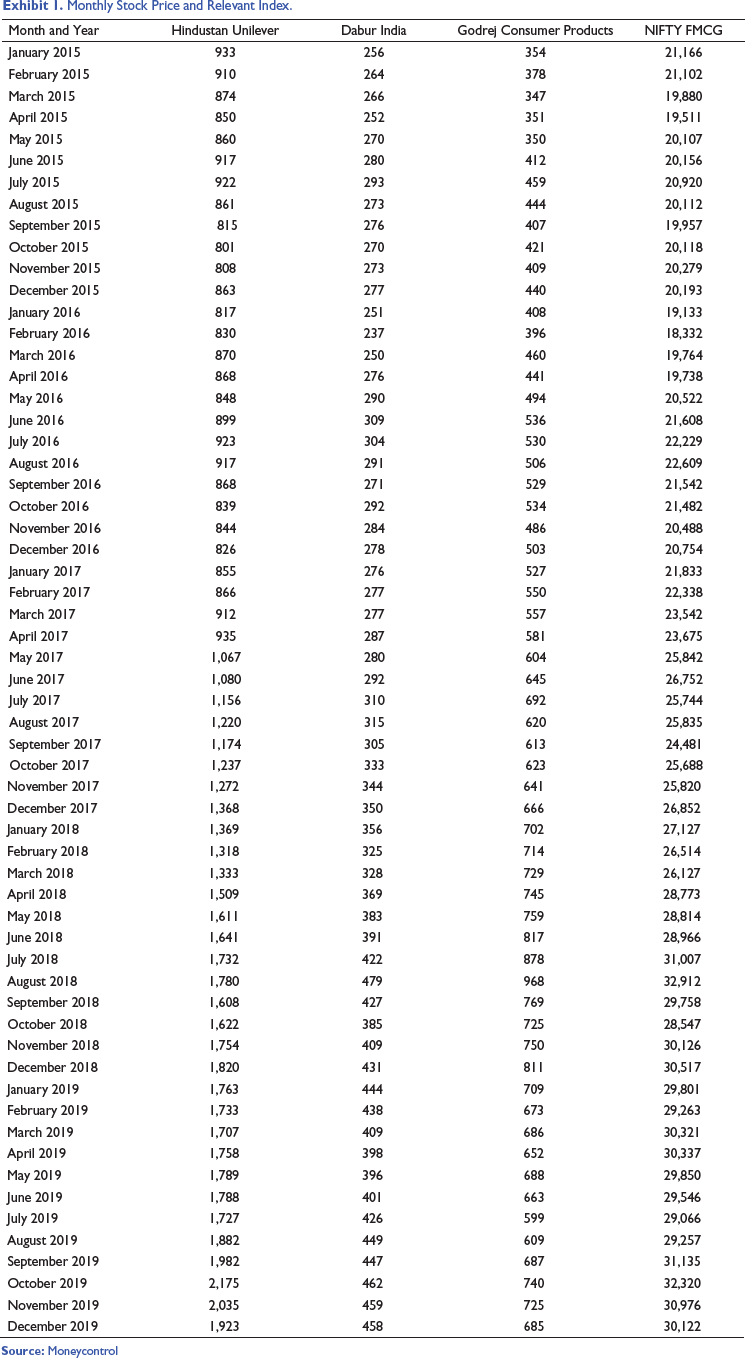
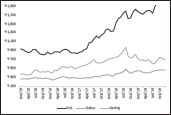
To assess the risk and return of the companies, Mr. Durai referred to the monthly stock prices from 2015 to 2019 (Exhibits 1 and 2).
This case focuses on the widely followed asset pricing theory named Capital Asset Pricing Model.
Monthly Stock Price and Relevant Index.
Beta (β)
Beta is a measure of systematic risk. It describes the volatility of a stock with respect to the volatility of relevant market index. If a stock has beta less than one is perceived as less volatile. If beta of a stock is greater than one is considered as volatile stock. If beta is greater than two, it is considered as high volatile stock. Generally, beta of a benchmark (NIFTY/SENSEX) is one and beta of a risk-free rate is zero as it involves no risk. The following is the formula to calculate stock beta.
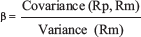
Where, Rp = Portfolio Return
Rm = Market Return
Beta is the slope of regression line and it can either be positive or negative. A positive beta value depicts that the movement of stocks aligned with that of the market and vice versa. If a stock beta is 1.5, it is said to be 50 per cent more volatile than the market and if a stock has a beta of 0.5, it is said to be 50 per cent less volatile than the market. The only disadvantage in considering beta is that it varies over time.
Risk Free Rate (Rf)
It means the return of risk-free asset, which is generally Treasury bill or Government bond. Treasury bill is issued by the Reserve Bank of India (RBI) as a representative of Government of India (GOI) for its short-term fund requirement with a normal maturity period of 91 days, 182 days and 364 days. However, the government bond can be issued by both the state and central governments for their long-term fund requirements. The RBI monitors the issue of GOI bond in India. It is good to have the maturity of risk-free rate aligned with the maturity of a project.
Market Risk Premium
It means the excess of market return over the risk-free rate. In Capital Asset Pricing Model, we must ensure that the market risk premium is positive (Rm > Rf). If risk premium is negative (Rf > Rm), then the investor may invest in a risk-free security rather than participating in the equity market. Therefore, data smoothing must be done by including few more year’s data to turn it positive. Generally, five-year stock price data results in positive market risk premium.
Expected vs. Actual Return
The expected return of the equity investors is calculated based on the following formula:
Expected Rate of Return = Rf + β (Rm - Rf)
In expected return, market risk premium (Rm - Rf) is same for the stocks as Rm and Rf remain constant across the companies. Therefore, beta is the determining factor of the expected return. Thus, increase in beta results in increase in the expected return and vice versa. Actual return is the real return offered by the stock. In case of monthly or daily data, the monthly average/daily average return should be converted for annual. In view of employing annual data, average return can then be considered as annual return.
Securities Market Line (SML)
It is a line which depicts various levels of beta of stocks plotted against its expected return at a given point in time. Generally, the expected return increases due to increase in beta. The stocks placed above the SML are considered as underpriced, which means actual return of the stock is more than its expected return. The stock placed below the SML is said to be overpriced.
Underpriced = Actual Return > Expected Return
Overpriced = Actual Return < Expected Return
Footnotes
Declaration of Conflicting Interests
The authors declared no potential conflicts of interest with respect to the research, authorship and/or publication of this article.
Funding
The authors received no financial support for the research, authorship and/or publication of this article.