
Abstract
In the absence of a vaccine for combating the novel coronavirus (COVID-19), countries globally are going in for a national lockdown and are mandating all people to stay indoors, and, if out in the public domain, to maintain 2-m distance, wear masks and wash hands with soap to mitigate the spread of the virus and its community transmission. The significance of the much neglected public health measures to deal with communicable diseases has come back to haunt several countries with a large proportion of people who are poor and who live in dense settlements with low levels of public provisioning of basic amenities. This article attempts to examine the feasibility of the recommended physical distancing using data from a national level sample from India. With the aid of data on parameters such as access to water, toilet, electricity, mobile phone and secure employment from the 75th and 76th National Sample Survey Rounds of 2017–2018, a Physical Distancing Readiness Index has been constructed. The performance of 27 states and 2 union territories of India is examined using the Index. This study examines the statistical correlation of a Physical Distancing Readiness Index to the incidence rate and case fatality ratio of COVID-19. Our results show that the poorer households are unequally endowed for observing physical distancing and ensuring the effective implementation of lockdown, which leads to disproportionate increase in the incidence rate and case fatality ratio, keeping other factors constant.
Introduction
The rapid spread of the novel coronavirus across the developed countries of the Global North and the low- and middle-income countries (LMIC) of the Global South gave an impression and imagery that the infectious disease is the greatest leveller. Governments, corporations and airline companies put out messages that ‘we are all in this together’, calling for solidarity in combating the disease through compliance to the restrictions placed on physical mobility, staying indoors, washing hands, wearing masks and maintaining physical distance to break the modes of transmission of the pandemic. With an official announcement of a national lockdown with least preparedness to deal with migrant workers, India, a country of 1.3 billion people had disturbingly stumbled on the grave fault lines in the society, economy and state policies, which threw challenges to combating the disease (Stranded Workers Action Network, 2020).
The multi-layered vulnerability and deprivation of rural, urban and tribal toiling classes, with the least financial capacity to stay locked down without access to work, income and food on the one hand and a poorly equipped and understaffed public health system left to combat the mounting caseload, on the other, stood out starkly. The past three decades of neoliberal policies with a jobless growth agenda, half-hearted social protection measures and under funding of health care services have widened the socio-economic and health inequalities (Baru, 2010; Kannan & Raveendran, 2019; Qadeer & Council for Social Development, 2015). The promulgation of the national lockdown had broken the camel’s back of an economy that was already registering a slower growth rate, increased unemployment rates and an overall decline in consumption expenditure (Kannan, 2020). The continuation of the lockdown is in its fourth iteration in 739 districts of the country colour coded as red, orange and green zones based on the occurrence of new cases, transmission rates, deaths and the threat of faster community transmission, with rules of movement of people and functioning of businesses restricted on a sliding scale (Ministry of Health and Family and Welfare [MOHFW], 2020).
The present containment policies, while important to combat the disease and break the cycle of transmission, are likely to place many low-income households at the brink of hunger and starvation, a threat worse than the COVID-19, if not supported with necessary welfare measures. Cash and Patel (2020, p. 1) argue that the lockdown strategy being adopted by the Global South countries may subvert the ‘two core principles of global health: that context matters and that social justice and equity are paramount’.
India has 216,824 confirmed cases with 6,088 deaths as on 03 June 2020. The highest number of cases is in western India (Maharashtra 74,860 and Gujarat 18,117) followed by southern India (Tamil Nadu 25,872) and the country’s capital Delhi with 23,645. The lockdown is now in its fifth phase. 1 Despite enforcing strict measures, since the third phase of the lockdown, there has been an increase in the number of active cases, with a rising number of deaths but a stable case fatality rate of 2.8 per cent. However, a complete social and economic shutdown threatens to disproportionately jeopardise the lives of the poor who not only are deprived of earning an income but also live in dense habitations with poor access to water and sanitation, creating barriers to hand washing, maintaining hygiene and observing physical distance (Agarwal, 2011; Corburn et al., 2020). The long-neglected public health measures, as a prevention strategy to deal with the communicable diseases load in India such as TB, Pneumonia, Diarrheal diseases, etc., have come back to haunt the country with the new addition of another virulent respiratory disease as COVID-19 in the year 2020 (Dasgupta, 2005; Parmar, 2020).
The present article examines India’s readiness for lockdown and physical distancing with the given access to infrastructure. Specifically, this article attempts to address the following key questions: what is the physical distance readiness of households in the lowest 25th income quartile of the population? What is the statistical association of physical distance readiness to the incidence rate (ratio of the proportion of newly added cases in total population) and case fatality ratio (ratio of deaths at a given day to total cases on a day taking into account the average time-period from case confirmation to death) (Chatterjee & Jain, 2020)?
This article covers the trajectory of the pandemic in India, the issue of social and health inequalities, the peculiar significance the concept of social distancing has in India and the discriminatory outcomes that it has led to. Thereafter, the article introduces research to assess physical distance preparedness as covered by other researchers, followed by discussing the measures used and the results of relative measures on physical distance readiness and its correlates with case fatality ratio (CFR) and incidence rates, respectively, which have been presented leading to the conclusion on what does the data drive home on dealing with COVID-19.
COVID-19: Indian Trajectory and Current Status
On 30 January 2020, the state of Kerala reported the first confirmed case of COVID-19 who had a travel history from Wuhan, China. In the month of February 2020, India did not witness a significant rise in the cases. However, in the month of March 2020, 22 new cases came to light, including those of an Italian tourist group with 14 infected members. The first 50 COVID-19 cases were reported in a span of 41 days and were spread across 12 states and 18 cities/districts. The transmission escalated during March 2020, after several cases were reported all over the country, most of which were linked to people with a travel history to affected countries. The spread of the virus had occurred mostly through social gatherings in various religious and public events, which escalated social transmission at the community level. The ensuing lockdown from 23 March 2020 further aggregated the problem, since millions of informal sector migrant workers dwelling in urban shanties desperately left their homes, gathered and marched towards their villages due to loss of livelihoods. Inadequate preparation and deficient preventive equipment restrained the state capacity to respond to the contagion. On 12 May, the reported death toll rose to 2,752 and the number of cases rose to 85,940, surpassing China’s 84,940 in terms of the total number of positive cases reported. As compared to other countries, the reported cases are relatively low in India attributed to demography of the country with a larger young population and also due to low level of testing and poor self-reporting. Of the total fatalities, Maharashtra tops the tally with 2,465 deaths, Gujarat comes second with 1,092 deaths, Delhi at 556, Madhya Pradesh at 364 and West Bengal at 335. 2
Social Inequalities, Health Inequities and the Risk of COVID-19
The WHO Commission on Social Determinants of Health Report (2008) unwaveringly states that it is not diseases but social injustice that kills people. Societies, in varying degrees, are stratified along the lines of class, caste, race, gender, age, religion, ethnicity, location, sexual orientation and disability. The combined influence of biological, environmental and a host of social–political–cultural determinants interplaying with the social markers produce differential health outcomes and inequities (Diderichsen et al., 2001; Ravindran & Gaitonde, 2018).
Deaths due to COVID-19 across various countries throw light on the key aspects associated with vulnerability and risk (The Lancet Editorial, 2020). A higher proportion of deaths in China and Italy occurred among the elderly and people with co-morbidities. So, these populations were identified as vulnerable and therefore at risk of contracting the virus if not socially in isolation. Individuals with jobs that have a direct interface with public (e.g., doctors, nurses, ambulance drivers, police, community health workers, food supply delivery people, cashiers and taxi drivers) are at risk. People living in racially and socially segregated dense settlements and habitations are vulnerable to contracting the virus due to the nature of the virus and its modes of fast transmission. According to the Centre for Disease Control and Prevention, USA, death rates among Black/African American persons (92.3 deaths per 100,000 population) and Hispanic/Latino persons (74.3) are substantially higher than those of White (45.2) or Asian (34.5) persons (Centre for Disease Control and Prevention, 2020). Apart from gender and age data at the aggregate level and locations and the number of cases by states and cities, data in India are not available by socio-economic categories. However, the reporting of cases of deaths occurring in the frontlines among emergency service workers and the quick spread in the densely populated slums of cities like Mumbai reiterate the point about the co-existence of risk and vulnerability as factors that contribute to caseloads and mortality (Shukla & Maharashtra Health Analysis Group, 2020; Singh, 2020).
Regarding co-morbidities and the vulnerability that they cause, it is important to be concerned with pre-existing Tuberculosis (TB) incidence, with India contributing to 27 per cent of the global TB caseload as per the Global Report on TB 2019. A total of 449,000 people died of TB alone in 2018, according to the report (WHO, 2019). Malnutrition, alcoholism, HIV and living close to infected patients contribute to TB. The novel coronavirus compounds and complicates the disease burden among the poor who are major victims of TB.
In the context of COVID-19, the health inequalities pan out to produce:
These socially conditioned ‘unfair’ and ‘unavoidable’ differences throw fresh challenges for self-isolation, physical distancing and maintaining a strong immunity.
Social Distancing and Discriminatory Outcomes
The Ministry of Health and Family Welfare had issued a circular spelling out the specifications of social distancing to be implemented by all the states, as follows:
Social distancing is a non-pharmaceutical infection prevention and control intervention implemented to avoid/decrease contact between those who are infected with a disease causing pathogen and those who are not, so as to stop or slow down the rate and extent of disease transmission in a community. This eventually leads to decrease in spread, morbidity and mortality due to the disease. (MOHFW, 2020, p. 2)
India has a long history of social distancing engraved in the caste system with purity and pollution practices regarding sharing of food, water, goods, space, rituals, gods, icons, habitats and strict rules of marriage, and forbiddance of inter-caste and inter-religious marriages to maintain the purity of blood and lineage. The so-called higher castes have always socially distanced ‘other castes’ from a range of social and economic resources (Anand, 2020; Gupta et al., 2020). Hence, a term like social distancing invokes discriminatory practices and perceptions of who is considered to be a potential carrier of the contagion. Discriminatory statements, demonising communities, mass spraying of migrants with sanitisers, imprinting messages on people’s hands, writing messages of quarantine on foreheads, differential safe passage arrangements for international and domestic migrants and differential quarantine facilities for different socio-economic strata have their roots in a society stratified by caste, class, gender and ethnicity (Kannabiran, 2020).
While the term social distancing is much in use, there have been concerns expressed about the potential loss of solidarity, support and community that is required in such difficult circumstances leading to depressions, suicidal tendencies and intimate partner violence (Vieira et al., 2020). Abel and Macqueen (2020, p. 231) suggest ‘Public health should approach the threat of COVID-19 by promoting spatial distance together with social closeness’. According to them, the term social distancing does not convey this dual requirement.
In terms of extending support within the Indian context, several community-level initiatives by NGOs and community-based organisations (CBOs) have pitched in to raise money to distribute food grains, to run community kitchens and to run helplines for counselling support. According to an India Today survey, in 13 states and union territories, NGOs outperformed the government services in providing humanitarian aid to stranded migrants and to the homeless (Rawat, 2020). However, the magnitude of the requirement is much more, and the inaccessibility of services to the needy is beyond imagination (Das, 2020). The pre-existing inequalities and vulnerabilities in India are making the requirement of social distancing daunting to adhere to and be enforced (Gopichandran et al., 2020; Johari, 2020).
Deficits in the Prerequisites for Physical Distancing
The severity of the pandemic is largely determined by access to the basic necessities for the poor households who are at the highest risk of the pandemic. Using the global Multidimensional Poverty Index database for 2019, which covers 101 countries and 5.7 billion people in the developing world, critical facts about the COVID-19 response have been put forward by Alkire et al. (2020). The key messages highlight overlapping vulnerabilities, deprivations with regards to water, sanitation and cooking fuels, placing several billions of people vulnerable and at great risk. Drawing from Alkire-Foster’s method to understand overlapping vulnerabilities, Tavares and Betti (2020) from Brazil studied eight interlinked vulnerability indicators that cover drinking water, sanitation, electricity, housing, overcrowding, dependency ratio, cooking fuels and access to school meals to assess the capacity of Brazil to deal with a lockdown. A policy blog by Jonnes et al. (2020) reports an analysis that they had carried out with data from Mozambique to assess the lockdown readiness of rural and urban Mozambique, on five key indicators such as electricity, water, sanitation, telephone and employment. They observe that less than a quarter of the population is fully ready for a lockdown. All the above papers record an abysmal performance of all the countries on key parameters that enable people to stay home and not risk contracting the virus.
Key Variables and Their Association with Prevention of COVID-19

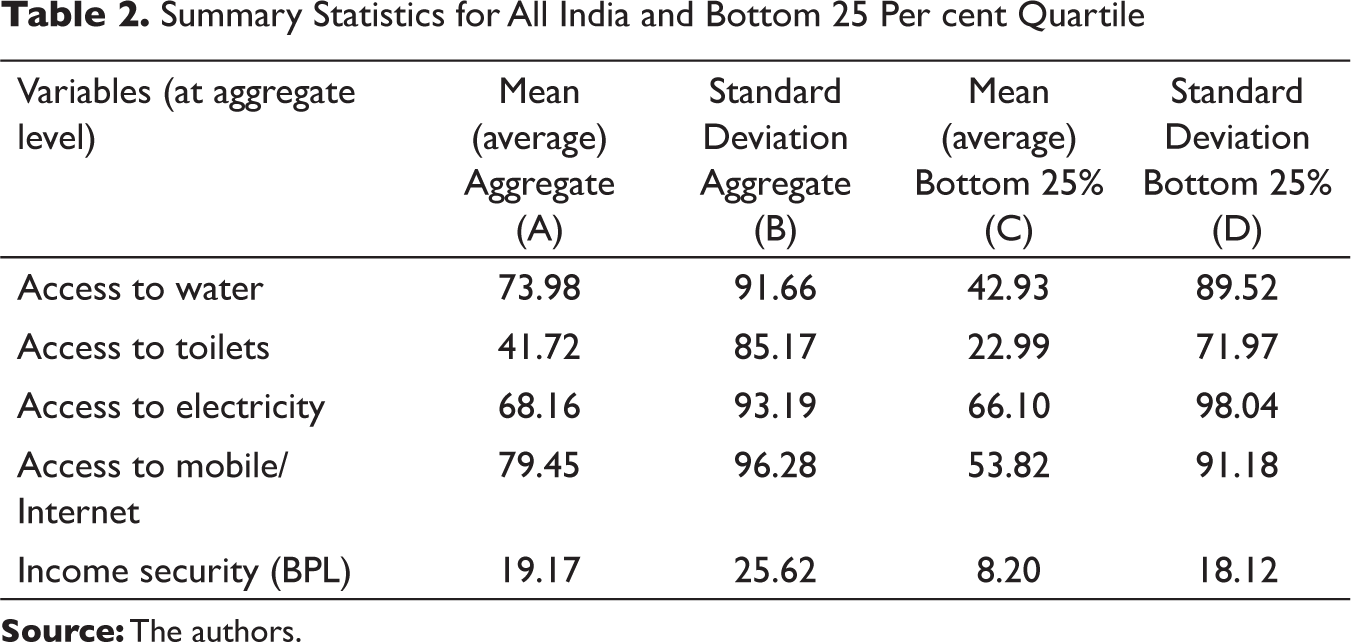
Summary Statistics for All India and Bottom 25 Per cent Quartile
Physical Distance Readiness Measures
Based on the Lockdown Readiness Index proposed by Jonnes et al. (2020), we have attempted to construct a simple relative measure which we are calling as ‘Physical Distance Readiness Index’ (henceforth PDI) to measure the access to basic amenities that enable physical distancing during the lockdown and post the lifting of the lockdowns, using a weighted average method. This index consists of five variables that capture people’s readiness for physical distancing based on:
(a) access to safe drinking water; (b) access to clean toilets in the home/within their residential premises; (c) access to electricity (d) income security (as measured by the total number of the population below poverty line) and finally (e) access to mobile phone and Internet. This index is constructed using three sources of datasets, namely from the NSSO survey 75th and 76th rounds by the NSSO, 4th National Family Health Survey data by IIPS and the Reserve Bank of India’s poverty rates (see Table 1). We have assigned equal weights of 20 per cent to all subcomponents to reduce concentration risk of high standard deviation while enhancing diversification. Moreover, as it is recommended by the WHO and the Government of India that people remain at home; hence, the studied variables are assumed to be of equal importance in influencing the decision whether to stay at home or come outdoors. Further, we standardised each variable to a scale between 0 (applied to the lowest value of the series) and 1 (applied to the highest value in the series) according to Crowards (2000) and the minimum value for a series is subtracted from each of its entries in turn, the result of which is divided by the difference between the maximum and the minimum of the series.
Results: Physical Distance Measures, Incidence Rates and Case Fatality
As discussed above, the existing parameters on living standards and household resource capacities are directly related to the capacity to ‘stay home and stay safe’ to prevent contracting the virus and also have the immunity to withstand the debilitating illness, if contracted. This implies that the population living in habitations where basic needs such as water, toilets, sewers, drainage, waste collection and secure and adequate housing are in short supply or non-existent are susceptible to contracting illnesses and the virus. The performance of 29 Indian states and union territories of India have been studied on these parameters and their association with the incidence of cases and CFR 4 due to COVID-19 at the state level has been observed. The information on active cases and deaths due to COVID-19 has been taken for the period between 15 April and 12 May 2020 from the government COVID-19 website. 5 The weekly national average of the total number of confirmed cases, active cases and deaths are used to calculate the CFR and incidence rate covering second and third phases of the national lockdown. We have excluded the first phase due to underreporting of cases across many states (Biswas, 2020). This article focuses on the state-level pattern of plausible correlations with key variables but does not attempt to draw any inferences on the pattern of causality. The National Sample Survey 75th and 76th Rounds household data 6 for the lowest 25 per cent quartile 7 of the sample population is utilised to measure the variables such as access to water, toilets, electricity, income and mobile phone. The summary statistics are presented in Table 2.
Table 2 shows the descriptive statistics for all India level and bottom 25 per cent quartile. According to the 76th round of NSSO, at the national level, only 74 per cent of households have access to safe drinking water. Among the rural households, 45 per cent have no access to exclusive bathrooms and 39 per cent have no access to exclusive latrines, of these, 5 per cent each uses public facilities (NSSO, 2019a & 2019b). At the aggregate level, the proportion of households is 68 per cent and 79 per cent having access to electricity and mobile/Internet connection, respectively. There is greater parity with regards to electricity with 66 per cent of poor households having access. The percentage of households using mobile/Internet (mobile data) heterogeneously across the states is 53.42. At the national level, 19 per cent of households fall below the poverty line set according to the Tendulkar Committee Report, as referred in the RBI (2020). A higher value of standard deviation as shown in Table 2, indicates that India does not measure up to the expectations in providing basic necessities to the poor households and in displaying readiness for lockdown and maintenance of physical distancing to prevent community transmission of COVID-19.
The Government of India has classified 130, 284 and 319 districts in India as red, orange and green zones, respectively, based on incidence and CFRs. 8 Table 3 shows the pairwise correlation of the key variables. The degree of association of PDI and CFR is weak and negative but statistically significant at 5 per cent, implying that Indian states with a higher value of PDI are likely to have lower CFR. A higher value of PDI indicates that on an average, the poor households have access to essential facilities above the national average. Hence, when the poor households of a particular state have access to these facilities above the national average, then we assume that there is higher readiness to physical distancing and lockdown. Similarly, the strong and negative correlation between PDI and Incidence rate indicates that the incidence rate will be lower in the states with a higher value of PDI; as a result, the rate of transmission will be low. The degree of association between incidence rate and CFR is strong and positive showing that the states with higher incidence rate also are likely to have higher CFR.
Pairwise Correlations: PDI, CFR and Incidence Rate
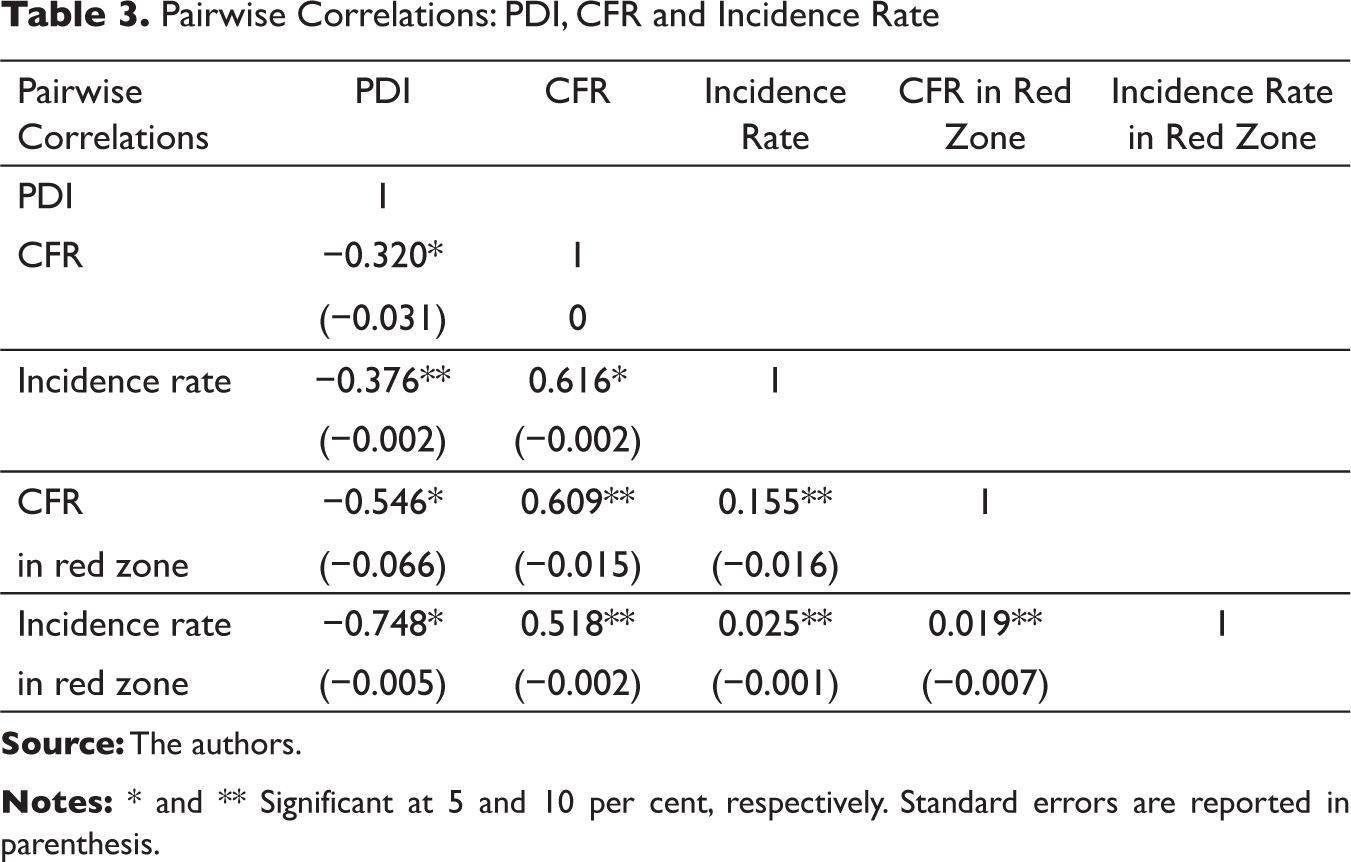
As per our analysis, the degree of association of PDI with CFR and incidence rate is negative and strong in the states under red zones. The relationship is also statistically significant, implying a higher incidence rate and CFR in the states under red zones that also have physical distance measures below the national average. 9 This points to the challenges for containment, mitigation and control of COVID-19 in districts with populations in the red zones where people living in resource-poor settings are at greater risk.
Figure 1(A) and (B) presents the scatter plots that depict the degree of association (correlation) between PDI, CFR and incidence rate across all states. It allows us to analyse the behaviour of the variables with fitted lines to account for average values of all observations with 95 per cent confidence interval to follow the normal distribution (i.e., the bell curve) of our observations. In Figure 1(A) and (B) the trend of CFR and incidence rate are inversely related with the PDI. However, the slope of CFR is relatively flatter than incidence rate, implying a higher degree of negative correlation of PDI and incidence rate as relative to CFR across Indian states.
Indian States and Their Levels of Physical Distancing Readiness
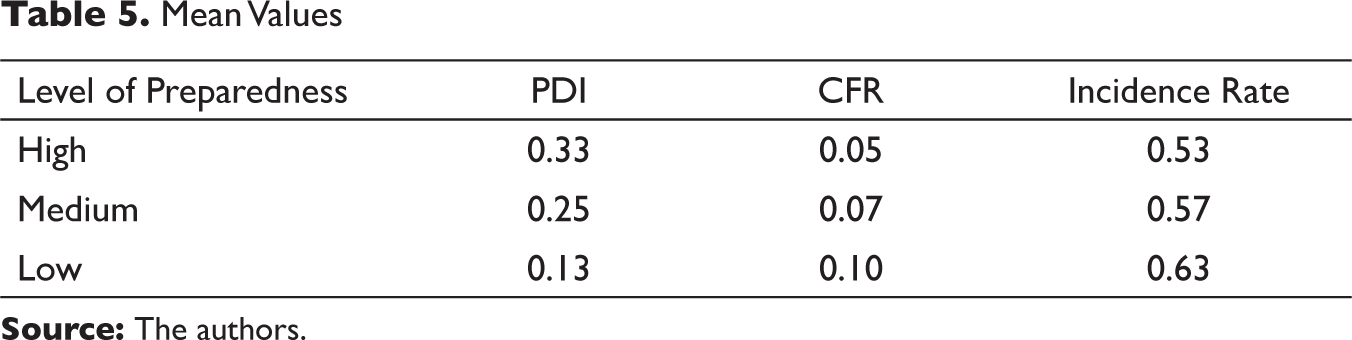
Next, we had categorised Indian states based on their level of readiness: low, medium and high (see Table 4). The categorisation is based on a scoring method used by Jonnes et al. (2020). For instance, for each variable of the PDI, a state gets the value of ‘1’ if the observed value is more than the median value of all states, otherwise, it is given ‘0’. Cumulatively, if a state scores the value of 1 each in more than 4 variables as described in Table 1, then it is classified as a state with the capacity for high readiness for physical distancing and lockdown. If the state’s score is greater than 2 and less than 4, it is classified as medium readiness for lockdown and a score lesser than 2 is classified as low readiness for lockdown. Our classification helped us maintain the skewed distributions to derive central tendency of parameters since it is much more robust and sensible. Table 5 provides the average values for the variables across the level of readiness.
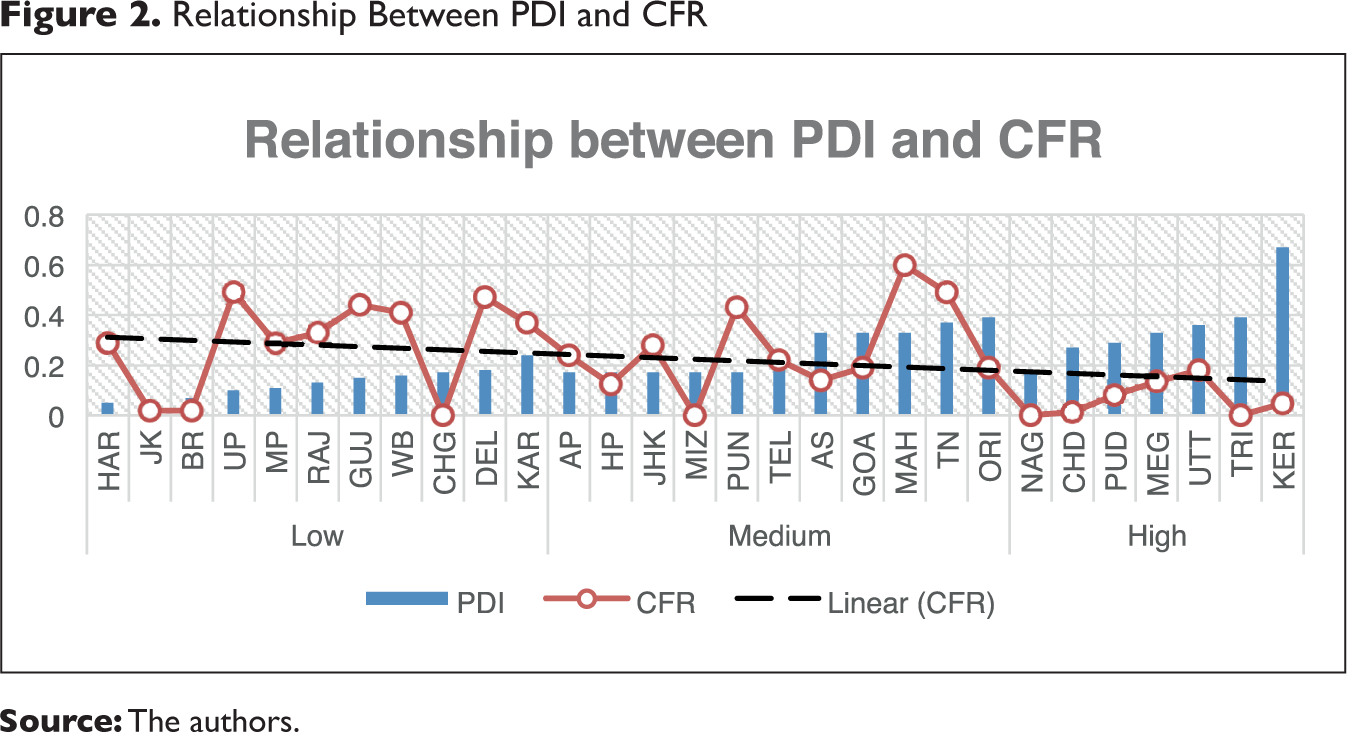
Across the level of readiness, we plot the trend line of PDI with CFR (in Figure 2) and PDI with incidence rate (in Figure 3). The horizontal axis represents states with differential PDI values and the vertical line represents the average value of CFR and incidence rate. In Figure 2, we can see that a state with a lower capacity for readiness is likely to have higher CFR, when we assume that all other factors remain constant. The CFR shows a decline as the linear trend line indicates a low level to high level of preparedness to prevent the exposure by ensuring access to the basic necessities, welfare measures and safe isolation spaces. If we look at this graph carefully, one may see that the states of Jammu and Kashmir, Bihar and Chhattisgarh have reported 0 CFR rate when their PDI score is lower. This could be due to the delayed reporting of the first death case in these states when the exodus of return migrant workers reached to their source states and hence, it did not reflect in our studied period. On the contrary, the state of Uttarakhand, having a highest PDI score also has the highest CFR rate among the high PDI states because of return migration from Maharashtra, Delhi and Uttar Pradesh. While interpreting this result, it is important to note that the investment in building toilets, safe homes or even providing safe drinking water would not be possible due to the lockdown, but if these issues which are public health measures are addressed in the post-lockdown phase, then it is likely to minimise the impact of communicable disease load, in general, and help fulfil an overdue public health commitment.
Similarly, in Figure 3, we can see the likelihood of incidence rates drastically falling if the level of state capacity for lockdown readiness moves from low to higher levels by introducing interim measures to deal with community transmission. Distress movement of families due to lack of employment or forced eviction by the landlords not only contribute to transmission and acquisition of infections but can have long-term physical and mental health impacts, especially for unemployed youth, elderly, women and children. The intensity of transmission will be higher in low readiness states as compared to higher readiness states, assuming the influence of other variables being constant. While interpreting the results, we kept in mind the influence of outlier on our associative relationship with the key variables. For instance, the state of Maharashtra has the highest number of active positive cases, that is, 74,860 (as on 3 June 2020), but the PDI score is 0.33, which is slightly below the group median of 0.45. In this case, the rise in CFR or incidence rate is exogenously determined by factors, which fall outside the scope of the study variables such as a high urbanisation rate, presence of international airport, seaport, large slum population and declining public health expenditure in major metropolitan cities like Mumbai, which drive the transmission rate upwards (Duggal, 2020). Similarly, the states of Delhi (23,645) and Gujarat (18,117), despite scoring much lower in PDI, that is 0.17 and 0.18, respectively, relative to Maharashtra have second and fourth highest number of COVID-19 cases. A majority of migrant workers have already returned or en route to their state of origin. This is likely to increase the risk of transmission in their source states. These source states are also the states with lower level of lockdown readiness scores coupled with huge resource constraints. If the receiving states fail to detect positive cases at the entry point, follow up, trace and detect the health status of the returnees, the community transmission of the infection is imminent.
Indian States and Their Physical Distancing Readiness Levels

Mean Values

(A) Degree of Association Between PDI and CFR (with 95% CI)

Conclusions
The breakout of the COVID-19 pandemic has provided an important opportunity to revisit prevention aspects of disease control, which are public health measures—housing, safe drinking water, sanitation facilities, waste management and sewerage systems—and having an eco-system that creates the preconditions for maintaining good health. Using the lockdown readiness index proposed by Jonnes et al. (2020) and their scoring method, this article attempted to study the physical distancing preparedness of Indian states. We find that the majority of Indian states are least prepared for the COVID-19 pandemic from a public health perspective of having all the necessary physical infrastructure in place which enables people to stay indoors and also maintain physical distancing safely if outdoors. Our results show that the poorer households are unequally endowed for observing physical distancing and ensuring the effective implementation of lockdown. Our results provide an indicative but statistically significant association between the lockdown readiness, case-fatality and incidence ratios, considering other factors constant. While the country in a matter of time is expected to ‘flatten the curve’ through timely health care, medical technologies, advanced understanding of tracking and tracing individuals with the infection and quarantining them, the much neglected public health measures need to be prioritised in policy and planning in the post-COVID times. Addressing the huge deficits in access to safe drinking water, toilet facilities, clean living environment, electricity, access to information and secure livelihoods are much-needed development goals spelt out in each of the SDGs. Renewed efforts to achieve these goals need to take into consideration the dangers that can befall the world if communicable diseases are not paid serious attention.
Footnotes
Declaration of Conflicting Interests
The author declared no potential conflicts of interest with respect to the research, authorship and/or publication of this article.
Funding
The author received no financial support for the research, authorship and/or publication of this article.