
Abstract
Obesity is primarily due to excessive energy intake and lipid accumulation, leading to type 2 diabetes. Studies showed radish seed extract (RSE) can impede weight gain in mice, but the mechanism was unclear. We hypothesized that RSE inhibits obesity by stimulating adipocyte browning. Radish seeds were water-extracted, yielding a sulforaphene (SE) concentration of 1.381 ± 0.005 mg/g RSE. In 3T3-L1 adipocyte differentiation experiments, RSE and SE increased the expression of beige adipocyte markers uncoupling protein 1 (UCP1) and peroxisome proliferator-activated receptor-γ coactivator 1-α (PGC1α). In C57BL/6 mice, RSE and SE mitigated weight increase, averted fatty liver, and diminished fat accumulation. In the adipose tissue, we also noted the enhanced browning of white adipocytes through elevated expression of UCP1 and PGC1α. Increased mitochondrial numbers in treated adipocytes supported this effect. Additionally, RSE and SE improved glucose homeostasis and insulin sensitivity in high-fat diet-fed mice, indicating RSE's potential to prevent obesity and diabetes by enhancing adipocyte thermogenesis.
Keywords
Introduction
Obesity is a chronic medical condition caused by an excessive accumulation of body fat, resulting in substantial weight gain and disruption of normal adipose tissue function. Obesity treatment options currently include lifestyle interventions, pharmacotherapy, and bariatric surgery. 1 However, lifestyle interventions alone are often difficult to maintain, and pharmacotherapy is frequently used as an adjunctive therapy. 2
Synthetic drugs have been developed and tested as effective anti-obesity medications. Unfortunately, many of these drugs have failed to provide satisfactory treatment outcomes or have resulted in adverse side effects, leading to consumer distrust in weight-loss medications. The use of these agents emphasizes the importance of drug safety. 3 As a result, traditional herbal medicines and other natural substances that have been used for centuries have become preferred alternatives to synthetic drugs. Herbal medicine has produced promising results in the treatment of obesity, including the inhibition of adipogenesis by ginsenosides, 4 promotion of thermogenesis by berberine,5,6 and ability of curcumin to promote browning of white adipocytes. 7
Beige adipocytes are more metabolically active than white adipocytes and can enhance energy expenditure through thermogenesis, therefore, promoting the browning of white adipocytes has been proposed as a potential strategy for weight control. 5 While beige and brown adipocytes are specialized in thermogenesis, a process that generates heat by burning stored fat, white adipocytes are primarily involved in energy storage. White adipocytes and adipose tissue-derived stem cells are differentiated into beige adipocytes during browning, which allows them to participate in thermogenesis. Numerous stimuli, including cold exposure, exercise, and specific hormones and signaling pathways, can stimulate this process. 8
Several transcription factors have been implicated in the development of beige adipocytes, including PR domain containing 16 (PRDM16), peroxisome proliferator-activated receptors (PPAR)α/β/γ), CCAAT/enhancer-binding proteins (C/EBP α/β/δ), and peroxisome proliferator-activated receptor-γ coactivator 1-α (PGC1α).9,10 PGC1α is a coactivator that regulates the expression of genes involved in mitochondrial biogenesis, energy metabolism, and thermogenesis. Expression of PGC1α in white adipocytes induces the expression of many mitochondrial and thermogenic genes, including uncoupling protein 1 (UCP1), a key regulator of thermogenesis in brown and beige adipocytes.11,12
Raphanus sativus L. radish seed extract (RSE) has various pharmacological effects, including anti-hypertensive, 13 anti-lipolytic, 14 anti-insulin resistance, 13 gastrointestinal tract motility enhancement,15,16 and potential effects on cough, expectorants, and asthma. 17 RSE inhibits weight gain, decreases low-density lipoprotein (LDL) concentration, increases high-density lipoprotein (HDL) concentration, and reduces leptin concentration in the blood of mice. 18 Radish seeds contain several chemical components including alkaloids, glucosinolates, isothiocyanates, and flavonoids. Sulforaphene (SE) and sulforaphane (SA) are the two forms of isothiocyanate found in radish seeds; SE is the predominant form. 13 These compounds are thought to be involved in the observed pharmacological effects of RSEs. Reports indicate that SA may promote adipocyte browning, as demonstrated by an increased number of mitochondria and enhanced activity of respiratory chain enzymes in 3T3-L1 adipocytes. 19 SE was observed to suppress 3T3-L1 adipocyte differentiation and had more efficacy than SA. 20 Although several research studies indicate that radish seeds and their active components may facilitate weight reduction by blocking adipocyte differentiation,21–23 the in vivo benefits require further validation. Moreover, their impact on beige adipocyte differentiation has to be explored.
The study aims to investigate the role of RSE and its active compound SE in promoting the browning of white adipocytes as a potential treatment for obesity. By leveraging the differentiation of preadipocytes into beige adipocytes, the research explores how these treatments stimulate thermogenesis and reduce fat accumulation in vivo and in vitro.
Material and Methods
RSE Preparation
Radish seeds were purchased from the Pharmacy of Chinese Medicine (China). Radish seeds were extracted with water and autoclaved at 1.2 kg/cm2 pressure at 121 °C for 30 min. Subsequently, the mixture was cooled to 25 °C and centrifuged at 9500 × g for 10 min. Next, the mixture was filtered through 0.7 μm filter (Whatman, Maidstone, UK) and lyophilized using a freeze dryer Scanvac (LaboGene, Bjarkesvej, Denmark). The extract powder was stored at −20 °C until used.
Chemicals
Glucoraphenin (GCP, purity ≥ 95%, Cayman Chemical Co., MI, USA) and sulforaphene (SE, purity ≥ 99%, MedChemExpress LLC., NJ, USA) were used as the standards. Acetonitrile (LC grade, J.T. Baker, NJ, USA), formic acid (FA, ACS reagent, ≥ 98%, Sigma-Aldrich, MO, USA), and the ultrapure water from Milli-Q system (Millipore, USA) were used for the mobile phase preparation of the high-performance liquid chromatography (HPLC) analysis. Dimethyl sulfoxide (DMSO, reagent grade, 99%, Sigma-Aldrich, MO, USA) was used as the diluent. The SE for animal experiments was purchased from Alpha Biotechnology (Chengdu, China).
Chromatographic Analysis
Standard stock solutions of GCP and SE were prepared at the concentration of 1.0 mg/ml in DMSO and stored at −80 °C. The working solutions of GCP and SE were diluted to 5, 10, 25, 50, 100, and 200 μg/ml in DMSO. Three RSE samples were prepared with a concentration of 2.0 mg/ml in DMSO. Each sample was analyzed triplet. For the quantification, the respective peak area of GCP and SE in RSE was calculated and correlated with the concentrations according to their calibration curve. The contents of GCP and SE were presented as mean ± standard error of the mean (SEM). The HPLC equipment was a Shimadzu LC-10AT system (Kyoto, Japan), including LC-10ATvp solvent delivery pumps, a SPD-10AVvp diode array detector (DAD), a SIL-10A autosampler, a SCL-10Avp system controller, a DG-2410 4 channel online degasser, and a COLBOX column oven (Analab Corp., Taiwan). The Hypersil™ BDS C18 column (4.6 × 250 mm, 5 μm, Thermo Fisher Scientific Inc., MA USA) was used as the stationary phase. The mobile phase was composed of 0.1% FA in water (v/v) (A) and acetonitrile (B), the column temperature was 35°C, the flow rate was 1.0 ml/min, the elution gradient program was developed as follows: 0–5 min, 10%–14% B (v/v); 5–20 min, 14% B; 20.01–25 min, 100% B; 25.01–35 min, 10% B. The DAD detector was set at 225 nm for GCP and 235 nm for SE, respectively, based on the UV absorption of standards and the previous studies with optimization.24,25 The validation procedures and data were presented in the supplementary information.
Animals
Six-week-old male C57BL/6 mice weighing 20 g were used for in vivo experiments. Mice were housed in a controlled environment with a 12 h light/dark cycle and relative humidity of 50%–65% at 22 ± 2°C. The mice were allowed to acclimate for two weeks prior to the experiments and were provided fresh food and water daily. After acclimatization for two weeks, the mice were randomly allocated to seven groups (5 mice per group): (1) Low fat diet (LFD; Cat. D12450J, Research Diet, New Brunswick, NJ, USA), (2) high fat diet (HFD; 60% energy from fat) (Table 1), (3) HFD group with SE treatment (5 mg/kg/day; fed orally), (4) HFD group with SE treatment (50 mg/kg/day; fed orally), (5) HFD group with 5% RSE (Table 1). SE was intragastrically administered to HFD mice once daily for six weeks. At the end of the experiment, mice were euthanized using isoflurane. Plasma was collected, and tissues of liver, inguinal, and epididymal adipose was quickly removed and frozen at
Mice Diet Ingredients.

Abbreviation: LFD: low fat diet; HFD: high fat diet; RSE: radish seed extract.
Histological Analysis
White adipose tissues from inguinal (iWAT, visceral adipose tissue [VAT]), epididymal (eWAT, subcutaneous adipose tissue [SAT]), and liver were dissected, immediately weighed, and fixed in 10% formalin solution for 1 d. After dehydration in ethanol, the tissue was embedded in paraffin and cut into 3 μm sections, which were then stained with hematoxylin and eosin (H&E). Sections were imaged using an Olympus DP80 microscope (Olympus, Tokyo, Japan) with cellSens standard 1.18 software at a 40× objective magnification.
Oral Glucose Tolerance Test (OGTT) and Insulin Tolerance Test (ITT) Measurements
An OGTT was performed after 6 weeks of feeding. Mice were fasted for 12 h before intragastric administration of 2 g/kg glucose, and blood was collected from the tail vein at 0, 30, 60, 90, and 120 min. Blood glucose was measured using an ACCU-CHEK Active meter (Roche, Basel, Switzerland) according to the manufacturer's instructions. For the ITT, mice were fasted for 12 h before intraperitoneal injection with 0.75 U/kg insulin, and blood glucose concentrations were determined at 0, 30, 60, 90, and 120 min using an ACCU-CHEK Active meter. GraphPad Prism software was used to calculate the area under the curve (AUC) for blood glucose concentrations.
Cell Culture and Differentiation
Preadipocyte 3T3-L1 cells were obtained from the American type culture collection (CL-173, Manassas, VA, USA). Cells were cultured in Dulbecco's modified Eagle's medium supplemented with 10% fetal bovine serum and 1% antibiotic-antimycotic at 37°C in a humidified atmosphere with 5% CO2.
Cells were seeded in 6-well plates (2 × 10⁵ cells/well) and incubated for 24 h to confluency (considered as Day 0). After confluency, the cells were incubated with adipocyte differentiation medium I (DM I, culture medium containing 0.25 μM dexamethasone, 0.5 mM 3-Isobutyl-1-methylxanthine, and 10 μg/ml insulin). After two days, the medium was changed to adipocyte differentiation medium II (DM II, culture medium containing 5 μg/ml insulin). Fresh DM II was changed every two days. After eight days, the cells were ready for the assay. RSE or SE was supplemented in DM I and DM II induction media from day 0 to day 8. Rosiglitazone (4 μM) and triiodothyronine (50 nM) were added to the DM II induction medium on day five as a positive control (PC).
Cell Viability Test
Cell viability was determined using the MTT assay. 3T3-L1 cells (4 × 10³ cells/well) were seeded in 96-well plates. RSE was immersed in 0.05% DMSO. Media containing different concentrations of RSE (0, 2000, 1000, 500, 250, 125, or 62.5 μg/ml) and 0.5% DMSO or SE (200, 100, 50, 25, 20, 10, 5, or 1 μM) were incubated for 72 h. For replications, each dosage was repeated in six wells. After incubation, the cells were removed and washed with PBS. Subsequently, a 20 μL mixture of MTS/PMS ((3-(4,5-dimethylthiazol-2-yl)-5-(3-carboxymethoxyphenyl)-2-(4-sulfophenyl)-2H-tetrazolium inner salt) (Promega, Madison, WI, USA) and 2 ml phenazine methosulfate 100 μL (Sigma-Aldrich, St.Louis, MO, USA) was added, followed by a 2 h incubation. The absorbance was read at 490 nm in a SpectraMax® ABS plus microplate reader (Molecular Devices, CA, USA).
Oxygen Consumption Rate
The Seahorse XF24 Flux analyzer, manufactured by Agilent Technologies in Santa Clara, CA, USA, was used to measure the Oxygen Consumption Rate (OCR) following the guidelines provided by the manufacturer. The 3T3-L1 preadipocytes were cultivated and induced to differentiate in XF24 cell culture microplates. In order to measure the glucose-dependent oxygen consumption rate (OCR), the growth medium was replaced with XF basic medium with 11 mM glucose, 2 mM glutamine, and 2 mM pyruvate. Adipocytes were subjected to a series of incubation steps involving the addition of 0.5 µM oligomycin, 5 µM carbonyl cyanide-p-trifluoromethoxyphenylhydrazone (FCCP), 1 µM rotenone, and 0.1 µM antimycin A.
Protein Extraction and Western Blot Analysis
The cells were collected and lysed with RIPA buffer supplemented with a protease and phosphoprotease inhibitor (Roche, Basel, Swiss) mixture on ice and then sonicated at 4°C for 30 min. The lysate was centrifuged at 12000 rpm for 30 min at 4°C. Adipose tissue protein was extracted by Minute™ Total Protein Extraction Kit for Adipose Tissues/Cultured Adipocytes (AT-022, Invent Biotechnologies, Plymouth, MN, USA) according to the manufacturer's instructions. Protein concentrations were measured using a Bio-Red Protein Assay (Bio-Rad, Hercules, CA, USA). Samples (20 μg) were separated on SDS-polyacrylamide gels and then transferred to PVDF membranes (Millipore, Burlington, MA, USA). The membranes were blocked with 5% non-fat dry milk for 1 h, and then incubated with the indicated primary antibodies (Cell Signaling, Danvers, MA, USA) overnight at 4°C. The membranes were then washed three times and incubated with horseradish peroxidase-conjugated secondary antibodies (Cell Signaling, Danvers, MA, USA) for 1 h. The antibodies used is listed in supplementary table 1. Proteins of interest were identified using an enhanced chemiluminescence assay kit (Millipore, Burlington, MA, USA) according to the manufacturer's instructions. The blots were visualized using a chemiluminescence imaging system (LAS4000 Mini; GE Healthcare, Little Chalfont, UK). Band intensities were quantified using ImageJ software (version 1.49; National Institutes of Health, Bethesda, MD, USA).
Immunofluorescence Analysis
Tissues were embedded in paraffin, cut into 3 μm sections, and collected on glass slides. After deparaffinization, antigen retrieval was performed by boiling the slides in citrate buffer (pH 6.0); sections were then stained with antibodies against UCP-1 and ATP5A (Abcam, Cambridge, UK) at 4°C overnight. Subsequently, they were incubated with an anti-rabbit secondary antibody labeled with DyLight 488 (ThermoFisher, Waltham, MA, USA) or Cy3 (Jackson ImmunoResearch, West Grove, PA, USA) and DAPI for DNA staining. Sections were imaged using a Leica DMi8 microscope (Leica, Wetzlar, Germany) with the MetaVue software (version 7.8.8.0).
Statistical Analyses
Differences between experimental groups were statistically analyzed by one-way ANOVA using GraphPad Prism software (Version 7, San Diego, CA, USA). Tukey's multiple comparison tests are employed for making paired comparisons between treatment groups. Data are presented as means and were considered significant at P values < 0.05.
Results
Quantification of GCP and SE in RSE
Using the validated analytical technique, the amount of SE precursor-GCP and SE in the RSE extract was measured (Supplementary data). The linear regression equation that was obtained from the calibration curve was used to compute the standard quantities (Table 2). At a concentration of 2.0 mg/ml in DMSO, three RSE samples were prepared, and each sample underwent triplet analysis. GCP and SE within the RSE were quantified as 3.813 ± 0.003 mg/g and 1.381 ± 0.005 mg/g, respectively (Table 3).
Linear Regression Equations Used to Quantify the Concentration of Glucoraphenin and Sulforaphane.

GCP: glucoraphenin; SE: sulforaphene.
Glucoraphenin and Sulforaphane Concentrations in the Radish Seed Extract.
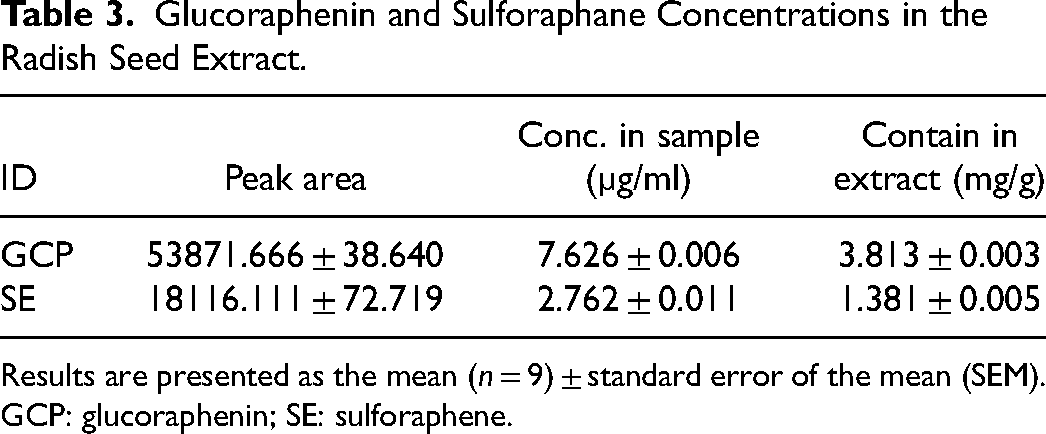
Results are presented as the mean (n = 9) ± standard error of the mean (SEM).
GCP: glucoraphenin; SE: sulforaphene.
RSE and its Active Compound SE Influence Cell Viability in 3T3-L1 Cells
To evaluate the cytotoxicity of RSE and SE, 3T3-L1 preadipocytes were treated with RSE (2000, 1000, 500, 250, 125, or 62.5 μg/ml) or SE (200, 100, 50, 25, 20, 10, 5, or 1 μM) for 72 h. The survival rate was determined using the MTT assay. As shown in Figure 1A, RSE promoted the growth of 3T3-L1 preadipocytes at concentrations from 62.5–2000 μg/ml when compared with media only or 0.5% DMSO controls. The results suggested that there is no toxic effect of RSE against 3T3-L1 cells. The compound SE caused full cell death in the 3T3-L1 cells when used at concentrations of 200 and 100 μM. Additionally, a 40% reduction in cell growth was seen when the compound was used at a dose of 50 μM (Figure 1B). No significant cytotoxicity was observed at concentrations ≤ 25 μM SE. These findings indicated that RSE showed no significant cytotoxicity in 3T3-L1 preadipocytes. SE presented no significant effect on cell viability at concentrations < 25

Effect of RSE and SE on the viability in 3T3-L1 cells. RSE demonstrated no cytotoxicity against 3T3-L1 cells at any of the tested doses. SE did not have an impact on the growth of 3T3-L1 cells at concentrations below 25 μM. 3T3-L1 cells were treated with (A) RSE (0, 2000, 1000, 500, 250, 125, or 62.5μg/ml, and 0.5% DMSO) and (B) SE (0, 200, 100, 50, 25, 20, 10, 5, and 1 μM) and cell viability was determined. Data are expressed as the mean ± SD (n = 6) and quantified as percentages that are normalized to the untreated control. The ANOVA is utilized to assess the statistical significance of differences (P < 0.05), and Tukey's multiple comparison tests are employed for making paired comparisons. The compact letter display was utilized to present the outcomes of multiple pairwise comparisons. RSE: radish seed extract; SE: sulforaphene; DMSO: dimethyl sulfoxide.
RSE and SE Promote the Expression of Browning Markers in 3T3-L1 Cells
The effects of the RSE and SE on 3T3-L1 cells were evaluated. Cells were cultured in adipocyte differentiation medium for eight days in the presence of a negative control (NC), PC, RSE, or SE. White adipose and beige adipose tissue differentiation were used to define the NC and PC, respectively. We assessed the treatment effects on browning markers using western blot analysis. As shown in Figure 2A, RSE induced PGC1α protein expression at concentrations of 2000 μg/ml and 1000 μg/ml compared to that of the NC. RSE also promoted increased expression of UCP1 at concentrations of 2000–125 μg/ml compared to that of the NC. SE, an active compound in radish seeds, produced similar results; increased expression of thermogenesis marker proteins, including PGC1α and UCP1, was observed at concentrations of 20–0.625 μM compared to that of the NC in 3T3-L1 adipocytes (Figure 2B). Furthermore, the differentiated adipocytes showed an increased of mitochondrial oxygen consumption, as indicated in Figure 2C. The basal respiration exhibited a 1.22-fold increase in the RS treatment and a 1.42-fold increase in the SE treatment, in comparison to the NC treatment (Figure 2D). The maximal respiration in the RS treatment increased by 1.57 times compared to the NC treatment, while in the SE treatment it increased by 1.83 times (Figure 2E). These results indicated that RSE and its active compound SE can promote adipose thermogenesis as indicated by increased PGC1α and UCP1 expression during 3T3-L1 differentiation.

RSE and SE stimulate the browning of 3T3-L1 cells, as evidenced by the upregulation of PGC1α and UCP1 expression. (A) 3T3-L1 cells were treated with NC, PC, or RSE (2000-7.8125 μg/ml) for eight days. Western blot analysis of PGC1α and UCP1. The specific bands were quantified with β-actin by image J software and the expression in NC was set as 1. (B) Cells were treated with NC, PC and SE (20-0.3125 μM) for eight days. Western blot analysis of PGC1α and UCP1. The bands were measured using β-actin, and the expression in the NC was standardized to 1. The western blots shown are one representative figure from three independent experiments. The results represent the mean ± SD of three independent experiments. (C) The OCR of differentiated 3T3-L1 cells treated with NC, PC, RSE (2000 μg/ml) or SE (20 μM) was monitored by adding different drugs oligomycin, FCCP, and Rot & Ant. (D) The measurement of basal OCR. (E) The measurement of maximal FCCP-induced OCR. The ANOVA is utilized to assess the statistical significance of differences (P < 0.05), and Tukey's multiple comparison tests are employed for making paired comparisons between all the treatment groups. The compact letter display was utilized to present the outcomes of multiple pairwise comparisons. NC: DMSO; PC: Rosiglitazone and triiodothyronine were added to the induction medium on day five as a positive control. NC: negative control; PC: positive control; OCR: oxygen consumption rate; FCCP: carbonyl cyanide-p-trifluoromethoxyphenylhydrazone; Rot: rotenone; Ant: antimycin A; RSE: radish seed extract; SE: sulforaphene; ANOVA: analysis of variance; UCP1: uncoupling protein 1; PGC1α: peroxisome proliferator-activated receptor-γ coactivator 1-α.
RSE and SE Reduce Adiposity in HFD-Induced Obese Mice
Next, we investigated the role of RSE and SE in HFD-induced obese mice. The mice were fed with LFD, HFD, HFD with 5 mg/kg or 50 mg/kg SE, or HFD with 5% RSE. Compared with that of HFD-treated mice, SE and RSE treatment resulted in a slight decrease in the HFD-induced body weight change (Figure 3A). However, the SE and RSE-treated groups exhibited significantly reduced HFD-induced body weight gain (Figure 3B). The decrease in body weight is not influenced by the amount of food consumed in various treatments (Figure 3C). This phenotype may be attributed to a marked reduction in the weight of SAT (Figure 4A) and VAT (Figure 4B), with no difference in liver weight (Figure 4C). SAT weights decreased 50.2, 37.8, and 56.3%, while VAT weights decreased 54, 46.9, and 55.3% in 5 mg/kg SE, 50 mg/kg SE, and 5% RSE groups, respectively when compared with that of the HFD-induced group (Figure 4A and B). The H&E staining results of the liver, SAT, and VAT sections are shown in Figure 5A, B and C, respectively. The size and number of lipid droplets were also reduced in the SE and RSE groups compared with that of the HFD-induced group. Collectively, these results showed that SE and RSE significantly mitigated obesity by decreasing white adipose tissue generation and lipid deposition in HFD-induced obese mice.
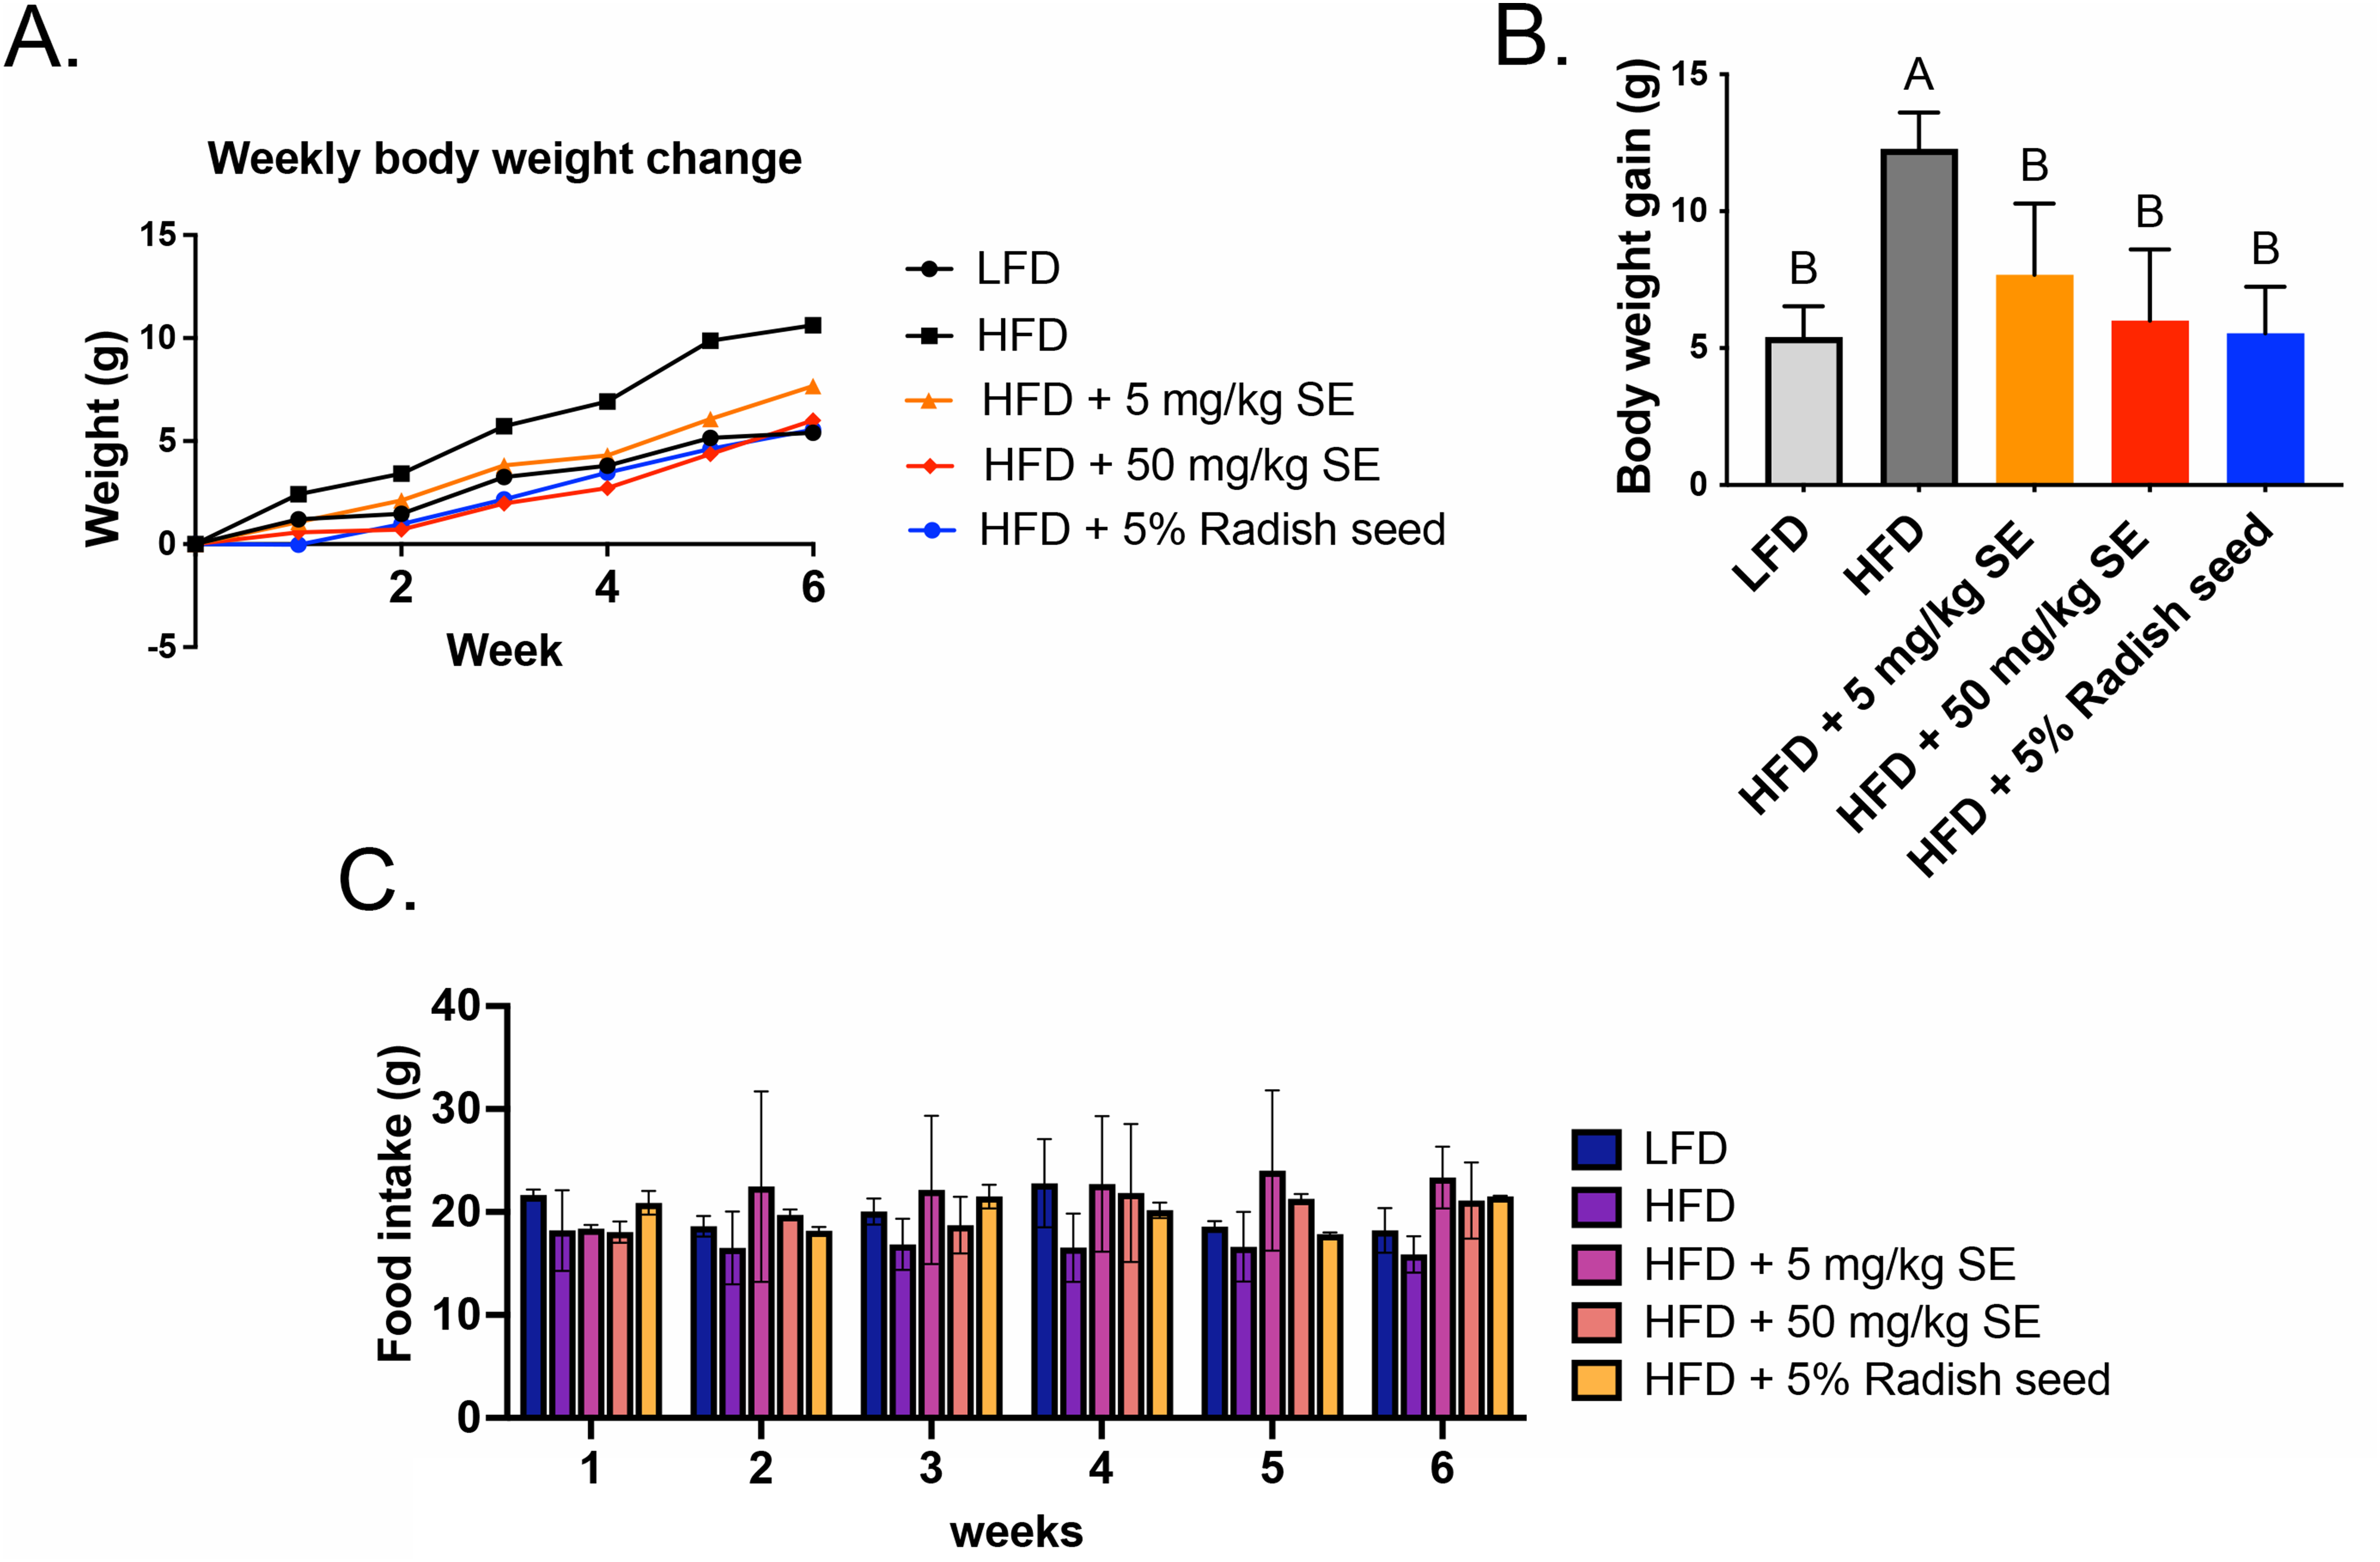
The weight increase generated by HFD was suppressed by the administration of RSE and SE. Mice were fed with HFD or HFD with RSE or SE for 6 weeks. (A) The change of body mass at the end of treatment. (B) The body weight gain. (C) The amount of food consumption across various treatments. The ANOVA is utilized to assess the statistical significance of differences (P < 0.05), and Tukey's multiple comparison tests are employed for making paired comparisons between HFD and all other treatment groups. The compact letter display was utilized to present the outcomes of multiple pairwise comparisons. RSE: radish seed extract; SE: sulforaphene; ANOVA: analysis of variance; HFD: high fat diet.
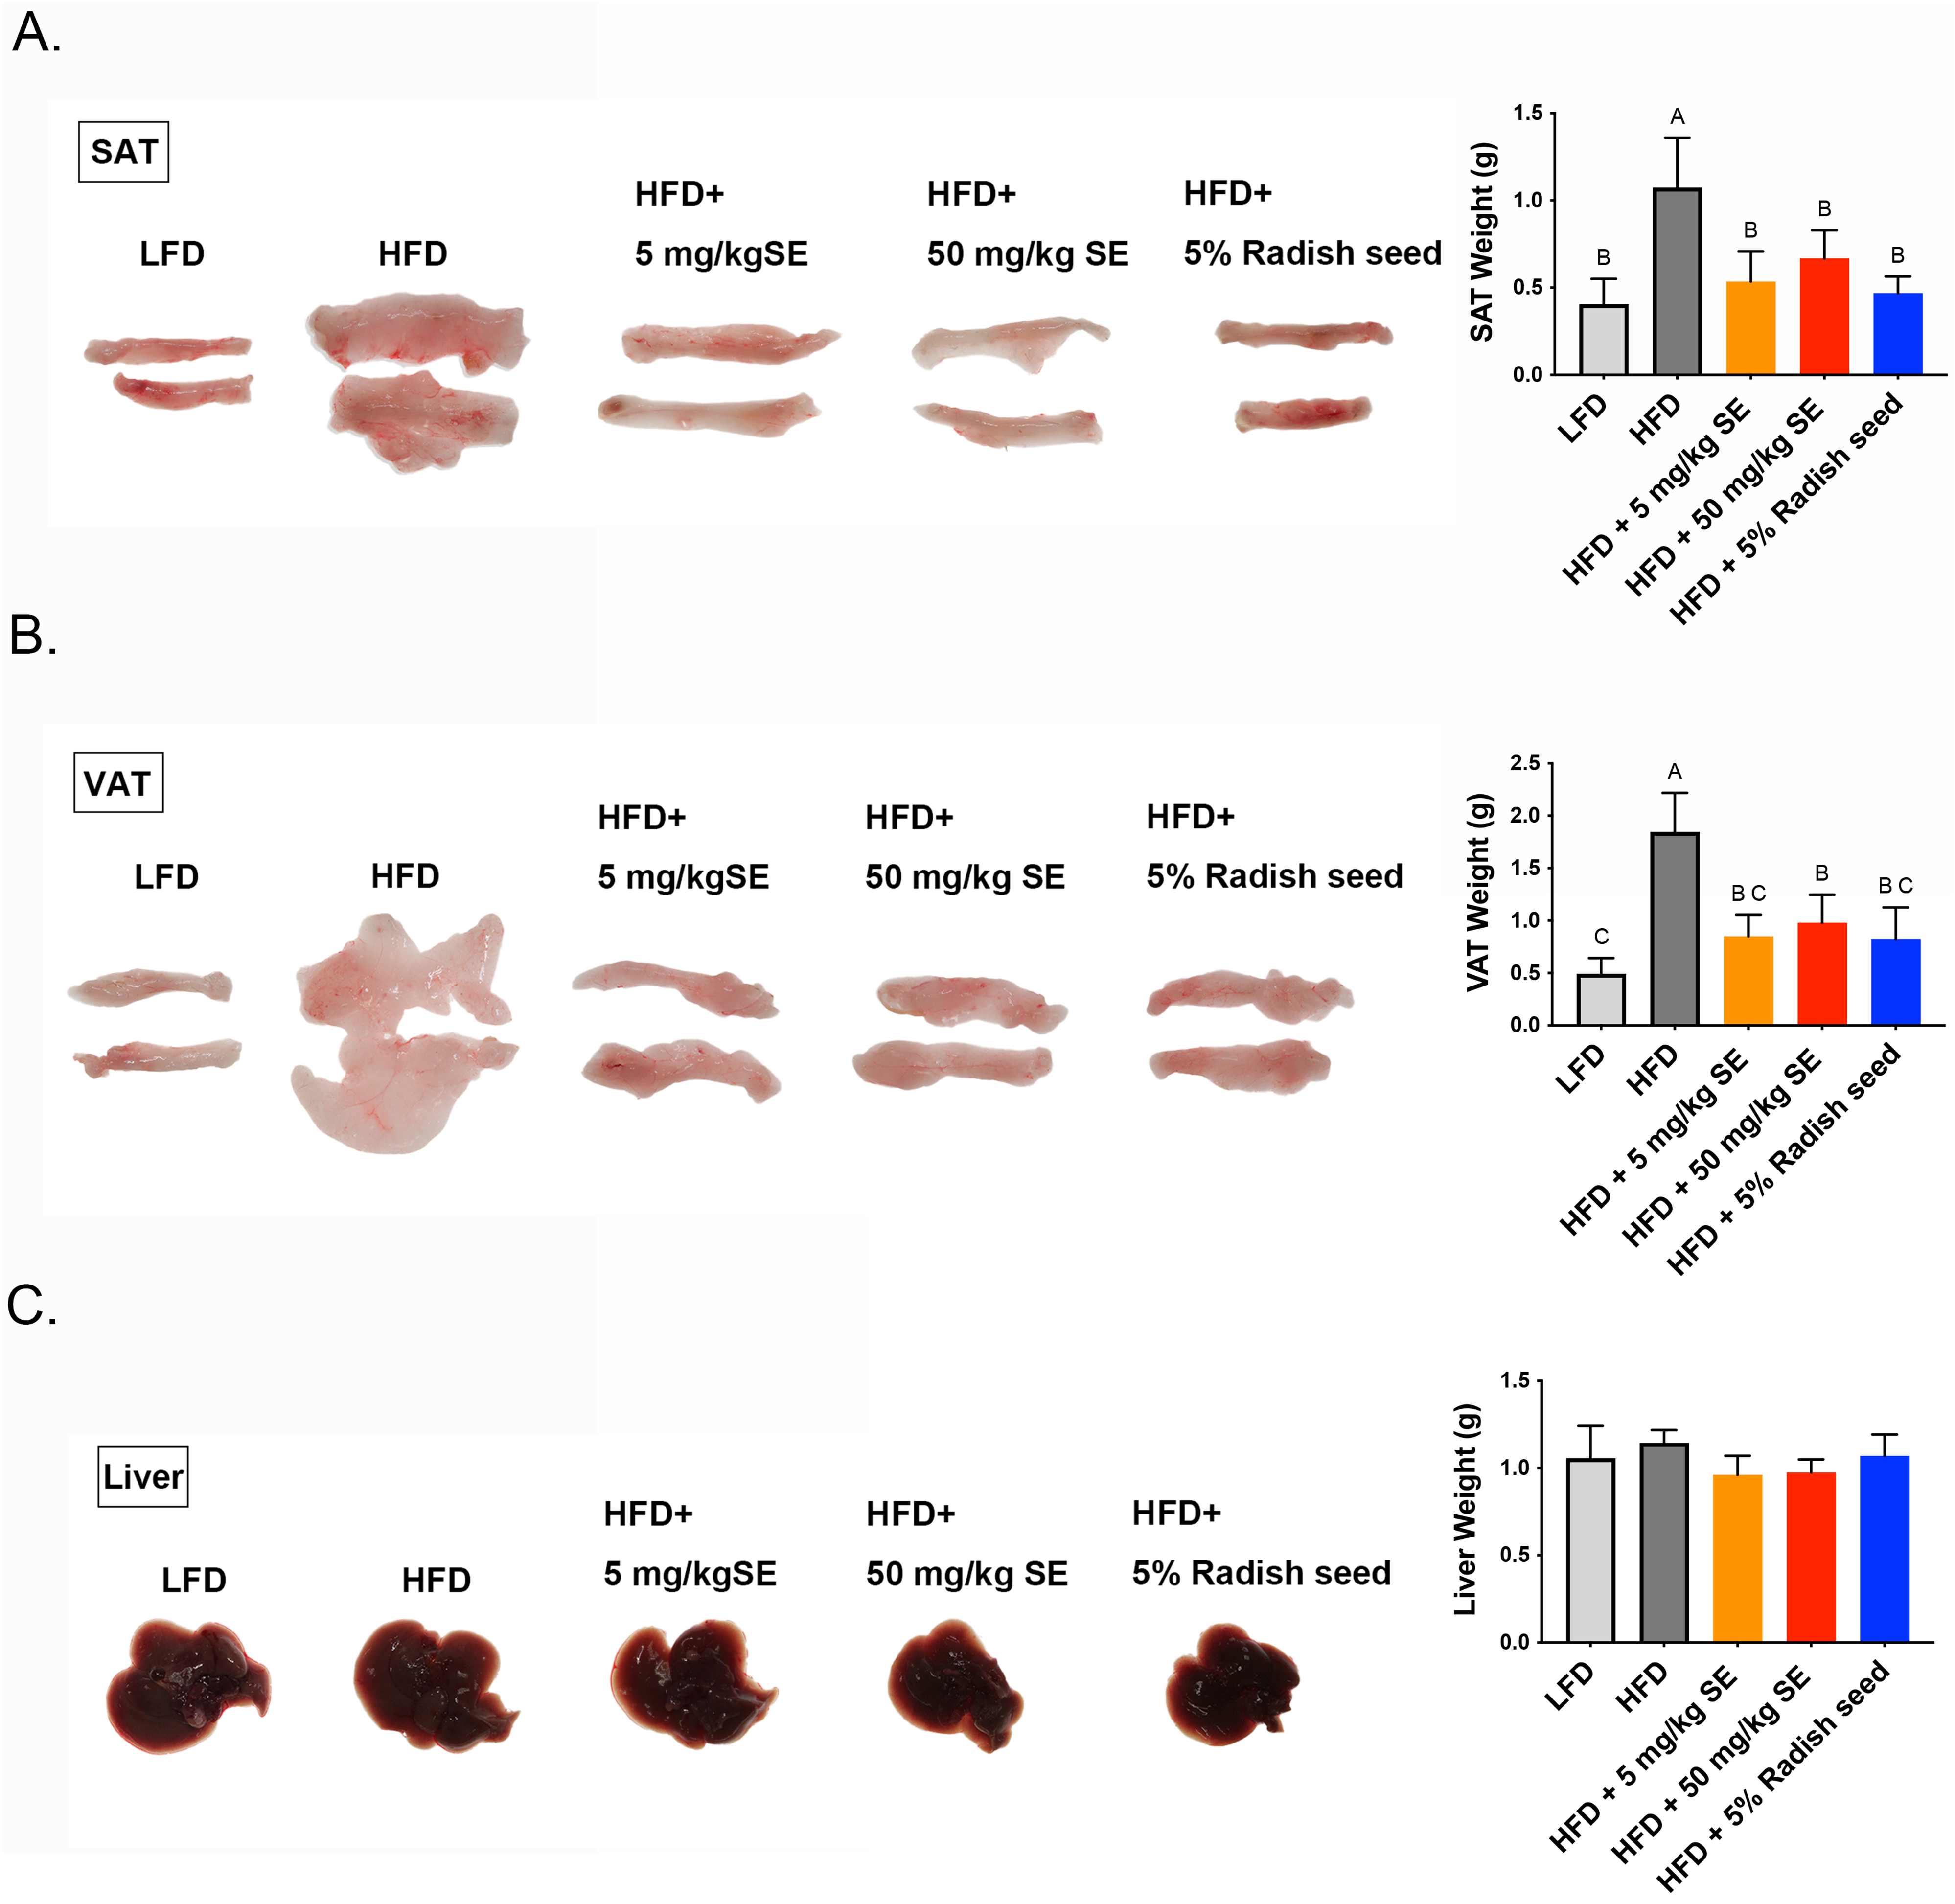
The administration of RSE and SE prevented the weight gain of the liver, SAT, and VAT caused by the HFD. Representative liver (A), SAT (B), and VAT (C) tissues images; the weights of tissues are presented as graphs. Data are expressed as the mean ± SD (n = 3). The ANOVA is utilized to assess the statistical significance of differences (P < 0.05), and Tukey's multiple comparison tests are employed for making paired comparisons. The compact letter display was utilized to present the outcomes of multiple pairwise comparisons. SAT: subcutaneous adipose tissue; VAT: visceral adipose tissue; RSE: radish seed extract; SE: sulforaphene; ANOVA: analysis of variance; HFD: high fat diet.

The intake of RSE and SE inhibited the accumulation of fat in liver cells and fat cells induced by the HFD. Representative sections of (A) liver (B) SAT and (C)SAT with H&E staining are shown. Images were observed with a light microscope at 400 × magnification (scale bar = 100 μm). The adipocyte diameter were measured by Image J software. The ANOVA is utilized to assess the statistical significance of differences (P < 0.05) in adipocyte diameter, and Tukey's multiple comparison tests are employed for making paired comparisons. The compact letter display was utilized to present the outcomes of multiple pairwise comparisons. SAT: subcutaneous adipose tissue; VAT: visceral adipose tissue; RSE: radish seed extract; SE: sulforaphene; ANOVA: analysis of variance; HFD: high fat diet.
RSE and SE Improve Glucose Tolerance and Induce Insulin Sensitivity in HFD-fed Mice
One aim of this study was to explore the beneficial effects of RSE and SE on glucose homeostasis. An OGTT was performed to assess the mice after a sugar challenge. The RSE and SE groups showed improved glucose disposal compared to that of the HFD group (Figure 6A). The significantly decreased glucose AUC from the OGTT in 5 mg/ml (30%) and 50 mg/ml (36%) SE treated groups indicated better glucose tolerance ability (Figure 6B). Treatment with RSE also exhibited a reduced glucose AUC of approximately 16%. After insulin injection, 5 mg/ml SE, 50 mg/ml SE, and 5% RSE groups showed significant glucose response to exogenous insulin as demonstrated by the AUC of the ITT. The insulin tolerance showed improved by 68, 44, and 96% in the 5 mg/ml SE, 50 mg/ml SE, and 5% RSE groups, respectively (Figure 6C and D). Taken together, these data indicated that 5 mg/ml SE, 50 mg/ml SE, and 5% RSE treatments in HFD mice improved glucose metabolism and enhanced exogenous insulin-stimulated glucose uptake.

The administration of RSE and SE resulted in enhanced glucose tolerance and heightened insulin sensitivity. (A) Assessment of OGTT efficacy following six weeks of various therapies. Mice were orally injected with glucose at a dose of 2 g/Kg. Blood glucose concentrations were measured at 0, 30, 60, 90, and 120 min. (B) AUC of OGTT. (C) ITT was conducted after a six-week period of administering several therapies. Mice were intraperitoneally injected with insulin at a dose of 0.75U/Kg. Blood glucose concentrations were measured at 0, 30, 60, 90, and 120 min. (B) AUC of ITT. Data are expressed as the mean ± SD (n = 3). The ANOVA is utilized to assess the statistical significance of differences (P < 0.05), and Tukey's multiple comparison tests are employed for making paired comparisons. The compact letter display was utilized to present the outcomes of multiple pairwise comparisons. OGTT: Oral glucose tolerance test; ITT: insulin tolerance test; RSE: radish seed extract; SE: sulforaphene; ANOVA: analysis of variance; AUC: area under curve.
RSE and SE Regulate the Expression of Browning Markers in the VAT of HFD-Induced Obese Mice
To confirm whether SAT and VAT browning was activated after RSE and SE treatments, we detected the expression of several genes related to adipose tissue browning. These cells are termed beige cells and had increased UCP1 expression. In our study, the protein expression of PGC1α, UCP1 and PRDM1 were significantly increased in the SAT (Figure 7A) and VAT (Figure 7B) of the 50 mg/ml SE and 5% RSE groups compared with that of the HFD group. Furthermore, immunofluorescence staining showed increased expression of UCP1 and ATP synthase F1, subunit alpha (ATP5A; a mitochondria marker) in SAT (Figure 8) and VAT (Figure 9) tissue sections compared to that of the HFD. These data indicate that RSE and SE treatment ameliorated HFD-induced obesity by inducing browning and stimulating mitochondrial biogenesis.

RSE and SE stimulated the development of beige adipocytes in VAT and SAT, as evidenced by an elevation in the expression of beige adipocyte markers PGC1α, PRDM16 and UCP1. (A) PGC1α, PRDM16 and UCP1 expression were assessed in VAT by western blot. The bands were measured using β-actin, and the expression in the LFD was standardized to 1. (B) PGC1α, PRDM1 and UCP1 expression were assessed in SAT by western blot. The bands were measured using β-actin, and the expression in the LFD was standardized to 1. The western blots shown are one representative figure from three independent experiments. The results represent the mean ± SD of three independent experiments. The ANOVA is utilized to assess the statistical significance of differences (P < 0.05), and Tukey's multiple comparison tests are employed for making paired comparisons. The compact letter display was utilized to present the outcomes of multiple pairwise comparisons. SAT: subcutaneous adipose tissue; VAT: visceral adipose tissue; RSE: radish seed extract; SE: sulforaphene; ANOVA: analysis of variance; LFD: low fat diet; UCP1: uncoupling protein 1; PGC1α: peroxisome proliferator-activated receptor-γ coactivator 1-α; PRDM16: PR domain containing 16.
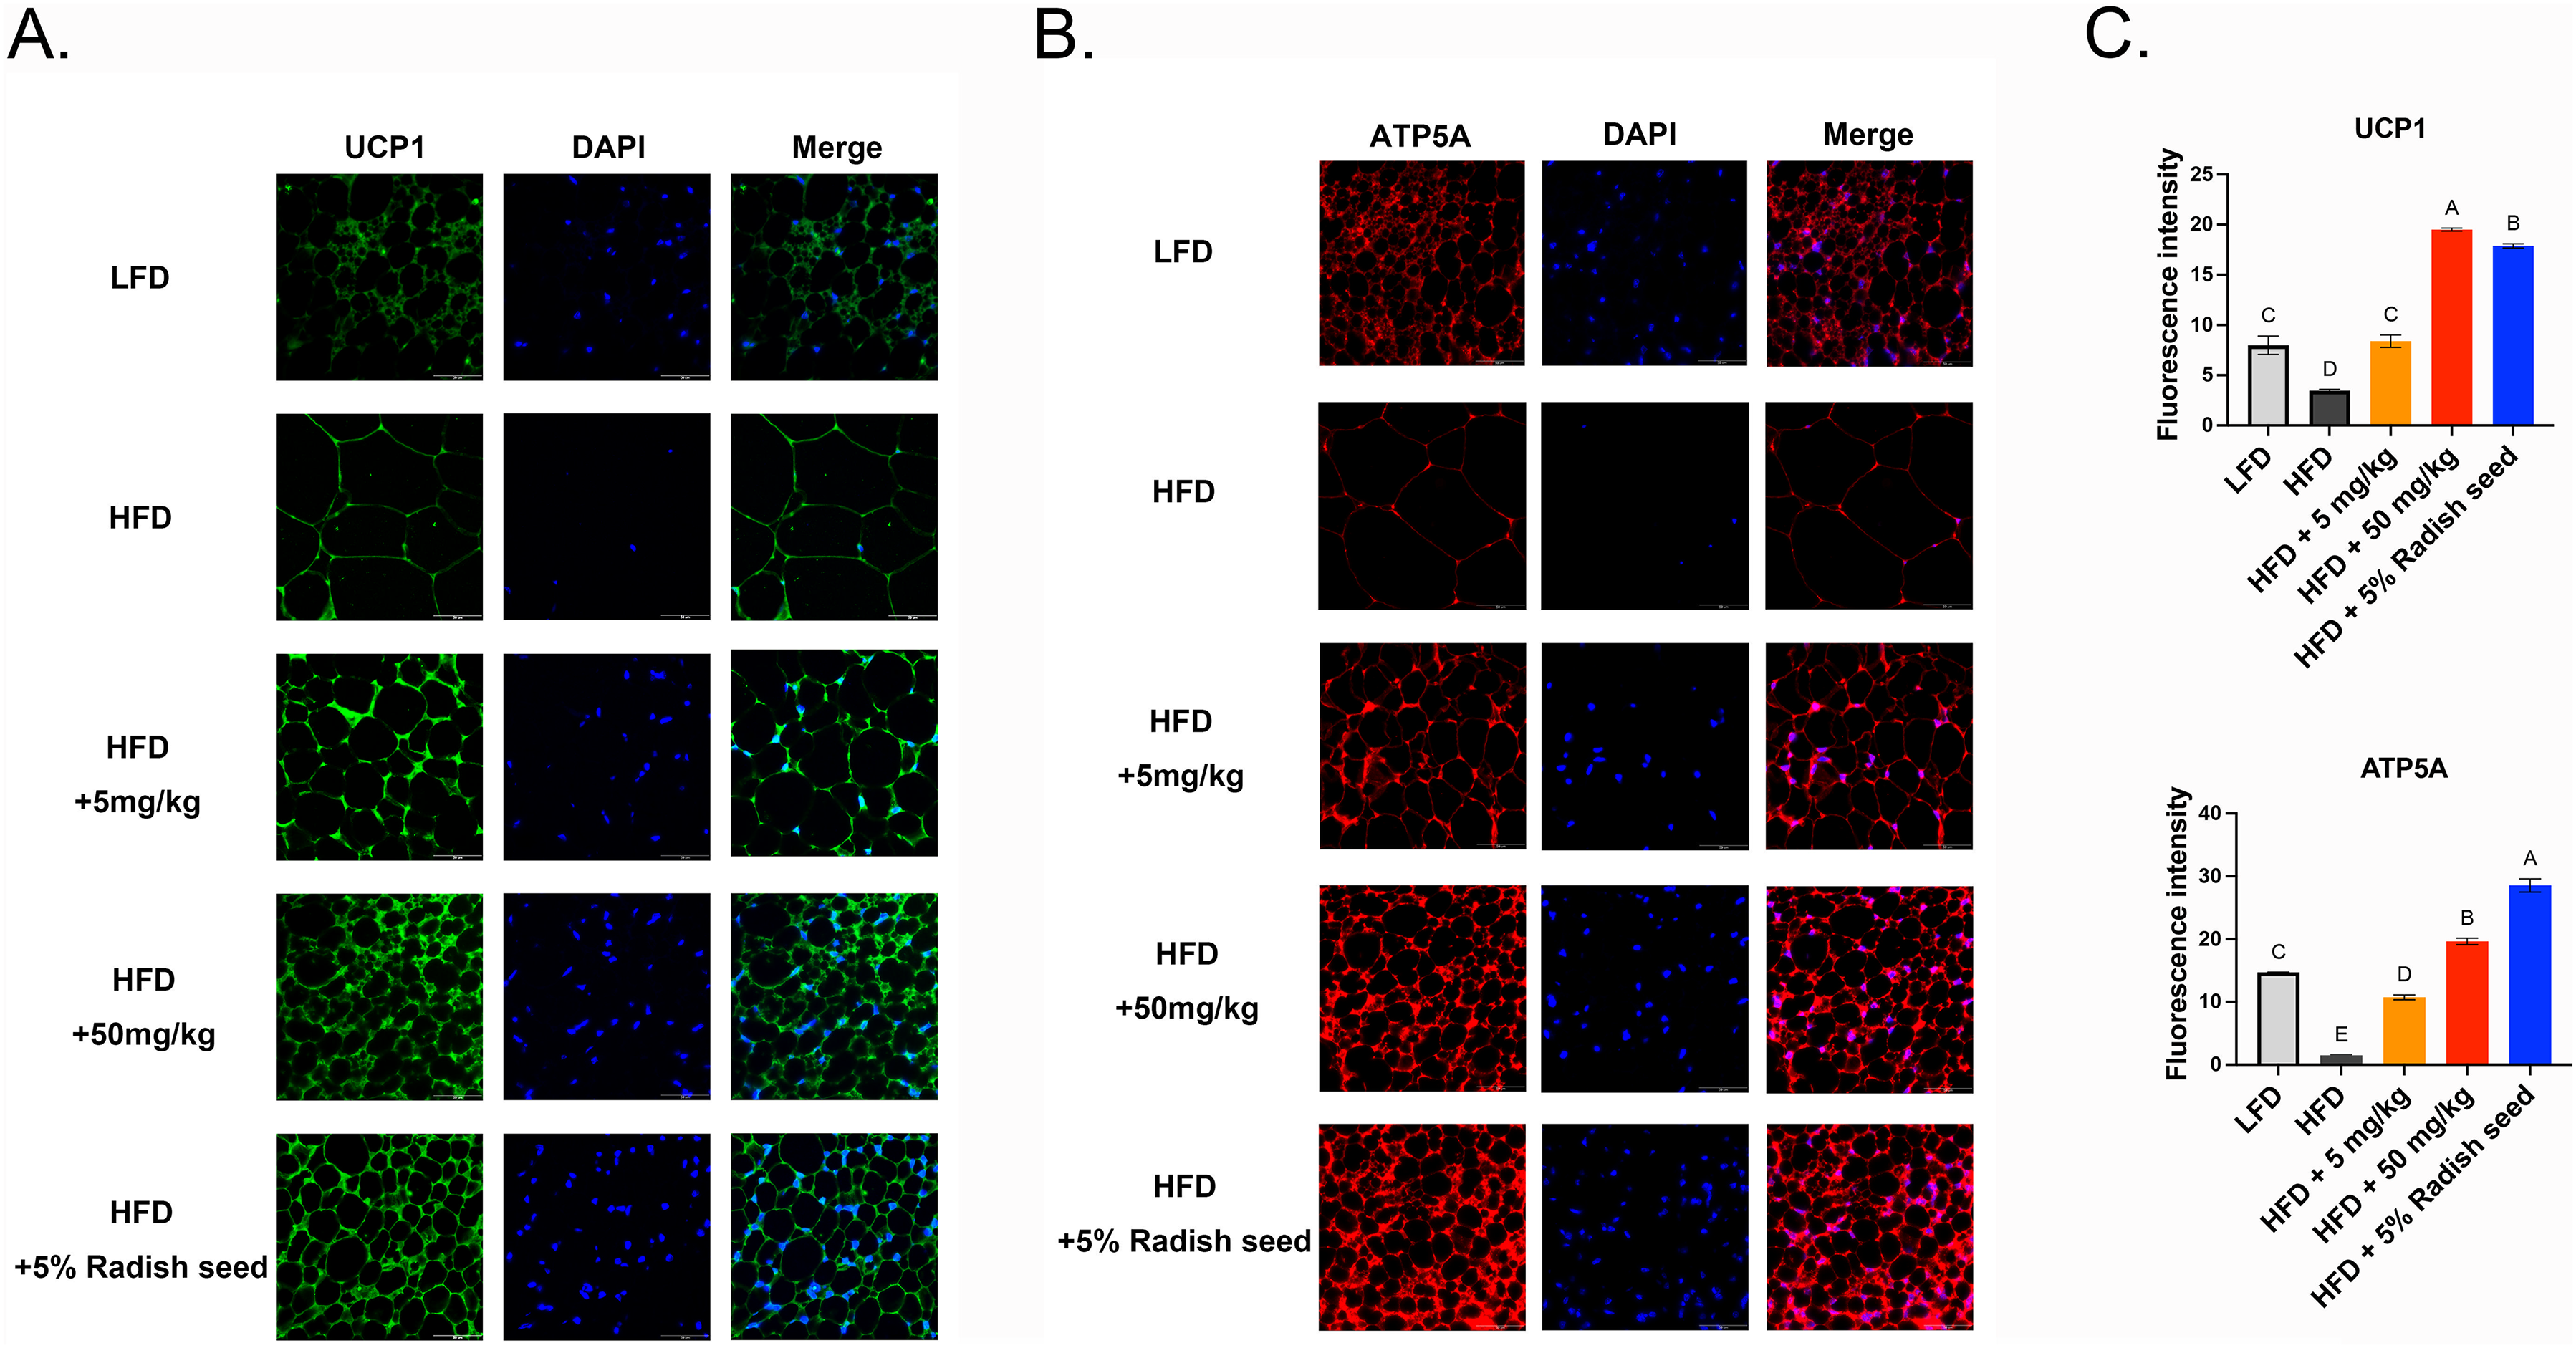
RSE and SE stimulated the development of beige adipocytes in SAT, as evidenced by an increase in the quantity of mitochondria (ATP5A) and an elevation in the expression of beige adipocyte markers UCP1. Immunofluorescence staining for UCP1 (A), ATP5A (B), and DAPI (blue) in SAT. Scale bar = 50 μm. (C) Relative expression of UCP1 and ATP5A were quantified using image J software. The ANOVA is utilized to assess the statistical significance of differences (P < 0.05), and Tukey's multiple comparison tests are employed for making paired comparisons. The compact letter display was utilized to present the outcomes of multiple pairwise comparisons. RSE: radish seed extract; SE: sulforaphene; ANOVA: analysis of variance; DAPI: 4′,6-diamidino-2-phenylindole; ATP5A: ATP synthase F1, subunit alpha; UCP1: uncoupling protein 1; SAT: subcutaneous adipose tissue.
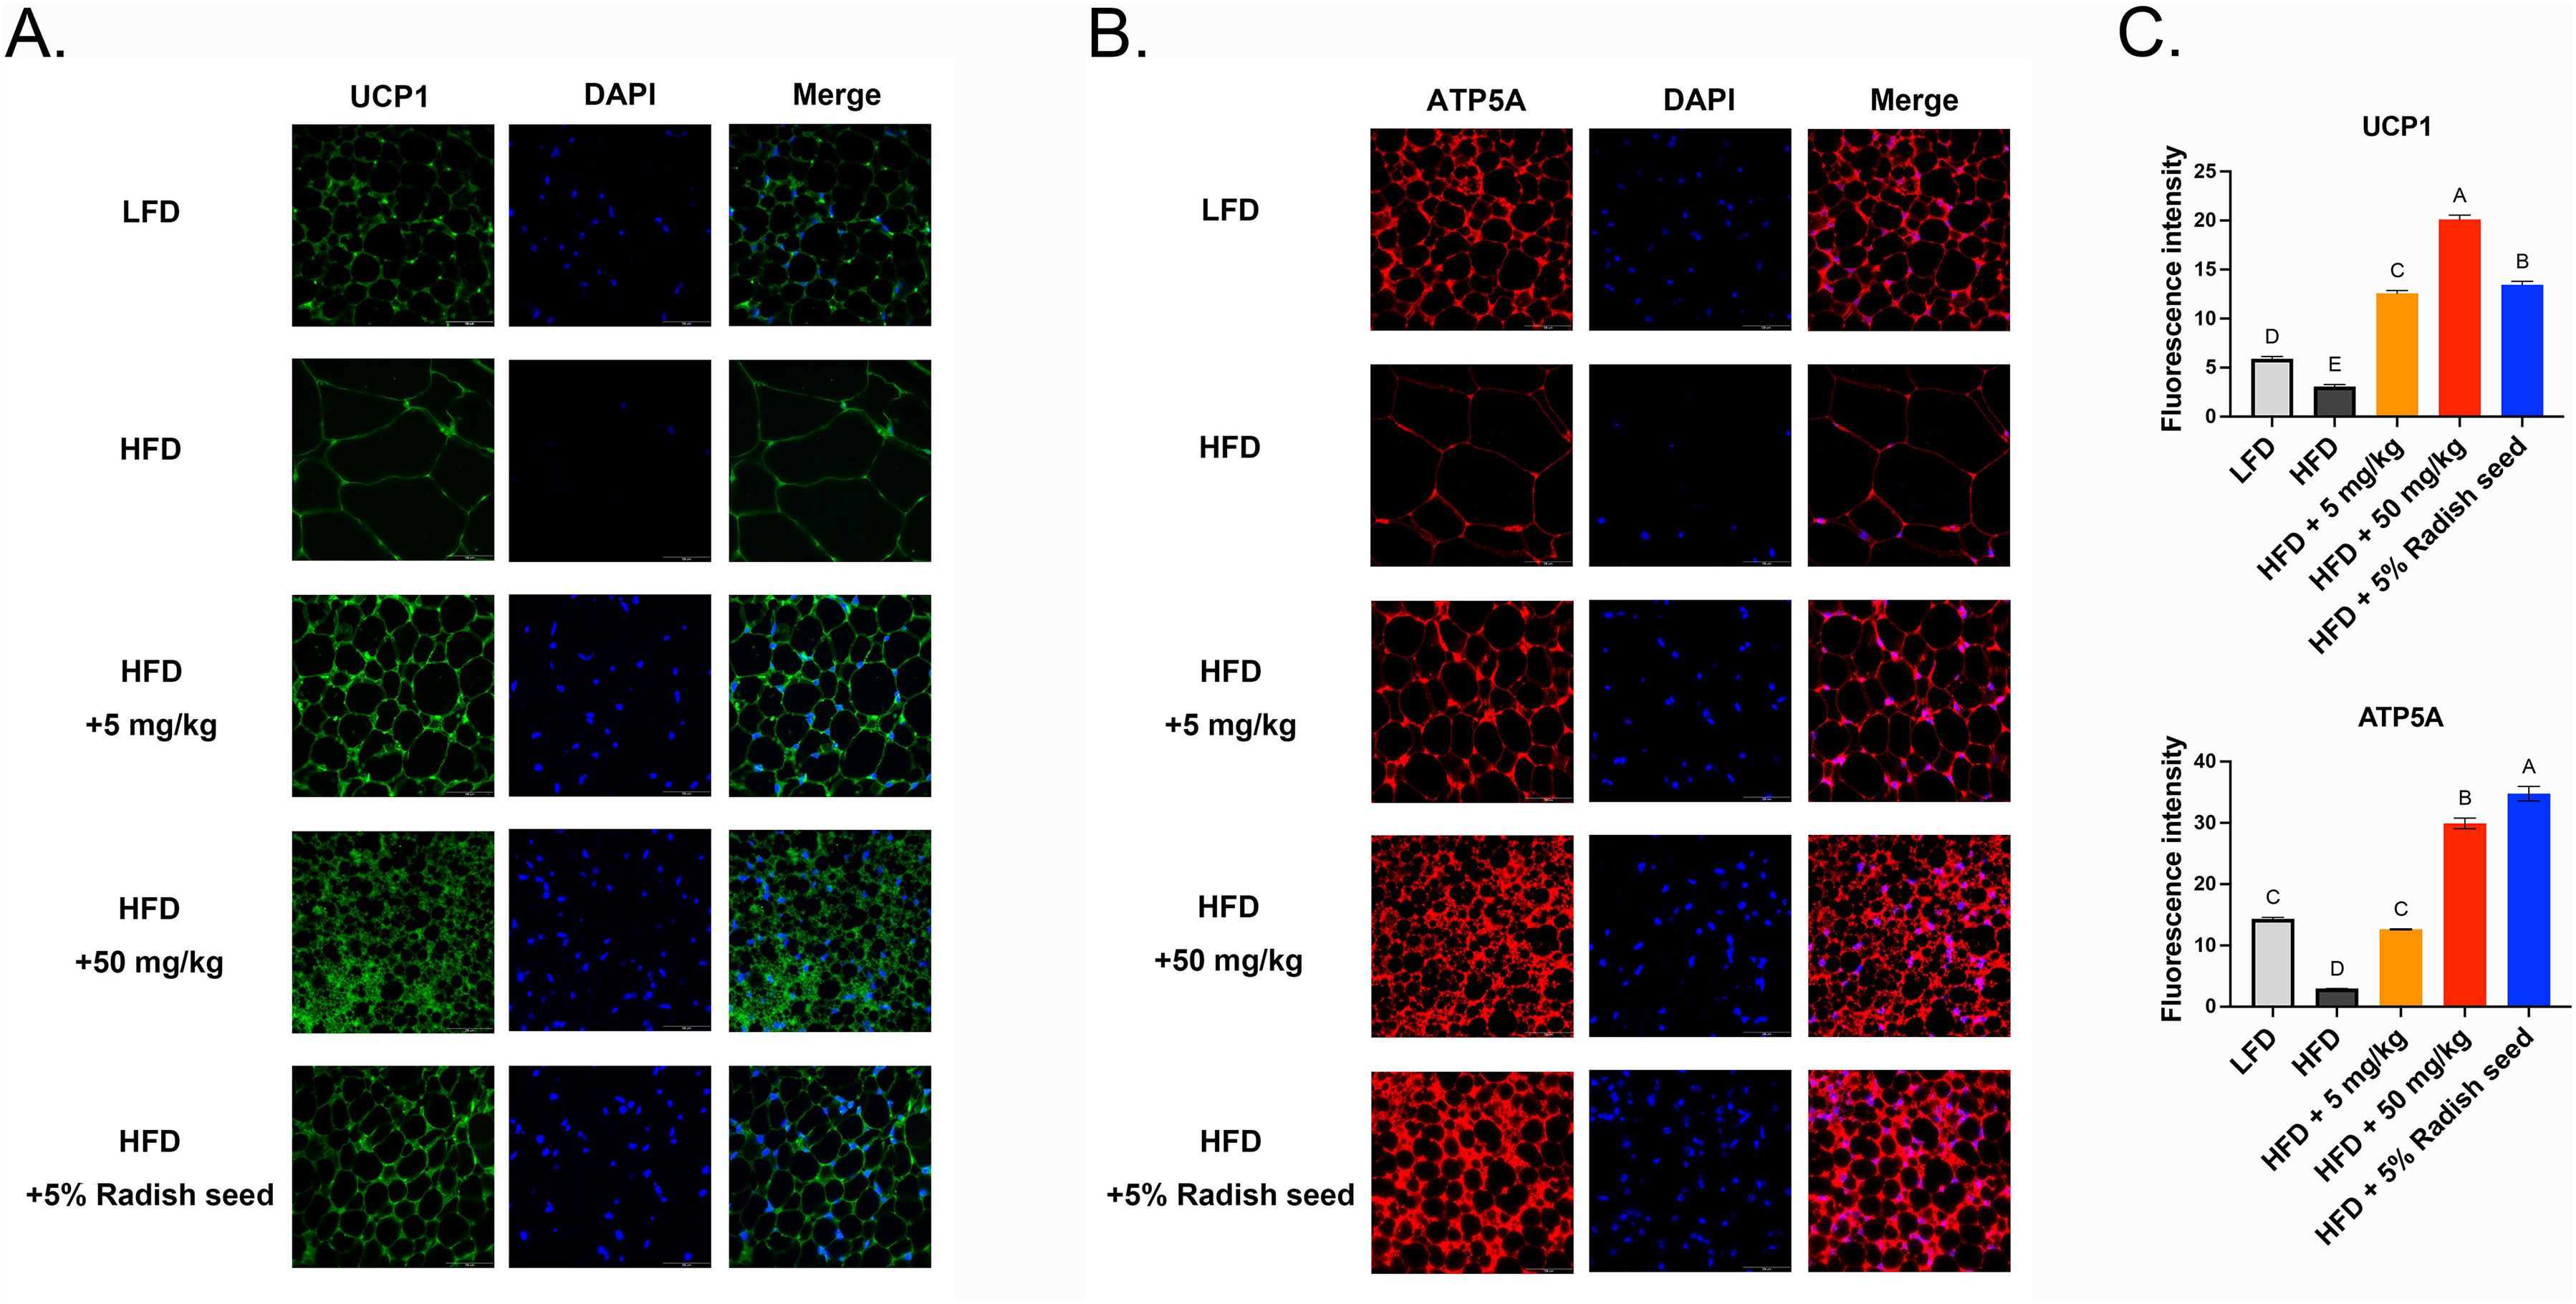
RSE and SE stimulated the development of beige adipocytes in VAT, as evidenced by an increase in the quantity of mitochondria (ATP5A) and an elevation in the expression of beige adipocyte markers UCP1. Immunofluorescence staining for UCP1 (A), ATP5A (B), and DAPI (blue) in VAT. Scale bar = 50 μm. (C) Relative expression of UCP1 and ATP5A were quantified using image J software. The ANOVA is utilized to assess the statistical significance of differences (P < 0.05), and Tukey's multiple comparison tests are employed for making paired comparisons. The compact letter display was utilized to present the outcomes of multiple pairwise comparisons. RSE: radish seed extract; SE: sulforaphene; ANOVA: analysis of variance; DAPI: 4′,6-diamidino-2-phenylindole; ATP5A: ATP synthase F1, subunit alpha; UCP1: uncoupling protein 1; VAT: visceral adipose tissue.
RSE and SE-Mediated AMP-Activated Proteinase Kinase (AMPK) Phosphorylation Involves in the Beige Adipocyte Differentiation of 3T3-L1 Cells
To investigate the processes involved in the differentiation of beige adipocytes through RSE and SE, we examined the activation of AMPK in 3T3-L1 cells. AMPK has been recognized as a vital stimulator in the differentiation of beige adipocytes. 28 We postulated that RSE and SE would trigger AMPK activation to facilitate the differentiation of beige adipocytes. Consequently, we quantified the activation of AMPK in 3T3-L1 cells that were exposed to RSE and SE. Figure 10 demonstrates a notable increase in AMPK phosphorylation in 3T3-L1 cells following treatment with RSE and SE. The findings indicate that the activation of AMPK contributes to the differentiation of beige adipocytes mediated by RSE and SE.

RSE and SE mediated AMPK activation drives the thermogenic differentiation of 3T3-L1 preadipocytes. Differentiated 3T3-L1 cells treated with NC, RSE (2000 μg/ml) or SE (20 μM). Western blot analysis of AMPK and phosphorylated AMPK was performed. The bands were measured using β-actin and AMPK, and the expression in the NC was standardized to 1. NC: DMSO. The western blot shown is one representative figure from three independent experiments. The results represent the mean ± SD of three independent experiments. The ANOVA is utilized to assess the statistical significance of differences (P < 0.05), and Tukey's multiple comparison tests are employed for making paired comparisons. The compact letter display was utilized to present the outcomes of multiple pairwise comparisons. RSE: radish seed extract; SE: sulforaphene; ANOVA: analysis of variance; NC: negative control; DMSO: dimethyl sulfoxide; AMPK: AMP-activated protein kinase.
Discussion
Obesity is a serious disease with numerous complications. Every year, approximately 300,000 people die as a result of obesity, with the majority of deaths related to obesity-associated complications. 29 According to recent statistics, the global obesity or overweight population has risen to more than 2 billion people, or 30% of the world's population. 8 The research highlights the ability of RSE and SE to stimulate the browning of white adipocytes. This process enhances thermogenesis, increasing energy expenditure and reducing fat accumulation. This browning effect is linked to the upregulation of UCP1 and PGC1α, which are key markers for thermogenic adipocytes. The findings suggest that targeting adipose tissue browning may be a promising therapeutic approach to treat obesity by enhancing fat metabolism and promoting weight loss. Insulin resistance, a hallmark of type 2 diabetes, is commonly exacerbated by excess fat accumulation, leading to elevated blood sugar levels. The study observed that the improvements in glucose metabolism were independent of dietary intake, as the food consumption across treatment groups was consistent. This suggests that RSE and SE enhance glucose regulation through mechanisms directly linked to improved insulin sensitivity and not merely by reducing caloric intake. By improving glucose homeostasis, these compounds could serve as promising alternatives or complementary treatments in the management of metabolic disorders. The study highlights that while SE is a key bioactive compound in RSE, the whole extract likely contains other beneficial components that enhance its overall anti-obesity effects. The group treated with 5% RSE showed significantly greater reductions in both body weight and fat mass compared to the group treated with SE alone, suggesting that multiple compounds within RSE may work synergistically to produce more pronounced results. This observation underscores the importance of exploring the full spectrum of bioactive molecules in RSE rather than focusing solely on SE. One potential contributor to the enhanced efficacy of RSE is sinapine, another compound found in radish seeds. Sinapine has been shown to modulate lipid metabolism, reduce triglyceride levels, and lower low-density lipoprotein (LDL) concentrations, which can further support the prevention of fat accumulation and obesity. 30 The combined actions of SE, sinapine, and other unidentified compounds in RSE likely create a more comprehensive and effective approach to tackling obesity by targeting multiple metabolic pathways simultaneously. Research findings have indicated that the integration of various therapeutic modalities synergistically improves the effectiveness of herbal extracts or individual compounds. For example, berberine and isoliquiritigenin were identified as key components of the herbal pair Coptidis Rhizoma-Glycyrrhizae Radix et Rhizoma. The combined therapy utilizing berberine and isoliquiritigenin demonstrated an increase in glucose absorption, enhancement of insulin signaling through the IRS1-PI3K-Akt pathway, and a reduction in inflammatory reactions within adipose tissue. 31 Another research suggests the synergistic effects of capsinoids, a non-pungent counterpart of capsaicin, and mild cold exposure (17 °C) on beige adipocyte formation. This combination facilitated the development of beige adipocytes via the β2-adrenoceptor signaling pathway and enhanced the stability of PRDM16. 32 Combination treatments including curcumin, fenugreek, and nettle with metformin markedly enhanced insulin sensitivity markers, including the upregulation of GLUT4, leptin, and the promotion of Akt activation, in comparison to metformin monotherapy. 33 This finding reinforces the notion that whole plant extracts or a combination of different active ingredients/treatments may provide more potent therapeutic effects compared to isolated compounds.
Isothiocyanates (ITCs) and their precursor glucosinolates (GLs) are widely recognized compounds that are mostly found in Brassicaceae plants, including radish, rutabaga, broccoli, and cabbage. 21 The precursor molecule GLs undergo hydrolysis, either enzymatically via myrosinase or non-enzymatically, resulting in the formation of nitriles or isothiocyanates, dependent upon factors such as pH and temperature. The hydrophilic nature of intact GLs allows them to be partially acquired in the stomach. However, they are transported and degraded in the small intestine by the released active plant myrosinases, which were present in the food product. 34 The culinary preparation of cruciferous vegetables generally inactivates myrosinase and associated proteins, which obstruct the conversion of GLs to ITCs. Nevertheless, the consumption of cooked vegetables continues to produce bioactive ITCs and nitriles, which are generated from the metabolism of GLs by the gut microbiota. 35 Human gut bacteria, including Enterococcus casseliflavus and Escherichia coli, contain myrosinase-like enzymes capable of hydrolyzing GLs to ITCs. These bacterial enzymes are β-glucosidases that specifically target GLs, enabling conversion in the absence of plant myrosinase. 36 Prior research has shown that ITCs are more effective than their comparable GLs in reducing obesity, inflammation, and cancer. 21 Allyl isothiocyanate demonstrates significantly greater anti-proliferative activity against HT-29 colon cancer cells than its precursor sinigrin. Sinigrin demonstrated no cytotoxicity towards HT-29 colon cancer cells until administered in conjunction with myrosinase. 37 Along the same lines, in a study involving hepatocarcinoma, GCP, a kind of glucosinolate compound in Brassicaceae plants, did not demonstrate any cytotoxicity against Hep G2 cells, although SE did. 38 Additionally, SE, an isothiocyanate, has been demonstrated to be metabolized from GCP through hydrolysis by myrosinase. 25 The primary distinction between GCP and SE is the presence of a glucose moiety in GCP and its absence in SE. 39 The structural disparities between ITCs and GLs provide ITCs with an edge in terms of absorption within the human body. 21 Consequently, we choose to evaluate the SE bioactivities instead of GCP due to its superior absorption capacity and enhanced efficacy. Moreover, the levels of GCP are associated with those of SE; therefore, we analyzed to quantify the among of GCP and SE in the RSE.
One limitation of the study is the lack of detailed analysis of the specific bioactive compounds in RSE beyond SE. While SE showed significant effects on adipocyte browning and thermogenesis, the extract likely contains other compounds which could contribute to the overall anti-obesity and metabolic benefits. Future research should focus on identifying and isolating these additional bioactive components to better understand their individual and synergistic effects. Additionally, the study was conducted in mice, and while these results are promising, further validation in human clinical trials is necessary to confirm the efficacy and safety of RSE and SE in treating obesity and related metabolic disorders.
Another limitation is the absence of in vivo data on cold tolerance and energy expenditure, which are critical indicators of enhanced thermogenesis in beige adipocytes. Future studies should investigate the effects of RSE and SE on these parameters to provide a more comprehensive understanding of their role in promoting energy expenditure. Moreover, exploring the long-term effects of RSE and SE, including their impact on other obesity-related complications such as fatty liver disease and cardiovascular risks, would be valuable for expanding their therapeutic potential. Finally, investigating the molecular pathways and receptors involved in AMPK activation and adipocyte browning will help refine therapeutic strategies targeting obesity.
In conclusion, this study demonstrates that RSE and its active compound SE hold significant potential as therapeutic agents for obesity and related metabolic disorders. Both RSE and SE promote the browning of white adipocytes, enhancing thermogenesis and reducing fat accumulation. Furthermore, these compounds improve glucose metabolism by increasing insulin sensitivity and glucose tolerance, making them promising candidates for managing type 2 diabetes. The findings also highlight the superior efficacy of whole RSE compared to SE alone, suggesting that other bioactive compounds may act synergistically to enhance the anti-obesity effects of RSE. These results underscore the importance of considering whole extracts in developing natural therapies for complex conditions like obesity. Future studies should focus on clinical validation in humans, identifying additional active components, and further exploring the molecular mechanisms underlying these effects.
Supplemental Material
sj-docx-1-chp-10.1177_2515690X251316760 - Supplemental material for Radish Seed Exerts Anti-Diabetic and Obesity-Reducing Effects in Mice by Promoting the Activation of Uncoupling Protein 1 and Peroxisome Proliferator-Activated Receptor-γ Coactivator 1-α
Supplemental material, sj-docx-1-chp-10.1177_2515690X251316760 for Radish Seed Exerts Anti-Diabetic and Obesity-Reducing Effects in Mice by Promoting the Activation of Uncoupling Protein 1 and Peroxisome Proliferator-Activated Receptor-γ Coactivator 1-α by Yao-Chien Wang, Yu-An Hsu, Sheng-Chun Lin, Li-Shan Chien, Jamie Jiin Yi Chen, Ming Yen Wu, Hui-Ju Lin, Chih-Sheng Chen, Yi-Qi Huang, Yu-Chi Tsai and Lei Wan in Journal of Evidence-Based Integrative Medicine
Footnotes
Abbreviations
Acknowledgements
Author Contribution
Conceptualization: YCT, LW; Methodology: YCW, CSC; Validation: SCL; Formal analysis: JJYC; MYW, HJL; Investigation: LSC, YQH; Resources: YAH; Writing-Original Draft: YAH; Writing-Review & Editing: LW; Supervision: LW.
Data available on request from the authors.
Declaration of Conflicting Interests
The authors declared no potential conflicts of interest with respect to the research, authorship, and/or publication of this article.
Ethical Statement
The procedures for animal care and handling were approved by the Animal Committee of China Medical University (Ethics approval number: 2018-169).
Funding
The authors disclosed receipt of the following financial support for the research, authorship, and/or publication of this article: Research funding was provided in part by National Science and Technology Council, Taiwan, R.O.C. (MOST107-2320-B-039-049-MY3; 111-2314-B-039 -054 -; 111-2314-B-039 -053 -MY3; NSTC-112-2314-B-039-029, NSTC 111-2320-B-039-074 and NSTC 113-2320-B-039-056), China Medical University Hospital, Taichung, Taiwan (DMR-113-121; DMR-109-089), China Medical University, Taichung, Taiwan (CMU112-MF-49), the Ministry of Agriculture, Taiwan (112AS-1.3.2-AS-03 and 113AS-1.3.2-AS-04) and Taichung Tzu Chi Hospital, Taichung, Taiwan (TTCRD 111-14). The funders had no role in the study design, data collection and analysis, the decision to publish, or preparation of the manuscript. The sponsor or funding organization had no role in the design or conduct of this research.
Generative AI and AI-Assisted Technologies in the Writing Process
The authors utilized QuillBot to improve the fluency and correctness of English writing during the preparation of this document. After using this tool/service, the authors reviewed and edited the publication's content as needed and they accept full responsibility for its content.
Supplemental Material
Supplemental material for this article is available online.
References
Supplementary Material
Please find the following supplemental material available below.
For Open Access articles published under a Creative Commons License, all supplemental material carries the same license as the article it is associated with.
For non-Open Access articles published, all supplemental material carries a non-exclusive license, and permission requests for re-use of supplemental material or any part of supplemental material shall be sent directly to the copyright owner as specified in the copyright notice associated with the article.