
Abstract
Calcium signal propagation from endoplasmic reticulum (ER) to mitochondria regulates a multitude of mitochondrial and cell functions, including oxidative ATP production and cell fate decisions. Ca2+ transfer is optimal at the ER-mitochondrial contacts, where inositol 1,4,5-trisphosphate (IP3) receptors (IP3R) can locally expose the mitochondrial Ca2+ uniporter (mtCU) to high [Ca2+] nanodomains. The Ca2+ loading state of the ER (Ca2 + ER) can vary broadly in physiological and pathological scenarios, however, the correlation between Ca2 + ER and the local Ca2+ transfer is unclear. Here, we studied IP3-induced Ca2+ transfer to mitochondria at different Ca2 + ER in intact and permeabilized RBL-2H3 cells via fluorescence measurements of cytoplasmic [Ca2+] ([Ca2+]c) and mitochondrial matrix [Ca2+] ([Ca2+]m). Preincubation of intact cells in high versus low extracellular [Ca2+] caused disproportionally greater increase in [Ca2+]m than [Ca2+]c responses to IP3-mobilizing agonist. Increasing Ca2 + ER by small Ca2+ boluses in suspensions of permeabilized cells supralinearly enhanced the mitochondrial Ca2+ uptake from IP3-induced Ca2+ release. The IP3-induced local [Ca2+] spikes exposing the mitochondrial surface measured using a genetically targeted sensor appeared to linearly correlate with Ca2 + ER, indicating that amplification happened in the mitochondria. Indeed, overexpression of an EF-hand deficient mutant of the mtCU gatekeeper MICU1 reduced the cooperativity of mitochondrial Ca2+ uptake. Interestingly, the IP3-induced [Ca2+]m signal plateaued at high Ca2 + ER, indicating activation of a matrix Ca2+ binding/chelating species. Mitochondria thus seem to maintain a “working [Ca2+]m range” via a low-affinity and high-capacity buffer species, and the ER loading steeply enhances the IP3R-linked [Ca2+]m signals in this working range.
Introduction
Ca2+ signals generated by IP3 receptor (IP3R)-mediated Ca2+ mobilization from the ER can propagate to the mitochondrial matrix as [Ca2+]m signals that activate matrix dehydrogenases and enhance ATP production (Denton et al., 1980; Hansford, 1987; Hajnoczky et al., 1995; Robb-Gaspers et al., 1998; Jouaville et al., 1999) but can also lead to Ca2+ overload and permeability transition pore (mPTP) activation to trigger cell injury or death (Szalai et al., 1999; Pinton et al., 2008). Although mitochondrial Ca2+ uptake generally shows little activation at <1 μM [Ca2+]c levels (Gunter and Pfeiffer, 1990; Kirichok et al., 2004), IP3R-linked [Ca2+]c spikes and oscillations in this range can effectively evoke rapid increases in [Ca2+]m (Rizzuto et al., 1992). This paradox has been explained by a local Ca2+ delivery between closely apposed segments of ER and mitochondria where IP3R-mediated Ca2+ release can expose the mitochondrial surface to 10–30 μM [Ca2+] (Rizzuto et al., 1998; Csordas et al., 1999, 2010; Giacomello et al., 2010). Mitochondria can also exert local control over [Ca2+]c signals by a number of mechanisms: directly via mitochondrial Ca2+ uptake (Szabadkai and Duchen, 2008), indirectly by funneling Ca2+ from store-operated entry channels to the SERCA pumps (Malli et al., 2003), by energy supply (Jouaville et al., 1995), or by redox modulation of IP3Rs (Booth et al., 2016; Booth et al., 2021). Local Ca2+ clearance by mitochondria also contributes to the shaping of [Ca2+]c by relieving feedback inhibition of the IP3Rs as well as the store-operated Ca2+ entry (SOCE) channels by Ca2+ (Hoth et al., 1997; Hajnoczky et al., 1999; Tinel et al., 1999; Marchant et al., 2002; Olson et al., 2010).
The fraction of Ca2+ delivered to the mitochondria during IP3R-mediated release can be substantial—at least in some cell types—up to ∼30% in H9c2 and ∼50% in RBL-2H3 cells (Pacher et al., 2000). The Ca2+ loading state of the ER determines the [Ca2+] gradient across the ER membrane and might modulate the local Ca2+ delivery from the IP3R to the mitochondria. [Ca2+] in the ER lumen ([Ca2+]ER) has also been linked to regulation of IP3R gating (Missiaen et al., 1992; Oldershaw and Taylor, 1993; Horne and Meyer, 1995; Vais et al., 2012, 2020). Furthermore, accumulating evidence suggests a positive correlation between Ca2 + ER and mitochondrial apoptosis, which can be triggered by IP3R-derived Ca2+ transfer to the mitochondria (Szalai et al., 1999). Excessive ER loading upon SERCA2a overexpression has been shown to promote apoptosis in Cos-7 cells (Ma et al., 1999). On the other hand, decreased ER Ca2+ levels associated with ER-targeted overexpression of Bcl-2 attenuated IP3R-linked [Ca2+]c and [Ca2+]m signals and were protective against ceramide-induced apoptosis (Foyouzi-Youssefi et al., 2000; Pinton et al., 2000, 2001). Similarly, impaired ER Ca2+ accumulation in Bax/Bak double-knockout MEF cells caused 50%–60% reduction of agonist-induced [Ca2+]c signals and almost completely eliminated [Ca2+]m signals (Scorrano et al., 2003). Thus, a complex positive correlation is likely to exist between ER Ca2+ storage and IP3R-mediated Ca2+ transfer to the mitochondria, which has relevance for cell survival. Our goal was to quantitatively measure the amounts of Ca2+ locally transported to the mitochondria at the ER-mitochondrial contacts during IP3R activation. While fluctuations in the [Ca2+]ER and [Ca2+]m have been reported in previous studies (a nice example is Suzuki et al., 2014), these measurements could not address Ca2+ transfer relative to total ER Ca2+ content (Ca2 + ER, please note the difference between Ca2 + ER and [Ca2+]ER, the latter refers to the luminal [Ca2+] in the ER) because of the different Ca2+ binding species in each compartment and because of the limitations of fluorescent protein-based sensors, for example, environment sensitivity. Here we quantitatively characterize this relationship in RBL-2H3 cells, a cell model with highly efficient local IP3R-to mitochondria Ca2+ delivery.
Results
IP3-Linked [Ca2+]c Signals Propagate to the Mitochondria More Effectively With Increasing ER Ca2+ Loading
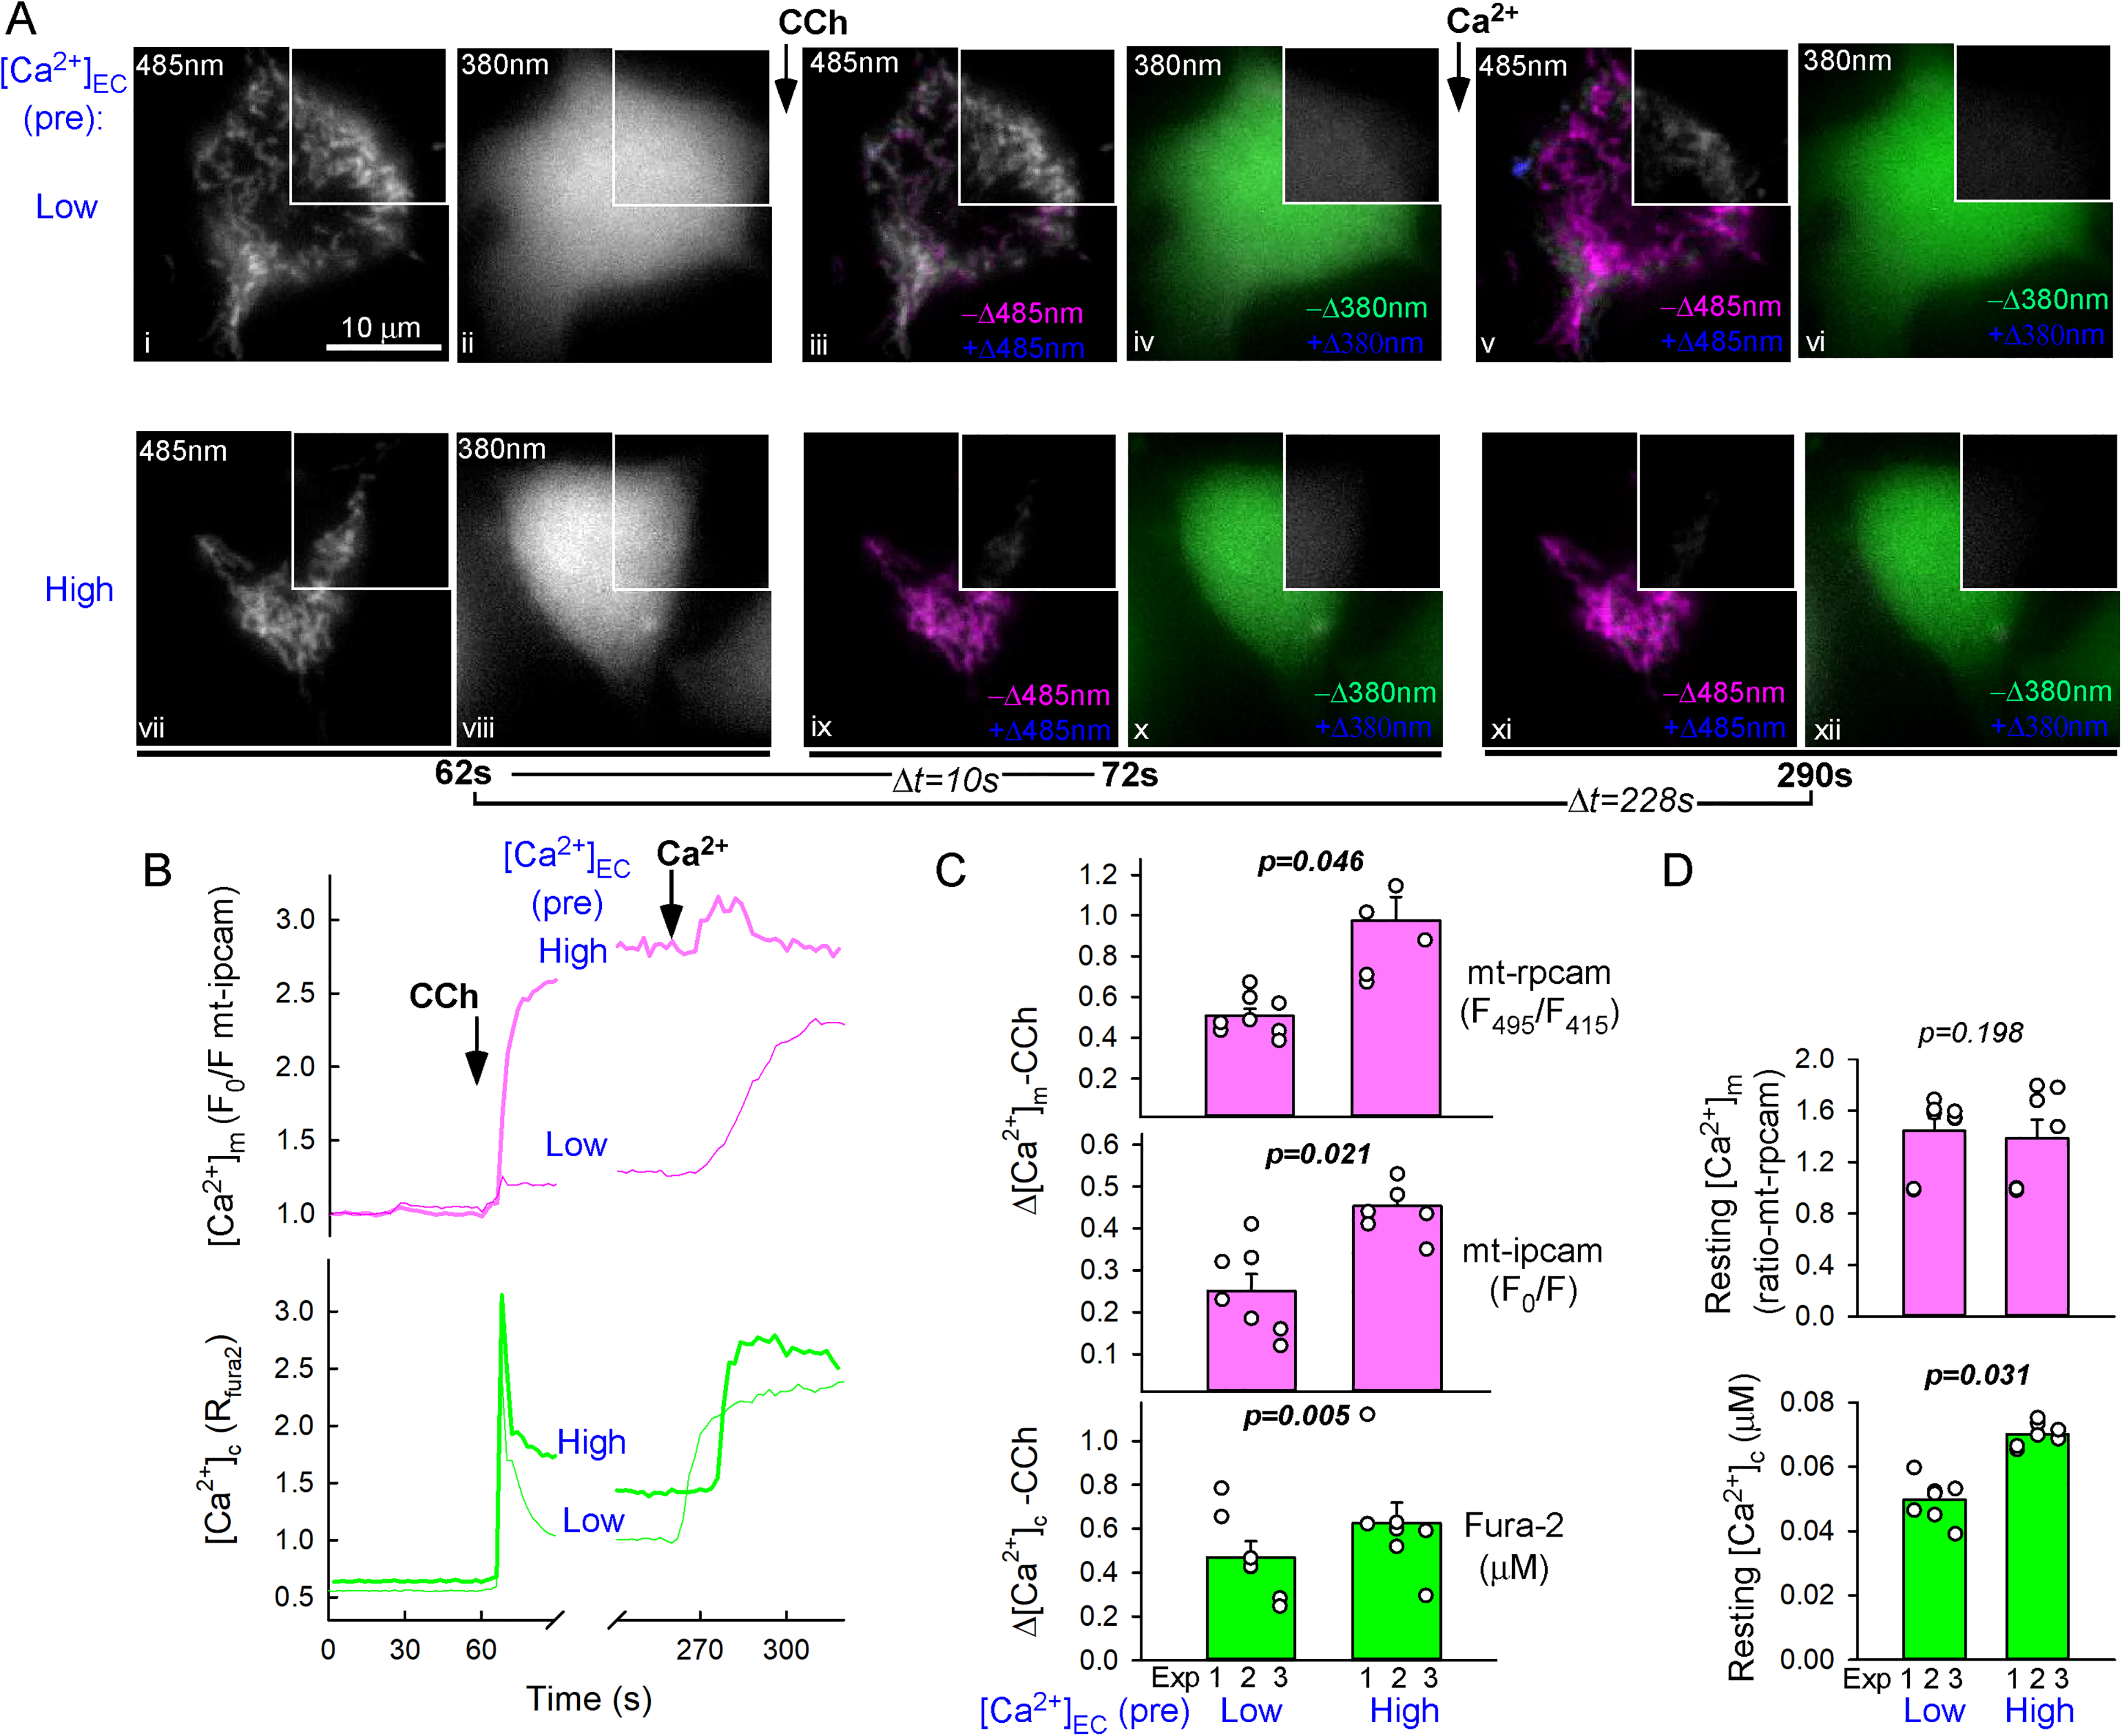
First, we tested the effect of changes in the Ca2+ loading state of the ER on the efficacy of IP3-linked [Ca2+]c signal propagation to the mitochondrial matrix. To establish low and high ER Ca2+ loading state (Ca2 + ER), intact RBL-2H3 cells were preincubated in an extracellular medium (ECM), from which the CaCl2 was either omitted (Figure 1A “low,” [Ca2+]EC ∼1 μM) or increased to 10 mM (from the normal 2 mM) (Figure 1A “high”), respectively. To minimize the contribution of SOCE, the agonist-induced [Ca2+]c (fura-2/AM) and [Ca2+]m (mtpericam) responses were recorded without added CaCl2 in the ECM in both conditions ([Ca2+]EC ∼1 μM). Preincubation in high [Ca2+]EC slightly elevated the resting [Ca2+]c ([Ca2+]c 70 ± 1.4 nM vs. 50 ± 2.5 nM, N = 3 experiments, 2-3 coverslips each, p = .031) but not [Ca2+]m (Figure 1D), indicating that the pretreatment could feed the high-affinity ER Ca2+ pumps (SERCA) without enhancing mitochondrial Ca2+ uptake in unstimulated cells. To activate the IP3Rs, muscarinic m1 receptors were transiently overexpressed and stimulated by a supramaximal dose of carbachol (CCh, 100 μM). The CCh-stimulated [Ca2+]c spike was ∼33% larger (peak magnitudes 630 ± 125 nM vs. 475 ± 130 nM, N = 3; p < .01 with paired t-test) and more sustained in the cells preincubated in high [Ca2+]EC, consistent with a greater Ca2+ release from the better loaded ER (Figure 1B and C, green). The associated rapid and sustained [Ca2+]m elevation was disproportionally (twice on average) larger in the cells preincubated in high [Ca2+]EC ECM as compared to those in low [Ca2+]EC buffer (Figure 1B and C, magenta). This difference was consistently observed using two different mitochondrial matrix-targeted Ca2+ probes (ratiometric and inverse pericam, Figure1 C). The rapid upstroke phase comprised ≥80% of the CCh-stimulated [Ca2+]m rise, and it generally ended by the time the [Ca2+]c spike reached its peak (in ∼4 s), which is the point when ER release flux is overcome by cytosolic Ca2+ clearance pathways. Thus, the bulk of the [Ca2+]m signal originated from mitochondrial Ca2+ uptake during the peak period of ER Ca2+ release, when the mitochondrial uptake sites were presumably exposed to the short-lasting, IP3R-mediated high [Ca2+]c nanodomains. Of note, we couldn’t completely rule out a contribution of SOCE in the sustained phase of the [Ca2+] responses because some Ca2+ entry can occur even at [Ca2+]EC ∼1 μM but SOCE cannot account for the differences in the [Ca2+]c and [Ca2+]m signals obtained at different Ca2+ preloads because the stimulation was performed at the same [Ca2+]EC ∼1 μM in each condition. Furthermore, mitochondrial Ca2+ uptake was not suppressed in the cells preincubated in low [Ca2+]EC, since exposure to SOCE following the Cch stimulation could elevate [Ca2+]m to similar levels as in the cells preincubated in high [Ca2+]EC (Figure 1B, magenta). The minimal further [Ca2+]m increase upon SOCE in the high [Ca2+]EC preincubation condition might be due to saturation of Ca2+. These results suggest a steeper dependence of the IP3R-linked [Ca2+]m signals than the [Ca2+]c signals on Ca2 + ER.
Ca2+ Loading of the ER Promotes IP3-Linked Ca2+ Signal Transmission to the Mitochondria in Intact RBL-2H3 Cells.
[Ca2+]m Signals Associated With IP3-Stimulated Ca2+ Release in Permeabilized Cells Steeply Depend on ER Ca2+ Loading State
Quantitative assessment of the IP3R-mediated Ca2+ transfer to the mitochondria as a function of ER Ca2+ storage is not feasible in intact cells because no approach has been set up to dynamically monitor the amount of Ca2+ in the relevant compartments. To further investigate the dependence of [Ca2+]m on Ca2 + ER, we used suspensions of permeabilized cells, which model [Ca2+] in the ([Ca2+]bm) as a proxy for [Ca2+]c that can be directly manipulated and its Ca2+ content quantified. This then gives the opportunity to quantify the Ca2+ sequestered by or released from the ER and/or mitochondria. In gently permeabilized RBL-2H3 cells, many aspects of possible organelle damage have been excluded and the ER-mitochondrial local Ca2+ transfer has been proven well preserved (Csordas et al., 1999; Pacher et al., 2000; Csordas and Hajnoczky, 2003; Csordas et al., 2006). Also, the apparent [Ca2+]c threshold for activation of the mitochondrial Ca2+ uptake is ∼1 μM (Csordas et al., 1999; Csordas and Hajnoczky, 2001; Csordas and Hajnoczky, 2003), allowing us to selectively preload the ER using small, sub-threshold Ca2+ boluses. We chose 3.6 nmol CaCl2 (corresponding to ∼1.5 nmol/mg cellular protein in the 1.8 ml assay volume) as the maximum single-bolus, which raises [Ca2+]bm to ≤700 nM (Figure 2A, each bolus is marked as 2Ca). For greater preload, this bolus was repeated after the first bolus was sequestered (Figure 2A Ca2+ preloading 3 nmol/mg). The Ca2+ pulses themselves caused negligible [Ca2+]m increase and the decay kinetic of the associated [Ca2+]bm elevations was well-fit by a single exponential decay, consistent with ER uptake being the dominant mechanism. [Ca2+]c and [Ca2+]m responses evoked by a saturating dose of IP3 after addition of 0 to 3 pulses of CaCl2 were simultaneously monitored. Increasing Ca2 + ER by these Ca2+ pulses enhanced the IP3-induced global [Ca2+]bm response, ∼2-fold increase after two Ca2+ pulses (Figure 2A, [Ca2+]bm, red traces), and, to a much larger extent, the associated [Ca2+]m response, ∼5-fold increase after two Ca2+ pulses

Enhancement of the IP3-Induced [Ca2+]c and [Ca2+]m Responses by Increasing ER Ca2+ Load in Permeabilized Cells.
The Steep Dependence of IP3-Induced [Ca2+]m Signals on ER Ca2+ Loading Relies on Local Ca2+ Transfer
To validate the role of the local Ca2+ transfer in the enhanced efficacy of IP3-induced [Ca2+]m signal generation, after different Ca2+ preload conditions, the [Ca2+]bm was clamped by a slow Ca2+ chelator (100 µM EGTA + 30 µM CaCl2 clamped [Ca2+]bm at ≈80 nM) (Csordas et al., 1999). EGTA-clamping of [Ca2+]c effectively eliminated IP3-induced global [Ca2+]bm increases but not the corresponding [Ca2+]m responses, which were only moderately attenuated (Figure 3A, thin vs. thick traces). Moreover, the fold change in the magnitude of [Ca2+]m response upon increasing the ER Ca2+ preload from 0 to 1.5 nmol/mg was not dampened by the [Ca2+]bm clamping, but rather increased (470 ± 70% vs. 340 ± 30%) (Figure 3B). This result confirms that the enhancement of the [Ca2+]m response occurs at the level of the activation of mitochondrial Ca2+ uptake sites locally by IP3R-derived high [Ca2+] nanodomains.

Increased Ca2+ Loading of the ER Enhances the IP3-Induced [Ca2+]m Response Even if [Ca2+]bm is Clamped With EGTA in Suspensions of Permeabilized RBL-2H3 Cells.
Supralinear Dependence of Mitochondrial Ca2+ Sequestration on the ER Ca2+ Pre-Loading During IP3-Induced Ca2+ Release
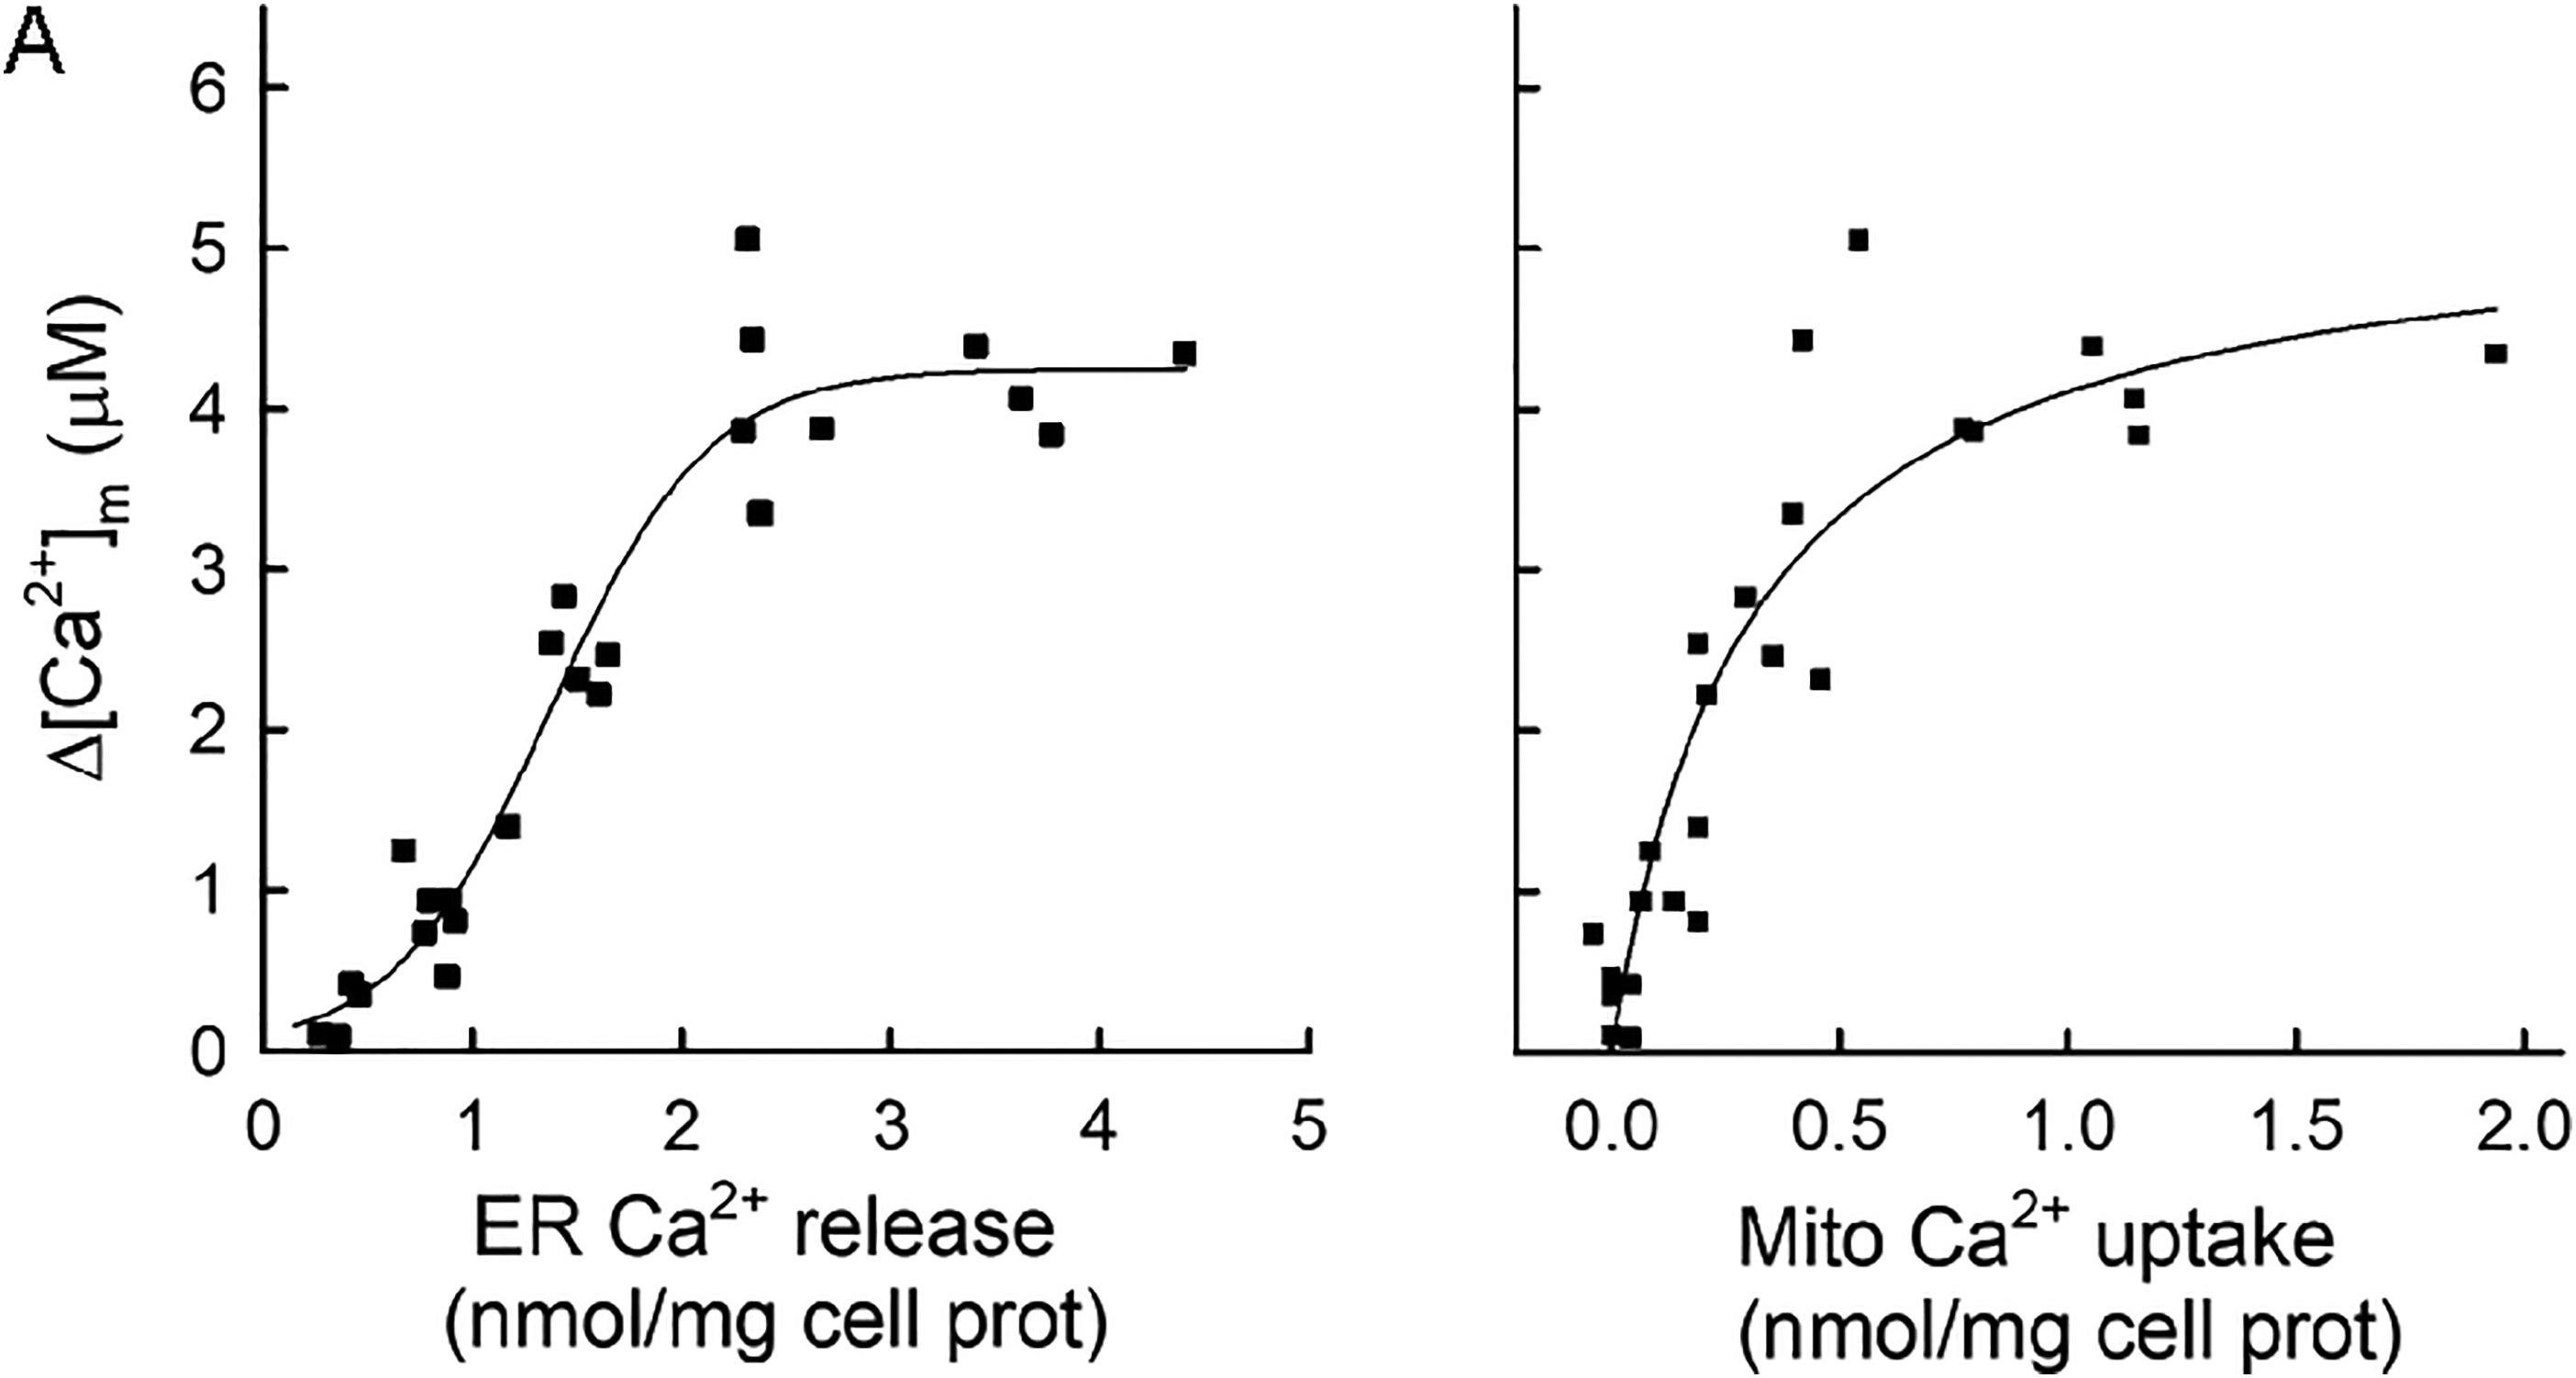
The steep enhancement of the IP3R-linked [Ca2+]m signals with increasing Ca2+ loading of the ER raised the possibility of increasingly efficient mitochondrial Ca2+ clearance around the ER Ca2+ release sites. To directly address this point, we set up a strategy to quantify the amount of mitochondrial Ca2+ uptake associated with IP3-induced Ca2+ release at different Ca2 + ER loads (established via preloading with 0, 0.375, 0.75, 1.5, and 3 nmol/mg Ca2+) in suspensions of permeabilized cells. The quantification procedure is illustrated in Figure 4A. In the permeabilized RBL-2H3 cells, ER and mitochondria dominate the Ca2+ handling (Csordas and Hajnoczky, 2001). When Ca2+ accumulation to these organelles is blocked (SERCA by thapsigargin, Tg, added just 5 s before IP3 addition, and mitochondrial uptake by uncoupler FCCP/oligomycin or ruthenium red), the initial rise in [Ca2+]bm in response to IP3 is solely derived from the release flux via the IP3R (red traces and double-headed arrows in Figure 4A, bottom panels). Supramaximal IP3-addition elicited complete discharge of the ER Ca2+ store as evidenced by the lack of further [Ca2+]bm increase upon addition of the Ca2+ ionophore ionomycin (Figure 4A, right). When mitochondrial Ca2+ uptake is not blocked, the IP3-induced [Ca2+]bm rise will be smaller, since a portion of the released Ca2+ from the ER is sequestered by the mitochondria (black traces and opposing inward arrows in Figure 4A, bottom panels). In turn, based on titration of the [Ca2+]bm changes with known amounts of Ca2+ (Figure 4B), the molar Ca2+ content of the ER (Ca2 + ER) as well as the Ca2+ sequestered by the mitochondria during IP3-induced Ca2+ release was determined. Importantly, the IP3-induced Ca2+ release was completed by the end of the rapid upstroke phase of the [Ca2+]bm increase (in ∼2.5–5 s, calculated from the first derivative), regardless of the ER Ca2+ load (Figure 4A, inset). Accordingly, IP3R-derived high [Ca2+] nanodomains could only exist during this period, and so we limited the evaluation of mitochondrial Ca2+ uptake to this initial interval (ignoring further slow uptake from the global [Ca2+]bm rise likely due to a long-term uniporter sensitization; Csordas and Hajnoczky, 2003). As expected, Ca2 + ER increased linearly with the Ca2+ loading amounts (with a slope ∼1), further reflecting that the added Ca2+ was deposited entirely to the rapidly mobilizable ER Ca2+ pool (Figure 5A, Dataset S1). Mitochondrial Ca2+ uptake from the IP3-induced Ca2+ release showed massive enhancement with the increases in ER Ca2+ preloading (Figure 4A, bottom). Consistently, the amounts of Ca2+ sequestered by mitochondria during IP3-induced Ca2+ release displayed a supralinear correlation with Ca2 + ER that was best fitted with a single-exponential growth curve in the tested range of ER Ca2+ content (Figure 5B, Dataset S1). Accordingly, the fractional of the released Ca2+ sequestered by mitochondria increased with Ca2 + ER (Figure 5C, Dataset S1). Thus, increasing the Ca2 + ER improved the efficacy of IP3R-dependent local Ca2+ delivery to the mitochondria.

Quantification of ER Ca2+ Content and Mitochondrial Ca2+ Uptake Associated With IP3-Induced Ca2+ Release.

Supralinear Relationship Between the ER Ca2+ Content and the Mitochondrial Ca2+ Uptake Associated With IP3-Induced Ca2+ Release.
Sigmoidal Dependence of the IP3-Induced [Ca2+]m Response on ER Ca2+ Loading
While mitochondrial Ca2+ uptake during the IP3-stimulated Ca2+ release progressively increased across the tested range of Ca2 + ER, the corresponding [Ca2+]m increases displayed more complex kinetics. Up until Ca2 + ER of ∼1.7 nmol/mg cellular protein, [Ca2+]m responses were increasing progressively, but then they turned to saturation with a kinetics best fitted with a three-parameter sigmoidal curve (Figure 6A, Dataset S1). Accordingly, plotting IP3-induced Ca2+ release-associated [Ca2+]m increases against the corresponding mitochondrial Ca2+ uptake displayed simple saturation kinetics (Figure 6B, Dataset 1), suggesting the presence/activation of a low-affinity, high-capacity [Ca2+] buffer species in the mitochondrial matrix (David, 1999; Nicholls, 2005). Since the saturating [Ca2+]m values over the sigmoidal curve were just around the Kd value of the Ca2+ probe fura-2FF/fura-loAff (4.5 μM), saturation of the dye or contribution by the dye to the maximal [Ca2+] as a chelator was unlikely. Thus, amplitude modulation of the [Ca2+]m signals by mitochondrial Ca2+ uptake takes place only in a limited range, beyond which the sequestered Ca2+ is mostly chelated by powerful Ca2+ buffering in the matrix.
Dependence of the IP3-Induced [Ca2+]m Rise on ER Ca2+ Content.
IP3R-Derived High [Ca2+] Nanodomains at the Mitochondrial Surface Linearly Depend on Ca2 + ER
To obtain clues about where the Ca2 + ER-dependent amplification takes place along the route of Ca2+ from the IP3Rs to the mitochondrial matrix, we first examined how the IP3R-derived high [Ca2+]c nanodomains exposing the mitochondrial surface are determined by Ca2 + ER. To measure local [Ca2+] at the ER-mitochondria contacts, we used a drug-inducible bipartite inter-organellar linker system based on the heterodimerization of FKBP12 and FRB protein domains via rapamycin (Csordas et al., 2010). A low-affinity fluorescent Ca2+ indicator protein RCaMP (RCaMPR368V, RCaMPv) was used as a tag on FKBP12 anchored to the outer mitochondrial membrane (OMM) via the membrane insertion domain of mAKAP1 (mAKAP1(34-64)) (OMM-FKBP-RCaMPv). The linkage partner FRB domain was anchored to the ER via the membrane insertion domain of Sac1 and a 9x flexible helical repeat and tagged with a cyan fluorescent protein (CFP-FRB-9x-Sac1). Rapamycin treatment (5 min) immobilized OMM-FKBP-RCaMPv at the close contacts with the ER by linkage with the CFP-FRB-9x-Sac1 in the ER (Csordas et al., 2010; Csordas et al., 2013).
To vary Ca2 + ER, [Ca2+]c was stepped up from a nominally Ca2+-free baseline (10 µM EGTA in the buffer) to ∼200 nM (addition of 3 μM CaCl2) for various durations before discharging the ER store by saturating [IP3]. Figure 7A shows the kinetics of [Ca2+] rises detected by the OMM-FKBP-RCaMPv recruited to the close contacts with ER ([Ca2+]OMM-ER). The IP3-induced [Ca2+]OMM-ER spikes were asymmetrical, comprised of a rapid upstroke to the peak followed by a rapid drop that slowed when approaching the baseline, reaching ≥80% recovery in 30 s. Similarly to cells in suspension, where the store depletion upon IP3R stimulation was completed in <5 s regardless of store loading (Figure 4A, inset), the time-to-peak remained <5 s regardless of the duration of the ER Ca2+ loading period (Figure 7B). For estimating the time-dependent increases in Ca2 + ER the area under curve of the [Ca2+]OMM-ER response was used (Figure 7C). The increases in the area under curve involved increases in peak amplitudes and slower recovery. They fitted well with a saturation curve, consistently with the time-dependent (re)filling of the finite ER Ca2+ pool (Figure 7C, Dataset S1). To stay consistent with the cell suspension assays, where only the initial steep phase of the mitochondrial Ca2+ uptake was counted, we considered the [Ca2+]OMM-ER peak amplitudes as the relevant parameters of the nanodomains to describe the contribution to the initial activation of the mitochondrial Ca2+ uptake. By contrast to the supralinearly increasing mitochondrial uptake, the increase of [Ca2+]OMM-ER peaks with the growing Ca2 + ER (area under curve) could be approximated by a linear fit (Figure 7D, right, Dataset S1). Admittedly, reflecting the ER Ca2+ load by the area of the local calcium rise shown by RCaMP has limitations that are further considered in the methods. Regardless, the [Ca2+]OMM-ER does not seem to be a non-linear amplifying factor in the process of progressive activation of mitochondrial Ca2+ uptake by IP3R-mediated Ca2+ release at increasing Ca2 + ER.

Correlation of IP3R-Derived High [Ca2+]OMM-ER Microdomain Peaks With Ca2 + ER..
MICU1 in the mtCU Likely Acts as a [Ca2+]- Dependent Amplifier
After finding no evidence for a “pre-mitochondrial” Ca2 + ER-dependent supralinear amplifier in the local IP3R-to-mitochondria Ca2+ transfer, we examined the mitochondrial Ca2+ uptake machinery. We focused on MICU1, the Ca2+-sensing regulatory subunit of mtCU in the mitochondrial intermembrane space, which is essential for the cooperative activation of the mtCU by Ca2+ binding to its EF hand domains (Csordas et al., 2013; Logan et al., 2014; Patron et al., 2014). Because stable knockdown of MICU1 was not successful in RBL-2H3 cells, we compared the correlation between the [Ca2+]c and [Ca2+]m increases associated with SOCE between control cells and cells transiently overexpressing a mutant MICU1 with both Ca2+-binding EF hands incapacitated (MICU1ΔEF1,2; Perocchi et al., 2010). We predicted MICU1ΔEF1,2 to work as dominant negative with regard to the cooperative activation of mtCU (Csordas et al., 2013) (for potential mechanisms, see Discussion). Time courses showed a substantial lag between the start of [Ca2+]c and [Ca2+]m rises in the control cells. [Ca2+]m started to rise abruptly by the time [Ca2+]c was already over half-way to its peak and it reached plateau about as fast as [Ca2+]c (hence the rapid rising phases are parallel in Figure 8A left, where the y-axes are scaled to fully expand the basal-to-peak range). By contrast, in the MICU1ΔEF1,2 overexpressing cells the [Ca2+]m rise started together with the [Ca2+]c rise; however, the rate of [Ca2+]m rise to the peak was slower than that for [Ca2+]c. Accordingly, the [Ca2+]m versus [Ca2+]c plots started to rise at higher [Ca2+]c in the control cells, but with a relatively sharp transition to the rising phase (Figure 8B). The [Ca2+]m versus [Ca2+]c plots could be fit by single exponentials for both control and MICU1ΔEF1,2 overexpressing cells but the rate constants of the curve fitting equations in the MICU1ΔEF1,2 cells were nearly half of that in the control cells (Figure 8C). Thus, the mtCU showed diminished cooperativity in the Ca2+-activation in the MICU1ΔEF1,2 overexpressing cells. These results suggest that MICU1 serves as a non-linear amplifier of the [Ca2+]c signals propagated to the mitochondrial matrix, and as such, MICU1 likely contributes to the store content-dependent enhancement of the efficacy of local Ca2+ transfer from the IP3R to the mitochondria.

Cooperative Activation of Mitochondrial Ca2+ Signals During SOCE is Compromised in EF-Mutant MICU1 Overexpressing Cells.
Discussion
We aimed to establish the relationship between ER Ca2+ loading state (Ca2 + ER) and the efficacy of local Ca2+ delivery from IP3Rs to the mitochondrial matrix. Quantification of the ER luminal [Ca2+] ([Ca2+]ER) has been reported before but it does not provide direct assessment of the amount of Ca2+ transferred to the cytoplasm and the mitochondrial matrix, because of the different Ca2+ binding species in each compartment. We think our measurements have achieved the goal of quantitatively measuring the amounts of Ca2+ locally transported to the mitochondria at the ER-mitochondrial contacts during IP3R activation, which is central to understanding the mechanism of Ca2+ transfer and has never been realized.
Positive dependence of IP3R-dependent [Ca2+]m signals on ER Ca2+ levels has been speculated based on circumstantial evidence (Ma et al., 1999; Foyouzi-Youssefi et al., 2000; Pinton et al., 2000, 2001; Spat et al., 2008) (Some of the present results were cited as unpublished in a review, Spat et al., 2008). Here we report in intact RBL-2H3 cells that the [Ca2+]m signals evoked by the IP3R-mediated Ca2+ release are more sensitive than the [Ca2+]c signals to ER Ca2+ loading, at least in its physiological range. These results extend earlier findings that interference with submaximal IP3R activation via overexpression of IP3 buffers (Lin et al., 2005) or with TGFβ treatment (Pacher et al., 2008) affected [Ca2+]m signals more profoundly than the [Ca2+]c signals. To directly assess the correlation between Ca2 + ER and the IP3R-to-mitochondria Ca2+ transfer, we used permeabilized cells, in which Ca2 + ER content could be quantitatively controlled and both the mitochondrial uptake as well as [Ca2+]m signals during IP3R activation could be quantified. The observed relationships among ER Ca2+ load, IP3-induced Ca2+ release, global and local [Ca2+]c rise, mitochondrial Ca2+ uptake, and [Ca2+]m rise are summarized in Figure 9. This analysis and the mechanistic clues provided by our study are expected to help the interpretation of the findings of a broad range of studies focusing on ER stress and other conditions altering ER Ca2+ storage.

Schematic Presentation of the ER Ca2+ Dependence of Each Step in Calcium Signal Propagation From the IP3R to the Mitochondria.
Loading with repetitive small Ca2+ pulses increased the Ca2 + ER storage linearly to at least 3.8 nmol Ca2+ per mg cellular protein (Figure 9i). The ER Ca2+ content was approximated by the Ca2+ discharged by maximal IP3, under SERCA inhibition, and it appeared in a linear relationship with both, the global and local [Ca2+]c increases (Figure 9ii), whereas the increases in Ca2 + ER supralinearly enhanced the mitochondrial Ca2+ uptake (Figure 9iii). As to the IP3R-mediated [Ca2+]m signal, up until 1.5 nmol Ca2 + ER/mg protein the rise was supralinear, whereas further increases in Ca2 + ER were meeting an apparent plateau of the IP3-induced [Ca2+]m signal (at ∼3–4 μM) (Figure 9iv). The sublinear (saturation) correlation between IP3-induced mitochondrial Ca2+ uptake and the corresponding [Ca2+]m signal at higher Ca2 + ER (Figure 9v) was likely due to Ca2+ buffering in the mitochondrial matrix. This buffering system does not seem to allow [Ca2+]m to rise much beyond the reported activation range of matrix Ca2+ sensitive dehydrogenases (K[Ca2+] ∼ 1 μM, Denton and McCormack, 1986) perhaps to keep [Ca2+]m below the “danger zone” for mPTP induction (Bernardi, 2013). The IP3R-mitochondrial local Ca2+ transfer thus provided (i) Ca2 + ER-dependent amplitude modulation of IP3R-linked [Ca2+]m signals in the relevant range to regulate matrix dehydrogenases but also (ii) optimal support for the mitochondria to maintain their “Ca2+ sink” function. Similar plateau/saturation in the [Ca2+]m due to matrix Ca2+ buffering during continuing mitochondrial Ca2+ clearance have been reported in association with Ca2+ entry in motor neurons (David, 1999) or in suspensions of liver, brain (Nicholls and Chalmers, 2004), and heart (Bazil et al., 2013; Wei et al., 2012) mitochondrial fractions. Identification of the buffer species responsible for the complex behavior of [Ca2+]m is yet to be elucidated but Pi likely contributes to the buffering as Pi deprivation alleviates the [Ca2+]m limit in most of the paradigms tested (Chalmers and Nicholls, 2003; de la Fuente et al., 2012; Wei et al., 2012; Bazil et al., 2013) Although most Ca2+ indicator dyes are based on Ca2+ chelators (BAPTA), Fura2FF loaded to the mitochondrial matrix (fura-2FF) is not likely a significant contributor to the observed matrix Ca2+ buffering that caused a plateau in the [Ca2+]m versus Ca2 + m curves given that the plateau occurred at [Ca2+]m levels around the Kd value (∼4.5 μM), where the fluorescence is the most sensitive to report changes in the Ca2+-bound form of the dye. The maximal [Ca2+]m is determined by the endogenous buffers. Notably, the [Ca2+]m “working range” determined in our study matches well [Ca2+]m that have been measured previously by fluorescent Ca2+ probes (David et al., 2003) and Ca2+ sensing fluorescent proteins (Suzuki et al., 2014) but is lower than what was reported using aequorin as Ca2+ sensor (Montero et al., 2000; Tosatto et al., 2017). The reason for these discrepancies remains elusive.
The IP3R-mediated complete discharge of the ER store did not require more time at increased ER Ca2+ load, presumably because of the positive effect of ER luminal Ca2+ on the Ca2+ flux by the IP3-bound IP3R (Missiaen et al., 1992; Oldershaw and Taylor, 1993; Horne and Meyer, 1995). This feature may be needed for effective amplitude modulation of the IP3R-derived high [Ca2+]c microdomains since activated IP3Rs undergo time-dependent inactivation (Hajnoczky and Thomas, 1994), that is, the release of larger Ca2+ loads should not last longer since the longer release time would mean progressively decreasing IP3R channel activities.
We wanted to identify the specific Ca2 + ER-dependent supralinear amplification point in the IP3R-to-mitochondria local Ca2+ transfer. From the ER lumen to the mitochondrial matrix, Ca2+ has to cross three membranes: the ER (via the IP3R), the OMM (mostly through VDACs), and the IMM (via the uniporter, mtCU). The local Ca2+ transfer also depends on close contacts between subdomains of ER and mitochondria secured by protein tethers (Csordas et al., 2006; Szabadkai et al., 2006; de Brito and Scorrano, 2008). At these contact areas, the peri-mitochondrial [Ca2+] can reach >10 fold higher values than the bulk cytoplasm upon stimulation with IP3-mobilizing agonists (Csordas et al., 2010; Giacomello et al., 2010). Since the time of complete store discharge remained the same throughout the tested range of Ca2 + ER in permeabilized cells, the Ca2+ flux underlying the IP3R-derived high [Ca2+] microdomains must have followed Ca2 + ER linearly. In theory, differences in the distribution pattern of the IP3Rs could result in [Ca2+] microdomains that would be more or less directed to the mitochondria. Type 3 IP3Rs have been proposed to preferentially locate to the ER-mitochondrial interface (Mendes et al., 2005) where they can be protected from proteasomal degradation by a novel chaperone complex (Sigma-1 receptor and BiP) in a [Ca2+]ER dependent manner (Hayashi and Su, 2007). However, this mechanism protected IP3Rs more at lower [Ca2+]ER levels and not vice versa. Ca2+-dependent clustering of the IP3R has also been proposed but this process depended on [Ca2+]c changes and became apparent several minutes after agonist stimulation (Wilson et al., 1998). More recently, in a systematic comparison of every IP3R isoform, we found that each isoform can support ER-mitochondrial contacts and Ca2+ transfer but IP3R2 has some advantages over the other isoforms (Bartok et al., 2019; Katona et al., 2022). Here, in cells that mostly express IP3R2, we have carried out direct monitoring of the IP3R-derived high [Ca2+]OMM-ER microdomains at different ER loadings and found the peak amplitudes of the nanodomains to linearly depend on Ca2 + ER (Figure 7). Thus, a supralinear amplification point is absent in the pre-mitochondrial steps of calcium signal propagation to the mitochondria.
Another potential amplifying factor could have been the expansion or tightening of the close ER-mitochondrial interfaces upon increased Ca2 + ER. Disruption of ER-mitochondrial tethers enzymatically in RBL-2H3 cells (Csordas et al., 2006) or genetically in MEFs and HEK cells (Mfn2 KO, de Brito and Scorrano, 2008) diminished the IP3R-mitochondria local Ca2+ transfer (for recent reviews, see Csordas et al., 2018; Scorrano et al., 2019). Tightening and expanding the ER-mitochondrial contacts via synthetic tethers did not enhance the local delivery of maximal IP3-induced Ca2+ signals to the mitochondria in RBL-2H3 cells suggesting that they were already positioned optimally (Csordas et al., 2006). Significant expansion of ER-mitochondrial close interfaces via rapamycin-inducible genetically engineered linkers usually requires >5 min of treatment in intact cells (Csordas et al., 2010; Booth et al., 2016). Also, motility of ER and mitochondria, a prerequisite for the expansion of close ER-mitochondrial associations, is reduced upon [Ca2+]c increase and upon cell permeabilization (Yi et al., 2004), which was completed at the end of the rapamycin treatment. Thus, it is unlikely that significant expansion of the ER-mitochondrial interface occurred in the permeabilized cells during the addition of the small CaCl2 boluses to load the ER. Moreover, decreased ER Ca2+ load associated with tunicamycin-induced ER stress resulted in expanded and tighter ER-mitochondrial associations (Csordas et al., 2006), which would indicate an inverse correlation between Ca2 + ER and ER-mitochondrial interface formation. In sum, ER-mitochondrial interface formation is unlikely to serve as an amplifier in the correlation between Ca2 + ER and the IP3R-mitochondrial local Ca2+ delivery.
The next potential amplification site is at the OMM, where VDAC channels mediate the Ca2+ transfer. Since the OMM has a high VDAC density, and each VDAC represents large Ca2+ conductance, for a long time the OMM was considered freely permeable to Ca2+. More recent evidence suggests that the availability of VDAC may in fact limit local Ca2+ delivery (Csordas et al., 2002; Rapizzi et al., 2002) and VDAC reconstituted to liposomes has been reported to display a Ca2+-dependent increase in its Ca2+ permeability (Bathori et al., 2006). However, enhancing the OMM permeability by tBid addition (Csordas et al., 2002) or overexpression of VDAC (Rapizzi et al., 2002) increased the IP3R-derived [Ca2+]m signal in a relatively small extent compared to the amplification observed here.
The final barrier for Ca2+ to enter the mitochondrial matrix is the IMM, where mtCU has been established as a low-affinity highly selective Ca2+ channel (Kirichok et al., 2004). Complex, allosteric regulation and supralinear [Ca2+]c activation of the mtCU has been described in earlier works on isolated mitochondria (Vinogradov and Scarpa, 1973; Kroner, 1986; Kirichok et al., 2004; Nicholls, 2005). Similarly, in permeabilized HeLa and RBL-2H3 cells we observed a progressive supralinear correlation between [Ca2+]c (from ∼0.7 to 30 μM) and the mitochondrial Ca2+ clearance rates (Csordas et al., 2013 and not shown, respectively). Thus, based on its activation properties, the mtCU could fit as a Ca2+ input-dependent amplifier in the process of local Ca2+ delivery from IP3R to the mitochondria. The mtCU is a protein complex of the pore forming subunit MCU (Baughman et al., 2011; De Stefani et al., 2011), transmembrane scaffold EMRE and regulatory Ca2+-sensing EF-hand subunits MICU1 (Perocchi et al., 2010) and MICU2 (Plovanich et al., 2013) in the intermembrane space (Csordas et al., 2013; Sancak et al., 2013; Patron et al., 2014; Wang et al., 2014). MICU1 has dual role in mtCU activation: it is required to maintain a [Ca2+]c threshold at low [Ca2+]c levels (Mallilankaraman et al., 2012; Csordas et al., 2013 ) and to promote cooperativity at high [Ca2+]c levels (Csordas et al., 2013; Logan et al., 2014; Patron et al., 2014). To promote cooperativity the EF hands of MICU1 seem to be required (Csordas et al., 2013). Overexpression of the MICU1ΔEF1,2 in the RBL-2H3 cells in this study brought about decreased cooperativity in the mtCU activation by SOCE as it was evidenced by the 50% decrease in the rate constant of the exponential rising phase of the [Ca2+]m versus [Ca2+]c plots (Figure 8). Thus, the mtCU, more specifically MICU1, likely functions as a supralinear signal amplifier that is robust enough to account for the Ca2 + ER-dependent enhancement of IP3R-to-mitochondria local Ca2+ transfer.
Limitations
In several experiments, we used compartmentalized fura2-FF to measure [Ca2+]m. Although the compartmentalization of Ca2+ sensing dyes might be broad in many cell types, we have shown in several publications that in RBL-2H3 cells, under the cell culture and dye loading conditions used here, the vast majority of fura2-FF is confined to the mitochondria (Csordas et al., 1999; Csordas and Hajnoczky, 2001; Csordas and Hajnoczky, 2003; Csordas et al., 2006) Furthermore, when cells were permeabilized, cytoplasmic fura2-FF was washed out. Thus, fura2-FF is a validated indicator for [Ca2+]m in RBL-2H3 cells. Importantly, in intact cells, we measured [Ca2+]m with both dye and genetically targeted reporters. Fura-2FF loaded to the mitochondrial matrix necessarily adds to the buffering, potentially altering the observed relationships between ER Ca2+ release and mitochondrial Ca2+ uptake and [Ca2+]m. However, the plateau level (∼4 μM) is likely a feature of endogenous buffering as this is near the Kd of fura-2FF (4.5 μM) where additional Ca2+ binding by the dye is most sensitively reflected in fluorescence.
In many recent studies of ER Ca2+ handling, [Ca2+] in the ER lumen ([Ca2+]ER) was directly measured by Ca2+ sensitive fluorescent proteins targeted to the ER. To establish the quantitative relations among the amount of calcium stored in the ER, the IP3-induced Ca2+ release, mitochondrial Ca2+ uptake and [Ca2+]m we do not think that measurement of [Ca2+]ER was needed. However, to link all these parameters to the [Ca2+]ER levels, direct measurement of [Ca2+]ER would be useful.
Even when the bulk Ca2+ release to the cytosol is a linear function of the ER Ca2+ load, the portion of the release exposing the mitochondria-ER interface (detected by the OMM-ER probe) may differ from other areas of the cell and potentially change with the ER loading. Because the increase of the [Ca2+]OMM-ER peaks with the growing ER Ca2+ load could be approximated by a linear fit, we did not investigate further specific factors that might change with ER calcium loading and affect the [Ca2+]OMM-ER signal spatial distribution.
Materials and Methods
Materials
IP3 and Tg were purchased from Enzo Life Sciences or LC Laboratories Inc. (Woburn, MA); Ionomycin from Calbiochem (EMD Chemicals); Chelex 100 from BioRad (Hercules, CA). Fluorescent probes were from Teflabs (Austin, TX) except rhod-FF that was purchased from Molecular Probes/Invitrogen. All other chemicals were purchased from Fisher (Pittsburgh, PA) or Sigma (St. Louis, MO). Plasmid DNA encoding inverse and ratiometric pericams (Nagai et al., 2001) targeted to the mitochondrial matrix and m1 muscarinic receptor were a gift from Drs. Atsushi Miyawaki (RIKEN) and Tamás Balla (NIH), respectively. A low-affinity RCaMP developed by the Looger lab (Akerboom et al., 2013) was integrated into an mAKAP1-FKBP12-FP rapamycin-inducible OMM linker (Csordas et al., 2010). The cDNA for the double EF-hand mutant human MICU1 (Perocchi et al., 2010) was obtained from Addgene.
Live Cell Imaging
Delivery of genetically engineered Ca2± indicators
Preparation of intact cells and loading of Ca2± indicator dyes. For microscopic imaging experiments, the cells were pre-incubated in a serum-free ECM (121 mM NaCl, 5 mM NaHCO3, 10 mM Na-HEPES, 4.7 mM KCl, 1.2 mM KH2PO4, 1.2 mM MgSO4, 2 mM CaCl2, 10 mM glucose, pH7.4) containing 2% BSA and were loaded with fura-2/AM for measurements of [Ca2+]c as described earlier (Csordas and Hajnoczky, 2003). After dye loading, the cells were washed into ECM with reduced BSA concentration (0.25%) and transferred to the microscope stage temperature controller (Warner Instruments) in an open (1 ml) teflon or surgical metal incubation chamber. For SOCE assays, CaCl2 was omitted from the ECM and it was supplemented with the sarco-endoplasmic reticulum Ca2+ ATP-ase (SERCA) inhibitor Tg (2 μM).
Preparation of permeabilized cells, following pre-incubation in ECM w/2% BSA the cells were washed multiple times with a nominally Ca2+-free extracellular salt solution containing 100 μM EGTA/Tris and transferred to the imaging chamber in 1 mL intracellular medium (ICM, composed of 120 mM KCl, 10 mM NaCl, 1 mM KH2PO4, and 20 mM Tris-HEPES at pH 7.2). Plasma membrane permeabilization was carried out using 25 μg/mL digitonin or 40 μg/mL saponin. After 5–7 min permeabilization period (35 °C), the cells were washed into fresh ICM supplemented with MgATP (2 mM) and succinate/Tris (2 mM).
Recording of [Ca2+] nanodomains at ER-mitochondrial associations was carried out as described previously (Csordas et al., 2010), except that the OMM-targeted Ca2+ sensor was an RCaMP (Yi et al., 2012). Briefly, we used a rapamycin-inducible ER-OMM linker system comprised of the FK506 binding protein (FKBP12) targeted to the OMM and tagged with RCaMPv, and the FKBP-rapamycin binding domain (FRB) of mTOR targeted to the ER and tagged by cyan fluorescent protein (CFP). Upon addition of rapamycin (100 nM during the 5 min permeabilization period) at the close ER-mitochondria interfaces where the FKBP and FRB domains are close enough to heterodimerize a crosslink between the organelles is established. Via lateral diffusion in the membranes the monomeric probes become recruited to these close interface areas in a couple of minutes where they get immobilized by the linkage. Further linkage formation that would expand the close SR-mitochondria interface was stopped by an FK506 (5 μM) wash. RCaMP fluorescence was normalized to the total Ca2+ sensitive range by the formula Fnorm = (F−Fmin)/(Fmax−Fmin), where Fmax and Fmin were respectively determined at the end of the runs by sequential addition of a saturating (1 mM) CaCl2 bolus (∼300 μM free [Ca2+]) and EGTA/Tris (pH 8.5) 10 mM. Based on its saturation curve the probe displayed relatively wide dynamic range, capable to resolve [Ca2+] changes between low 100 nMs up to 10 μM and reaching half-saturation at ∼2 μM. Importantly, the relevant range used to establish correlation between Ca2 + ER and IP3R-derived high [Ca2+] nanodomains ([Ca2+]OMM-ER responses) fell between 15% and 60% probe saturation thus minimizing the chance that a sublinear correlation would arise from approaching saturation of the RCaMPv.
Fluorescence wide field imaging was carried out using a back-illuminated cooled CCD camera (PXL from Photometrics, 24 μm pixels) or an EM-CCD cameras (Hamamatsu ImagEM and Photometrics Evolve, respectively; both 512 × 512, 16 μm pixels), Uniblitz shutter and excitation filter wheel or a high-speed wavelength switcher (Lambda DG-4 from Sutter Instruments) fitted to either Olympus IX81 or IX70 inverted microscopes (40×, UApo340). For simultaneous [Ca2+]c and [Ca2+]m, recording using fura-2 and inverse pericam, respectively 340/30, 380/20, and 490/20 nm excitation filters were used with a beam splitter 500 nm and emission filter 540/50 nm. The inverse pericam fluorescence at each time point was normalized to the initial fluorescence (F0/F). When [Ca2+]m was measured with ratiometric pericam 490/20 nm and 415/20 nm excitation filters and a 500 nm long-pass beam splitter were used. RCaMP fluorescence was excited through a 577/25 nm filter and detected through a dual band emission filter (Chroma 59022m: 523/27 and 634/39 nm) that allowed simultaneous recording with fura-2. To translate fura-2 ratio to molar [Ca2+] values in the intact cells, an in vitro calibration was performed as described in Bartok et al. (2019).
Fluorometry
Measurements of [Ca2+]c and [Ca2+]m in suspensions of permeabilized cells (approx. 2.4 mg protein/1.8 mL) were carried out as described earlier. We have demonstrated in previous studies that the compartmentalized fura-2FF (loaded in its acetoxymethylester/AM form) distributes in the mitochondrial matrix of RBL-2H3 cells (Csordas et al., 1999; Csordas and Hajnoczky, 2001).
Calibration of the [Ca2±]c. Changes with known Ca2+ amounts (0.5–2 μM CaCl2→0.9–3.6 nmol Ca2+ pulses) in suspension of RBL-2H3 cells were carried out in the presence of mitochondrial uncoupler (FCCP 2 μM and oligomycin 5 μg/mL) and Tg (2 μM) to avoid active Ca2+ compartmentalization. When the range of [Ca2+]c reached > 3 μM, it was monitored using fura-2FF (1 μM dye, Kd∼4.5 μM) or rhodFF (0.5 μM dye, Kd∼ 19 μM), in their water-soluble K + -salt form, instead of rhod2 (Kd∼1 μM). The calibration curve was established after correction to the [Ca2+]c baseline shift caused by the SERCA inhibition from the beginning of the recording.
Statistics
All fluorometric recordings represent the mean response of approx. 107 cells and every recording was done at least in duplicates using the same cell preparation. Cumulative data are shown as mean ± SE, n ≥ 3 cell preparations unless otherwise specified. Significance of differences from the relevant controls was calculated by Student's t-tests.
Footnotes
Acknowledgments
This work was supported by an NIH grants DK051526, DK125897, and HL142271 for GH, HL142864 for GC, and NKFI K134357 for VP.
Declaration of Conflicting Interests
The authors declared no potential conflicts of interest with respect to the research, authorship, and/or publication of this article.
Funding
The authors disclosed receipt of the following financial support for the research, authorship, and/or publication of this article: This work was supported by the National Heart, Lung, and Blood Institute, National Institute of Diabetes and Digestive and Kidney Diseases (grant numbers HL142271, DK051526, DK125897 for GH, HL142864 for GC, and NKFI K134357 for VP).