
Abstract
Loss of the endoplasmic reticulum (ER)-mitochondria encounter structure (ERMES) complex that resides in contact sites between the yeast ER and mitochondria leads to impaired respiration; however, the reason for that is not clear. We find that in ERMES null mutants, there is an increase in the level of mRNAs encoding for biosynthetic enzymes of coenzyme Q6 (CoQ6), an essential electron carrier of the mitochondrial respiratory chain. We show that the mega complexes involved in CoQ6 biosynthesis (CoQ synthomes) are destabilized in ERMES mutants. This, in turn, affects the level and distribution of CoQ6 within the cell, resulting in reduced mitochondrial CoQ6. We suggest that these outcomes contribute to the reduced respiration observed in ERMES mutants. Fluorescence microscopy experiments demonstrate close proximity between the CoQ synthome and ERMES, suggesting a spatial coordination. The involvement of the ER-mitochondria contact site in regulation of CoQ6 biogenesis highlights an additional level of communication between these two organelles.
Keywords
Introduction
Over the past two decades, our initial conception of eukaryotic cell architecture has been gradually altered. The original idea of solitary organelles scattered sparsely in the cytosol has been replaced by an appreciation of the close cooperation that exists between organelles. Indeed, organelles are tightly packed together and are anything but solitary. All organelles appear to have the capacity to be tethered to one another by designated structures termed membrane contact sites, and these contact sites are generated by use of tethering molecules (Kakimoto et al., 2018; Shai et al., 2018; Valm et al., 2017). Such areas of close membrane apposition allow for the transfer of metabolites, lipids, and other molecules between the two organelles (Eisenberg-Bord, Shai, Schuldiner, & Bohnert, 2016). One of the most studied contact sites is formed between the endoplasmic reticulum (ER) and mitochondria. In the budding yeast Saccharomyces cerevisiae (hereafter termed yeast ), a prominent complex promoting association of the ER and mitochondria is the ER-mitochondria encounter structure (ERMES; Kornmann et al., 2009). ERMES is composed of four subunits: two mitochondrial sub-units (Mdm10 and Mdm34), an ER localized subunit (Mmm1), and a soluble subunit (Mdm12).
One of the most closely examined roles of ERMES is the transfer of phospholipids. As mitochondria cannot synthesize most of the lipids that they require, phospholipids, sterols, and ceramide/sphingolipids must be imported from the ER. Hence, ER-mitochondria contact sites accommodate many lipid transfer factors and proteins that are involved in lipid metabolism (Dimmer & Rapaport, 2017). Recently, it was shown that the Mmm1-Mdm12 complex can mediate phospholipid transfer in vitro and that mutations in MMM1 or MDM12 lead to impaired phospholipid transfer through the ERMES complex in vivo (Kawano et al., 2018). Surprisingly, ERMES mutants typically exhibit only a mild decrease in specific phospholipids at mitochondria due to the existence of compensatory mechanisms for phospholipid transfer (González Montoro et al., 2018; John Peter et al., 2017; Kojima, Endo, & Tamura, 2016; Lang, Peter, Walter, & Kornmann, 2015; Tan et al., 2013). Despite the moderate effects on lipid transfer between organelles, ERMES disruption leads to a wide array of cellular phenotypes, including loss of mitochondrial morphology, increased loss of mitochondrial DNA, and reduced respiratory capacity (Berger, Sogo, & Yaffe, 1997; Hobbs, Srinivasan, McCaffery, & Jensen, 2001; Kornmann et al., 2009; Youngman et al., 2004). Why loss of ERMES causes these adverse phenotypes, including respiratory deficiency, has not yet been fully elucidated. Hence, we have focused our attention on the role of ERMES in regulating respiration.
Here, we show that cells lacking ERMES components exhibit increased mRNA levels for proteins that participate in the coenzyme Q6 (CoQ6) biosynthetic pathway. CoQ6 is a polyisoprenylated benzoquinone lipid that functions within the electron transport chain of the inner mitochondrial membrane of yeast. CoQ6 can also act as a lipophilic antioxidant (Awad et al., 2018; Tran & Clarke, 2007). All of the steps required for the assembly of the polyisoprenoid diphosphate tail of CoQ, its ligation to aromatic ring precursors, and modification of the ring precursor are catalyzed by Coq enzymes associated with the matrix side of the mitochondrial inner membrane (Awad et al., 2018; Bentinger, Tekle, & Dallner, 2010). Many of the these Coq polypeptides (Coq3-Coq9 and Coq11) assemble within a mega complex termed the CoQ synthome (Allan et al., 2015; Belogrudov et al., 2001; He, Xie, Allan, Tran, & Clarke, 2014; Marbois et al., 2005; Marbois, Gin, Gulmezian, & Clarke, 2009). Synthesis of the polyisoprenoid tail of CoQ6 originates from compounds that derive from the mevalonate pathway associated with the ER, suggesting that the ER-mitochondria contact site might promote movement of CoQ6, or its biochemical intermediates and precursors, between these two organelles.
Indeed, we show that the CoQ synthome is destabilized in ERMES mutants, and this results in transcriptionally upregulated, yet inefficient, de novo CoQ6 biosynthesis. Such compromised synthesis results in an increase of CoQ6-intermediates as well as accumulation of CoQ6 at non-mitochondrial cellular membranes. We further demonstrate that ERMES mutants harbor decreased steady-state levels of CoQ6 and CoQ6-intermediates within mitochondria. This reduced level may contribute to the respiratory deficiency. Furthermore, ERMES-mediated contacts seem to be located in proximity to specialized matrix niches where the CoQ synthome is enriched, suggesting a spatially regulated process. Our study provides new insights into the relevance of ER-mitochondria contacts to CoQ6 homeostasis and, more broadly, to cellular respiration.
Materials and Methods
Strains and Plasmids
Saccharomyces cerevisiae strains and plasmids used in this study are listed in Table S1 and Table S2 , respectively. Yeast strains were based on strains S288C (BY4741; Brachmann et al., 1998) or W303 (Thomas & Rothstein, 1989). Transformations of polymerase chain reaction (PCR) products into yeast cells were performed using the Li-acetate method (Gietz & Woods, 2006; Janke et al., 2004; Longtine et al., 1998). Primers were designed using Primers-4-Yeast: http://www.weizmann.ac.il/Primers-4-Yeast/ (Yofe & Schuldiner, 2014).
RNA-Sequencing
S288C (BY4741) cells were cultured overnight in a synthetic medium SD (2% [wt/vol] glucose, 0.67% [wt/vol] yeast nitrogen base with ammonium sulfate and amino acid supplements) at 30°C. W303 cells were cultured overnight in a synthetic medium SGly (3% [wt/vol] glycerol, 0.67% [wt/vol] yeast nitrogen base with ammonium sulfate and amino acid supplements) at 30°C. In the morning, cells were back-diluted to OD600∼ 0.01 and followed until reaching OD600∼ 0.2. Cells were centrifuged (3,000 g, 3 min), and the pellet was frozen in liquid nitrogen and stored at −80°C until further analysis.
For all samples, RNA was purified as described (Voichek, Bar-Ziv, and Barkai, 2016). Briefly, RNA was extracted according to a protocol of Nucleospin® 96 RNA Kit (Machery-Nagel) with two modifications: Lysis was performed by adding 450 μl of lysis buffer containing 1 M sorbitol, 100 mM EDTA, and 0.45 μl lyticase (10 IU/μl) to cells in a 96 deep-well plate. The plate was then incubated for 30 min at 30°C, centrifuged (3,000 g, 10 min) and the supernatant was removed. In addition, dithiothreitol was used as a replacement for β-mercaptoethanol.
For S288C (BY4741) cells, RNA was fragmented, RNA molecules harboring a poly(A) were enriched, and this was followed by cDNA preparation, barcoding, and sequencing using Illumina HiSeq 2500, as described in Voichek et al. (2016). For W303 cells, RNA libraries were created by reverse transcription with a barcoded poly(T). DNA-RNA hybrids were pooled, followed by use of a hyperactive variant of the Tn5 transposase for fragmentation. SDS (0.2%) was used to strip Tn5 from DNA. Following SDS treatment, samples were purified using Solid Phase Reversible Immobilization (Beckman Coulter) Beads. cDNA was then amplified using PCR and sequenced using the Illumina NextSeq 500.
Single end reads were mapped to S. cerevisiae genome (R64 in SGD; Cherry et al., 2012) using bowtie (parameters: –best –a –m 2 –strata –5 10; Liu et al., 2005). Following alignment, reads mapped to rRNA were excluded. For S288C samples, reads were down sampled to 400,000 reads and normalized for PCR bias using the unique molecular identifier (Kivioja et al., 2012). For all samples, expression of each gene was the summary of reads aligned between 400 bp upstream and 200 bp downstream of the predicted open reading frame. The gene expression summary was normalized to be 1,000,000 and a gene with an expression below 10 was excluded from further analysis (Voichek et al., 2016). Each sample was analyzed twice, and values shown are typically the average of the two. However, if only one sample had a value, that value was utilized.
Mitochondrial Purification
Yeast wild-type and ERMES mutant cultures were cultured in YPGly (3% [wt/vol] glycerol, 1% [wt/vol] Bacto yeast extract, and 2% [wt/vol] Bacto peptone) at 30°C. Cells were harvested at OD600 < 4.0, and mitochondria were purified with discontinuous Nycodenz as described (Glick & Pon, 1995). Protease inhibitor mixture (Roche Complete EDTA-free), phosphatase inhibitor cocktail set II (EMD Millipore), and phosphatase inhibitor cocktail set 3 (Sigma-Aldrich) were added to the solutions. Gradient-purified mitochondria were frozen in liquid nitrogen and stored at −80°C until further analysis. Mitochondria from yeast Δcoq mutants were purified in the same manner from cultures expanded in YPGal medium (2% [wt/vol] galactose, 0.1% [wt/vol] dextrose, 1% [wt/vol] Bacto yeast extract, and 2% [wt/vol] Bacto peptone).
SDS-PAGE Analysis of Steady-State Levels of Coq Polypeptides
Purified mitochondria were resuspended in SDS sample buffer consisting of 50 mM Tris, pH 6.8, 10% glycerol, 2% SDS, 0.1% bromophenol blue, and 1.33% β-mercaptoethanol and proteins were separated by SDS-PAGE on 12% Tris-glycine polyacrylamide gels. An aliquot of 25 μg of purified mitochondria, as measured by the bicinchoninic acid assay standardized using bovine serum albumin, was loaded in each lane.
Two-Dimensional Blue Native- and SDS-PAGE Analysis of CoQ Synthome
Analyses of protein complexes by blue native (BN) gel electrophoresis were performed as previously described (Schagger, Cramer, & Vonjagow, 1994; Wittig, Braun, & Schägger, 2006). Briefly, an aliquot of 200 μg protein of purified mitochondria was pelleted by centrifugation (14,000 g, 10 min) and solubilized at a concentration of 4 mg protein/ml on ice for 1 h with BN solubilization buffer containing 11 mM HEPES, pH 7.4, 0.33 M sorbitol, 1× NativePAGE sample buffer (Thermo Fisher Scientific), 16 mg/ml digitonin (Biosynth), Roche Complete EDTA-free protease inhibitor mixture (Roche Complete EDTA-free), phosphatase inhibitor cocktail set II, and phosphatase inhibitor cocktail set 3. The soluble fraction was obtained by centrifugation (100,000 g, 10 min) and the protein concentration in the supernatant was determined by bicinchoninic acid assay. NativePAGE 5% G-250 sample additive (Thermo Fisher Scientific) was added to the supernatant to a final concentration of 0.25%. The first-dimension BN gel electrophoresis was performed using NativePAGE 4-16% Bis-Tris gel 1.0 mm x 10 wells (Thermo Fisher Scientific). First-dimension gel slices were soaked in hot SDS sample buffer for 15 min before loading them onto second dimension 12% Tris-glycine polyacrylamide gels. The high molecular weight standards for first-dimension BN gel electrophoresis were obtained from GE Healthcare (Sigma-Aldrich) and the molecular weight standards for the second dimension SDS-PAGE were obtained from Bio-Rad.
Immunoblot Analyses
Proteins were transferred onto 0.45 μm nitrocellulose membrane (Bio-Rad). Membranes were blocked in 0.5% bovine serum albumin, 0.1% Tween 20, 0.02% SDS in phosphate-buffered saline. Membranes were probed with primary antibodies in the same blocking buffer at the dilutions listed in Table S3. IRDye 680LT goat anti-rabbit IgG secondary antibody or IRDye 800CW goat anti-mouse IgG secondary antibody (LiCOR) was used at 1:10,000 dilutions. Blot images were recorded using LiCOR Odyssey Infrared Scanner (LiCOR).
BN-PAGE and Analysis of ATP Synthase
Wild type and Δmdm10 of the W303 background were grown in SLac (2% [wt/vol] lactate, 0.67% [wt/vol] Bacto yeast nitrogen base without amino acids), harvested at OD600 < 2.0 and isolated by differential centrifugation as described (Daum, Bohni, and Schatz (1982). BN-PAGE was performed as described earlier (Schägger, 2002). Briefly, 100 μg mitochondria were lysed in 40 µl buffer containing digitonin (1% digitonin, 20 mM Tris-HCl, 0.1 mM EDTA, 50 mM NaCl, 10% [vol/vol] glycerol, 1 mM PMSF, pH 7.2). After incubation on ice for 15 min and a clarifying spin (30,000 g, 15 min, 2°C), 5 µl sample buffer (5% (w/v) Coomassie blue G, 500 mM 6-amino-N-caproic acid, 100 mM Bis-Tris, pH 7.0) was added. The native complexes were analyzed by electrophoresis in a 6–14% gradient of acrylamide blue native gel. Proteins were transferred to polyvinylidene fluoride membranes and proteins were further analyzed by immunodecoration.
Stable Isotope Labeling
Cells were shaken overnight at 30°C in 100 ml of YPGly and diluted the next morning to an OD600 ∼0.1 with fresh YPGly. The cultures were incubated as before until they reached an OD600 of 0.6. Then ethanol (as vehicle control) or 8 μg/ml of the stable isotopes 13C6-pABA or 13C6-4HB were added, and the cultures were expanded for an additional 5 h. At each time point, triplicates of 10 ml culture were harvested by centrifugation (3,000 g, 5 min). Cell pellets were stored at −20°C.
Lipid Extractions and Analysis of CoQ6 and CoQ6 Intermediates
For lipid extractions, approximately 100 μg of purified mitochondria from each strain were prepared in triplicates. The same amount of internal standard CoQ4 was added to all samples and standards, followed by the addition of 2 ml methanol. Lipids were extracted twice, each time with 2 ml petroleum ether. Extracted lipids were dried down with N2 and stored at −20°C. Lipid extraction from isotopically labeled whole cell was performed in the same way from frozen cell pellets in triplicate.
For lipid analyses, dried lipids were reconstituted in 200 μl of 0.5 mg/ml benzoquinone in order to oxidize hydroquinones to quinones. An aliquot of 20 μl of each sample was injected into a 4000 QTRAP linear MS/MS spectrometer (Applied Biosystems). Applied Biosystems software, Analyst version 1.4.2, was used for data acquisition and processing. The chromatographic separation was carried out using a Luna 5 μm phenyl-hexyl column (100 × 4.6 mm, 5 μm; Phenomenex) and a mobile phase consisted of 95:5 methanol/isopropanol solution with 2.5 mM ammonium formate as solution A and 100% isopropanol solution with 2.5 mM ammonium formate as solution B. The percentage of solution B was increased linearly from 0 to 10% over 7 min, whereby the flow rate was increased from 650 to 800 μl/min. Each sample was analyzed using multiple reaction monitoring mode. The precursor-to-product ion transitions monitored for each sample are listed in Table S4 . The area value of each peak, normalized with the correspondent standard curve and internal standard, was referred to the total mitochondrial protein present in the sample or total OD of cells in each cell pellet. Statistical analysis was performed with GraphPad Prism with one-way analysis of variance Bonferroni’s multiple comparisons test, with the Greenhouse-Geisser correction for mitochondrial lipid analyses, and with two-way analysis of variance Dunnett’s multiple comparisons test for whole cell lipid analyses.
Microscopy
Yeast were cultured overnight at 30°C in either SGly for W303 cells or SD for S288C strain. In the morning, cells were back-diluted to OD600∼0.2 and cultured until reaching mid-logarithmic phase. Cells were then moved to glass-bottom, 384-well microscope plates (Matrical Bioscience) coated with Concanavalin A. After 20 min incubation at room temperature to enable adherence of cells to the matrix, the wells were washed with medium. Cells were then imaged at room temperature using a 60× oil lens (NA 1.4) in the VisiScope Confocal Cell Explorer system, which is composed of a Zeiss Yokogawa spinning disk scanning unit (CSU-W1) coupled with an inverted IX83 microscope (Olympus). Single–focal-plane images were taken using a PCO-Edge sCMOS camera, controlled by VisiView software (GFP-488 nm, RFP-561 nm, or BFP-405 nm). Images were reviewed using ImageJ, where brightness adjustment and cropping were performed.
Results
Yeast Lacking ERMES Have Higher Levels of Transcripts for Coenzyme Q Biosynthesis Enzymes
To investigate how ERMES contributes to the respiratory capacity of yeast cells, we measured the transcriptional response prompted by deletion of genes encoding ERMES subunits. We performed RNA sequencing on ERMES mutants from two different yeast genetic backgrounds: W303 yeast that were cultured on medium containing glycerol (a nonfermentable carbon source), to ensure preservation of their mitochondrial DNA (Hobbs et al., 2001), or S288C (BY4741) yeast, in which the ERMES mutants harbor reduced levels of mitochondrial DNA, and were therefore cultured on medium containing glucose to enable fermentation (the complete list of mRNA levels in ERMES mutants is in Table S5).
When surveying transcripts which are associated with mitochondrial respiration, we noticed that the mRNA levels of most COQ genes involved in the biosynthesis of CoQ6 were elevated relative to those in the respective control, in both genetic backgrounds and irrespective of the medium used (Figure 1(a) for W303 and Figure S1(a) for S288C). Of note, the mRNA levels of genes encoding for subunits of the respiration complexes did not show a consistent trend of either up- or downregulation ( Figure S1(b) .

Cells lacking ERMES show higher levels of COQ mRNAs without alterations to Coq proteins. (a) Levels of mRNAs of the indicated COQ genes were measured in different W303-based strains deleted for ERMES subunits (Δmmm1, Δmdm10, Δmdm12 Δmdm34), and a control strain, during growth in medium containing glycerol. The majority of COQ biosynthetic genes show higher mRNA levels compared to the control. Values are averages of two biological repeats. (b) Immunoblotting for steady-state levels of Coq polypeptides in purified mitochondria isolated from the indicated W303-based strains. Shown are mutants of the ERMES complex (Δmmm1, Δmdm10, Δmdm12, and Δmdm34), Δcoq (Δcoq3-Δcoq10) and a control, demonstrating that steady-state levels of the different Coq polypeptides were not dramatically altered in the ERMES deletion strains. Immunoblotting was performed with antisera against designated yeast Coq polypeptides (Coq3-Coq10), Mdh1 as a mitochondrial marker, and Sec62 as an ER marker. Arrows denote the corresponding protein in their respective blots. Images are representative gels from at least two biological replicates.
We therefore tested whether the higher mRNA levels of the COQ genes resulted in higher protein levels of those polypeptides, in mitochondria purified from W303 cells (Figure 1(b)). We examined the steady-state levels of Coq proteins that have previously been identified as members of the CoQ synthome, as well as Coq10, which is not part of the CoQ synthome but is thought to chaperone CoQ6 from the synthome to sites of function (Allan et al., 2013; Barros et al., 2005). Surprisingly, we observed that the steady-state levels of all Coq proteins in the mutant cells were either similar, or even slightly reduced, relative to their amounts in control cells (Figure 1(b)).
The CoQ Synthome Is Destabilized in the Absence of ERMES Subunits
As the overall mRNA levels of the COQ transcripts were higher in ERMES deletions, yet there was no major difference in protein levels, it seems that Coq proteins might be less stable in cells lacking the ERMES complex. Since most of the Coq polypeptides assemble in the CoQ synthome (Belogrudov et al., 2001; He et al., 2014; Marbois et al., 2005; Marbois et al., 2009) and proteins may become unstable when not assembled properly into their natural complexes, we examined the CoQ synthome by two-dimensional BN-PAGE (Figures 2 and S2(a)). Previously, the CoQ synthome was studied when galactose was used as a carbon source (He et al., 2014; Nguyen et al., 2014). However, to match the conditions we previously used for our assays, we followed Coq4, Coq5, and Coq9 in mitochondrial lysates from glycerol-cultured W303 cells. As expected, in control cells, the CoQ synthome was represented by high molecular weight signals, spanning a size range of 140 kDa to > 1 MDa for both Coq4 and Coq9 (Figures 2(a) and (b) and S2(a) ) and between 440 kDa to >1 MDa for Coq5 (Figure 2(b)). However, in the ERMES mutant strains, the majority of very large species (>MDa), representing the CoQ synthome, was replaced by subcomplexes with apparent migration equal to or less than ∼440 kDa (Figures 2 and S2(a)), indicating that the CoQ synthome is indeed destabilized in the absence of the ERMES complex. This is not due to a general destabilization of mitochondrial complexes, as the ATP synthase (complex V) was not affected by the absence of the ERMES subunit Mdm10 ( Figure S2(b) ). Furthermore, previous work did not reveal any change in the migration behavior of porin oligomers and the Tim22 complex in Δmdm10 strains (Meisinger et al., 2004). Collectively, our current results, alongside previous observations, suggest that the effect of ERMES mutants on the CoQ synthome is specific.
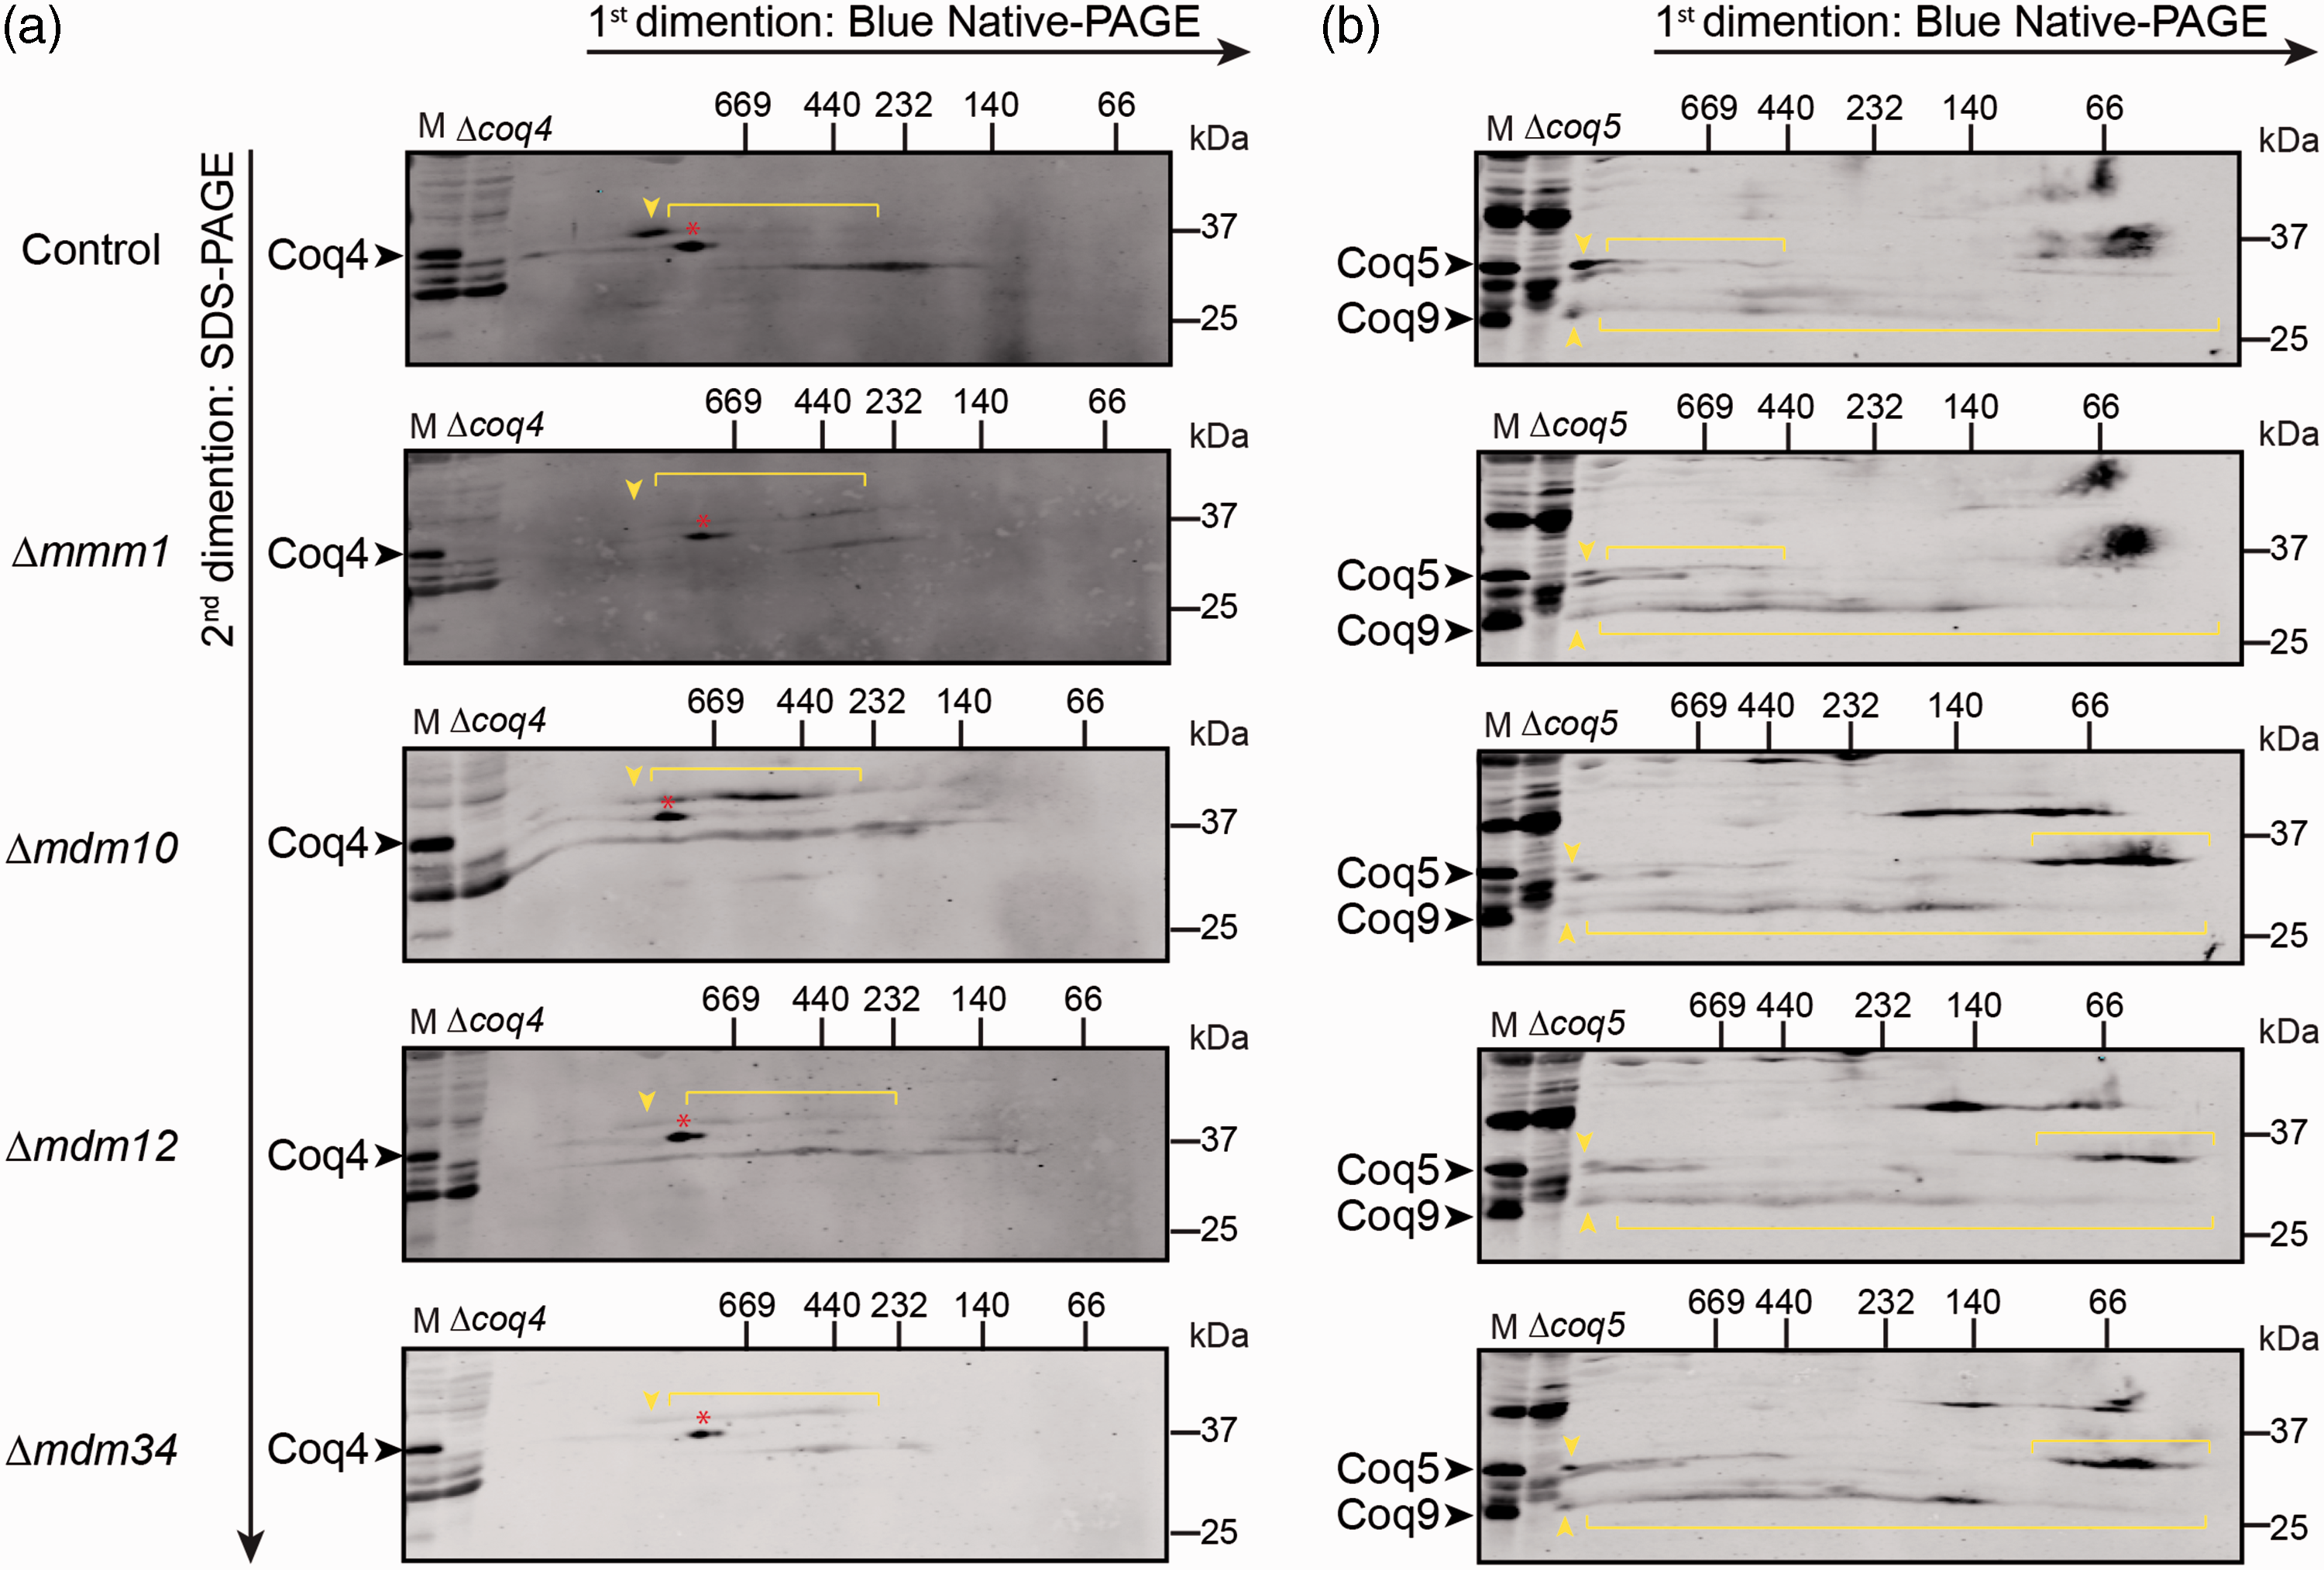
The CoQ synthome is destabilized in the absence of ERMES subunits. (a) Two-dimensional Blue Native-SDS-PAGE gel electrophoresis analysis of the CoQ synthome in mitochondria from ERMES mutants or from a wild-type (WT) control strain. Gels were immunoblotted against Coq4. In the control sample, the CoQ synthome appears as complexes ranging from 232 kDa to >1 MDa (the positions of the synthome is marked by the yellow arrow), while in the ΔERMES strains, the high molecular weight signal is replaced by a signal dispersed over a range of smaller molecular weights (indicated by brackets). The relevant band was identified by comparing the bands in the WT and Δcoq4 lanes. The red asterisk (*) indicates a discrete nonspecific signal observed with the antisera to Coq4. (b) Two-dimensional Blue Native-SDS-PAGE gel electrophoresis was performed as described in (a). Mitochondria from Δcoq5 strain were used to identify specific bands (Coq9 is also destabilized and undetectable in the Δcoq5 strain). Gels were immunoblotted against Coq5 and Coq9. The strong Coq5 and Coq9 bands in the higher molecular weight (>669 kDa) in the control sample (indicated by yellow arrows) are weaker in the ΔERMES strains and are replaced by an additional diffuse signal in the lower molecular weights (indicated by brackets).
ERMES Deletion Strains Show Elevated De Novo Synthesis of CoQ6 and Accumulate CoQ6 and CoQ6-Intermediates in Whole Cells
To quantify how the biosynthesis of CoQ6 is affected by destabilization of the CoQ synthome in ERMES mutants, we measured de novo synthesis of CoQ6 in vivo. Yeast cells may utilize either para-aminobenzoic acid (pABA) or 4-hydroxybenzoic acid (4HB) as ring precursors of CoQ6 (Marbois et al., 2010; Pierrel et al., 2010). Early-stage intermediates, hexaprenyl-aminobenzoic acid (HAB) and hexaprenyl-hydroxybenzoic acid (HHB) are derived from prenylation of pABA or 4HB, respectively. Subsequent modifications of the aromatic ring produce late-stage intermediates such as demethyl-demethoxy-Q6H2 (DDMQ6), and demethoxy-Q6H2 (DMQ6), which eventually lead to production of Q6H2 (for a schematic of the pathway, see Figure 3(a)). The amino substituent on the pABA ring is removed by a combination of Arh1, Yah1, Coq6, and Coq9 (He et al., 2015; Ozeir et al., 2015) and 4-imino-demethyl-demethoxy-Q6H2 (IDDMQ6) and 4-imino-demethoxy-Q6H2 (IDMQ6) likely represent dead-end products.

Biosynthesis of CoQ6 and CoQ6-intermediates is increased in cells lacking the ERMES complex. (a) Schematic representation of selected steps of the CoQ6 biosynthesis pathway. CoQ6-intermediates that were analyzed using mass spectrometry (MS) are indicated in green text. (b-g) MS-MS analysis for CoQ6 and CoQ6-intermediates in whole cell lipid extracts from W303 control, Δmmm1, Δmdm10, Δmdm12, and Δmdm34 strains. 13C6-CoQ6 and 13C6-CoQ6-intermediates derived from 13C6-pABA are depicted in red, while the 13C6-CoQ6 and 13C6-CoQ6-intermediates derived from 13C6-4HB are depicted in blue. The biosynthesis of 13C6-CoQ6 (b) is increased in Δmdm10, Δmdm12, and Δmdm34 strains labeled with 13C6-pABA or 13C6-4HB. The biosynthesis of 13C6-HHB (c) and 13C6-HAB (d) is significantly higher in all the ERMES deletion strains. The de novo levels of demethyl-demethoxy-Q6 (13C6-DDMQ6) (e), 4-imino-DMQ6 (13C6-IDMQ6) (f), and demethoxy-Q6 (13C6-DMQ6) (g) are significantly increased in Δmdm10, Δmdm12, and Δmdm34 strains, with the exception of 13C6-DMQ6 in Δmdm34 that did not change after the labeling with 13C6-4HB. Values are the mean of three repeats. The error bar indicates ±SD. Statistically significant differences between control (WT) and each of the ERMES mutants are represented by *, p < .05; **, p < .01; ***, p < .001, and ****, p < .0005. HHB = hexaprenyl-hydroxybenzoic acid; HAB = hexaprenyl-aminobenzoic acid; CoQ = Coenzyme Q; DDMQ = demethyl-demethoxy-Q; DMQ = demethoxy-Q; IDMQ = 4-imino-demethoxy-Q.
To determine whether CoQ6 production was altered in the ERMES deletion strains, we analyzed de novo biosynthesis of 13C6-CoQ6 with 13C ring-labeled precursors, namely, 13C6-pABA and 13C6-4HB. Surprisingly, we saw that Δmdm10, Δmdm12, and Δmdm34 cells showed enhanced de novo synthesis of 13C6-CoQ6 (Figure 3(b)). These mutants also accumulated CoQ6-intermediates emanating from 13C6-pABA and 13C6-4HB, whereas Δmmm1 cells only contained significantly higher amount of 13C6-labeled HAB and HHB, but not the other intermediates (Figure 3(c) to (g)). We also measured the levels of unlabeled CoQ6 (which correspond to the steady-state levels) in the same samples and observed an accumulation of unlabeled CoQ6 and CoQ6-intermediates in most of the ERMES deletion mutants, regardless of the presence or absence of 13C-labeled precursor ( Figure S3 ). The results suggest that the destabilized CoQ synthome in ERMES mutants results in an aberrant accumulation of CoQ6 as well as CoQ6-intermediates.
ERMES Deletion Strains Show Decreased Steady-State Levels of CoQ6 and CoQ6-Intermediates in Isolated Mitochondria
Although the biosynthesis of yeast CoQ6 occurs exclusively within mitochondria, CoQ6 is present in all cellular membranes (Bentinger et al., 2010). To focus on the status of CoQ6 in mitochondria, we compared the steady-state content of CoQ6 in mitochondria isolated from the ERMES deletion mutants to mitochondria obtained from a control strain. Although the overall cellular levels of CoQ6 in these mutants were increased, the steady-state levels of CoQ6 per unit of mitochondrial protein were significantly reduced in mitochondria isolated from Δmmm1, Δmdm10, or Δmdm12 strains (Figure 4(a)). Only strains lacking Mdm34 appeared to have nearly normal levels of CoQ6. Isolated mitochondria from all of the ERMES deletion strains also contained lower levels of the late-stage intermediates IDMQ6 and DMQ6 (Figure 4(b) and (c), respectively). The levels of the late-stage intermediate DDMQ6 were reduced in all strains, though the reduction was not statistically significant (Figure 4(d)). Our finding of decreased steady-state levels of CoQ6 and its late intermediates in isolated mitochondria suggests that the accumulation of these molecules in whole cell lipid extracts (Figures 3 and S3) must reside in non-mitochondrial membranes. Moreover, reduced levels of pathway product in vicinity to the enzymes may reduce feedback inhibition (Berg, Tymoczko, & Stryer, 2002; Gehart & Pardee, 1962; Umbarger, 1961), providing an explanation for the increased rate of synthesis observed in ERMES mutants. However, feedback inhibition has not yet been reported for Coq enzymes.

Mitochondria from ERMES mutants show less CoQ6 and CoQ6-intermediates. (a-f) Targeted MS-MS analyses for CoQ6 and CoQ6-intermediates from purified mitochondria from W303 wild-type (WT) control, ERMES mutants (Δmmm1, Δmdm10, Δmdm12, and Δmdm34) as well as Δcoq7, which was included as a negative control. Levels of (a) CoQ6 were significantly reduced in all ERMES deletion strains except for Δmdm34. Levels of (b) IDMQ6 and (c) DMQ6 were significantly reduced in all ERMES deletion strains. Levels of (d) DDMQ6 were not significantly changed. Levels of (e) HHB and (f) HAB were significantly higher in the Δcoq7 strain; however, ERMES deletion strains did not show an accumulation of either HHB or HAB (with the exception of Δmdm34 accumulating HHB). Values are means of three biological repeats. The error bar indicates ±SD. Statistically significant differences between the control and each of the ERMES mutants are represented by *, p < .05; **, p < .01; ***, p < .001; and ****, p < .0005. n.d. = not detected. HHB = hexaprenyl-hydroxybenzoic acid; HAB = hexaprenyl-aminobenzoic acid; CoQ = Coenzyme Q; DDMQ = demethyl-demethoxy-Q; DMQ = demethoxy-Q; IDMQ = 4-imino-demethoxy-Q.
In the complete absence of the CoQ synthome, strains fail to make CoQ6 and can only carry out the first two steps of the biosynthetic pathway, producing HAB or HHB from the prenylation reaction of pABA or 4HB, respectively, using precursors derived from the mevalonate pathway in the ER (He et al., 2014). Indeed, deletion of the COQ7 gene resulted in a dramatic accumulation of HHB and HAB (Figure 4(e) and (f)), as observed previously (Tran & Clarke, 2007). Interestingly, in the strains deleted for ERMES subunits, this accumulation of early CoQ6-intemediates did not occur (with the exception of HHB slightly accumulating in the Δmdm34 strain (Figure 4(e))). The difference in the accumulation phenotypes between the ERMES-deletion strains and Δcoq7 suggests that in addition to stabilizing the CoQ synthome, ERMES has a role at an earlier stage of the pathway.
The CoQ Synthome Resides in Specific Membrane Niches in Proximity to ERMES Contacts
Strains lacking ERMES subunits exhibit increased levels of cellular CoQ6 and CoQ6-intermediates, yet mitochondrial CoQ6 and CoQ6-intermediates are decreased and the CoQ synthome is destabilized. In addition, early pathway intermediates do not accumulate, suggesting a reduced flux of precursors from the ER. We wondered whether the ERMES complex may play a role in organizing the CoQ synthome and the trafficking of CoQ6-related metabolites near ER-mitochondria contacts. As tagging Coq polypeptides with green fluorescent protein (GFP) does not impair their function ( Figure S4(a) ), we tagged Coq3, Coq4, Coq6, Coq9, and Coq11 with GFP and performed fluorescence microscopy. We noticed that these proteins are not distributed evenly throughout the mitochondrial matrix, but rather manifest a more punctate distribution (data not shown), suggesting that there might be discrete areas inside the mitochondrial matrix that are dedicated to the synthesis of CoQ6. If the assembly of the CoQ synthome depends on ERMES, in a strain deleted for ERMES the punctate pattern of the GFP-tagged Coq polypeptide should disappear. Indeed, when we GFP-tagged Coq6 and Coq9 in a strain harboring a deletion for MDM34, the Coq-GFP punctate pattern was lost and the GFP signal was now spread throughout the entire mitochondrion ( Figure S4(b) ). However, as these mutants show dramatic alteration in mitochondrial morphology (Kornmann et al., 2009), it is hard to determine whether this effect is direct. To better understand the spatial relationship between ERMES and the CoQ synthome, we tagged Coq6 and Coq9 with GFP in a strain expressing Mdm34 fused to mCherry. Analyses of these cells revealed that more than 70% of the Mdm34-mCherry-marked contacts colocalized with Coq6-GFP or Coq9-GFP puncta (Figure 5(a) and quantification in Figure 5(b)). This colocalization was independent of genetic background and was also evident in a S288C background strain ( Figure S4(c) ). Our results strongly suggest that the localization of the CoQ synthome is coordinated with the position of the ER-mitochondria contact site.

Members of the CoQ synthome reside in a matrix niche that underlies the ERMES complex. (a) Yeast cells expressing the indicated GFP-tagged Coq protein, the ERMES component Mdm34 tagged with mCherry, and a marker for the mitochondrial matrix (blue fluorescent protein [BFP] fused to a mitochondrial targeting sequence [MTS]) were imaged using fluorescence microscopy. Mitochondrial Coq foci that underlie ERMES are indicated by arrows. Scale bar = 5 µM. (b) Quantification of (a), for each cell, the Coq-GFP foci were identified. Then the proximity between each Mdm34-mCherry puncta and Coq-GFP was assessed. n = 100 Mdm34-mCherry puncta. (c) Yeast cells expressing Coq6-GFP, Mdm34-mCherry, and a MTS-BFP were imaged using fluorescence microscopy on either control or Δcoq10 background. Scale bar = 5 µM. (d) Quantification of (c). The proximity between each Mdm34-mCherry puncta and the Coq6-GFP signal was examined. n = 100 Mdm34-mCherry puncta. (e) Schematic representation of the colocalization of ERMES and the CoQ synthome. Coq6 and Coq9, which were visualized in (a), are highlighted in orange. (f) A suggested model for the retention of CoQ6 and CoQ6-intermediates inside mitochondria: Under normal conditions, the CoQ synthome is well assembled and CoQ6 biosynthesis (represented by the red arrow) occurs efficiently inside mitochondria. This catalytic efficiency ensures that early- and late-stage CoQ6-intermediates do not accumulate, and optimal funneling through the pathway reduces loss across the mitochondrial outer membrane and into the rest of the cell. When the ERMES complex is absent, the stability of the CoQ synthome is compromised. A partially destabilized CoQ synthome underlies inefficient CoQ biosynthesis, leading to leakage of early- and late-stage CoQ6-intermediates. OM = outer membrane, IM = inner membrane; GFP = green fluorescent protein; BFP = blue fluorescent protein; MTS = mitochondrial targeting sequence; ER = endoplasmic reticulum; ERMES = ER mitochondria encounter structure; HHB = hexaprenyl-hydroxybenzoic acid; HAB = hexaprenyl-aminobenzoic acid; CoQ = Coenzyme Q; DDMQ = demethyl-demethoxy-Q; DMQ = demethoxy-Q; IDMQ = 4-imino-demethoxy-Q.
Interestingly, in the yeast genome, the COQ10 and MDM12 genes are adjacent and likely to share a promoter (Cherry et al., 2012). Indeed, SPELL analysis of transcriptional co-regulation (Hibbs et al., 2007) demonstrates that these two genes are co-expressed. We therefore tested whether Coq10 is involved in the positioning of the CoQ synthome next to ERMES. To this end, we removed COQ10, then assessed colocalization between Coq6-GFP and Mdm34-mCherry. The Coq6-GFP signal was dramatically reduced upon COQ10 deletion, consistent with previous findings (Hsieh et al., 2007). Nevertheless, several Coq6-GFP-containing puncta were observed. Quantification of the colocalization between these Coq6-GFP puncta and Mdm34-mCherry revealed that the positioning of the CoQ synthome next to the ERMES complex was reduced in the coq10 null mutant (Figure 5(c) and quantification in Figure 5(d)). Our results suggest that the positioning of the CoQ synthome within mitochondria is a regulated process which depends upon the presence of Coq10.
Discussion
Contact sites play a critical role in shaping cellular architecture, and their facilitation of small molecule transfer between organelles enables tight regulation of biochemical pathways. In this study, we show that ERMES, an ER-mitochondria contact site tether, plays a key role in regulating CoQ6 biosynthesis and distribution.
The ERMES complex appears to impact CoQ6 synthesis on two levels. First, absence of the ERMES complex leads to destabilization of the CoQ synthome, perturbed CoQ6 synthesis, and altered distribution of CoQ6 and its precursors. Second, there is a clear spatial coordination of the ERMES complex with the CoQ synthome (Figure 5(e)). It is possible that ERMES may directly impact the CoQ synthome; however, there is no evidence showing direct interaction of ERMES subunits with known members of the CoQ synthome. We also note that the effects of ERMES disruption on the synthome and CoQ6 biogenesis may be, at least in part, indirectly prompted by changes to phospholipid metabolism (Elbaz-Alon et al., 2014; Hönscher et al., 2014; Kawano et al., 2018; Lahiri et al., 2014) or by alteration of the shape and size of mitochondria (Hanekamp et al., 2002; Tan et al., 2013; Youngman et al., 2004).
We have shown that Coq10 is involved in the coordination of CoQ6 synthesis across the ER-mitochondria interface (Figure 5(c) and (d)). COQ10 encodes a membrane-spanning protein harboring a putative steroidogenic acute regulatory-related lipid transfer (StART) domain and a lipid-binding pocket for CoQ6 and late-stage CoQ6-intermediates (Allan et al., 2013) . Although Coq10 has not been shown to be part of the CoQ synthome, it is necessary for efficient de novo CoQ6 biosynthesis and respiration (Allan et al., 2013). The co-expression of the COQ10 and MDM12 genes (Hibbs et al., 2007) might help coordinate the levels of Coq10 and ERMES to allow a better positioning of the CoQ synthome next to ER-mitochondria contact sites as they fluctuate in amount with changing cellular needs. Intriguingly, when overexpressed, Mdm12 is capable of entering the nucleus (Weill et al., 2018), raising the possibility of feedback control of the CoQ synthome-ERMES interaction. Moreover, the specific mechanism by which COQ genes are transcriptionally upregulated by ERMES disruption remains to be determined, but extensive communication exists between mitochondria and the nucleus (Eisenberg-Bord & Schuldiner, 2017), and at least one pathway by which CoQ biosynthesis can be upregulated by CoQ deficiency has been revealed in metazoans (Oks, Lewin, Goncalves, & Sapir, 2018).
How do CoQ6 and CoQ6-intermediates escape from mitochondria and accumulate in non-mitochondrial membranes in the ERMES deletion mutants? This might be due to a direct or indirect effect. Given that many Coq proteins of the CoQ synthome can bind to CoQ6 or its biosynthetic intermediates, we propose that a destabilized CoQ synthome causes reduced sequestration of CoQ6 within mitochondria (Figure 5(f)). In an alternative, yet not mutually exclusive model, disruption of ERMES mutants leads to reduced degradation of CoQ6 outside of mitochondria. Although CoQ6 degradation has not been studied extensively, it is believed that degradation of the polyisoprene tail of CoQ6 may be carried out in peroxisomes via both α- and β-oxidation (Wanders, 2014). Indeed, we have previously shown that peroxisome-mitochondria (PERMIT) contact sites reside in proximity to ER-mitochondria contact sites (Cohen et al., 2014), raising the possibility that loss of ERMES may also affect the capacity to degrade escaped CoQ6.
Excitingly, our findings are likely to have relevance to human health and disease. In mammals, the mitofusin 2 (MFN2) protein acts as a tether between the ER and mitochondria (de Brito & Scorrano, 2008), and conditional MFN2 knock-out mice exhibit impaired respiration linked to a decrease in mitochondrial levels of the mammalian ubiquinones, CoQ9 and CoQ10 (Mourier et al., 2015). It is hypothesized that this phenotype is not directly related to the role of MFN2 in mitochondrial fusion as the CoQ deficiency was not linked to the morphology of the mitochondrial network. These findings further suggest that a reduction in ER-mitochondria tethering can perturb CoQ biosynthesis, suggesting parallels between the yeast and mammalian cells.
Supplemental Material
Supplemental material for The Endoplasmic Reticulum-Mitochondria Encounter Structure Complex Coordinates Coenzyme Q Biosynthesis
Supplemental Material for The Endoplasmic Reticulum-Mitochondria Encounter Structure Complex Coordinates Coenzyme Q Biosynthesis by Michal Eisenberg-Bord, Hui S. Tsui, Diana Antunes, Lucía Fernández-del-Río, Michelle C. Bradley, Cory D. Dunn, Theresa P. T. Nguyen, Doron Rapaport, Catherine F. Clarke and Maya Schuldiner in Contact
Supplemental Material
Supplemental Table1 - Supplemental material for The Endoplasmic Reticulum-Mitochondria Encounter Structure Complex Coordinates Coenzyme Q Biosynthesis
Supplemental material, Supplemental Table1 for The Endoplasmic Reticulum-Mitochondria Encounter Structure Complex Coordinates Coenzyme Q Biosynthesis by Michal Eisenberg-Bord, Hui S. Tsui, Diana Antunes, Lucía Fernández-del-Río, Michelle C. Bradley, Cory D. Dunn, Theresa P. T. Nguyen, Doron Rapaport, Catherine F. Clarke and Maya Schuldiner in Contact
Supplemental Material
Supplemental Table2 - Supplemental material for The Endoplasmic Reticulum-Mitochondria Encounter Structure Complex Coordinates Coenzyme Q Biosynthesis
Supplemental material, Supplemental Table2 for The Endoplasmic Reticulum-Mitochondria Encounter Structure Complex Coordinates Coenzyme Q Biosynthesis by Michal Eisenberg-Bord, Hui S. Tsui, Diana Antunes, Lucía Fernández-del-Río, Michelle C. Bradley, Cory D. Dunn, Theresa P. T. Nguyen, Doron Rapaport, Catherine F. Clarke and Maya Schuldiner in Contact
Supplemental Material
Supplemental Table3 - Supplemental material for The Endoplasmic Reticulum-Mitochondria Encounter Structure Complex Coordinates Coenzyme Q Biosynthesis
Supplemental material, Supplemental Table3 for The Endoplasmic Reticulum-Mitochondria Encounter Structure Complex Coordinates Coenzyme Q Biosynthesis by Michal Eisenberg-Bord, Hui S. Tsui, Diana Antunes, Lucía Fernández-del-Río, Michelle C. Bradley, Cory D. Dunn, Theresa P. T. Nguyen, Doron Rapaport, Catherine F. Clarke and Maya Schuldiner in Contact
Supplemental Material
Supplemental Table4 - Supplemental material for The Endoplasmic Reticulum-Mitochondria Encounter Structure Complex Coordinates Coenzyme Q Biosynthesis
Supplemental material, Supplemental Table4 for The Endoplasmic Reticulum-Mitochondria Encounter Structure Complex Coordinates Coenzyme Q Biosynthesis by Michal Eisenberg-Bord, Hui S. Tsui, Diana Antunes, Lucía Fernández-del-Río, Michelle C. Bradley, Cory D. Dunn, Theresa P. T. Nguyen, Doron Rapaport, Catherine F. Clarke and Maya Schuldiner in Contact
Supplemental Material
Supplemental Table5 - Supplemental material for The Endoplasmic Reticulum-Mitochondria Encounter Structure Complex Coordinates Coenzyme Q Biosynthesis
Supplemental material, Supplemental Table5 for The Endoplasmic Reticulum-Mitochondria Encounter Structure Complex Coordinates Coenzyme Q Biosynthesis by Michal Eisenberg-Bord, Hui S. Tsui, Diana Antunes, Lucía Fernández-del-Río, Michelle C. Bradley, Cory D. Dunn, Theresa P. T. Nguyen, Doron Rapaport, Catherine F. Clarke and Maya Schuldiner in Contact
Footnotes
Acknowledgments
We thank Rodney Rothstein for strains, we thank Christian Ungermann, Jodi Nunnari and Naama Barkai for plasmids, we thank Lee McAlister-Henn and David Meyer for antibodies, and we thank Ido Amit for the transposase required for the sequencing. We thank Yoav Voichek and Yulia Gordon for producing and analyzing the RNA-sequencing data. We thank Alexander Brandis and Tevi Mehlman from the Targeted Metabolomics unit of the Life Sciences Core Facilities of the Weizmann Institute for Mass-Spectrometry analysis.
Declaration of Conflicting Interests
The author(s) declared no potential conflicts of interest with respect to the research, authorship, and/or publication of this article.
Funding
The author(s) disclosed receipt of the following financial support for the research, authorship, and/or publication of this article: CDD acknowledges funding from an EMBO Installation Grant (2138) and from an European Research Council Starting Grant (RevMito 637649). MEB is grateful to the Azrieli Foundation for the award of an Azrieli Fellowship. This work was supported by the Deutsche Forschungsgemeinschaft (DIP to MS and DR), and the IMPRS “From Molecules to Organisms” (DA). Work in the Schuldiner lab is additionally supported by an SFB1190 from the DFG as well as a “Life” grant from the Volkswagen foundation. MS is an incumbent of the Dr. Gilbert Omenn and Martha Darling Professorial Chair in Molecular Genetics. This work is supported by the National Science Foundation Grant MCB-1330803 (to CFC) and by the National Institutes of Health Grant T32 GM 008496 to HST and MCB.
Supplemental material
Supplemental material for this article is available online.
References
Supplementary Material
Please find the following supplemental material available below.
For Open Access articles published under a Creative Commons License, all supplemental material carries the same license as the article it is associated with.
For non-Open Access articles published, all supplemental material carries a non-exclusive license, and permission requests for re-use of supplemental material or any part of supplemental material shall be sent directly to the copyright owner as specified in the copyright notice associated with the article.