
Abstract
Invalid responses pose a significant risk of distorting survey data, compromising statistical inferences, and introducing errors in conclusions drawn from surveys. Given the pivotal role of surveys in research, development, and decision-making, it is imperative to identify careless survey respondents. The existing literature on this subject comprises two primary categories of approaches: methods that rely on survey items and methods involving post hoc analyses. The latter, which does not demand preemptive preparation, predominantly incorporates statistical techniques or metadata analysis aimed at identifying distinct response patterns that are associated with careless responses. However, several inherent limitations limit the precise identification of careless respondents. One notable challenge is the lack of consensus concerning the thresholds to use for the various measures. Furthermore, each method is designed to detect a specific response pattern associated with carelessness, leading to conflicting outcomes. In this article, we seek to assess the efficacy of the existing methods using a novel survey methodology encompassing responses to both meaningful and meaningless gibberish scales in which the latter compels respondents to answer without considering item content. Using this approach, we propose the application of machine learning to identify careless survey respondents. Our findings underscore the efficacy of a methodology using supervised machine learning combined with unique gibberish data as a potent method for the identification of careless respondents, aligning with and outperforming other approaches in terms of effectiveness and versatility.
Keywords
Invalid responses are considered a major drawback of self-report surveys (Curran, 2016). Although they are not specific to web surveys, it has been found that such responses are more likely in online surveys than in written or nonself-reported surveys (Leiner, 2019). The literature distinguishes between two types of invalid responses: a lazy responder who provides careless responses and a dishonest responder who distorts the survey responses because of social motivations related to impression management (Arthur et al., 2021). In this article, we primarily focus on careless responses. Careless responses were previously studied under many names and definitions, notably “content nonresponsivity,” that is, responding to items without concern for item content (Nichols et al., 1989); “random responses” (Beach, 1989; Berry et al., 1992); “protocol invalidity” (Johnson, 2005); “insufficient effort responder” (Huang et al., 2012; Huang, Liu, & Bowling, 2015); “inattentive responding” (Curran, 2016); and “lazy and careless responder” (Arthur et al., 2021; Curran et al., 2010; Meade & Craig, 2012).
Careless Responding: The Problems
Careless responses introduce error or noise into measurements, potentially leading to unreliable and inaccurate results and threatening the validity of research (Ophir et al., 2020). Even a small proportion, such as 5% to 10%, of careless responses can significantly affect findings (Credé, 2010; Schmitt & Stuits, 1985), resulting in flawed development and implementation of policies and procedures based on misleading or inaccurate data. For a summary of the problems that careless responding poses for survey-based research, see Table A1 in Appendix A in the Supplemental Material available online.
Careless Responding: Existing Solutions
The challenges posed by careless responding have led researchers to propose numerous detection methods, categorized as direct and indirect. Direct methods involve mechanisms embedded within the survey to identify careless responses, such as reverse-coded items, that is, positive and negative phrasing requiring attention to ensure consistency; attention-check items instructing respondents to provide a particular answer; and self-report items asking respondents to declare whether they paid attention while responding. Each of these methods has advantages and disadvantages. Indirect methods, on the other hand, rely on post hoc statistical analyses.
In this study, we focus on statistical methods. For a detailed explanation of the advantages and disadvantages of both methods, see Table A2 in Appendix A in the Supplemental Material; for comprehensive reviews of methods for careless-response detection, see, for example, Arthur et al. (2021), Curran (2016), Meade and Craig (2012), and Ward and Meade (2023).
Indirect methods for detecting careless responding
The indirect methods include long-string, individual-response variance (IRV); Mahalanobis distance; reliability of each respondent; and person-fit indices. Most indirect methods share the assumption that careless responding can be identified through their response patterns (Arthur et al., 2021). These patterns are sometimes referred to as “random responses” (Beach, 1989; Berry et al., 1992), although people appear incapable of producing responses that are truly random (Neuringer, 1986) and exhibit varying degrees of systematization even when instructed to respond randomly (Curran, 2016; Huang, Bowling, et al., 2015; Huang et al., 2012). Rather, “random responses” exhibit some discernible patterns (Curran, 2016; DeSimone et al., 2018; Meade & Craig, 2012). Hence, the indirect methods reviewed next seek to detect response patterns suspected to reflect carelessness through statistical tools.
“Long string” is a response pattern containing many repetitions of the same response in a row. If a careless or lazy respondent prefers to “save” hand movement when answering the survey, then careless responses would contain longer long strings (Behrend et al., 2011; Huang et al., 2012). IRV is the standard deviation of each person’s responses. This measure examines the extent to which respondents are self-similar. If IRV is either exceptionally small or large, it may indicate careless responding. IRV allows for the detection of variations of the long string that identifies only a repetitive response pattern (e.g., IRV will detect a response of 1, 1, 2, 1, 2, on a 7-point scale as 1 with low variance, whereas the long string of such a pattern will have a length of 2 only; Curran, 2016; Dunn et al., 2018; Marjanovic et al., 2015).
Mahalanobis distance (Meade & Craig, 2012) measures the distance of a respondent’s responses from the average response pattern, which considers the covariance among the items. There are additional methods, rarely used, that also rely on identifying deviations from the average response sequences of all respondents (Meade & Craig, 2012; Stevens, 1984). The “personal reliability of each respondent” is the within-persons correlation between the even and odd items within each scale of the reliable construct. A low correlation points to careless responding because careful respondents are likely to answer the even and odd items of the same construct similarly (Huang, Liu, & Bowling, 2015; Johnson, 2005).
Finally, the person-fit analysis evaluates the consistency of participants’ responses using item-response-theory (IRT) models. It examines whether individual response patterns align with overall sample trends or IRT-model predictions. The method includes several indices, two of which we use. One index is Gpm (Guttman errors). It measures deviations in response order when items are arranged by difficulty or popularity. For polytomous items, it considers “item steps,” representing thresholds between response options. Errors are presumed when less popular steps are chosen over more popular ones, and higher error counts indicate less consistency. The second index is lpzm (standardized likelihood). It is a calculation of the likelihood of a response pattern based on the participant’s trait level in the IRT model. A low likelihood reflects inconsistency in responses. These indices allow researchers to systematically assess the consistency of responses and identify patterns that deviate significantly from expected behavior, providing insights into the respondent’s engagement (Niessen et al., 2016).
Statistics-based methods for detecting careless responding face notable challenges, particularly the absence of absolute cutoff points for indices, such as long string, IRV, Mahalanobis distance, and personal reliability (DeSimone & Harms, 2018). This limitation raises the issue of determining which responses are invalid. Nevertheless, some researchers argue that the lack of strict thresholds is not problematic because these methods serve as heuristic tools rather than statistical indices with invariant distributions (Curran, 2016). Moreover, careless responding exists on a continuum, ranging from completely careless behavior to instances in which respondents answer some parts carelessly and others carefully.
The Mahalanobis distance, personal reliability, and person-fit methods may also create false alarms because a small distance and high personal reliability indicate only consistency. Lower consistency, in contrast, can indicate cognitive effort when differentiating between similar but nonidentical items, whereas consistent patterns may signal careless responding unless scales include reversed items (Krosnick & Alwin, 1988; Kurtz & Parrish, 2001). Analyses of three data sets revealed that careless responses not only fail to reduce internal consistency but also can inflate it. Specifically, careless responses exhibit higher internal consistency than attentive ones (Stosic et al., 2024). Excluding respondents based on inconsistency artificially aligns the data, introducing biases, such as inflated correlations. This selective filtering undermines validity by excluding those who deviate from the study’s hypothesized constructs, favoring consistency that supports the study’s assumptions (Leiner, 2019).
Another method, response duration, uses metadata analysis—the time respondents take to answer the survey. Because careless respondents often seek to complete surveys quickly (Curran, 2016), short response durations may indicate inattention, particularly when the time is insufficient to read the items (Behrend et al., 2011; Berry et al., 1992).
The lack of standardized criteria for detecting careless responses contributes to considerable variability in prevalence estimates, ranging from 1% to 50% (Brühlmann et al., 2020; Clark et al., 2003; Credé, 2010; Curran et al., 2010; Ehlers et al., 2009; Meade & Craig, 2012; Schmitt & Stuits, 1985; Ward & Meade, 2018). Because each screening method often identifies distinct groups of respondents, combining multiple methods is recommended to improve accuracy (Goldammer et al., 2020; Huang et al., 2012; Ward & Meade, 2023). Indeed, correlations between detection methods are generally small to moderate, and there is a significant variation in the proportions of respondents identified by each technique (DeSimone & Harms, 2018). For instance, the long-string index correlates with individual response variability but not with the Mahalanobis distance. Therefore, next, we consider a new alternative.
Machine-learning-based methods
In recent years, researchers have made several attempts to use machine learning (ML) for detecting careless respondents. Alfons and Welz (2024) proposed the use of autoencoders for analyzing multiscale surveys through supervised learning. They classified respondents as careless or not based on traditional indicators, including consistency, response patterns, and response times. Ozaki (2024) introduced a generic method for identifying careless respondents that integrates various traditional techniques. He trained a model using response-time metrics, long-string indices, Mahalanobis distance, standard deviation, and response times combined with the number of survey items. This model was then applied to new surveys. Gogami et al. (2021) analyzed screen recordings of respondent behavior while answering surveys, examining features such as scrolling patterns, Likert-scale responses, and character counts in open-ended questions. They processed these data using ML, in which labeling of careless respondents was based on traditional methods. Schroeders et al. (2022) used gradient boosting machines to predict careless respondents. Although the method demonstrated high accuracy, sensitivity, and specificity rates with simulated data, its performance was lower with empirical data. However, results improved when response-time data were included as an additional predictor. In this study, careless respondents were defined based on their random group assignment, that is, instructions they received during an experiment to respond quickly without carefully reading the items.
These studies employed ML to identify careless respondents, and the classification of such respondents relied on traditional methods or explicit instructions for participants to respond carelessly. They suggest that the potential of ML for detecting careless respondents remains not fully realized. Alfons and Welz (2024) emphasized that supervised ML is a promising direction if applied to high-quality data, recommending the creation of a repository containing numerous examples of careless respondents. However, doubts persist regarding the extent to which data labeled as “careless” can be considered high quality when the classification of careless respondents relies on several traditional methods or instructions to respondents whose adherence is uncertain or whose ability to simulate careless behavior is unclear (Schroeders et al., 2022). Therefore, we suggest a new ML variant.
The Gibberish-ML Method
The gibberish-ML (GibML) method consists of two main components. First, legitimate and careless survey responses are collected. Next, a supervised ML model is trained to classify responses as legitimate or careless based on their patterns in the collected careless responses and the survey responses under testing. GibML has two modes of application. First, one can apply ML to data collected using a within-subjects design in which both legitimate and illegitimate responses are gathered simultaneously in a single survey from the same respondents. Second, one can apply ML to survey data and pair it with illegitimate responses collected in archival survey. From a theoretical perspective, both approaches are suitable for practical implementation: integrating nonsensical (illegitimate) items directly into the survey design when appropriate and feasible based on the questionnaire structure and respondent tolerance or alternatively, conducting post hoc analysis by combining the survey data with external illegitimate-response data.
Use of gibberish scales for training
We collected responses resembling careless responses with “gibberish scales.” The gibberish scales are intentionally designed to be unreadable, thereby simulating the behavior of careless respondents who do not read the question text and respond without considering the meaning of the question or their answer. Understanding a gibberish question is impossible, as is considering a response to it. Therefore, gibberish scales replicate the typical characteristics of a careless response as defined and exhibit a very high level of internal consistency (Arias, Ponce, et al., 2020; Curran, 2016; Maul, 2017). Within the gibberish text, we incorporated special characters (e.g., “%,” “#,” “@”) to emphasize the nature of the text and to signal to respondents that reading the entire text was unnecessary. It can be reasonably assumed that as the survey progressed, respondents increasingly recognized the gibberish scales as meaningless. Thus, they align their behavior more closely with careless respondents because careless behavior tends to appear more as the survey advances (Bowling et al., 2021).
Supervised-ML approach
GibML employs a supervised-ML methodology. In this article, we chose to use support vector machines (SVMs) with a radial kernel (Patle & Chouhan, 2013). The choice of SVM was made without a particular theoretical preference, and any other supervised-ML method (e.g., decision trees, random forests, or neural networks) could likely have been similarly applied. The choice of a supervised model is crucial because our goal is specifically to distinguish careless respondents from other respondents rather than to obtain any other logical division among respondents based on survey content. The radial kernel was selected to avoid making restrictive assumptions about the nature of the relationships between predictors and the criterion, allowing the model to operate as broadly and flexibly as possible.
In this phase, the data set includes gibberish scales and survey-content scales. The algorithm distinguishes between gibberish and valid survey responses based on the discrepancies identified between response patterns in the content scales and those in the appended gibberish scales. Yet perfect classification is not expected. Some gibberish responses may bear a closer resemblance to valid survey responses, potentially resulting in misclassification (Type I error). However, this does not pose a practical concern for the current study because all gibberish data are ultimately discarded and are not intended for survey-data analysis. Conversely, certain responses on content scales may exhibit characteristics more akin to gibberish responses, leading to their detection as such by the algorithm (Type II error). This misclassification is informative because it indicates that these response patterns deviate significantly from the majority of survey responses. This rationale aligns with the Mahalanobis-distance method for detecting careless responding, which identifies responses dissimilar to those of other participants. Furthermore, it shares similarities with other established methods for detecting careless responding, such as standard-deviation and long-string approaches, which rely on predefined patterns indicative of careless responding.
Consequently, respondents identified by the GibML as exhibiting gibberish-like response patterns are classified as engaging in careless responding given that their response structure more closely aligns with gibberish answers than with valid survey responses. By employing this method, we hypothesize that GibML will detect multiple types of careless responding with enhanced accuracy, including responses such as low standard deviation, extremely high standard deviation, and diagonal line. Diagonal-line responses, particularly, represent patterns driven by hand movement or mouse movement across the questions, whether using a touchscreen or a traditional input device, rather than by content. There are no specific methods capable of efficiently capturing such patterns, in contrast to the effectiveness of the long-string method in detecting straight-line patterns, for example. This limitation arises because diagonal-line responses tend to have relatively high standard deviation despite not exhibiting perfect randomness. By addressing these challenges, GibML offers a less feasible capability with many traditional methods, thereby improving the overall quality of survey-data analysis.
The Current Study
In this study, we conducted an empirical “tournament” comparing the effectiveness of six existing indirect methods. The tournament suggested inconsistencies among the methods. Therefore, we propose a new indirect method based on ML and unique “gibberish” data (GibML). To simulate people’s behavior when they respond carelessly, we asked respondents to answer 16 gibberish items interwoven with 16 meaningful items in the following order: four content, four gibberish, four content, four gibberish, eight content, and eight gibberish. Next, we used ML to learn the patterns of responding to gibberish items. We first trained the ML model using gibberish and meaningful scales to detect careless responses on the meaningful scales within the same study. More importantly, we show how to reuse the same gibberish data to train the ML to detect careless responses in archival data. Finally, we compared the effectiveness of our GibML method with the existing methods.
In this study, we focus solely on statistical methods. In addition, we excluded inverted items to simplify the research process and focus on straightforward cases before moving on to more complex formulations (Curran, 2016). As a result, we focus on six existing methods: the standard deviation of each respondent’s answers, long-string index, respondent’s internal reliability test, Mahalanobis distance, and two person-fit indices.
Given the widespread agreement that responses without concern for the content of question items exhibit some structure (Curran, 2016; DeSimone et al., 2018; Meade & Craig, 2012), we assumed that all types of respondents would generate patterns of responses, whether attempting to create randomness or not. Hence, we employed an ML method to classify the responses by patterns into two groups: those from the three meaningless scales and those from the three meaningful scales. We hypothesized that the GibML approach based on classifying response patterns of valid responses versus response patterns of respondents without regard to the item’s content could generalize and identify both groups of responses more accurately than other statistical methods because the patterns that the model can learn are more general and include the patterns identified by each of the individual statistical methods. A primary advantage of the GibML approach over existing methods is that there is no need to presuppose any specific pattern of careless respondents; instead, the method automatically infers patterns from the data:
Hypothesis 1: It is possible to distinguish between the content scales and the gibberish scales based on the (a) standard deviation of the responses, (b) the long-string index, (c) the Mahalanobis distance, (d) the internal reliability test of respondents, (e) person-fit lpmz, and Gpm.
Hypothesis 2: GibML distinguishes the gibberish scales from the content scales more accurately than other methods.
We assumed that some respondents respond to content scales carelessly. We claim that these responders can be detected with the GibML, which distinguishes careless responses from careful ones. If the GibML method is effective, it should converge to some degree with the other statistical methods. Therefore,
Hypothesis 3: Responders who were identified by the GibML method as careless, as found by classification of their content scales, will show in their responses to content scales (a) lower standard deviation, (b) longer long string, (c) lower personal reliability, (d) greater Mahalanobis distance, (e) lower person-fit lpmz, and greater person-fit Gpm index than respondents not identified as carless on content items. This would suggest that the classification demonstrates concurrent validity.
Overview of Studies and Methodology
Study 1 includes survey data comprising three content scales and three gibberish scales with a corresponding number of items. To distinguish between these content and gibberish scales, we explored the effectiveness of four indirect methods for detecting careless responding and our novel method based on ML and gibberish data (GibML). We used the gibberish data to train the ML model on what the patterns of respondents who did not read the questions looked like. We assumed that the data would be compatible with the data of careless respondents because the gibberish questions were unreadable, and therefore, the respondents answered them carelessly without reading the text or referring to the content. After that, we ran the prediction formula a second time on the data to find the respondents whose responses to the content questions in the survey matched the pattern of the gibberish questions, that is, they were careless respondents.
In the following study, we examined whether the GibML method can detect careless responses in archival survey data by pairing gibberish items from Study 1 with archival survey responses without requiring new gibberish data from the same participants. Avoiding the collection of new gibberish data could reduce costs, minimize respondent dissatisfaction, and improve the method’s practicality and applicability. In the study, we also explored the potential of GibML in more complex scenarios, such as scales with varying numbers of items, different respondent populations, and transitions across languages, Likert-scale ranges, and time frames.
In Study 2, we replicated Study 1 using archival data that include a gibberish scale and a content scale collected in a separate study. In addition to replicating the analyses from Study 1, for Study 2, we trained an ML model on a combined data set comprising archival content data collected on a 5-point Likert scale in English and transformed gibberish data from a 7-point Likert scale in Hebrew. Testing was conducted in two stages: first, on the combined data set to evaluate weaker cross-study generalizability and second, on the original data set to assess stronger cross-survey generalizability.
Study 1
Method
Sample
We recruited 649 respondents but excluded 24 whose data showed a correlation exceeding .8 or falling below −.8 between content and gibberish scales. 1 It could be that they were careless responders to the content items or used their content responses to the content items in answering the gibberish items because the content scales were interwoven with the gibberish scales. We removed rows with missing values, that is, respondents who dropped out at some stage of the survey, including a total of 11 rows from the content scales and 13 rows from the gibberish scales. In the final sample, N = 625, 68% of the respondents were men, and their reported age ranged from 18 to 99 years old, M = 36.1 years, SD = 15.7.
Procedure
An invitation to participate in the study was published in Hebrew online. 2 Participants clicked on the link and were transferred to a dedicated survey-site platform (https://www.polyeda.com/). The opening screen presented the survey topic (relationships between religious and nonreligious people) and a statement about the survey, including meaningless questions (gibberish). Participants were informed that if they encountered gibberish questions, they should select any answer they wished and proceed to the next screen. Every screen reiterated this instruction. The survey then proceeded with alternating sets of items: first, a scale of four items with meaningful content, followed by four items in gibberish text. This pattern continued with additional scales of four and eight items alternating between content and gibberish. The survey concluded with two more three-item content scales, which were not analyzed within this framework, and demographic questions. The final screen thanked the participants. For the complete questionnaire, see Appendix B in the Supplemental Material.
Measures
Content scales
The first and second scales comprised four items, Cronbach’s αs = .81 and .74, respectively. The third scale comprised eight items, Cronbach’s α = .94.
Gibberish scales
We obtained gibberish texts from the Lorem Ipsum website 3 but added special characters randomly (e.g., “$,” “%,” “#,” “^”) between letters to emphasize its gibberish nature. We adjusted each gibberish item’s length to the parallel content scale’s item length. In the last content scale, each item contained the same stem, changing only the last words. Therefore, in the parallel gibberish scale, for each item, we included the same gibberish stem and changed only the last gibberish words. The gibberish items were organized into two scales paralleling the content scales: two gibberish scales, each comprising four items, Cronbach’s αs = .98 and .97, respectively, and one eight-item scale, Cronbach’s α = .99. Examples of the English version of the gibberish items include “Tsakhmi lorem a%%ipsum dolor s$it amt, adifi#sing” (from the first scale) and “St&ibulom sol$si tidom baalik. S&^bagat bmr modoff” (from the third scale). Responding to all questions was mandatory such that respondents could not proceed to the next screen without completing the current one.
Data analysis
Before running the main analysis, we conducted a qualitative analysis of the gibberish data to help understand the findings of the quantitative results. Specifically, we coded the responses manually according to categories, such as all responses are identical or all items on one scale are identical, but items on all other scales vary (all patterns found are listed below at the beginning of the Results section).
The data set originally contained 32 columns comprising two types of scales: 16 columns with gibberish questions and 16 columns with content questions. We transformed the data into long format by stacking the 32 columns into 16 columns representing the questions and adding a 17th column to indicate whether each row originated from the gibberish or content scale. The analysis included six steps. First, we calculated six indexes of careless responses for each row: long string, standard deviation, the correlation between two half scales, Mahalanobis distance by the R package careless (Yentes & Wilhelm, 2021), and two person-fit indices by the R package PerFit (Tendeiro et al., 2016). Second, we ran paired-samples t tests comparing these careless-responses-index scores among the content items with the gibberish items. Before conducting these t tests, we removed two respondents who did not have both content and gibberish responses to ensure the analysis included only complete data from all participants.
Third, we evaluated the other methods by splitting the data set into two halves, repeating this process across 100 iterations. In each iteration, one half of the data set served as training data to determine cutoff points, and the other half was used as test data to evaluate the associated error rates. Because there are no universally accepted or definitive cutoff points for the methods examined, we established preliminary cutoff points for each method that balanced Type I and Type II error rates as closely as possible. This approach ensured a fair and consistent basis for comparing the methods. By maintaining similar proportions of Type I and Type II errors for each method, we aimed to enable a meaningful and balanced evaluation of their performance in detecting careless respondents. In addition to numerical comparisons based on the selected cutoff points, we also performed a visual analysis of all possible cutoff points for each method.
Fourth, we computed an SVM model (Chang & Lin, 2011) using the R package e1071 (Dimitriadou et al., 2008) on one half of the randomly divided data set and applied the trained model to the other half to obtain predictions. This procedure was performed across 100 iterations to assess the efficacy in identifying the type of respondents (binary classification of careless yes/no) based solely on their response patterns, independent of item content. Fifth, we reapplied the SVM model training to the complete data set, including all the responses, and ran the prediction once again on the complete data set. This second process is the practical application of GibML, and it was conducted to detect anomalous respondents within the responses provided on the content and gibberish scales. Finally, we used the GibML method to classify respondents into normal and anomalous groups in their content scales and used a t test to examine the difference in the careless-response score obtained with all quantitative methods (standard deviation, long string, personal reliability, Mahalanobis distance, and two indices of person-fit).
Results
Qualitative analysis
We identified seven distinct categories of gibberish responses: (a) a single, uniform answer across all scales; (b) two consecutive scales with a uniform answer while providing a different uniform answer for the first or last scale; (c) a uniform answer different from the one preceding it, including identical answers on the first and third scales but different answers on the middle scale; (d) uniform scales with at least one scale with sequential pattern (e.g., 1, 2, 3, 4; 1, 3, 5, 7; or 1, 3, 5, 7, 5, 3, 1); (e) uniform scales with at least one scale with different template (e.g., 1, 2, 4, 3, 7, 7); (f) various formats; and (g) rising or declining patterns throughout the survey (e.g., 1, 3, 5 or 4, 2, 4, 2). For the frequency of each of these categories in the gibberish data, see Figure 1.

Categories, prevalence, and examples of response patterns.
Quantitative analysis
To evaluate Hypothesis 1, we compared the means of gibberish and content scales across various classification metrics. Table 1 presents the results of the paired-samples t test, indicating significant differences for all examined metrics. Consistent with Hypothesis 1, all measures were significantly different between the gibberish and content scales.
Comparison of Classification Metrics Between Gibberish and Content Responses Using Paired-Samples t Test
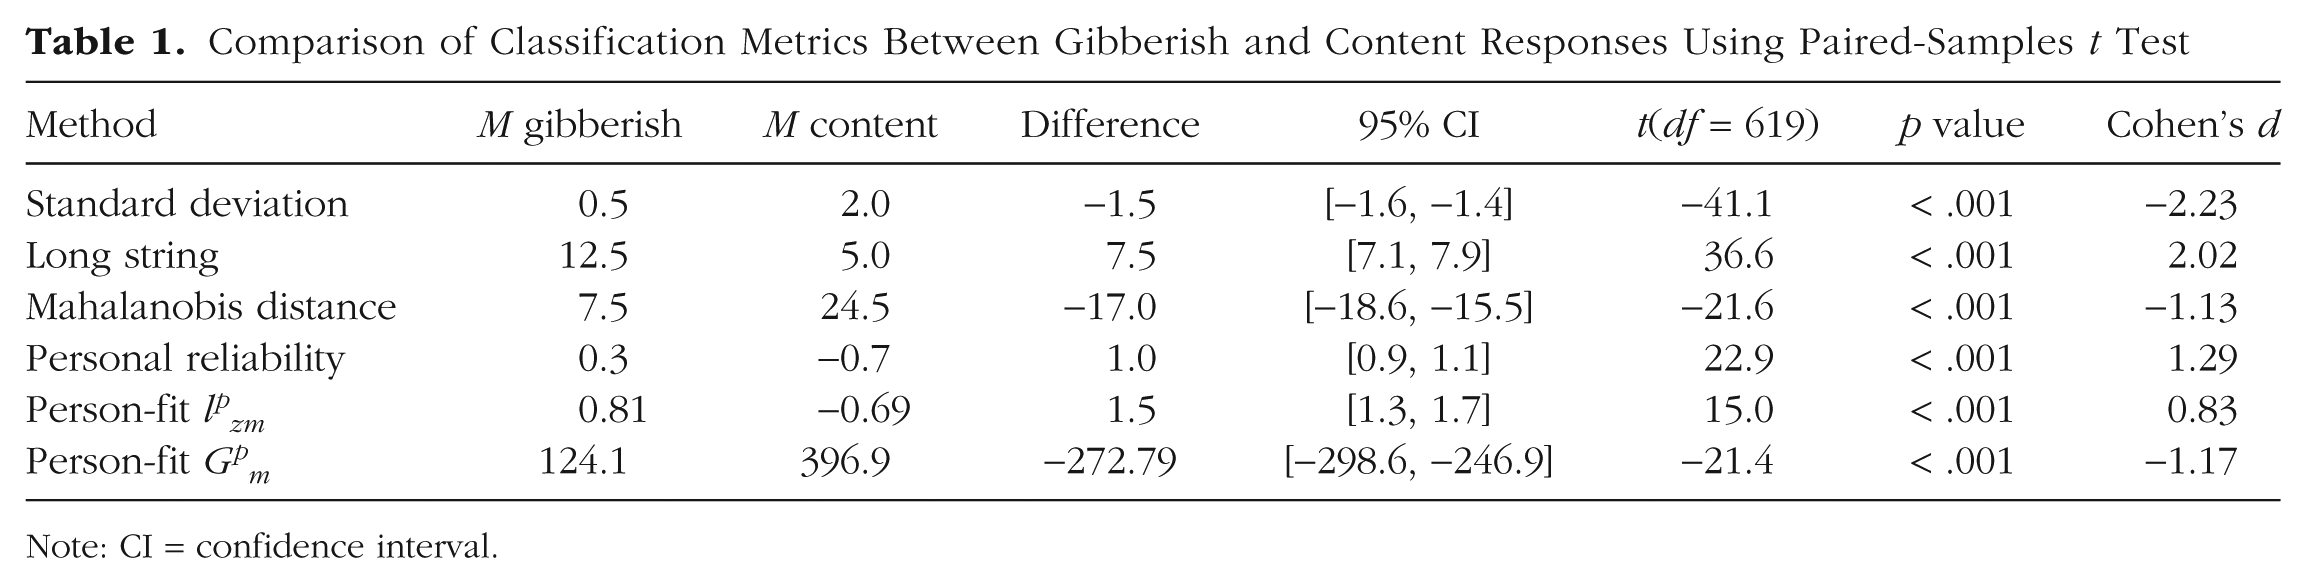
Note: CI = confidence interval.
To assess the classification accuracy of these metrics, we determined cutoff values that balanced Type I and Type II errors. Table 2 summarizes these thresholds, Figure 2 summarizes the sizes of the errors, and Figures C1 to C6 in Appendix C in the Supplemental Material present random sample responses to questions based on the indices’ classification.
Comparison of Statistical Methods for Identifying Careless Respondents

Note: Shown are the averages of the comparative indices with standard deviations in parentheses: cutoff point at which the gap between the Type I and the Type II error is the smallest, two types of errors, PPV, NPV, accuracy, and AUC. PPV = positive predictive value; NPV = negative predictive value; AUC = area under the curve; GibML = gibberish machine learning.

Type I error rate (x-axis) by Type II error rate (y-axis) by seven classification methods. The diagonal represents equal Type I and Type II error rates. The dot represents the cutoff points used in the classification analyses. The curved lines present alternative cutoff points.
Traditional methods
The standard-deviation cutoff, SD = 1.5, resulted in Type I error = 14% and Type II error = 13%, indicating a relatively balanced classification. The long-string-index cutoff, long string = 7.0, produced Type I error = 25% and Type II error = 14%, with slightly higher misclassification of content responses.
The Mahalanobis-distance cutoff, Mahalanobis distance = 10.4, led to high error rates, Type I and Type II = 83%, suggesting poor classification performance. Likewise, the personal-reliability cutoff, personal reliability = −0.89, resulted in Type I = 68% and Type II = 67%, indicating substantial misclassification.
For person-fit indices, the lpzm cutoff, lpzm = 0.01, resulted in Type I = 70% and Type II = 69%, and the Gpm cutoff, Gpm = 200.1, produced Type I and Type II = 80%, further highlighting ineffectiveness in classification.
Because every respondent was required to answer both types of scales—gibberish and content—the proportion of gibberish responses in this study may be artificially inflated compared with the typical proportion of careless survey responses. This could potentially distort the results of methods that analyze deviations of careless responses from the overall data set, such as Mahalanobis distance or IRT-based person-fit indices. However, no method can be justified solely on this argument given that Brühlmann et al. (2020) and Curran et al. (2010), for example, reported careless response rates of approximately 50%. A method that assumes a limited proportion of careless respondents might fail in scenarios in which the proportion is substantially higher. However, to address this concern, we conducted 100 additional iterations of training and test samples in which 90% of the gibberish responses were randomly removed in each iteration. Thus, the proportion of gibberish responses was reduced to 9% of the total survey responses. This adjustment resulted in too small an improvement in identifying careless respondents using Mahalanobis distance or person-fit indices compared with the previous results, which does not change the conclusions (see Table C7 in Appendix C in the Supplemental Material).
GibML
We selected half of our sample to serve as training data. We trained the SVM on the 16 gibberish and 16 content items, predicting the criterion of gibberish (yes/no). Then, we used the SVM prediction formula on the holdout sample. We return this process across 100 iterations. Consistent with Hypothesis 2, the classification resulted in 6% error for Type I and 7% for Type II error. For random sample responses to questions based on the GibML classification, see Figure C7 in Appendix C in the Supplemental Material. For benchmarks for all seven methods, see Table 2. For a summary of the classification methods’ Type I and Type II error sizes, see Figure 2.
Finally, we ran SVM on the complete data set to train it to detect gibberish scales and content scales, and then we ran the prediction formula a second time on the same complete data set to detect respondents in each scale whose response patterns more closely aligned with the other scale. It resulted in a Type I error of 3% and a Type II error of 5%. We checked whether the classification of the unusual respondents, who were classified in their responses to the scales with content as gibberish (Type II error), could be an indication that they are careless answers, that is, answers similar in pattern to responses to careless responding. Specifically, we tested concurrent validity. We ran t tests that examined the differences in the careless-responding indicators between the 5% classified as gibberish from the content scales compared with the 95% classified correctly. The results support Hypothesis 3: The average standard deviation of the content responses classified as gibberish, M = 0.51, is smaller than the standard deviation of the content responses classified correctly, M = 2.07, difference = −1.56, 95% confidence interval [CI] = [−1.66, −1.46], t(506.9) = −30.96, p < .001, Cohen’s d = −2.49. The average long string of the content responses classified as gibberish, M = 12.70, is greater than the long string of the content responses classified correctly, M = 4.68, difference = 8.01, 95% CI = [7.46, 8.57], t(442.69) = 28.46, p < .001, Cohen’s d = 2.29. The methods that presented results contrary to their assumption, Mahalanobis distance, personal reliability of each respondent, and person-fit in both indices, were not examined.
For comparisons between respondents detected as content or gibberish in each method compared with the GibML method, see Tables C1 to C6 in Appendix C in the Supplemental Material. As shown, there is alignment between the different methods and GibML. As the cutoff point of the other methods increases or decreases accordingly, the agreement improves, but the number of errors of the other compared method also increases.
Discussion
We evaluated six existing methods for detecting careless responses alongside the new GibML method. Among the existing methods, personal reliability, Mahalanobis distance, and two person-fit indices failed to detect careless responses effectively (Fig. 2). This failure likely stems from the strong correlations among gibberish-item responses caused by prevalent long-string and low standard-deviation patterns. In contrast, methods relying on more minor standard deviations and longer strings were more effective. Although more minor standard deviations produced slightly fewer classification errors than long strings, the superiority of this method remains inconclusive because of the ambiguous nature of Type I errors. Although Type II error is trustworthy because we know that identifying gibberish items as content items is a true error, Type I error could reflect both a classification error in which a careful response to a content item was detected as gibberish and a classification success in which a careless response to a content item was detected.
The new method for detecting careless responses by GibML was the most effective classifier between the gibberish scales and the content scales, with a Type I error of 5.0% and a Type II error of 3.4%. The other methods did not come close to these accuracy rates at any of their cutoff points. Moreover, the alignment of this method with existing methods validates the findings and supports our rationale that gibberish scales effectively simulate careless responding. These findings support our hypothesis that GibML is adept at detecting careless respondents in surveys.
Despite its accuracy, GibML’s practicality may be limited if gibberish data must be collected for every survey. Such repeated data collection could increase costs, burden respondents, and provoke negative reactions, particularly when combined with attention-checking questions or irrelevant statements (Ward & Meade, 2023). To address this limitation, in Study 2, we explored whether gibberish data from Study 1 could detect careless responses in archival data. This included testing data from a survey conducted years earlier, in a different language, with a distinct sample, context, and Likert-scale range. Whereas Study 1 was conducted in Hebrew with right-to-left scales, the archival data came from an English survey with left-to-right scales. By combining gibberish data from Study 1 with content data from the archival survey, we investigated whether GibML could effectively detect careless respondents under these differing conditions.
Study 2
In Study 2, we investigated the hypotheses tested in Study 1 in a different context. In addition, we compared the classification accuracy of GibML, in which gibberish data are collected during the survey, with the case in which gibberish data are collected in a survey different from the content scale (archival data):
Hypothesis 4: The effectiveness of GibML (as stated in Hypothesis 2) generalizes across data sets. Specifically, GibML trained on the gibberish scale from Study 1 is expected to yield lower classification errors than alternative methods in archival data.
This hypothesis has two forms:
Weak hypothesis: GibML will produce fewer Type I and Type II classification errors when trained on half of a combined data set, which includes the gibberish scale from Study 1 and the archival content scale from Study 2, and tested on the remaining half of this combined data set.
Strong hypothesis: GibML will produce fewer Type I and Type II classification errors when trained on the same combined data set as in the weak hypothesis but tested on the full archival data set, which consists exclusively of the archival gibberish and content scales from Study 2.
At both levels, classification results are expected to be consistent across responses between data from Study 1 and archival data. Figure 3 illustrates the distinction between these two forms of the hypothesis.
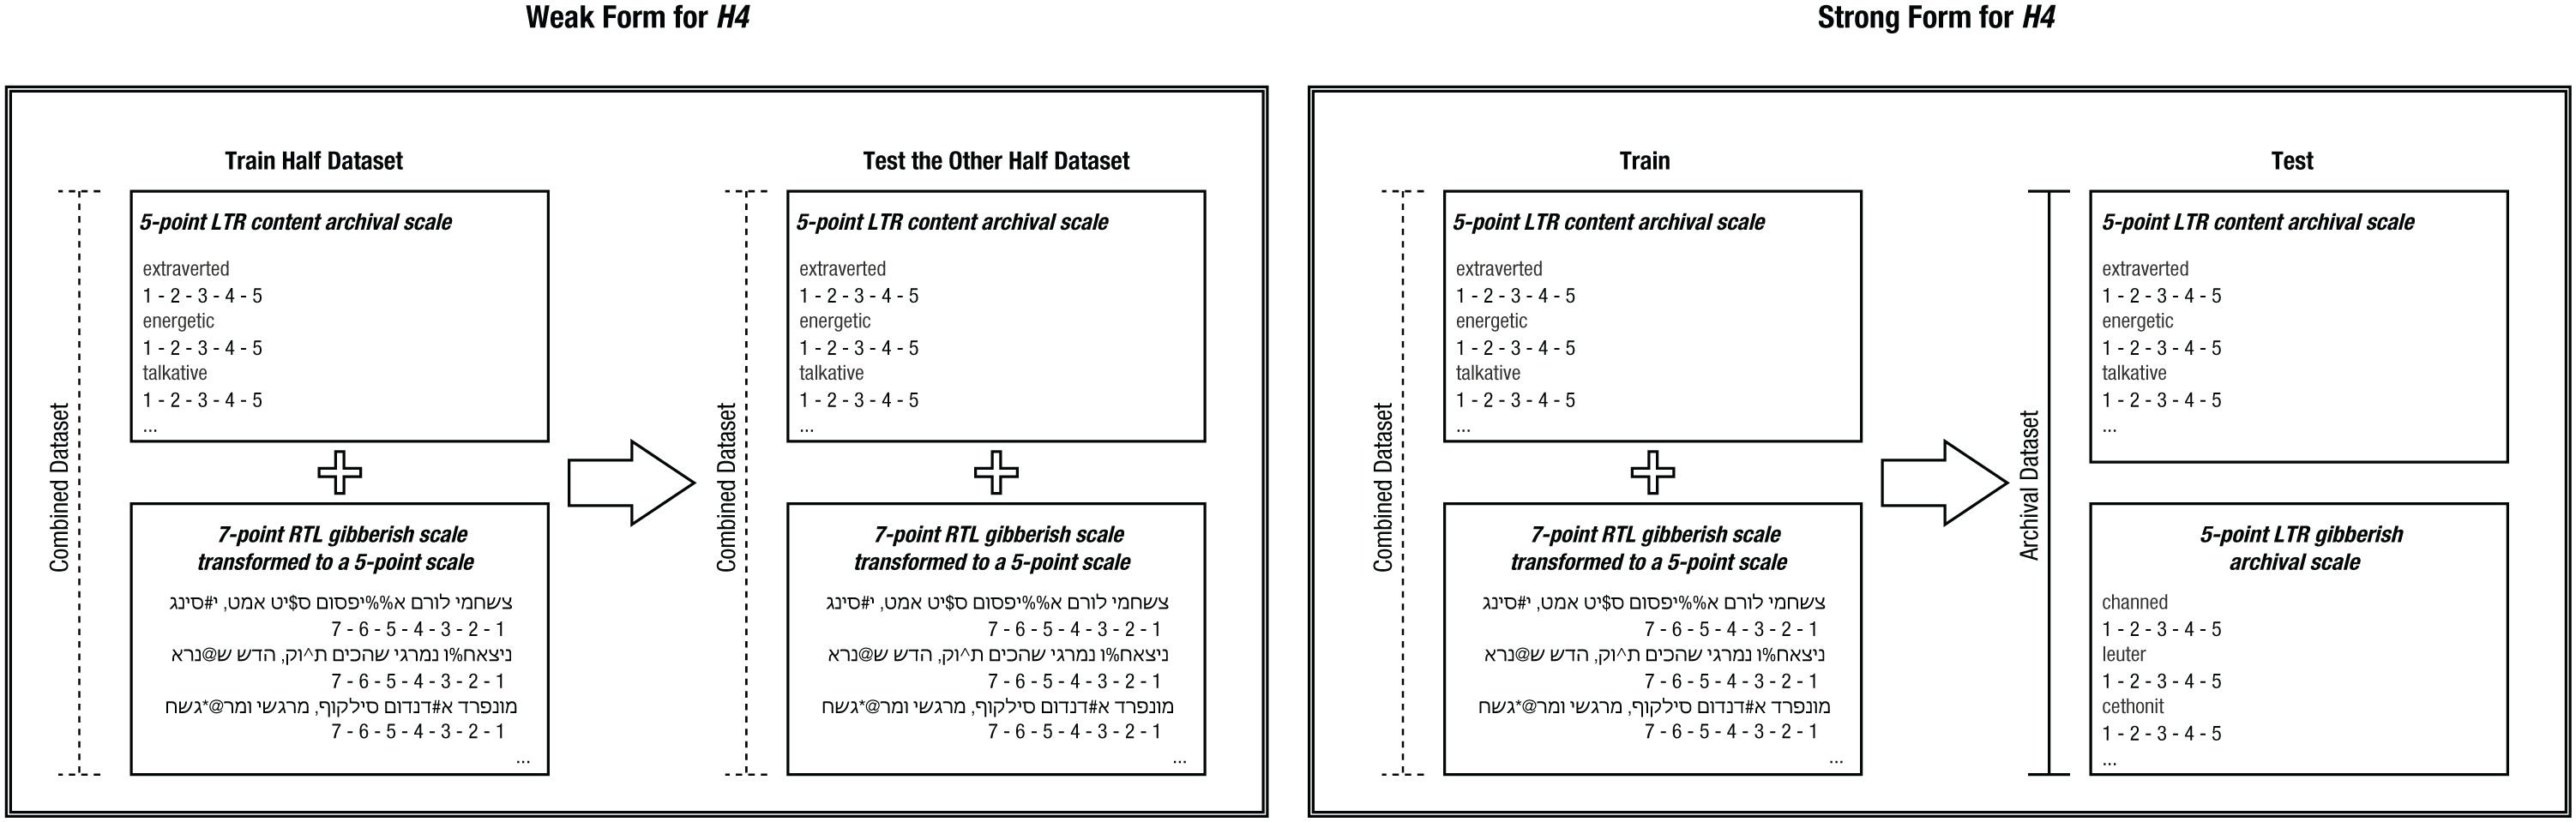
Two configurations of training and testing sets for evaluating Hypothesis 4 (H4) in its weak and strong forms. The plus sign represents the combination of two scales from different data sets to create a unified training or testing set. The arrow represents the application of the gibberish-machine-learning model from the training set to the testing set for identifying careless respondents in the test data. LTR = left to right, that is, text in English, read from left to right; RTL = right to left, that is, text in Hebrew, read from right to left.
Method
Maul (2017) conducted a survey incorporating both gibberish and content items, a methodology later replicated by Arias, Ponce, et al. (2020). Across three studies, Arias, Ponce, et al. implemented variations of the questionnaire design, and their Study 2 closely resembles the structure of our Study 1. The data set from Arias, Ponce, et al. is publicly available (see Arias, Ponce, et al., 2020). This information became available to us after writing the initial manuscript, following recommendations from reviewers. Consequently, we leveraged this opportunity to replicate Study 1 using an external data set collected under entirely different conditions. The differences between the two data sets are detailed in Table 3. This replication was preregistered (Bloy et al., 2024).
Comparison of Data Sets Used in Study 2 and Study 1

Arias, Ponce, et al. (2020) reported a sample of 548 participants (51% male), ages 18 to 77 years (M = 33.5 years, Mdn = 31, SD = 11.9), recruited via Prolific Academic. The survey contained seven content items and seven gibberish items.
The content scale consisted of seven adjectives (i.e., “extraverted,” “energetic,” “talkative,” “bold,” “active,” “assertive,” and “adventurous”). The gibberish scale was composed of seven fake “adjectives” (i.e., “channed,” “leuter,” “cethonit,” “establechre,” “mystem,” “wirington,” and “ormourse”), which were randomly generated using a web application. Responses were provided on a 5-point accuracy scale (1 = very inaccurate, 5 = very accurate).
Data analysis
In this analysis, we replicated the methodology from Study 1, adhering to its primary steps. To examine Hypothesis 4, we preprocessed the data set to conform to the shape of the 7-point gibberish-scale data from Study 1 and selected the first seven items from the questionnaire. Because the scale ranges in the current study differ from those in Study 1, we applied a transformation to all responses. 4 To minimize the influence of response styles, such as extreme- or central-tendency bias, we collapsed the original 7-point scale into a 5-point scale that preserved both central and extreme positions. Responses of 7 were recoded as 5, and midpoint responses of 4 were recoded as 3. Responses of 2 and 3 (moderate disagreement) were recoded as 2, and responses of 5 and 6 (moderate agreement) were recoded as 4. As a result, the new scale ranged from 1 to 5 such that extreme and midpoint responses were preserved and moderate responses were clustered. Finally, we combined the Hebrew gibberish scale from Study 1 with the English content scale from the current study.
To examine the weak hypothesis of Hypothesis 4, we replicated the analyses from the traditional metrics for detecting careless respondents and the application of GibML. This process involved integrating gibberish scales collected in Study 1 with the archival data set from Study 2. To examine the strong hypothesis of Hypothesis 4, we trained the SVM model on a combined data set that included gibberish data from Study 1 and content data from the archival data set. However, we applied the trained model to the original archival data set, in which both the gibberish and content scales were in their original format (Fig. 3).
Results
Qualitative analysis
Responses to the gibberish scales were categorized into distinct categories. We identified five distinct categories: (a) a single, uniform, midpoint answer across all survey items (3 for every item); (b) a single, uniform, extreme answer across all survey items (1 for every item; there were no responses with 5 across all the items); (c) a uniform answer across half the survey items or more; (d) only two numbers used (e.g., 1, 2, 2, 1 or 1, 5, 1, 5); and (e) various formats.
Figure 4 shows the prevalence of each of the five categories. It shows that the uniform midpoint response throughout the survey is the most popular among the characterized responses, yet other categories include uniform answers in different ways. Because data include only one scale, there are no characteristics of changing or fitting to scales.

Categories, prevalence, and examples of response patterns.
Quantitative analysis
To evaluate Hypothesis 1, we compared the means of gibberish and content scales across various classification metrics. Table 4 presents the results of the paired-samples t test, indicating significant differences for all examined metrics. Consistent with Hypothesis 1, all measures were significantly different between the gibberish and content scales.
Comparison of Classification Metrics Between Gibberish and Content Responses Using Paired-Samples t Test
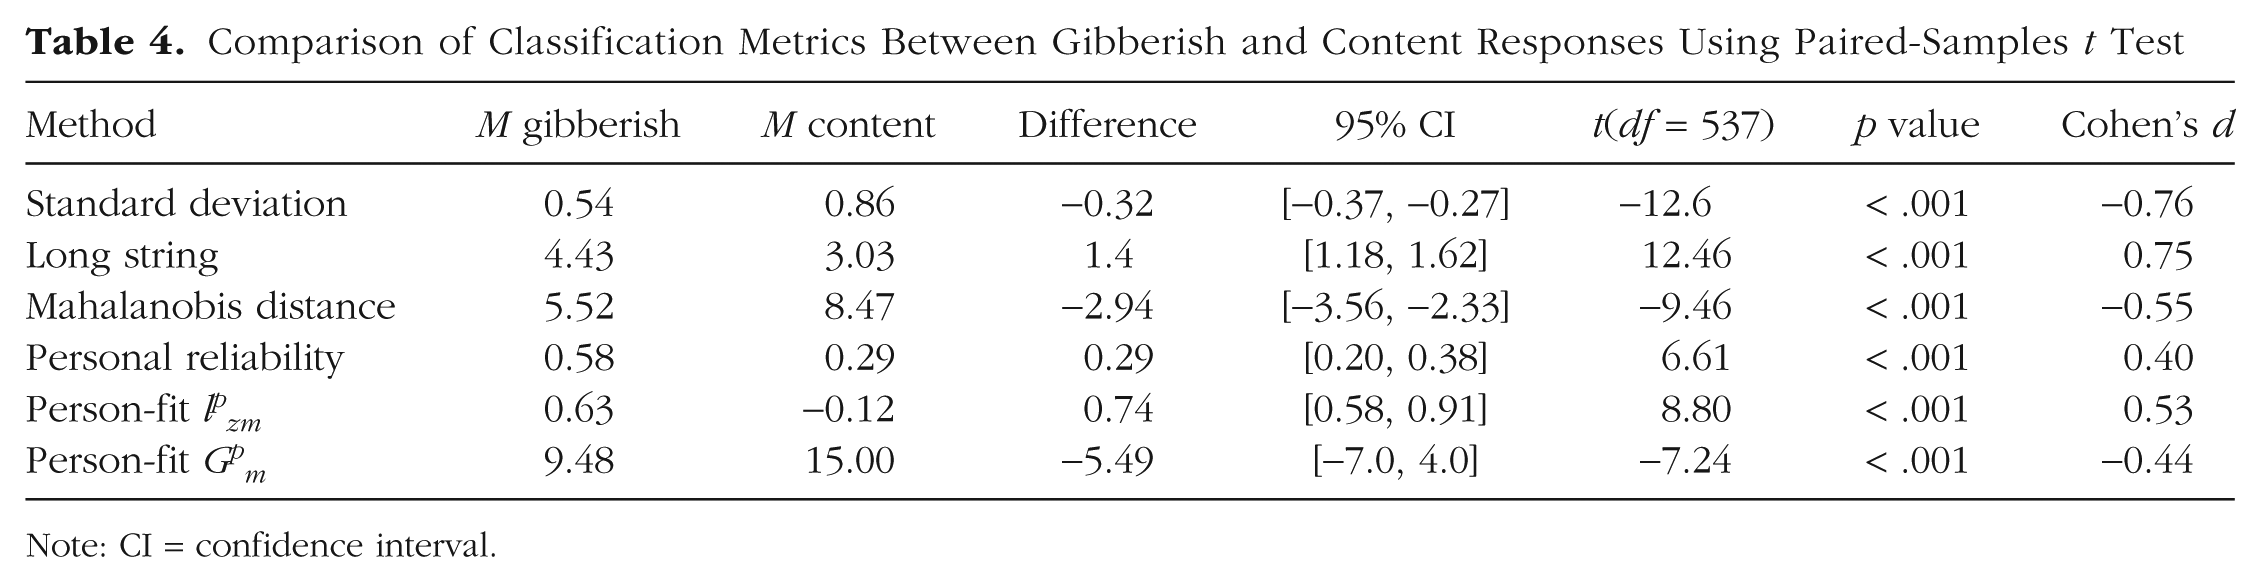
Note: CI = confidence interval.
To assess the classification accuracy of these metrics, we determined cutoff values that balanced Type I and Type II errors. Table 5 summarizes these thresholds, Figure 5 summarizes the sizes of the errors, and Figures D1 to D6 in Appendix D in the Supplemental Material present random sample responses to questions based on the indices’ classification.
Comparison of Indirect Methods for Identifying Careless Respondents

Note: Shown are averages of the comparative indices with standard deviations in parentheses: cutoff point at which the gap between the Type I and the Type II error is the smallest, two types of errors, PPV, NPV, accuracy, and AUC. PPV = positive predictive value; NPV = negative predictive value; AUC = area under the curve; GibML = gibberish machine learning.

Type I error rate (x-axis) by Type II error rate (y-axis) by seven classification methods. The diagonal represents equal Type I and Type II error rates. The dot represents the cutoff points used in the classification analyses. The curved lines present alternative cutoff points.
Traditional methods
The standard deviation cutoff, SD = 0.78, resulted in Type I error = 38% and Type II error = 36%, indicating a relatively balanced classification. The long-string-index cutoff, long string = 2.90, produced Type I error = 32% and Type II error = 43%, with slightly higher misclassification of content responses.
The Mahalanobis-distance cutoff, Mahalanobis distance = 6.2, led to high error rates, Type I and Type 2 = 62%, suggesting poor classification performance. Likewise, the personal-reliability cutoff, personal reliability = 1.0, resulted in Type I = 59% and Type II = 62%, indicating substantial misclassification.
For person-fit indices, the lpzm cutoff, lpzm = 0.57, resulted in Type I = 63% and Type II = 61%, whereas the Gpm cutoff, Gpm = 8.5, produced Type I and Type II = 60%, further highlighting ineffectiveness in classification.
GibML
We trained GibML using half the data set, applying the SVM to predict gibberish versus content responses, across 100 iterations. Consistent with Hypothesis 2, the model achieved Type I error of 17% and Type II error of 18%. For random sample classifications, see Figure D7 in Appendix D in the Supplemental Material. For benchmarks for all seven methods, see Table 5. For a summary of the classification methods’ Type I and Type II error sizes, see Figure 5.
To examine whether reducing the proportion of gibberish responses improves detection using survey-response-based indices, we repeated the analysis in this study as well, randomly removing 90% of the gibberish responses across 100 iterations. The detection performance of the indices improved, particularly for the person-fit index lpzm (see Table D1 in Appendix D in the Supplemental Material). However, the success rates of GibML remained significantly higher.
Running the GibML on the full data set as training and test-set data simultaneously reduced Type I and Type II errors to 13% and 15%, respectively. We examined whether Type II errors (content scales misclassified as gibberish) indicated careless responding. Specifically, we tested concurrent validity. We ran t tests that examined the differences in the careless-responding indicators between the 15% classified as gibberish from the content scales compared with the 85% classified correctly. The results support Hypothesis 3: The average standard deviation of the content responses classified as gibberish, M = 0.68, is smaller than the standard deviation of the content responses classified correctly, M = 0.89, difference = −0.21, 95% CI = [−0.30, −0.12], t(111.6) = −4.66, p < .001, Cohen’s d = −0.56. The average long string of the content responses classified as gibberish, M = 3.46, is greater than the long string of the content responses classified correctly, M = 2.96, difference = 0.50, 95% CI = [0.07, 0.94], t(98.82) = 2.32, p = .022, Cohen’s d = 0.32. All other methods—Mahalanobis distance, personal reliability of each respondent, and person fit in both indices—presented results contrary to their assumptions and thus were not examined.
To examine the weak hypothesis of Hypothesis 4, we replicated the analytical process from the third step, which involved computing classification metrics—standard deviation, long-string index, personal reliability, Mahalanobis distance, and two person-fit indices—on the combined data set. As in previous steps, the cutoff point was determined using half of the data set across 100 iterations, and the Type I and Type II error rates were then assessed using the remaining half of the data set. In this case, the data set consisted of a 7-point gibberish scale from Study 1, transformed into a 5-point scale, and a 5-point content scale from Arias, Ponce, et al. (2020). The standard deviation of 0.58 minimized error differences, with Type I at 26% and Type II at 21%. The long-string index at 3.47 minimized error differences, with Type I at 24% and Type II at 21%. Mahalanobis distance at 4.6 resulted in high errors of 76% for Type I error and 77% for Type II error, but as in previous analyses, it failed to classify scales effectively. Personal reliability at 1.0 and person-fit indices, lpzm = 0.51, Gpm = 5.2, also showed high error rates, exceeding 50%, and lacked scale differentiation. GibML trained and tested across 100 iterations achieved lower errors, 13% for Type I and 12% for Type II errors, supporting weak Hypothesis 4. Finally, training and testing GibML on the complete data set reduced errors further to 11% for Type I and 12% for Type II errors. For summaries of the results, see Table 6 and Figure 6.
Comparison of Indirect Methods for Identifying Careless Respondents in Data With a 7-Point Gibberish Scale in Hebrew and a 5-Point Content Scale in English
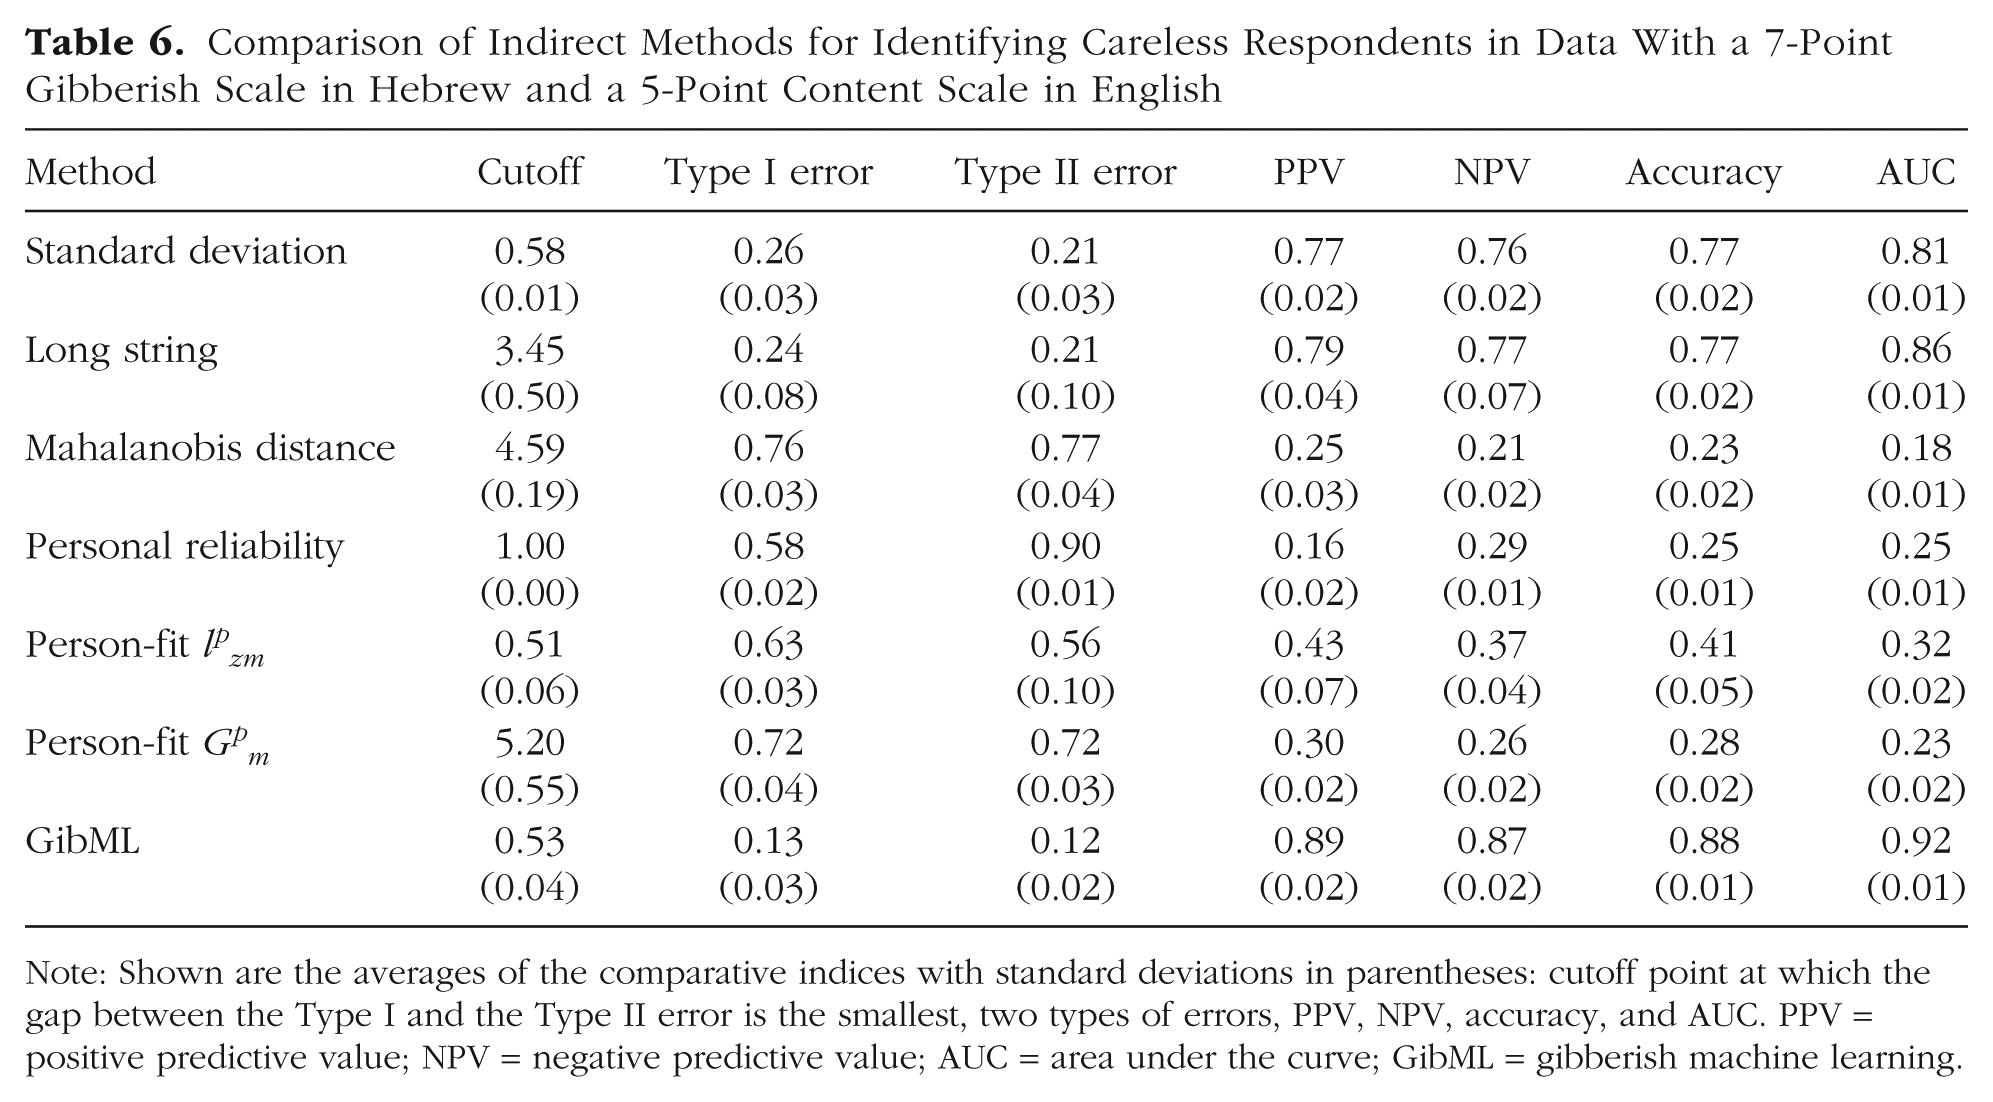
Note: Shown are the averages of the comparative indices with standard deviations in parentheses: cutoff point at which the gap between the Type I and the Type II error is the smallest, two types of errors, PPV, NPV, accuracy, and AUC. PPV = positive predictive value; NPV = negative predictive value; AUC = area under the curve; GibML = gibberish machine learning.

Type I error rate (x-axis) by Type II error rate (y-axis) and seven classification methods. The diagonal represents equal Type I and Type II error rates. The dot represents the cutoff points used in the classification analyses. The curved lines present alternative cutoff points.
To examine the strong hypothesis of Hypothesis 4, we trained the SVM model on the combined data set with the 7-point Hebrew gibberish-scale data and the 5-point English-content scale, but we applied it as a test data to the original data set, with the 5-point gibberish and content scales in English. Consistent with strong Hypothesis 4, the classification resulted in a 35% error for Type II but only 10% for Type I errors.
Finally, consistent with both the weak and strong forms of Hypothesis 4, we compared the classification of content responses in the archival data set between two versions of GibML: (a) the model trained using the archival 5-point gibberish scale in English (Hypothesis 2), which had the most reliable classification because of its low Type I and Type II error rates, and (b) the model trained using the 7-point gibberish scale in Hebrew from Study 1, in which GibML was trained on a combination of Study 1 and archival data (Hypothesis 4, both weak and strong). This comparison revealed that 81% of content responses were classified as content by both models, 6% were classified as gibberish by both models, 4% were classified as gibberish only by the GibML-trained model on the 7-point Hebrew scale (Hypothesis 4), and 9% were classified as gibberish only by the GibML-trained model on the 5-point English scale (Hypothesis 2). These results were statistically significant, χ2(1) = 95.59, p < .001.
Although the χ2 test indicated agreement between the classifications by GibML using the 7-point scale in Hebrew from Study 1 and the archival 5-point scale in English, this agreement was primarily observed in content classification and less in identifying respondents as gibberish (only 6% agreement, compared with 4% and 9% classified as gibberish by only one of the methods). This finding is consistent with the Type II error of 35%.
Discussion
In Study 2, we replicated Study 1, yielding similar findings. Consistent with Study 1, personal reliability, Mahalanobis distance, and two person-fit indices failed to effectively identify careless responses, whereas smaller standard deviations and longer strings successfully detected careless respondents (see Fig. 6). These results align with the findings of Arias, Ponce, et al. (2020), who reported high consistency in gibberish responses. However, gibberish responses in Study 1 appear to demonstrate even greater consistency than those observed in Arias, Ponce, et al. The detection rates for standard-deviation and long-string methods in Study 2 were nearly identical. Although the standard-deviation method showed a slight advantage, its superiority remains uncertain because misclassifications on content scales could indicate either accurate detection of careless respondents or classification errors.
The GibML method once again demonstrated the best classification performance, achieving a Type I error rate of 11% and a Type II error rate of 12%. These results significantly outperformed those of the existing methods, none of which approached GibML’s accuracy at any cutoff point. Moreover, the alignment between GibML and existing methods further validated the findings and reinforced the rationale that gibberish scales effectively simulate careless responding. These results strengthen our hypothesis that GibML is a reliable tool for detecting careless respondents in surveys.
GibML also exhibited high recognition rates when pairing new data (5-point English content scales) with 7-point Hebrew gibberish data. However, when we assessed the generalizability of gibberish data from Study 1 to detect careless responses in the content scales of Study 2, sensitivity was lower. GibML identified only about two-thirds of the gibberish responses, with limited classification of responses as careless on the 5-point English scales. This reduced sensitivity may stem from the smaller variety of gibberish patterns in Study 1 compared with the greater diversity observed in Study 2, as indicated by qualitative analyses. Alternatively, the substantial differences between the two surveys—such as language, scale type, and response patterns—may have contributed to this outcome. Further research is necessary to evaluate the feasibility of using gibberish data across surveys with such pronounced differences.
General Discussion
GibML relies on a supervised-ML algorithm trained on responses to gibberish items, which serve as a proxy for careless responding. This approach offers an alternative to other ML strategies that rely on labeling based on traditional direct or indirect indicators of careless responding or on experimental manipulations instructing participants to answer carelessly. Although there is empirical support for the utility of various methods in identifying careless respondents, such labeling procedures inevitably involve a degree of unknown classification error. In the case of instructed carelessness, it remains unclear whether participants truly follow the instructions and to what extent instructed behavior accurately reflects spontaneous careless responding. In this context, gibberish items may offer a complementary path because they inherently preclude meaningful engagement and thus elicit response behavior that closely aligns with theoretical definitions of carelessness—that is, answering without reading the items and without considering the responses (Curran, 2016), a pattern that naturally emerges when respondents are faced with unreadable prompts. A qualitative review of these responses reveals familiar patterns, including long-string sequences, reduced variability, and repetitive or extreme use of scale anchors (Arias, Ponce, et al., 2020; Meade & Craig, 2012).
Overall, our work suggests that GibML is at least as good as existing methods designed to detect careless responses in survey data. Moreover, we found that four careless-response-detection methods were unreliable in both data sets: personal reliability, Mahalanobis distance, and two person-fit indices. This finding aligns with previous research showing that careless responses are often more consistent than attentive ones (Stosic et al., 2024). We also found that a low standard deviation may be a better indicator of careless responses than a long string. Finally, our proposed GibML method suggests that it is possible to ask people to take gibberish surveys and train an algorithm to recognize such patterns in content scales.
Quantitatively, GibML reduces Type I and Type II errors. Qualitatively, it provides more comprehensive classification by recognizing diverse response patterns, whereas other methods are limited to identifying specific patterns. In Study 1, GibML accurately classified experimental and content scales using a predictive formula derived from the training data set. Reapplying this formula to the entire data set identified careless responses with lower standard deviations and longer long-string values. In Study 2, we replicated these findings with data collected for an entirely different purpose, confirming GibML’s robustness. Moreover, Gibberish data collected in one sample proved effective in identifying careless responses in archival data, indicating the potential for generalizability. In testing GibML on unmatched data, we found that the model successfully identified approximately two-thirds of gibberish responses. This detection rate may improve further if the gibberish training data are better matched to the target data set, that is, if both use similar response scales and are derived from similar populations. Nonetheless, additional research is needed to validate this hypothesis. Across all analyses, GibML’s scores were not lower than those obtained from the comparison methods, the standard deviation, and the long-string index and were even higher.
Limitations of the study
Our study uses survey questionnaires with 16 or seven items for each scale type. The use of longer surveys might help detect more careless respondents because there is a tendency for respondents to answer carelessly as the survey length increases. However, it is also possible that the greater accuracy of this method, compared with previously used approaches, contributed to the relatively low rate of careless respondents. In addition, in the current study, we focused exclusively on the evaluation of statistical methods. Future research should examine whether the advantage of GibML persists compared with other types of methods, including direct-detection approaches, other ML-based methods, and newly emerging techniques, such as Biemann et al. (2025), which was published during the final stages of this article’s preparation. In addition, it would be important to assess GibML’s performance not only against the methods examined here but also in contexts that include both positively and negatively worded items.
Our surveys focused on measuring attitudes, which may differ in their elicitation of response patterns compared with other survey types, such as feedback surveys, organizational assessments, or purpose-driven questionnaires (Kluger & Colella, 1993; Kluger et al., 1991). In addition, other survey contexts, such as paper-based surveys, and other types of samples, such as clinically diverse populations, were not examined in the current study. Extending this research to additional survey settings and sample types will require further data sets and exploration of varied response patterns. At present, the extent to which this method generalizes to other assessment contexts (e.g., low-stakes educational testing) and settings (e.g., longer surveys) remains open. Confirming the universal utility of GibML will be an important goal for future research.
Study 2 involved a replication of Study 1 under highly complex conditions. Testing the hypothesis that data from one survey could be used to train GibML for another survey in its stronger form revealed lower sensitivity and difficulty in identifying about a third of the gibberish responses. The numerous differences between the two studies—such as variations in samples, methodologies, and data patterns—make it unclear whether this outcome reflects a limitation of the method in terms of reduced sensitivity when applied to archival data or whether using more fitted and varied patterns might yield detection rates comparable with those observed in the within-subjects design. To determine the reasons for the lower sensitivity, these differences must be isolated and examined individually.
Although our analyses did not reveal significant differences between the distributions of content responses before and after the removal of respondents classified as careless, the potential risk of excluding valid but atypical responses remains a relevant consideration. Future applications of GibML should remain attentive to this possibility, particularly in studies in which maintaining full variability among respondents is critical. Moreover, distinguishing between lack of effort and other factors producing unusual response patterns (e.g., poor verbal comprehension or idiosyncratic item interpretation) remains an inherent challenge. To address this limitation, future research should incorporate experimental validation in which additional variables can be manipulated and measured to better differentiate true careless responding from other sources of response variability.
Conclusion and recommendations
We evaluated six existing methods for identifying careless survey responses and introduced a novel approach, GibML, which uses gibberish data to train ML algorithms. GibML consistently outperformed other methods, demonstrating superior classification ability across experimental and content scales. In Study 2, we extended these findings to archival data, further validating GibML’s effectiveness. However, we also identified limitations in its sensitivity when training data lacked sufficient diversity in response patterns.
Previous studies have demonstrated that ML, mainly supervised ML, has significant potential for detecting careless respondents (Alfons & Welz, 2024; Gogami et al., 2021; Ozaki, 2024; Schroeders et al., 2022). However, the challenge of a lack of reliable and high-quality labeled data for training potential algorithms remains an issue. Although this study represents a first attempt to classify careless respondents using ML and gibberish data, the results obtained are promising enough to recommend GibML as an effective method for identifying careless responses. However, it is essential to acknowledge that further research is required to validate and enhance these findings.
Despite the impressive success of GibML using SVM, it would be appropriate to examine and compare the effectiveness of using responses to gibberish items through other supervised-ML techniques as well. Further research comparing different methods may lead to recommendations regarding the most suitable approach for detecting careless respondents and could also provide additional insights into the use of responses to gibberish items as a proxy for careless responding.
It is evident that gibberish data collected in a within-subjects design alongside content questions better represent the careless response styles encountered in surveys, resulting in the most accurate identification among all the methods tested. The best recommendation we can provide to researchers aiming to detect careless respondents successfully is to include a gibberish scale in their surveys. Researchers may compare it with the final scale of the questionnaire to identify respondents who became fatigued toward the end (Bowling et al., 2021). However, they might prefer to compare it with the initial scale of the survey to offer higher sensitivity and detect respondents who began the survey carelessly. Because being asked to complete a clearly nonsensical scale may provoke irritation or reduce test-taking motivation, we recommend placing the gibberish scale at the end of the questionnaire. This conservative approach may minimize participant disengagement and also coincide with the point at which fatigue effects are more likely to emerge.
Finally, in these studies, we used different versions of the gibberish scale (see Table 3). We recommend that each survey use a gibberish scale whose items are as closely matched as possible to the substantive items they are intended to benchmark against. In particular, the Likert response options—including scale range and labels—should be equivalent. Furthermore, we believe that aligning additional characteristics of the gibberish and content items—such as item length, language, directionality, and formatting—can support more valid comparisons and enhance the sensitivity of the method for detecting careless respondents.
GibML’s performance depends heavily on the diversity of training data. Researchers and panel managers who frequently conduct surveys among similar samples could collect gibberish response data and apply GibML across multiple surveys. However, to further enhance the applicability of GibML, we propose creating a dedicated repository for gibberish response data. This recommendation aligns with Alfons and Welz’s (2024) call to establish a large collaborative database of careless responses tagged using various detection methods. Such a gibberish repository should include data from gibberish on various Likert scales, languages, respondent profiles, and panel conditions to support diverse research needs. Until such a database becomes available, we suggest using the gibberish data scale, scored from 1 to 7, accessible on OSF (Bloy et al., 2024; 2025) and the accompanying R code file or referring to Arias, Ponce, et al. (2020) for the scale scored from 1 to 5 they shared. As we continue to develop GibML, we will update the provided links with additional data and clarifications. Hopefully, our proposed approach will improve the validity of conclusions drawn from survey research.
Supplemental Material
sj-docx-1-amp-10.1177_25152459251378420 – Supplemental material for Identifying Careless Survey Respondents Through Machine Learning Using Responses to a Gibberish Scale
Supplemental material, sj-docx-1-amp-10.1177_25152459251378420 for Identifying Careless Survey Respondents Through Machine Learning Using Responses to a Gibberish Scale by Leah Bloy, Yehezkel Resheff, Avraham Kluger and Nechumi Malovicki-Yaffe in Advances in Methods and Practices in Psychological Science
Footnotes
Acknowledgements
Transparency
Action Editor: Yasemin Kisbu-Sakarya
Editor: David A. Sbarra
Author Contributions
Notes
References
Supplementary Material
Please find the following supplemental material available below.
For Open Access articles published under a Creative Commons License, all supplemental material carries the same license as the article it is associated with.
For non-Open Access articles published, all supplemental material carries a non-exclusive license, and permission requests for re-use of supplemental material or any part of supplemental material shall be sent directly to the copyright owner as specified in the copyright notice associated with the article.