
Abstract
Self-report data are vital in psychological research, but biases such as careless responding and socially desirable responding can compromise their validity. Although various methods are employed to mitigate these biases, they have limitations. The Bayesian truth serum (BTS) offers a survey scoring method to incentivize truthfulness by leveraging correlations between personal and collective opinions and rewarding “surprisingly common” responses. In this study, we evaluated the effectiveness of the BTS in mitigating socially desirable responding to sensitive questions and tested whether an interim payment could enhance its efficacy by increasing trust. In a between-subjects experimental survey, 877 participants were randomly assigned to one of three conditions: BTS, BTS with interim payment, and regular incentive (RI). Contrary to the hypotheses, participants in the BTS conditions displayed lower agreement with socially undesirable statements compared with the RI condition. The interim payment did not significantly enhance the BTS’s effectiveness. Instead, response patterns diverged from the mechanism’s intended effects, raising concerns about its robustness. As the second registered report to challenge its efficacy, this study’s results cast serious doubt on the BTS as a reliable tool for mitigating socially desirable responding and improving the validity of self-report data in psychological research.
Keywords
Self-report data are indispensable in psychological research, enabling the exploration of individual differences, attitudes, and behaviors (Baldwin, 2000). However, inherent biases such as careless responding and socially desirable responding (SDR) pose significant challenges to the validity of self-report measures (Arthur et al., 2021). Careless responding ranges from inattentiveness to distinct response styles, such as consistently selecting extreme options or agreeing with statements regardless of content (Nichols et al., 1989). SDR involves portraying positive self-descriptions aligned with social norms, influenced by intentional impression management and unconscious self-deception (Paulhus, 1984, 2002). These biases can introduce systematic errors, undermining the construct validity of self-report measures (Flake & Fried, 2020; Lilienfeld & Strother, 2020).
Researchers employ various post hoc methods to mitigate response-distortion effects, such as dropping respondents flagged as providing inaccurate answers (e.g., through attention checks) and applying statistical adjustments. However, each approach has its limitations (Arthur et al., 2021; Lee, 2023). Excluding flagged respondents may result in unrepresentative samples and relies on accurately identifying and quantifying the extent of biased responding. This issue extends to implementing statistical adjustments, which risks introducing unintended bias. Thus, it can be argued that rather than mitigating these limitations after collection, the challenge lies in proactively addressing the intrinsic biases that undermine the reliability of self-report data at the point of collection.
Bayesian Truth Serum
One mechanism that purports to do this is the Bayesian truth serum (BTS; Prelec, 2004). The BTS offers a quantitative method for encouraging truthful responses to subjective questions by scoring the truthfulness of responses and rewarding higher scores with a bonus payment. As the name implies, it draws on Bayesian principles, involving updating beliefs based on new evidence or information. The BTS also capitalizes on a well-established cognitive bias in which individuals tend to overestimate the prevalence of their own views in a population (Choi & Cha, 2019; Mullen et al., 1985; Ross et al., 1977). As a result, others in the population generally underestimate the actual frequency of one’s genuine views such that they are more common than collectively predicted or “surprisingly common” (for a hypothetical example, see Weaver & Prelec, 2013, pp. 290–291).
The BTS operates by informing participants that the survey uses an algorithm for truth-telling. They are told that the algorithm will assign scores based on the truthfulness of their answers and that the highest ranking scores will earn a bonus in addition to the base pay for participation. The specific calculation method is typically not explained. Participants complete the survey, providing personal answers and predicting others’ responses to each survey question. At the end of the study, participants receive their base payment, and participants with the highest overall scores receive a bonus.
The BTS functions at the level of an individual question, assigning a specific score (BTS score) to each answer. The BTS score combines an information score (i-score) and a prediction-accuracy score. Across a study, these scores can be aggregated to provide a total score for each respondent.
The i-score for each answer k measures how truthful respondent r’s answer is based on how common it is relative to the group’s predictions. Answers that are more common than the group collectively predicts (i.e., surprisingly common) receive higher i-scores. The formula for the i-score is

where

where a is a constant that fine-tunes the weight given to the prediction error and

Several fundamental assumptions underlie the BTS, particularly regarding participants’ rational behavior. In the framework of the BTS, truth-telling is considered individually rational such that participants strive to maximize their expected BTS score. This relies on establishing a Bayesian Nash equilibrium, in which participants’ strategy is optimized based on their beliefs about others’ strategies. In the above equation, a Bayesian Nash equilibrium exists for a > 0, and the game is zero sum for a = 1. In this equilibrium, all participants are assumed to tell the truth to maximize their BTS score and earn a bonus, with no incentive to deviate from their chosen strategy unilaterally.
In real-world scenarios, however, individuals may not consistently exhibit the behavior expected of Bayesian agents (Trautmann & van de Kuilen, 2015), highlighting the importance of validating the BTS through experimental applications. Promisingly, Frank et al.’s (2017) large-scale experiments validated the BTS in scenarios with both known (coin flips, dice rolls) and unknown (pricing survey) honesty distributions. However, applications in economics, marketing, experimental philosophy, and psychology have yielded mixed findings. For instance, in experimental philosophy, Schoenegger and Verheyen’s (2022) registered report failed to replicate Schoenegger’s (2023) findings, in which pairwise comparisons revealed significant differences (p < .001) in answer distributions between BTS and control conditions. Nonetheless, there is a prevailing notion that the BTS holds promise in fostering more candid responses in various contexts, including those involving sensitive topics (John et al., 2012; Loughran et al., 2014).
In cases in which the BTS encounters limitations or lacks support, common explanations point to participants’ unfamiliarity with or disbelief in the method (Barrage & Lee, 2010; Bennett et al., 2018; Menapace & Raffaelli, 2020), reflecting the challenge of engendering trust in a mechanism that operates without explicit explanation. Furthermore, uncertain incentives for truth-telling may compromise the BTS’s effectiveness (Bennett et al., 2018), particularly among online respondents who harbor doubts about promises of bonus payments in general. These doubts can lead to the perception of the BTS as little more than cheap talk. Hence, there is a need for experimental applications of the BTS to examine the effects of addressing these potential shortcomings by aiming to enhance trust in both the mechanism itself and the bonus-payment process.
Study Purpose and Hypotheses
In this study, we aimed to evaluate the effectiveness of the BTS in improving the reliability of self-report data in psychology, focusing on mitigating biases associated with sensitive questions. To address potential challenges such as participant skepticism and uncertainty about incentives, we introduced an interim payment (IP) midway through the survey. The IP was intended to serve a dual purpose: demonstrate the researchers’ ability to detect truthful responses and commitment to fulfilling bonus payments. Based on Weaver and Prelec’s (2013) findings that participants became more truthful in response to feedback on their earnings, we expected that integrating this payment would make participants perceive both the mechanism and the incentives as more credible, potentially bolstering its efficacy.
In investigating these aims, two BTS experimental conditions were specified: one without an IP and one with an IP. In both conditions, each participant’s BTS score for each item was calculated and summed. Because the survey was undertaken in two parts (see Procedure section), the items were summed for each of the two parts of the survey. In the former condition, both bonuses were paid at the survey’s conclusion. In the latter condition, bonuses for summed Part 1 scores were paid at the midway point, and bonuses for summed Part 2 scores were paid at the end of the survey, with the midway bonus serving as the IP. The regular-incentive (RI) condition served as the control group, in which participants received the participation payment without any additional incentives.
The rationale for the study hypotheses was that greater agreement with socially undesirable statements, resulting in higher scores, would indicate more truthful responses. Research supports this expectation, showing that higher prevalence estimates are more valid for assessing sensitive or socially undesirable behaviors (De Jong et al., 2010; Lensvelt-Mulders et al., 2005) and that misreporting undesirable attitudes results from the same distortions as misreporting about behaviors (Tourangeau & Yan, 2007).
Specifically, the study hypotheses were as follows:
Hypothesis 1: Participants subjected to the BTS (with or without an IP) will have significantly higher mean scores indicating agreement with socially undesirable statements compared with participants in the RI condition.
Hypothesis 2: Participants subjected to the BTS with an IP will have significantly higher mean scores indicating agreement with socially undesirable statements compared with participants subjected to the BTS alone.
Method
Design
The study employed a between-subjects, experimental survey design. The study design, hypotheses, and analysis plan were preregistered as part of a registered report submission. The approved Stage 1 manuscript is publicly available at https://osf.io/vuh8b. Table 1 provides an overview of the study-design plan based on the Peer Community in Registered Reports template (Peer Community In, 2022).
Study-Design Planner
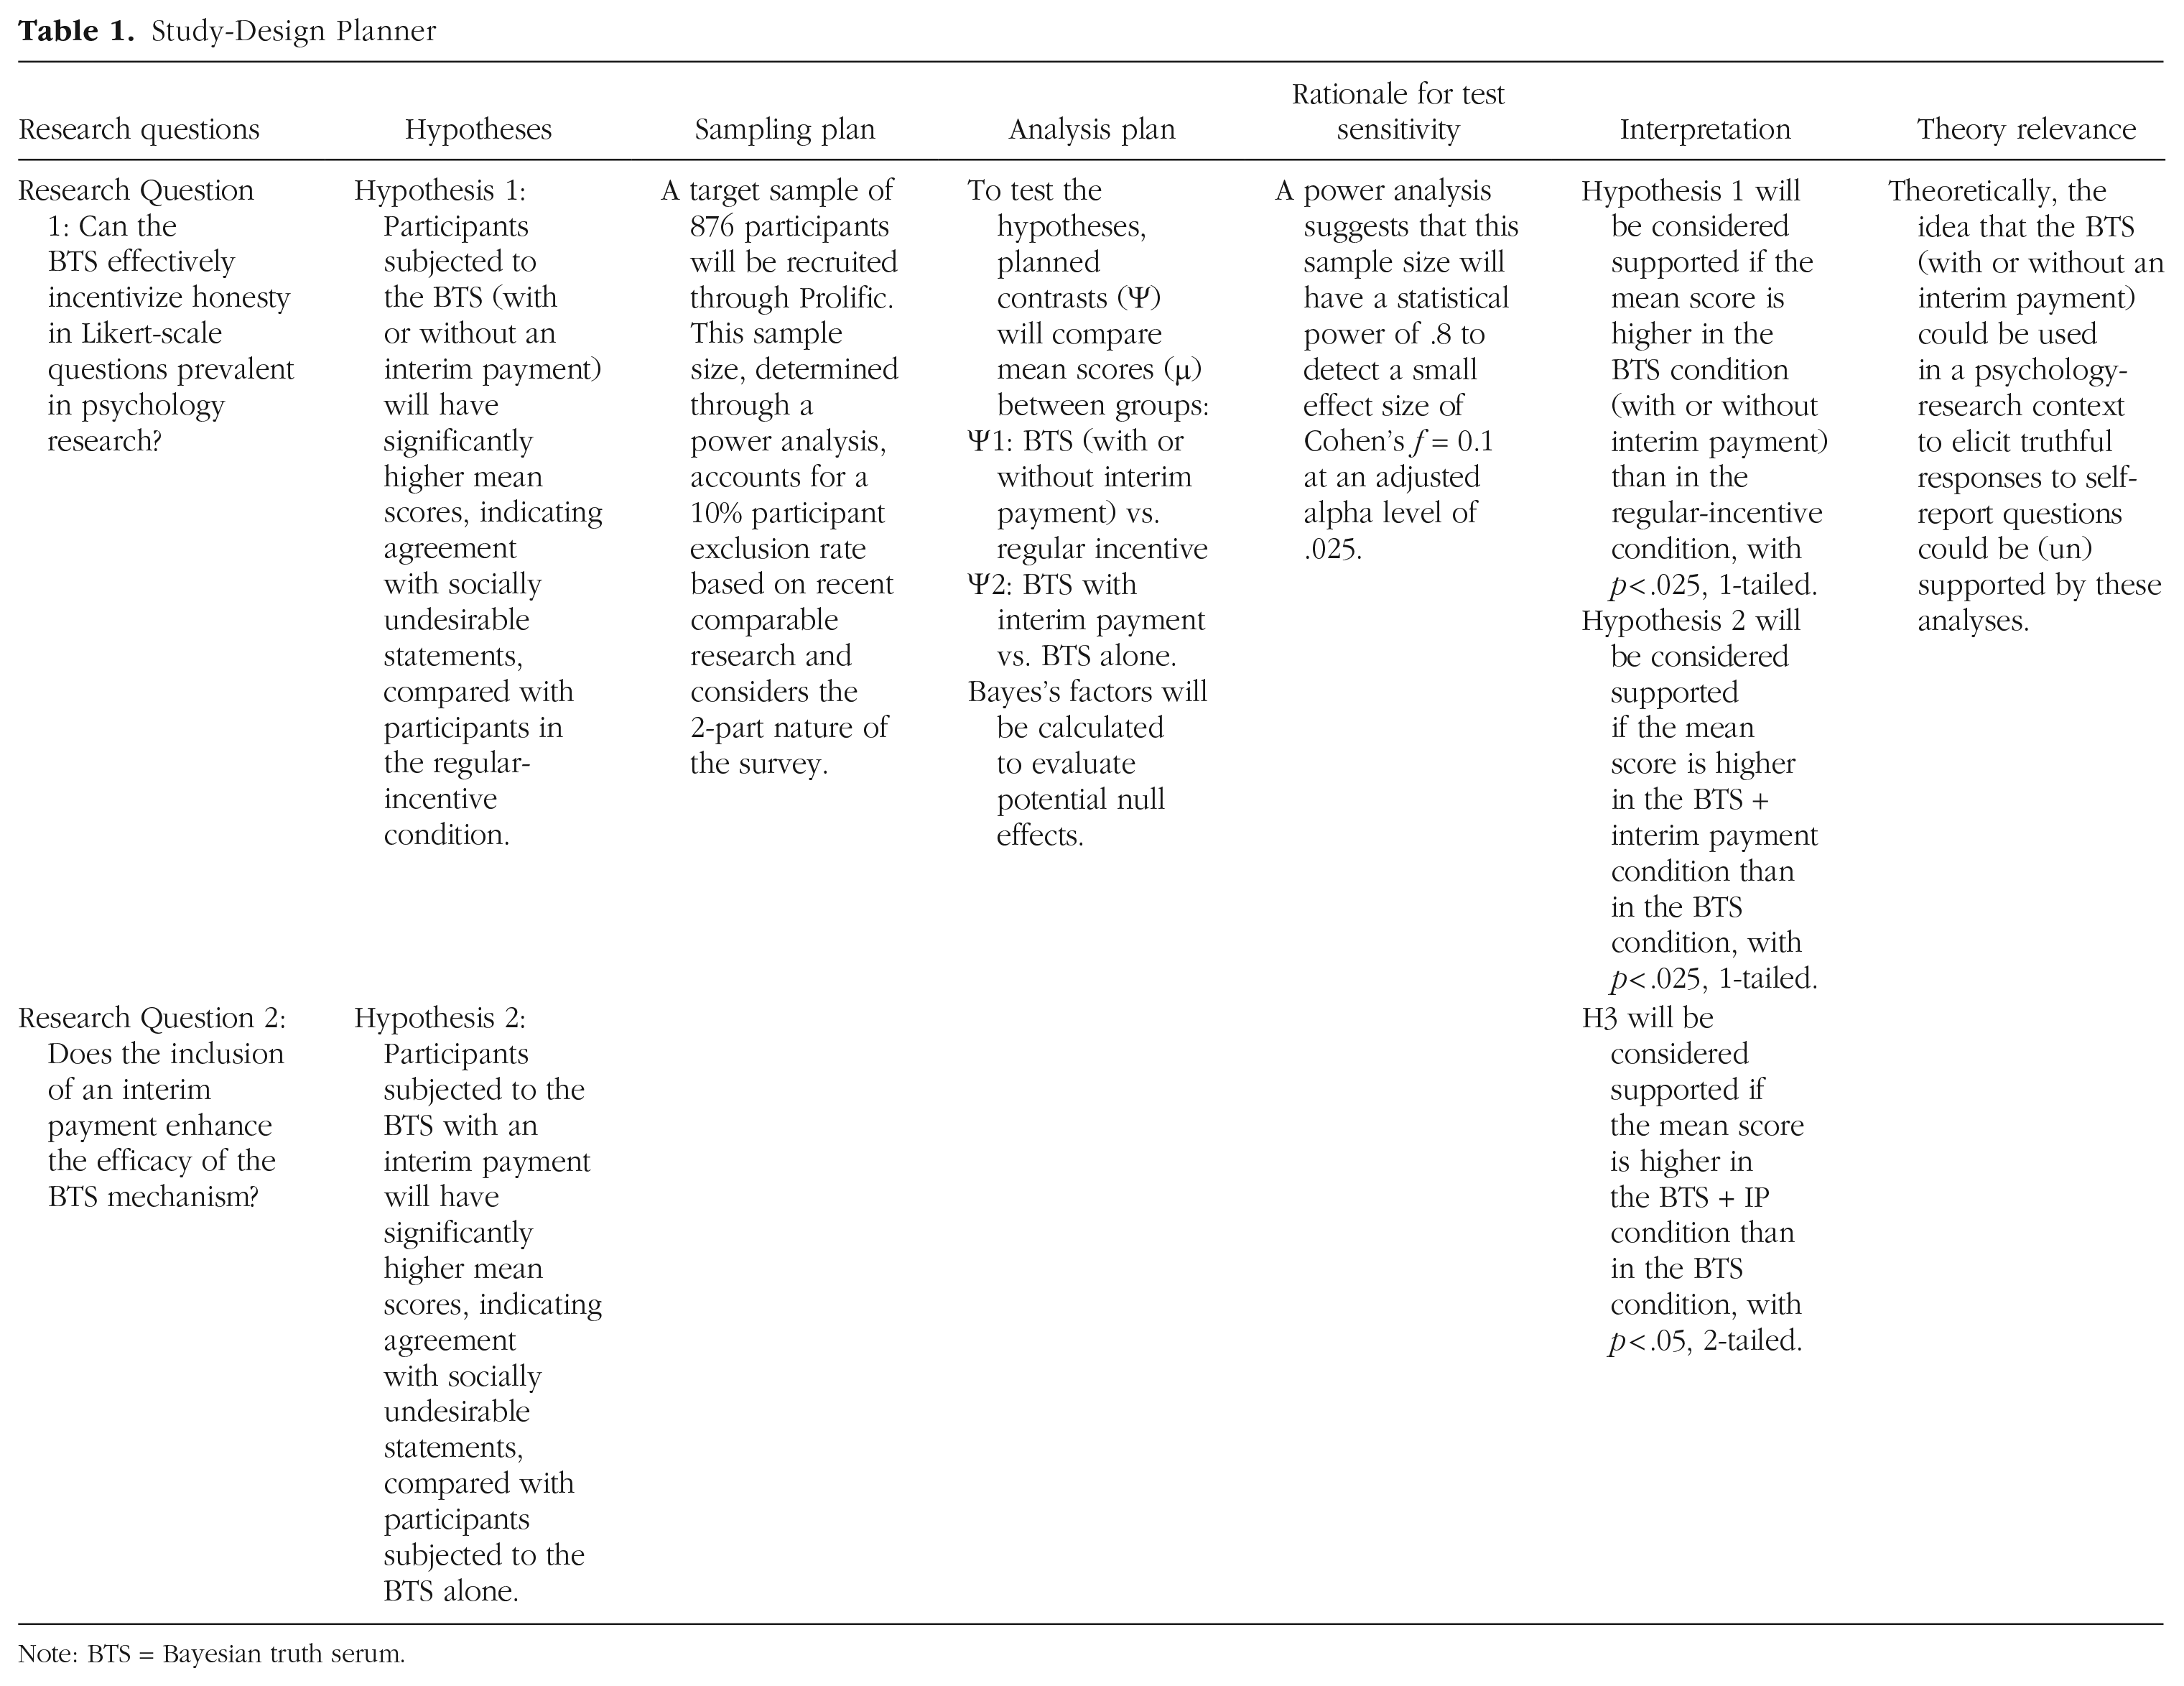
Note: BTS = Bayesian truth serum.
Participants
Participants ages 18 and over from the United States, Canada, UK, Ireland, Australia, and New Zealand were recruited through Prolific (Prolific, 2024a) to reflect the international scope of this research. This selection ensured linguistic and cultural coherence, enhancing data consistency and comparability. Prescreeners included fluent English proficiency and the completion of at least 20 previous surveys, based on Prolific’s data showing that experienced participants are more likely to complete multipart surveys, thereby reducing attrition (Prolific, 2024b).
The predicted effect size, guided by Cohen’s conventions (Cohen, 1988), aimed for the smallest meaningful effect, as advised by Lakens (2022). The a priori power analysis targeted a statistical power of .8 to detect a small effect size of Cohen’s f = 0.1 at an α level of .025, accounting for the Bonferroni correction (see Primary Analysis section). This analysis suggested a sample size of 787 participants. To calculate the sample size for a one-sided test with α = .025, the “α err prob” setting was specified at .05 because by definition, an F test is undirected. With three conditions, this sample size translated to approximately 263 participants per group. Although Schoenegger (2023) estimated a 5% exclusion rate, it was possible that the current two-part study would experience higher attrition. Therefore, with reference to comparable multipart studies (Kothe & Ling, 2019; Williams et al., 2024), an exclusion rate of 10% was considered more appropriate, leading to an adjusted target sample size of 876 participants (292 per group).
The target of 292 participants for each group was reached shortly after the survey launch. Once this target was met, data collection ceased without a time-based stopping rule. However, because the survey was completed in two parts, a time-based stopping rule was implemented for Part 2 of the survey. Data collection for each group continued until a 72-hr time limit was reached from when the invitation to complete Part 2 was sent.
Procedure
The survey was conducted in two parts. In Part 1, participants were recruited via a short advertisement posted on Prolific. They were then directed to a Qualtrics (2024) survey, which began with an information sheet and a consent item. Participants were invited to return approximately 48 hr after Part 1 was closed to complete the second part of the survey. At the conclusion of each part of the survey, participants were automatically directed back to Prolific with a completion code.
Using the randomizer function in Qualtrics, participants were randomly assigned to one of three conditions: BTS (BTS alone), BTS+IP, or RI. In all conditions, participants received a total base payment of £1; £0.50 was paid after completion of Part 1, and £0.50 was paid after completion of Part 2.
These base payments were in line with Prolific’s guidelines, converting to an hourly rate of £15 for survey completion. To minimize potential order effects, each main questionnaire item was paired with its associated prediction question, and these pairs were presented in a randomized order to each participant across all conditions.
In the BTS condition, participants first read an adaptation of the BTS text prepared by Frank et al. (2017) before answering questions. This introductory text (Box 1) clarified that the top 50% of participants, based on their aggregated BTS scores for each part of the survey, would receive a maximum bonus of £1 (£0.50 per part) payable after survey completion. This bonus amount was based on Schoenegger’s (2023) study. The departure from the conventional 30% allocation in previous studies aimed to enhance engagement with the survey by offering a greater probability of receiving the bonus while maintaining moderate levels of uncertainty to strengthen motivation. After each question, participants were prompted to predict how others in the study would respond in percentage terms, indicating the expected distribution of responses on the Likert scale. The peer-prediction question in Qualtrics dynamically updated to show participants whether their predictions summed up to 100%, streamlining the prediction process and reducing participant effort and time. Participants were ranked in the BTS condition to determine the top 50% eligible for a bonus based on the sum of their BTS scores in each part.
Instructions for Bayesian-Truth-Serum Condition

In the BTS+IP condition, participants followed a process similar to that of the BTS condition. They started by reading an adaptation of the BTS text (Box 2) specific to their condition, which explained that the top 50% of participants, based on the sum of their BTS scores for Part 1, would receive a partial bonus of £0.50, payable after Part 1. Likewise, the top 50% in the condition, based on the sum of their BTS scores for Part 2, would receive a partial bonus of £0.50, payable after Part 2. The bonus payment after Part 1 constituted the IP. After answering each question, participants made peer predictions. Participants were ranked in the BTS+IP condition to determine the top 50% eligible for a bonus in each part.
Instructions for Bayesian-Truth-Serum + Interim-Payment Condition

Participants in the RI condition did not receive text about BTS. However, to maintain consistent base compensation per hour across conditions, they made predictions following the main questions, as in the two BTS conditions.
Attention checks
Attention checks were not included in the study because it aimed to assess the effectiveness of the BTS in addressing both socially desirable and careless responses. This ensured that any improvements in accuracy were attributed solely to the BTS rather than the presence of attention checks.
Quality check
In Part 2 of the survey, participants in each of the BTS conditions were asked, “What percentage of participants, ranked by their BTS scores, will be eligible for a bonus?” The options were 30%, 50%, or 100%. This manipulation check ensured that participants understood that the top 50% in their respective group would be eligible for a bonus. Participants were provided information only about the specific condition to which they were assigned.
Measures
The main questionnaire comprised 10 questions addressing potentially uncomfortable or sensitive topics. These questions were curated from established scales, developed or updated in the 21st century, including the Social Dominance Orientation (Ho et al., 2015), Belief in Sexism Shift (Zehnter et al., 2021), and Succession, Identity, and Consumption Scale of Prescriptive Ageism (North & Fiske, 2013). Table 2 lists the survey questions and source scales. The use of contemporary scales ensured relevance to current social attitudes and sensitivities. The study questionnaire employed a consistent 5-point Likert-scale format for all items.
Survey Questions and Sources

Note: SDO7 = Social Dominance Orientation; BISS = Belief in Sexism Shift; SIC = Succession, Identity, and Consumption Scale of Prescriptive Ageism; R = reverse-coded item.
By selecting questions from a range of constructs, the BTS was tested for its ability to elicit truthful responses across various dimensions in aggregate. In each condition, responses to all 10 questions were combined into a single social-undesirability score for each participant. Cronbach’s alpha, calculated across imputed data sets, showed moderate reliability (M = .618, SD = .004). The choice of 10 main questions sought to balance thorough data collection with the need to keep the survey manageable and engaging for participants, taking into account the additional onus of prediction tasks. This approach sought to ensure fair compensation and avoid participant fatigue, aligning with budget constraints and guidelines for survey length (Denison, 2023).
The survey also included various demographic items, including age bracket, gender, and education level. The survey questionnaire can be viewed on OSF: https://osf.io/s9vaw.
Ethics
This study was approved by the Massey University Human Ethics Committee.
Analysis Strategy
The analyses were conducted using R (R Core Team, 2024) after data cleaning. Missing data were handled by performing multiple imputations using the mice package in R (van Buuren & Groothuis-Oudshoorn, 2011), following Rubin’s (1987) guidelines. Five imputed data sets were generated with a proportional-odds model for ordered categorical variables. Statistical analyses were performed on each imputed data set separately, and results were combined using Rubin’s rules via the pool() function in mice (van Buuren, 2018).
Descriptive analysis
Descriptive statistics were provided to summarize the sample characteristics in terms of age group, gender, and education. These data were not used in hypothesis testing but served solely to describe the sample.
Primary analysis
Planned contrasts (Ψ) were used to test the hypotheses, allowing for specific, theory-driven comparisons between groups based on prior expectations (Field, 2018). Although the preregistration specified a Welch adjustment to address variance inequalities (Zimmerman, 2004), the use of linear models with planned contrasts instead of t tests per se and the need to pool variance estimates across the five imputed data sets rendered this approach impractical. Instead, HC3 robust standard errors, a heteroscedasticity-consistent covariance matrix, were applied as a suitable alternative (Long & Ervin, 2000). To present the two closest alternatives to the original method, Welch-adjusted t tests were also conducted separately on each imputed data set; for detailed results, see Table S0 in the Supplemental Material available on OSF at https://osf.io/7tn9u.
The contrasts were compared as follows: Ψ1 = BTS (with or without IP) versus RI; Ψ2 = BTS with IP versus BTS alone. Weights were assigned as follows: Ψ1 = −2 (μRI) + 1 (μBTS) + 1 (μBTS+IP); Ψ2 = 0 (μRI) – 1 (μBTS) + 1 (μBTS+IP). Orthogonality was confirmed by the sum of the products of the weights equaling zero, ensuring each contrast tested a distinct hypothesis. To control the familywise Type I error rate, we applied a Bonferroni correction (Bonferroni, 1936) by dividing the alpha level by the number of contrasts. Thus, the alpha level was set at α = .025 for each test. Although Cohen’s f informed the a priori power analysis, Cohen’s d was calculated during the analysis to quantify effect sizes for the pairwise planned contrasts.
The following inferential criteria applied: (a) Hypothesis 1 will be considered supported if the mean score is higher in the BTS condition (with or without IP) than in the RI condition, with p < .025, one-tailed, and (b) Hypothesis 2 will be considered supported if the mean score is higher in the BTS+IP condition than in the BTS condition, with p < .025, one-tailed.
Supplementary analysis
Bayes factors were calculated using the BayesFactor package in R (Morey et al., 2018) to compare nondirectional alternatives of the original hypotheses against zero-effect null hypotheses through direct group comparisons. The default Cauchy prior (scale parameter = 0.707) was used for the effect size under the alternative hypothesis. Calculations were averaged across imputed data sets (Hoijtink, Gu, et al., 2019). Bayes’s factors were interpreted contextually such that values around 1 suggested no preference between hypotheses. Following guidance from Hoijtink, Mulder, et al. (2019, p. 545), we considered Bayes’s factors as direct and quantitative indicators of the evidence for (or against) the alternative hypothesis in comparison with the null hypothesis rather than applying strict thresholds. Although this supplementary analysis did not influence the determination of the main hypotheses, it provided additional context to determine whether nonsignificant results in the primary analysis are more consistent with a true null effect or a potential backfire effect.
Exploratory analysis
To gain further insights, chi-square tests of independence were undertaken to examine the distributions of individual item responses, cross-tabulated with condition. Post hoc analyses, including Brown-Mood median tests and Welch’s t tests for response durations, were also performed to better understand item-level variability and unexpected effects. These analyses are reported in the Supplemental Material available on OSF at https://osf.io/7tn9u.
Outcome-neutral tests
As preregistered, findings would be considered inconclusive if more than 50% of participants failed to identify the bonus-allocation percentage during the manipulation check in the BTS and BTS+IP conditions: 95.94% of BTS participants and 76.00% of BTS+IP participants correctly identified the allocation, surpassing the 50% threshold for conclusive results.
Results
In total, 877 participants were included in the study and assigned to one of three conditions: BTS (n = 289), BTS+IP (n = 293), and RI (n = 295). The sample’s age distribution spanned a broad range: 68% fell between 25 and 44 years of age. The median age group was 25 to 34 years. Gender distribution included 59% identifying as female, 39% identifying as male, and 1% identifying as nonbinary. Forty percent of participants held a bachelor’s degree, and 19% reported a graduate or professional degree, indicating a strong representation of higher education in the sample. Pooled means, 95% confidence intervals (CIs), and standard deviations of participants’ social-undesirability scores are presented in Table 3.
Descriptive Statistics of Social-Undesirability Scores by Condition (Postimputation)
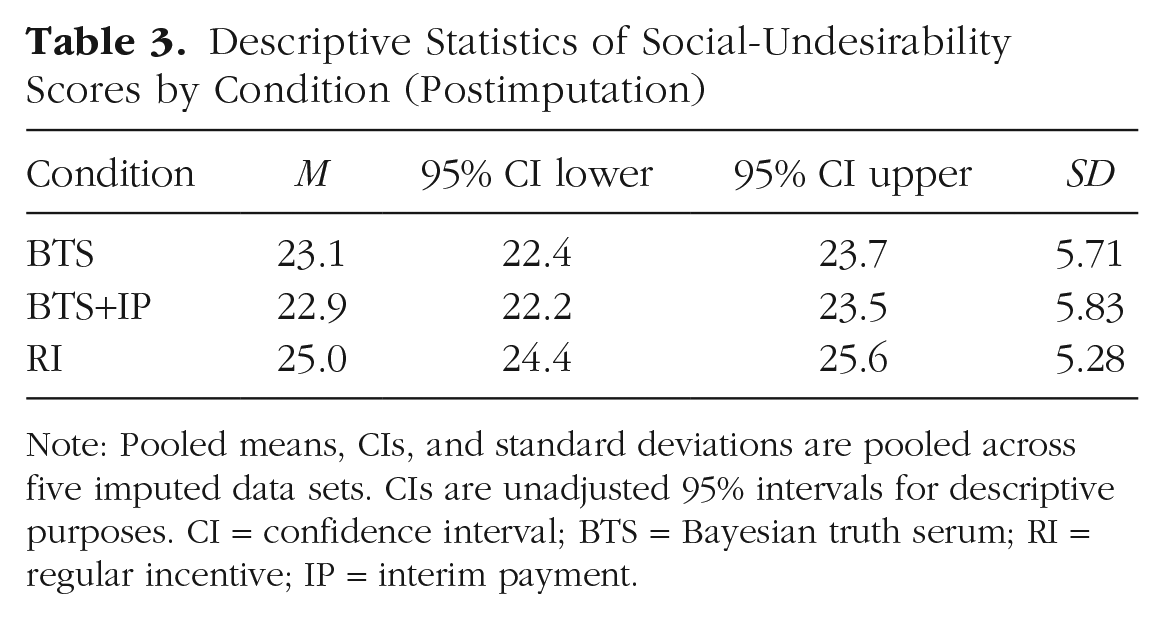
Note: Pooled means, CIs, and standard deviations are pooled across five imputed data sets. CIs are unadjusted 95% intervals for descriptive purposes. CI = confidence interval; BTS = Bayesian truth serum; RI = regular incentive; IP = interim payment.
Primary analysis
The first planned contrast compared the BTS conditions (with or without an IP) with the RI condition. It did not support the hypothesized directional effect, t(848.02) = −5.23, p = 1.00 (one-tailed), d = −0.36, 95% CI = [−0.49, −0.22]. The mean difference (M = −0.68, 95% CI = [−0.98, −0.39]) indicates that agreement with socially undesirable statements was lower in the combined BTS conditions compared with the RI condition, contrary to Hypothesis 1. Because a one-tailed test was preregistered, this result is interpreted in that framework. However, the result would have been significant if a two-tailed test had been preregistered. The second planned contrast compared the BTS+IP condition with the BTS alone. It was also not significant, t(792.70) = −0.47, p = .68 (one-tailed), d = −0.03, 95% CI = [−0.17, 0.11], thereby failing to support Hypothesis 2. These findings are depicted in Figure 1. A supplementary analysis using Welch-adjusted t tests on each imputed data set yielded consistent results (see the Supplemental Material available on OSF at https://osf.io/7tn9u).

Mean differences and 95% confidence intervals for planned contrasts. Ψ1 represents the planned contrast comparing BTS (with or without interim payment) versus regular incentive. Ψ2 represents the planned contrast comparing BTS with interim payment versus BTS alone. Bars represent the estimated difference for each planned contrast; error bars indicate 95% confidence intervals. The dashed red line represents the null value (0), indicating no difference between conditions. BTS = Bayesian truth serum.
Supplementary analysis
The Bayesian analysis used Bayes’s factors to compare nondirectional alternatives (Hypothesis 1) against zero-effect null hypotheses (H0). For the first contrast, the pooled BF10 was 24,757, indicating substantial evidence for a nonnull effect (albeit in the opposite direction to that expected). For the second contrast, the pooled BF10 was 0.103, suggesting greater consistency with the null hypothesis. These findings align with the primary analysis. Given the supplementary status of this analysis and the lack of a strong basis for prior probabilities, we did not convert the Bayes’s factors to posterior probabilities, but interested readers could do so by multiplying the Bayes’s factors by their own choice of prior odds.
Exploratory analysis: chi-square tests
The preregistered exploratory analysis showed significant associations between condition and response distribution for four of the 10 survey items after applying a Bonferroni-corrected significance threshold (a = .005). For three items (Q6, Q8, Q9; see Table 2 for item descriptions), response distributions in the BTS conditions skewed toward positions associated with greater social desirability compared with the RI condition. In contrast, the response distribution for Q7 aligned with the intended effect of the BTS mechanism. These patterns are visualized in Figure 2. No significant associations were observed for Q1 through Q5 or Q10. This analysis used unimputed data because imputing categorical variables can distort frequency distributions (Allison, 2002; van Buuren, 2018). Missing responses were retained but excluded from the chi-square calculations.

Response distributions for items with significant differences across conditions. Proportions of responses for each condition (BTS, BTS+IP, and RI) are displayed for survey questions with significant associations between condition and response distribution. See Table 2 for descriptions of the survey items. Likert-scale responses range from 1 (strongly disagree) to 5 (strongly agree); color coding indicates response levels. BTS = Bayesian truth serum; IP = interim payment; RI = regular incentive.
Exploratory analysis: median tests
Post hoc analysis using the Brown-Mood test (Brown & Mood, 1951) identified significant median differences across conditions for Q6 (χ2 = 38.75, p < .001), Q7 (χ2 = 296.92, p < .001), Q8 (χ2 = 142.06, p < .001), and Q9 (χ2 = 452.43, p < .001). Descriptive analyses of observed medians are presented in Figure 3.

Median responses for items with significant differences across conditions. Median responses are displayed by condition (BTS, BTS+IP, and RI) for survey questions showing significant differences in central tendency. See Table 2 for descriptions of the survey items. Likert-scale responses range from 1 (strongly disagree) to 5 (strongly agree). BTS = Bayesian truth serum; IP = interim payment; RI = regular incentive.
Exploratory analysis: response durations
Longer total survey-response times were examined as a proxy for increased cognitive engagement in the BTS conditions. For Part 1, BTS participants spent significantly more time completing the survey than RI participants, t(536.43) = 2.67, p = .008; no significant differences were found between BTS+IP and RI participants, t(571.42) = 0.90, p = .37. For Part 2 and total duration, no significant differences were observed between conditions.
Discussion
In this study, we evaluated the effectiveness of the BTS in reducing biases in self-reported responses to sensitive questions in a psychological context. The primary analyses, based on preregistered directional hypotheses, did not support the predicted positive effects of the BTS mechanism in either contrast. Specifically, the planned contrasts failed to reach statistical significance at the preregistered alpha level, providing no evidence for an increase in agreement with socially undesirable statements in the BTS conditions.
The first hypothesis predicted that participants in the BTS conditions (with or without an IP) would exhibit higher agreement with socially undesirable statements than participants in the RI condition, thereby reflecting greater truthfulness. However, the first planned contrast revealed no significant effects in the hypothesized direction. Instead, findings indicated that participants in the BTS conditions reported lower agreement with socially undesirable statements than participants in the RI condition. Supplementary Bayesian analyses tested nondirectional hypotheses against a zero-effect null, revealing substantial evidence for a nonnull effect, albeit in the opposite direction to the preregistered predictions. This pattern may indicate a possible backfire effect in which the BTS appeared to increase social-desirability bias.
Two main explanations are considered to account for this finding. First, the BTS mechanism may have broken down, causing participants to prioritize SDR over truthfulness. This could reflect a failure of the foundational assumption that participants act as rational agents. Instead, participants may have strategically adopted SDR as their optimal strategy, possibly influenced by factors such as experimenter demand effects or insufficient incentives. For example, participants may have aligned their responses with perceived researcher expectations, knowing their answers would be scrutinized as part of bonus allocation. Likewise, although the bonus amounts used in this study were consistent with those shown to be effective in Schoenegger’s (2023) study, they may have been inadequate in this context to offset the perceived costs of truthfulness, such as time, cognitive effort, or discomfort associated with disclosing sensitive information (Smith et al., 2014).
Second, the relationship between increased truthfulness and SDR may be more complex than initially assumed such that truthful responses do not always reduce SDR. In some cases, truthful responses may align with socially desirable positions rather than contradict them. For instance, agreement with the statement “Younger people are usually more productive than older people at their jobs” may reflect a widely accepted societal norm in a relatively young and highly educated sample rather than a socially undesirable position, as initially assumed. In such cases, lower agreement in the BTS conditions could indicate deeper engagement and a willingness to challenge reflexive, norm-aligned responses. Nesting in this broader complexity, we may have misjudged the direction of SDR for certain items. Although these interpretations offer plausible explanations for the observed response patterns, they remain tentative, particularly given the absence of consistent evidence for increased cognitive engagement in the BTS conditions as measured by survey-completion times.
The second hypothesis posited that an IP would enhance the BTS mechanism’s efficacy by increasing participants’ trust in the bonus-allocation process and the perceived credibility of the incentives. This prediction was also not supported: No significant difference was observed between the BTS and BTS+IP conditions in either the primary or supplementary analyses.
Several factors may explain this result. For instance, the 48-hr time frame for processing interim bonus payments may have reduced their intended effect. Psychological theories of reinforcement emphasize the power of immediate rewards (Skinner, 1953). Although the delay was necessary to ensure the completion of Part 1 and accurate bonus allocation under the BTS mechanism, it may have reduced the salience of the payment and its ability to reinforce trust in the process (Singer & Ye, 2013). Furthermore, confusion about the bonus-allocation process may have undermined the IP’s efficacy, evidenced by the 20% lower manipulation-check success rate in the BTS+IP condition compared with the BTS condition. Participants may, for example, have perceived the IP as a stand-alone bonus for completing Part 1 rather than as reinforcement of the broader BTS incentive structure, limiting its intended impact. Alternatively, the BTS mechanism’s efficacy may be inherently unaffected by IPs. Participants may have already trusted the researchers’ ability and commitment to pay bonuses without requiring a demonstration thereof, challenging prior assumptions that the mechanism’s limitations arise from issues of trust and credibility (Barrage & Lee, 2010; Bennett et al., 2018; Menapace & Raffaelli, 2020). If participant trust was already established, the IP might not have provided any additional benefit.
This study’s findings cast serious doubt on the effectiveness of the BTS in improving the accuracy of self-report data, particularly in reducing response biases to sensitive questions. Although prior studies have reported promising results in experimental contexts (e.g., John et al., 2012; Weaver & Prelec, 2013), this study and the earlier registered report by Schoenegger and Verheyen (2022) found no evidence for the hypothesized benefits of the BTS. Instead, patterns inconsistent with the mechanism’s intended effects, including possible backfire effects, emerged, raising concerns about its robustness. Although further research may uncover specific conditions or refinements that improve its performance, the current evidence does not support the efficacy of the BTS in enhancing truthfulness in applied psychological research.
We acknowledge several limitations that suggest potential directions for future research. First, the convenience sample, predominantly ages 25 to 44 and highly educated, limits the generalizability of the findings. Future studies should prioritize recruiting more diverse and representative samples to evaluate the BTS across varied populations and contexts. Furthermore, in this study, we made assumptions about what constitutes a socially desirable stance. However, these assumptions regarding the direction of SDR may not have accurately aligned with participants’ norms or beliefs for certain items. Future research could explicitly test these assumptions to ensure they are contextually appropriate and reflect the studied population. Although the primary confirmatory analysis did not aim to test backfire effects, the supplementary Bayesian analysis identified an unexpected pattern that could indicate increased social-desirability bias under the BTS. In addition, the exploratory analyses of item-level distributions provided useful insights, although their post hoc nature limits the strength of the conclusions. These exploratory findings suggest that future preregistered studies should not only address how well social-desirability assumptions align with participant norms but also investigate potential backfire effects using a targeted confirmatory approach.
Conclusion
In this study, we evaluated the effectiveness of the BTS in reducing response biases and improving the reliability of self-report data in psychological research. Contrary to predictions, participants in the BTS conditions reported lower agreement with socially undesirable statements compared with those in the RI condition, raising concerns about its intended effects. In addition, the IP, designed to enhance trust in the BTS, failed to produce any meaningful improvement. As the second registered report that has found no robust support for the BTS, these findings cast further doubt on its efficacy as a mechanism for eliciting truthful responses in self-report studies. Until further research identifies conditions under which the BTS performs effectively, it cannot be recommended as a practical tool for applied psychological research.
Footnotes
Acknowledgements
We acknowledge using Qualtrics (provided through Massey University) for survey administration and Prolific for participant recruitment. Data analysis was conducted using R. We also used Grammarly for language proofreading and OpenAI’s ChatGPT to refine and troubleshoot software code used in data analysis. This assistance did not influence the scientific interpretation of the results. We thank the reviewers at Peer Community In for their constructive feedback.
Transparency
Action editor: David A. Sbarra
Editor: David A. Sbarra
Author Contributions