
Abstract
Effect sizes are often used in psychology because they are crucial when determining the required sample size of a study and when interpreting the implications of a result. Recently, researchers have been encouraged to contextualize their effect sizes and determine what the smallest effect size is that yields theoretical or practical implications, also known as the “smallest effect size of interest” (SESOI). Having a SESOI will allow researchers to have more specific hypotheses, such as whether their findings are truly meaningful (i.e., minimum-effect testing) or whether no meaningful effect exists (i.e., equivalence testing). These types of hypotheses should be reflected in power analyses to accurately determine the required sample size. Through a confidence-interval-focused approach and simulations, I show how to conduct power analyses for minimum-effect and equivalence testing. Moreover, I show that conducting a power analysis for the SESOI might result in inconclusive results. This confidence-interval-focused simulation-based power analysis can be easily adopted to different types of research areas and designs. Last, I provide recommendations on how to conduct such simulation-based power analyses.
When planning an experimental study, it is crucial to determine which effect sizes (i.e., magnitude of a phenomenon; Cohen, 1988) are of interest. Specifically, the effect size provides insights into the theoretical and/or practical relevance of a finding. Recent publications have urged researchers to establish contextualized smallest effect sizes of interest (SESOIs) for their specific field of research to improve the statistical inferences (e.g., Lakens et al., 2018; Panzarella et al., 2021; Riesthuis et al., 2022). Simply put, the SESOI is the smallest effect size that either researchers are themselves interested in, yields practical relevance, or is important theoretically. The SESOI is beneficial because it allows researchers to more stringently examine their theories and hypotheses by being able to falsify them. Moreover, the SESOI changes hypotheses from whether there simply is an effect (i.e., statistically significantly different from 0) to whether there is an effect that one is truly interested in on a practical or theoretical level (i.e., minimum-effect testing; Murphy & Myors, 1999) or the effect is too small to care about (i.e., equivalence testing; Westlake, 1972). These changed hypotheses need to be accurately reflected when conducting power analyses, and I show via simulations that larger sample sizes are needed to adequately address such hypotheses. I first provide a short overview on when effect sizes matter and how an SESOI can be established. Then, via an illustrative example, I show how hypotheses will differ when an SESOI is established. Last, I provide a simulation-based approach on how to accurately reflect the hypotheses researchers have when a SESOI is established in their power analyses and show that using the SESOI in a null hypothesis significance testing (NHST) power analysis is not sufficient in most circumstances.
When Do Effect Sizes Matter?
Effect sizes are receiving more attention in psychology to determine which effects matter (e.g., Cumming, 2014; Funder & Ozer, 2019). However, some researchers still rely on statistical significance to determine whether observed effects are practically or theoretically relevant (Riesthuis et al., 2022) or use Cohen’s benchmarks for small, medium, and large effects (Cohen, 1988; Correll et al., 2020) to interpret the magnitude of effects. The use of Cohen’s benchmarks is not encouraged because it does not take into account the context of individual research fields (Cohen, 1988, pp. 532–535; Funder & Ozer, 2019). In other words, effect sizes are relative and depend on the field of the study to determine whether an effect is small, medium, or large (see e.g., Rosenthal, 1990). Cohen himself argued that the benchmarks were to be used only when no other information was present (Cohen, 1988, p. 25). To circumvent Cohen’s benchmarks, some researchers have tried to establish what small, medium, and large effects are for a specific field based on the distribution of the published effect sizes (e.g., Nordahl-Hansen et al., 2024). However, this approach faces similar issues as Cohen’s benchmarks wherein it fails to provide information about whether these effects are actually practically or theoretically meaningful but are also possibly under- or overestimated because of publication bias (Mesquida & Lakens, 2024; for an extensive critique on this approach, see Panzarella et al., 2021).
Although the use of benchmarks is common, researchers can nearly always improve on this practice. For instance, when researchers rely on benchmarks because no other information is available, it may be more of an indication that the research is simply not ready yet to test hypotheses and that more exploratory research is necessary (see Scheel et al., 2021). However, when more information is available, it is in the researchers’ best interest to establish which effect sizes are meaningful in practical or theoretical terms for the specific context of the study because it will lead to more informative research (Lakens, 2022a). To do so, it would be beneficial to focus on unstandardized effect sizes instead of standardized effect sizes to interpret the magnitude of an effect (Baguley, 2009; Greenland et al., 1986, 1991; Pek & Flora, 2018; Schäfer, 2023). That is, unstandardized effect sizes are more intuitive than standardized effect sizes and give a clearer idea of what effects could be of potential theoretical or practical interest. When focusing on the unstandardized effect size, cost-benefit analyses can be conducted to estimate what a SESOI could be and then decide which effects might be small, medium, or large. Although determining the SESOI through cost-benefit analyses can be challenging and may vary over time and between researchers because of its subjectivity (Lakens et al., 2018), it improves the current standard of relying on benchmarks that do not reflect the contextualized magnitude of an effect (Panzarella et al., 2021). Moreover, by justifying the cost-benefit analyses for a given SESOI, other researchers may agree, which could lead to a general consensus among them. If they disagree, a scientific discussion is possible wherein they can provide other factors that should be taken into account for the cost-benefit analysis to get a better estimate of the SESOI. However, discussions about what the SESOIs for specific fields are only now emerging in the psychological literature (e.g., Otgaar et al., 2022).
The SESOI has been of critical importance in the medical field, in which it is a long-debated issue (e.g., Jaeschke et al., 1989). Specifically, they have been concerned with the minimally clinical important difference (MCID; but see also Rossi et al., 2023), which is defined as the smallest effect that a patient notices as beneficial or harmful (McGlothlin & Lewis, 2014). Establishing the MCID allowed medical researchers to establish whether certain interventions (e.g., new medication) are inferior, equal, or superior to the currently used one. For instance, researchers might want to know whether a cheaper medication is as effective as the currently used medication or at least not inferior. The MCID thus provided crucial advantages in terms of assessing the practical relevance of new interventions.
There are several ways to establish the SESOI (or MCID), such as anchor-based methods, consensus methods, or cost-benefit analyses (for a complete overview, see Lakens et al., 2018). In psychology, several areas of research have started estimating the SESOI. For instance, a SESOI for positive and negative affect measured by the Positive and Negative Affect Schedule was estimated based on participants’ self-reported improvement or decline (i.e., anchor-based method; Anvari & Lakens, 2021), the SESOI in false-memory research was examined by asking memory scientists when they would consider a statement invalid and not to be used in the courtroom after certain memory errors occurred (i.e., consensus-based method; Riesthuis et al., 2022), and the SESOI for eyewitness-memory research was discussed through a cost-benefit analysis focusing on the possible wrongful convictions that could occur after errors in eyewitness memory (Otgaar et al., 2023). As observed in medical research, the focus in psychology has been mainly on the SESOI for practical implications. It is possible that this practical-oriented approach comes from the fact that theories in psychology are verbal in nature (Gruijters & Peters, 2022). In other words, most psychological theories do not make any quantitative predictions but indicate only whether there is an effect and in which direction the effect takes place. Hence, although deriving the SESOI from theories is an appropriate approach, it is currently complicated to do so.
How Does the SESOI Change Hypotheses?
When there is no SESOI established, hypotheses are typically about whether an effect is present. This hypothesis is then typically analyzed using the traditional NHST approach to examine whether the observed effect is statistically significantly different from 0 (p < .05; 95% confidence interval [CI] does not include 0). 1 This approach has several issues. First, researchers might indeed find a statistically significant effect; however, it is unclear whether this effect has any practical or theoretical meaning. This becomes especially problematic with increasing sample sizes wherein statistically significant trivial effects can be observed (Anvari & Lakens, 2021). Another issue with the traditional NHST approach is that researchers can never prove that an effect does not exist because when they observe a non-statistically significant effect, they can conclude only that they failed to reject the null hypothesis. However, with the SESOI, various possibilities open up.
Through a simplified example, I show that when a SESOI is set, hypotheses change and different analyses are possible. Imagine that a group of researchers is interested in the effects of alcohol on memory in terms of the number of correct details remembered. To examine this, some participants drink alcohol (i.e., experimental group), and others do not (i.e., control group); then, they watch a video of a crime. Then, 1 week later, they complete a memory task about this crime. In the traditional NHST approach, researchers can examine whether (a) participants who drink alcohol will remember statistically significantly fewer correct details than participants who did not or (b) whether participants who drink alcohol will remember statistically significantly more correct details than participants who did not. However, imagine that the researchers decide to use the SESOI proposed by Otgaar and colleagues (2023), which is 1 correct detail remembered or forgotten. When adopting this SESOI, the hypothesis changes from simply establishing whether alcohol leads to fewer (or more) correct details remembered compared with the control group to whether alcohol leads to at least 1 more (or fewer) correct details remembered (i.e., minimum-effect testing; Murphy & Myors, 1999). Moreover, the researchers could also change their hypothesis wherein they want to find support for the null hypothesis. In other words, using the SESOI, researchers can examine whether alcohol does not have any meaningful memory-undermining effects. Specifically, they can scrutinize whether their observed effect is smaller than the SESOI in either direction, also known as “equivalence testing” (Anderson & Hauck, 1983; Mazzolari et al., 2022; Schuirmann, 1987; Westlake, 1972). Hence, when a SESOI is established, the results of an NHST become less relevant, and researchers should be more interested in whether their effect is practically or theoretically relevant (i.e., greater than the SESOI) or is too small to care about (i.e., effect is smaller than the SESOI; no meaningful effect). To establish whether effects are truly meaningful or equivalent, CIs play an important role (see Smiley et al., 2023).
That is, in the NHST approach, to establish whether an effect is statistically significant (p < .05), researchers can simply look at the 95% CI and visually examine whether it includes 0. If the 95% CI does not include 0, it can be concluded that a statistically significant effect was found. To examine whether results are practically or theoretically relevant based on the SESOI, a minimum-effect test can be conducted (Murphy & Myors, 1999). The minimum-effect test can be seen as an extension of the NHST wherein instead of examining whether the 95% CI does not include 0, it changes to whether the 95% CI is greater than the SESOI. In other words, the SESOI replaces the null. To establish whether the results are equivalent, a slightly different approach can be taken wherein it is examined whether 90% CI 2 falls completely within the lower and upper bounds set by the SESOI (e.g., –1 and 1 in the alcohol and memory example). 3
In Figure 1, the different hypotheses and outcomes of the hypothetical study on the effects of alcohol on memory are presented. The distributions from left to right are as follows: (a) Participants who drank alcohol remembered fewer correct details than participants who did not drink alcohol, and this was greater than the SESOI of 1 correct detail (95% CI does not include 0 or the SESOI of –1); (b) participants who drank alcohol remembered fewer correct details than participants who did not, but results are inconclusive as to whether this is a practically or theoretically relevant result (95% CI does not include 0 but does include the SESOI); (c) although participants who drank alcohol remembered statistically significantly fewer correct details than participants who did not, the effect is too small to care about and thus equivalent (95% CI does not include 0, but 90% CI falls within lower and upper equivalence bounds); (d) memory performance was equivalent among participants who drank alcohol and participants who did not (95% CI includes 0, and 90% CI falls within lower and upper equivalence bounds based on the SESOI); and (e) participants who drank alcohol remembered more correct details than participants who did not, and this was greater than the SESOI (95% CI does not include 0 or the SESOI).

The possible outcomes when a smallest effect size of interest (SESOI) is established. Each number represents a different outcome of the hypothetical study. 1 = statistically significant and practically/theoretically significant (i.e., inferior); 2 = statistically significant and inconclusive results regarding the practical/theoretical meaning; 3 = statistically significant and equivalent; 4 = not statistically significant and equivalent; 5 = statistically significant and practically/theoretically significant (i.e., superior). Graph was inspired by graph of Lakens and colleagues (2018).
These hypothetical results highlight once more that when an SESOI is set, the more interesting hypotheses are whether an effect is practically or theoretically meaningful (i.e., minimum-effect testing; Scenarios 1 and 5, Fig. 1) or equivalent (i.e., Scenarios 3 and 4, Fig. 1) instead of whether the effect is simply different from 0 (i.e., Scenario 2, Fig. 1). Such hypotheses are riskier and more falsifiable than the hypotheses tested in NHST (Meehl, 1967; Morey & Lakens, 2016). Moreover, it shows that statistical significance does not always mean practical or theoretical significance. However, to avoid possible biasing effects as seen with hypothesizing after results are known (HARKing; Kerr, 1998), the effect size that researchers deem practically or theoretically relevant should be established before the statistical analyses are conducted or even better, when designing the study (i.e., when conducting a power analysis). That is because when researchers interpret the statistically significant effect sizes, it can lead them to look for evidence for the practical or theoretical relevance of the observed effect. When a SESOI is determined before the study is conducted, not only do the hypotheses and analyses change but also the power analyses. That is, power analyses should be based on researchers’ hypotheses and accurately reflect how they tend to analyze them. However, depending on the research question (e.g., minimum effect or equivalence), conducting a power analysis using just the SESOI for NHST may not allow researchers to address these hypotheses adequately.
SESOI and Simulation-Based Power Analyses
Generally, power analyses are based on the traditional NHST approach. In this approach, researchers indicate which effect size they want to be able to reliably 4 detect if the effect truly exists. When researchers conduct a power analysis using the SESOI for NHST, they can reliably detect only the SESOI or larger effect sizes. In other words, when a power analysis is conducted using the SESOI for NHST, researchers will not be able to establish whether there is equivalence. Moreover, as shown in the second distribution of Figure 1, researchers might detect statistically significant effects but are unable to show that they detected an effect size that has practical or theoretical relevant implications based on the SESOI (95% CI includes the SESOI). Whether inconclusive results are found depends on the true effect size. For instance, if the true effect size is sufficiently larger than the SESOI, this does not pose a problem as long as the effect size estimate and its 95% CI are greater than the SESOI. 5 However, note that the true effect size is never known, and thus, researchers should conduct power analyses for minimum-effect or equivalent testing using the SESOI. The underlying idea is that the SESOI replaces the null, and then it can be examined whether the observed effect is statistically larger than the SESOI (i.e., 95% CI greater than SESOI) or equivalent (SESOI is outside 90% CI). Hence, researchers should not conduct power analyses for the SESOI for a NHST but for minimum-effect or equivalence testing.
It is possible to adequately estimate the required sample size for the changed hypotheses (e.g., minimum effect, equivalence) using a CI approach. I show in this article how to conduct such power analyses through a simulation-based approach and demonstrate that powering for the SESOI might not be enough. Simply put, in a simulation-based approach, researchers create, for example, 1,000 data sets as if they had conducted these experiments with the parameters (e.g., means, standard deviations, sample sizes) they are interested in. After these data sets have been created, they can be analyzed individually, as the researchers intend to do with the actual experiment. Then, researchers can simply look at the estimates of interest, such as the p values, 95% CI, and 90% CI, and interpret them. For instance, this provides insights into the proportion of 95% CIs that do not include 0 (i.e., statistically significant; also known as the “traditional statistical power”), proportion of 95% CIs that do not include the SESOI (i.e., theoretically/practically significant), or the proportion of 90% CIs that fall within the two equivalent bounds that are based on the SESOI (i.e., equivalence). These proportions can be regarded as the statistical power for each type of analysis (i.e., statistical significance, theoretical/practical significance, equivalence).
The Present Simulation Study
As an example, I show how to conduct simulation-based power analyses for the hypothetical study on the effects of alcohol on memory. I show how statistical power can be calculated for each type of analysis: (a) NHST, (b) minimum-effect testing, and (c) equivalence testing using the SESOI. 6 Through these simulations, I show that conducting power analyses using the SESOI in an NHST approach may not be sufficient to adequately address the changed hypotheses derived when an SESOI is set. Moreover, I show how researchers can conduct simulation-based power analyses using the CI approach for minimum-effect and equivalence testing.
Design and procedure
For this simulation, I used a two-group (alcohol and control) between-subjects design (see Table 1). The SESOI was set to 1 correct detail remembered, which was based on the cost-benefit analysis of Otgaar and colleagues (2023). Using this SESOI, I show how the statistical power changes for each of type of hypothesis test for different raw mean differences (i.e., raw mean differences of 0, 0.5, 1, 1.5, 2). For simplicity, the traditional significance level was set to 5% (95% CI does not include 0 is regarded as statistical significance), and standard deviations were identical for each group and set to 2. 7 However, it is crucial to justify the alpha. Moreover, it is important to have good estimates of the variation (e.g., standard deviation) because the variation in the measurement procedure plays a vital part in the power analyses and inferences made in NHST but also minimum-effect and equivalence testing in the CI-focused approach (see Lakens, 2022a). 8 Specifically, when measurement error is present because of within- and/or between-persons variability, standard deviations, and consequently standard errors, tend to be larger, resulting in an increase of Type II errors (Jané, 2024). Finally, I provide the statistical power for different sample sizes (i.e., Ns per group of 25, 50, 100, 250, 500).
Parameters and Its Values Used in Simulation-Based Power Analysis

Note: A CI approach was adopted wherein NHST is examined by whether the 95% CI includes 0, minimum-effect testing by whether the 95% CI is greater than the SESOI, and equivalence by whether the 90% CI falls within the lower and upper equivalence bounds set by the SESOI. Significance level (α) is set to the frequently used 5%. Statistical power (1 – β) is set to the frequently used 0.8. NHST = null hypothesis significance testing; SESOI = smallest effect size of interest; CI = confidence interval.
Simulations were performed in R (R Core Team, 2023) using the faux package (DeBruine, 2023). R code and Rmarkdown files with interactive plots and tables with exact statistical power values are openly available on OSF (https://osf.io/nzupw/).
Statistical-power evaluation
Using the CI-focused approach, the statistical power for each test is determined by the percentage of results that yield statistical significance, theoretical/practical significance, or equivalence. For the current simulation, the SESOI is set to 1 correct detail remembered. For NHST, statistical significance is determined by the percentage of results that have a 95% CI that does not include 0. For minimum-effect testing, theoretical/practical significance is determined by the percentage of results that have a 95% CI that is either greater than the SESOI of 1 (or smaller than –1 depending on the direction of the effect). For equivalence testing, the lower and upper bounds are set to –1 and 1, respectively. The conventional 80% statistical power is used as a cutoff point to establish whether a study is sufficiently powered.
Results
For each raw mean difference, I provide plots with the power for each test for each sample size, as done in previous research (Alter & Counsell, 2023). Simulations for a raw mean difference of 0 showed that the “statistical power” 9 for NHST and minimum-effects testing is .05 and 0, respectively, which is in line with the given Type 1 error rate (see Fig. 2 and the interactive plot or table with exact statistical power estimates, https://osf.io/nzupw/) and expected when there truly is no effect. When there truly is no effect, equivalence tests reached only the typically desired statistical power of .8 with approximately 75 participants in each group. This shows that small sample sizes (i.e., 25–50 per group) will not be able to provide solid evidence that an effect does not exist even when it truly does not exist. Hence, when such small sample sizes are used, researchers are unlikely to conclude that there is no effect and might end up with inconclusive results.

Power analyses for each type of test for a raw mean difference of 0.
Simulation results for raw mean difference 0.5 showed that statistical power for NHST and equivalence testing follow a similar trajectory (see Fig. 3). That is, both types of tests have lower statistical power than .8 for sample sizes smaller than approximately 200 to 250 participants per group. In other words, for a study with 250 participants per group and a raw mean difference of 0.5 with a standard deviation of 2, there is high statistical power to find that the results are statistically significant (95% CI does not include 0; NHST) but also similarly high statistical power to show that the effect is too small to care about (i.e., 90% CI falls within the lower and upper equivalence bounds; equivalence testing). For minimum-effect testing, the statistical power was 0 independent of the sample size.

Power analyses for each type of test for a raw mean difference of 0.5.
For a raw mean difference equal to the SESOI (= 1), statistical power for the minimum-effect tests and equivalence tests are very low independent of the sample size (see Fig. 4). This is expected because if the true raw mean difference is identical to the SESOI, the random variation will rarely lead to a 95% CI surpassing the SESOI or the 90% CI falling within the lower and upper equivalence bounds. However, statistical power for NHST surpasses the 0.8 threshold when there are approximately 70 participants in each group but has a steep decline in statistical power for smaller sample sizes. This shows that conducting a power analyses for the SESOI might not be enough because researchers will be unable to determine whether their effects are equivalent or are practically or theoretically relevant.

Power analyses for each type of test for a raw mean difference of 1 (equal to smallest effect size of interest).
For a raw mean difference of 1.5 correct details remembered, statistical power for the equivalence test is practically 0 (see Fig. 5). With rather low sample sizes (n = 25 per group), statistical power for NHST is .75 and has a steep increase in statistical power for greater sample sizes. Hence, for such effects, statistical significance is readily detected. However, statistical power for minimum-effect testing reaches only .8 with approximately 275 participants per group. Hence, when hypotheses change because of the introduction of the SESOI, the appropriate sample sizes required increase rapidly.
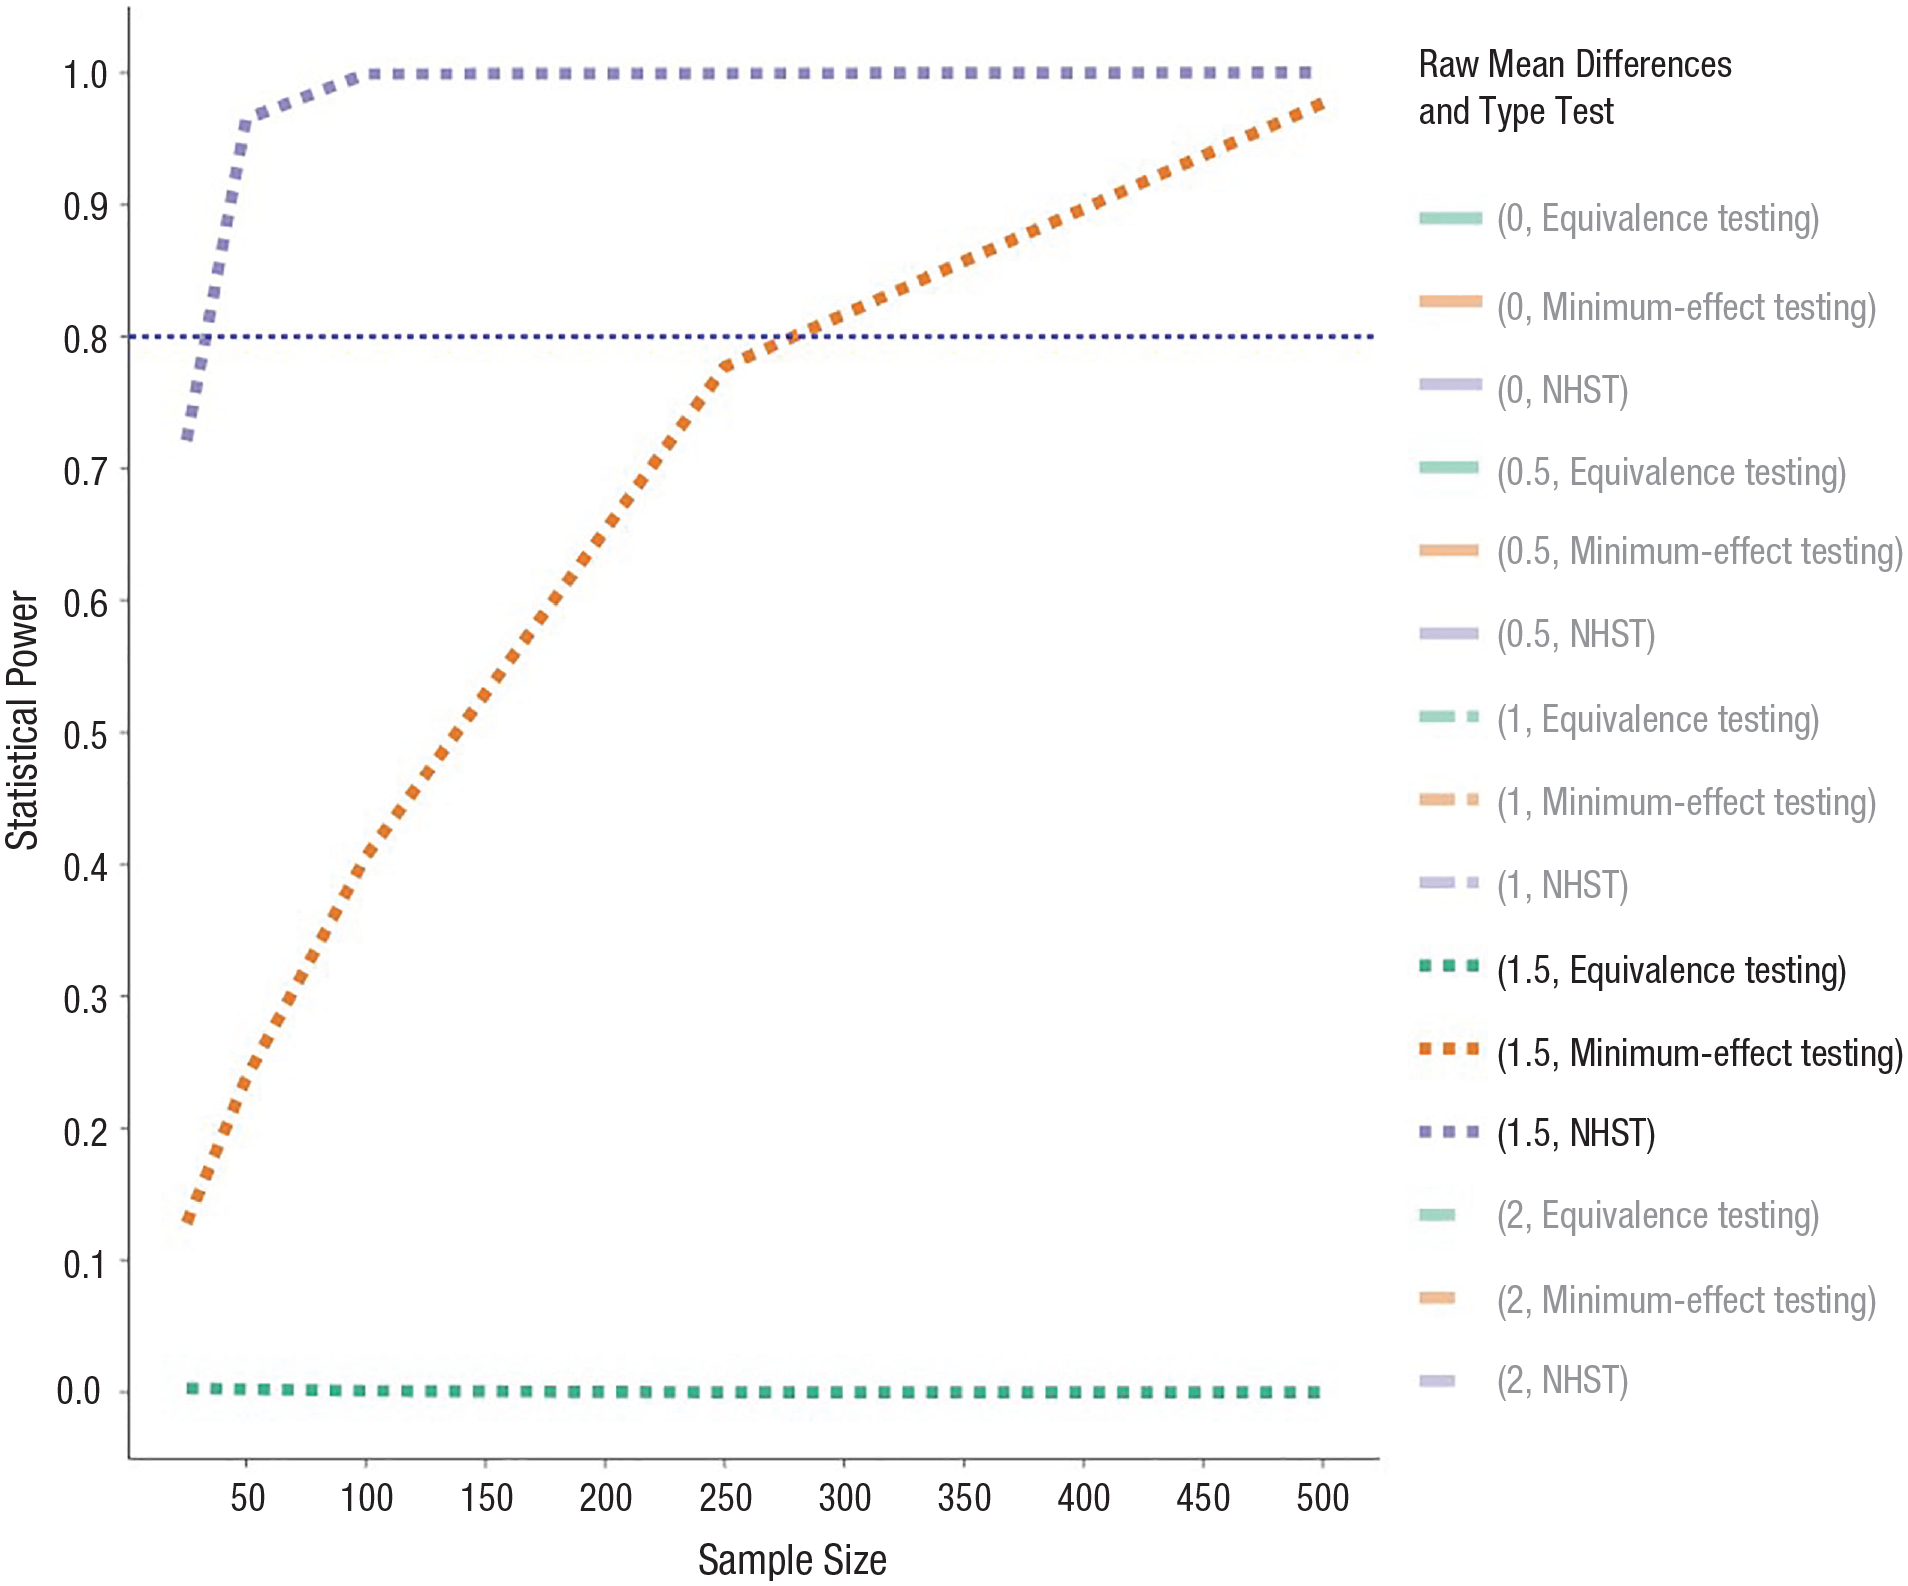
Power analyses for each type of test for a raw mean difference of 1.5.
Similar for the results of a raw mean difference of 1.5, simulations for a raw mean difference of 2 correct details remembered showed an increase in statistical power for NHST and minimum-effect testing (see Fig. 6). Statistical power for NHST is practically 1 for each sample size, but statistical power for minimum-effect testing surpasses the conventional .8 threshold only with 75 participants in each group. Thus, with increasing “true” raw mean differences, power for NHST and minimum-effect testing will increase as well. The same holds up when smaller standard deviations are used. The statistical power for equivalence tests is 0, and that is what should be the case with increasing “true” raw mean differences.

Power analyses for each type of test for a raw mean difference of 2.
Discussion
The magnitude of an effect plays an important role in determining the practical and/or theoretical relevance of a finding. Increasing efforts in psychological research are devoted to establishing what the SESOI is for specific contextualized fields to improve the inferences of its research (e.g., Anvari & Lakens, 2021; Otgaar et al., 2023). When such a SESOI is established, the hypotheses should change (e.g., minimum effect, equivalence), and this should be reflected in the power analyses to determine the required sample size of a specific study. Specifically, researchers are not interested anymore in only whether an effect is statistically significantly different from 0 but rather, whether their effect is greater than the SESOI (i.e., minimum-effect testing) or whether the effect is too small to care about (i.e., equivalence testing). Although establishing the SESOI is a good advancement in the field of psychology, power analyses should be adapted to adequately reflect the hypotheses. In other words, power analyses for minimum-effect or equivalence testing should be conducted when an SESOI is determined, which will result in larger sample sizes compared with power analyses for NHST. Using a CI-focused approach and simulations, I have shown that power analyses for the specific SESOI might not be sufficient to adequately address the hypotheses that are derived when an SESOI is established.
In this simulation study, I focused on raw mean differences varying between 0 and 2 and equal standard deviations of 2 for each group. Results showed that for a raw mean difference of 0.5, the statistical power was higher for equivalence testing compared with NHST, indicating that similar sample sizes will suffice for each type of test. The difference in statistical power between equivalence testing and NHST for a raw mean difference of 0.5 is due to the different alpha levels (equivalence testing uses 90% CI, and NHST uses 95% CI). However, note that the size of the raw mean difference in relation to the SESOI and the standard deviation plays a crucial role. Specifically, as the raw mean difference approaches the SESOI, the more participants are required to establish equivalence. Furthermore, smaller standard deviations increase the statistical power to establish equivalency, whereas greater standard deviations lower the statistical power. This also holds for minimum-effect testing, even though simulations showed that more participants will always be necessary for this type of analysis compared with NHST. Hence, of crucial importance when conducting a power analysis is to understand the variation of the measurement procedure when conducting a power analysis (Lakens, 2022a). If the standard deviation is currently unknown, an exploratory study to examine this variation might be required before power analyses are conducted (Scheel et al., 2021).
The simulations highlight that minimum-effect testing is simply an extension of the NHST wherein the nil is replaced by the SESOI, which in this case, was a raw mean difference of 1. Specifically, the power analyses for an NHST with a raw mean difference of 1 (SD = 2) as an effect size yielded the same power as the minimum-effect test with a raw mean difference of 2 as the effect size. The same statistical power for both tests is expected because they both are examining a raw mean difference of 1. In other words, in the NHST power analysis, it is examined how often the simulations had a 95% CI greater than 0, whereas in minimum-effect testing, it was examined how often the simulations had a 95% CI greater than 1. Hence, using the CI approach, it becomes clear how minimum-effect testing is an extension of the NHST. Moreover, the CI approach allows researchers to easily examine whether their findings are equivalent (90% CI smaller than SESOI), statistically significant (95% CI does not include 0), and/or practically relevant (95% CI greater than SESOI).
Another important, albeit difficult, step in a power analysis is to establish what the SESOI should be. That is, it is probable that entire research lines should be devoted to establishing the SESOI for a particular field to obtain solid estimates (Lakens, 2022b). However, I argue that scientists should be able to provide better SESOI estimates than relying on benchmarks (Panzarella et al., 2021). Moreover, the estimate of the SESOI does not have to be perfect, but when researchers provide their justifications for the SESOI, a scientific discourse is possible on fine-tuning the SESOI. One way that can facilitate establishing an SESOI is to focus on unstandardized effect sizes because they are more intuitive in terms of understanding the magnitude (Baguley, 2009; Greenland et al., 1986, 1991; Pek & Flora, 2018; Schäfer, 2023). For instance, in the example of the study on the effects of alcohol on memory, it is easier to understand the magnitude of the effect when described in amount details correctly remembered than using standardized effect sizes (e.g., Cohen’s d = 0.5). Using unstandardized effect sizes, researchers should be able to reflect which effect sizes may be theoretically or practically relevant because of their expertise. Moreover, I encourage researchers to estimate a SESOI and justify it with cost-benefit analyses even when uncertain to open the discussion with other researchers and stakeholders (e.g., legal professionals in eyewitness memory) about what the SESOI should be (Chin, 2023).
Broader Applications
In this article, I showed how to conduct power analyses using unstandardized effect sizes in a CI-focused approach via simulations for a simple between-group-subjects design. Conducting power analyses using unstandardized effect sizes will be beneficial because such effect sizes are more interpretable in terms of understanding the contextualized magnitude of an effect, which will facilitate establishing the SESOI (Baguley, 2009; Greenland et al., 1986, 1991; Pek & Flora, 2018; Schäfer, 2023). The code to conduct simulations for single parameters (i.e., only 1 raw mean difference, SD N, etc.) or multiple parameters is provided on the OSF (https://osf.io/nzupw/) and can be adapted to researchers’ needs. That is, the benefit of simulations and the CI-focused approach is that it can be readily adapted to different areas of research and study designs (Smiley et al., 2023). When using the CI-focused approach, researchers can conduct power analyses for equivalence and minimum-effect tests for any type of study design (e.g., see “negligible” package of Alter & Counsell, 2023). As long as the researchers have an unstandardized SESOI, variation of their measurement procedure, and their study design, they can use the simulation-based approach to calculate their sample size based on their justified significance level and desired statistical power.
For instance, the simulation-based power analyses using the CI approach can easily be adapted to other research designs, such as dependent sample tests, correlational studies, and multilevel-modeling studies (for examples and code, see https://osf.io/nzupw/). The steps for the simulation-based power analysis for a dependent sample t test are quite similar to the ones for the independent sample t test. That is, the focus is on a raw mean difference between experimental and control items (within-subjects factor) for a given sample size and standard deviation. However, for dependent sample t tests, researchers need to estimate how much the within-subjects variables correlate with each other. For a simple correlation study, the simulation of data is slightly more difficult because it is constructed using standardized effect sizes (e.g., Pearson r). Using standardized effect sizes makes it more difficult to establish what the SESOI is, and a focus on the unstandardized regressions coefficient might be more fruitful. Hence, the provided R code allows researchers to perform the simulation-based power analyses and then get the average unstandardized regression coefficient, which can then be compared with the SESOI. 10
Although some of the simulations provided in the article can be derived analytically, the simulations provide additional important information that might be lost in analytical solutions. First, the simulation-based power analyses force researchers to think about the data set they will acquire from the experiment they intend to conduct (e.g., expected variation, type of variable). This is achieved when researchers can simulate data sets that reflect the data set they will eventually obtain, which means the individual-participant data. Second, the proposed simulation-based power-analysis approach pushes researchers to conduct power analyses for unstandardized effect sizes, which are more intuitive than unstandardized effect sizes and facilitate determining the SESOI (Baguley, 2009; Greenland et al., 1986, 1991; Pek & Flora, 2018; Schäfer, 2023). Third, existing software such as TOSTER (Caldwell, 2022) cannot perform all computations (e.g., when true effect is smaller than SESOI). Fourth, and most important, the simulations allow for the simple integration of the CI approach in the power analyses, which makes sample-size estimation for equivalence and minimum-effects testing easier. That is, when researchers grasp the use of CIs wherein a 90% CI smaller than the SESOI means equivalence and a 95% CI greater than the SESOI means minimum-effect testing, it can be easily extended to other types of analyses. Last, when research questions become more complex (i.e., multilevel modeling, structural equation modeling), analytic solutions are not possible, and researchers need to rely on simulations. The simulation-based power analyses for simple research designs provided in this article will help researchers to set the first step toward more complex designs.
To show how the CI approach can be used in simulation-based power analyses for equivalence and minimum-effect testing in more complex designs such as multilevel models, I provided an example on OSF (see https://osf.io/nzupw/). For more complex designs, the steps are basically the same. First, researchers need to address which effect(s) they are specifically interested in and what the associated SESOIs are for each variable (fixed effect, random slope, etc.). Then, they need to simulate data that accurately represent the data from the study they intend to conduct. Subsequently, multiple data sets need to be generated and analyzed using a multilevel-modeling approach as the researchers intend to do when they collect the data. Last, the CIs of the parameters of interest need to be extracted and compared against the SESOI to determine the statistical power for equivalence and minimum-effect testing. However, in multilevel models, researchers will need more information about the fixed- and random-effect parameters to conduct the simulations, which may need to be derived from previous or pilot studies (Lane & Hennes, 2018). Moreover, researchers need to specify for what specific effect (fixed effect, interaction, random intercept, random slope, etc.) they are conducting the power analysis. Because there are multiple fixed and random effects that researchers will have to provide, sensitivity analyses are recommended to examine how power may change with, for example, varying random slopes (for an extended explanation, see Lane & Hennes, 2018). This will provide information on how robust the design will be when certain parameters for the power analyses deviate. Similar steps are necessary to conduct simulation-based power analyses using the CI approach for structural equation models, but in this case, the focus might be on factor loadings, measurement noninvariance, or other variables of interest. That is, when researchers can simulate the data that represent the data they intend to collect, they can analyze the data sets, extract the CIs for the parameters of interest, and compare it against the SESOI.
Recommendations
To go beyond the reliance on statistical significance to interpret effects (e.g., Riesthuis et al., 2022), I recommend that researchers start to establish what the contextualized SESOI is for their specific field or study (for an overview on how to set the SESOI, see Lakens et al., 2018). To establish the SESOI, I recommend the use of unstandardized effects sizes because they are more robust, intuitive, and easier to calculate compared with standardized effect sizes (Baguley, 2009; Greenland et al., 1986, 1991; Pek & Flora, 2018; Schäfer, 2023). Furthermore, the SESOI should be determined before the research is conducted to avoid HARKing (Kerr, 1998) and should be preregistered. When researchers have established an SESOI, they need to determine their research question. That is, when an SESOI is determined, the most interesting hypotheses are based on whether an effect is practically or theoretically meaningful (i.e., minimum-effect testing) or is too small to care about (i.e., equivalence testing) instead of a focus on NHST. Then, they can use the SESOI in the provided CI-focused simulation-based power analyses for either minimum-effect testing or equivalence testing to determine the required sample size. Note that sample sizes for minimum-effect or equivalence testing will inevitably be larger than when power analyses are conducted for NHST. Another recommendation is to share the R code for the power analyses to ascertain its reproducibility.
When researchers have conducted their study, I also recommend them to use the CI approach to analyze their data. When examining the CI, researchers can immediately see whether the finding is statistically significant (95% CI does not include 0), practically or theoretically relevant (95% CI greater than SESOI), or equivalent (i.e., 90% CI smaller than SESOI). Moreover, the CI approach allows researchers to examine the precision of their estimates wherein wider CIs mean lower precision and smaller CIs indicate higher precision (but see Jané et al., 2024). The CI approach in terms of power and data analysis can be used for any type of research design, ranging from simple independent sample t tests to multilevel modeling (e.g., see https://osf.io/nzupw/).
Conclusion
Recent developments have urged researchers to contextualize their effect sizes and establish what the SESOI is for their specific field. Having a SESOI will not only make hypotheses more specific (i.e., show there is an effect greater than the SESOI or equivalence) but also will require changes in the power analyses to reflect these hypotheses. In this article, I have shown that conducting power analyses using the SESOI in a NHST might not always be sufficient to answer such questions and that larger sample sizes will be necessary to conduct minimum-effect or equivalence tests. Moreover, I have demonstrated how simulation-based power analyses can be conducted to accurately determine the sample size necessary to adequately test hypotheses that are based around a SESOI. These power analyses for minimum-effect testing or equivalence testing will improve the statistical inferences in psychological research.
Footnotes
Transparency
Action Editor: David A. Sbarra
Editor: David A. Sbarra
Author Contributions