
Abstract
Behavioral scientists looking to run online studies are confronted with a bevy of options. Where to recruit participants? Which tools to use for survey creation and study management? How to maintain data quality? In this tutorial, we highlight the unique capabilities of market-research panels and demonstrate how researchers can effectively sample from such panels. Unlike the microtask platforms most academics are familiar with (e.g., MTurk and Prolific), market-research panels have access to more than 100 million potential participants worldwide, provide more representative samples, and excel at demographic targeting. However, efficiently gathering data from online panels requires integration between the panel and a researcher’s survey in ways that are uncommon on microtask sites. For example, panels allow researchers to target participants according to preprofiled demographics (“Level 1” targeting, e.g., parents) and demographics that are not preprofiled but are screened for within the survey (“Level 2” targeting, e.g., parents of autistic children). In this article, we demonstrate how to sample hard-to-reach groups using market-research panels. We also describe several best practices for conducting research using online panels, including setting in-survey quotas to control sample composition and managing data quality. Our aim is to provide researchers with enough information to determine whether market-research panels are right for their research and to outline the necessary considerations for using such panels.
Keywords
When behavioral scientists run a study today, finding participants online is about as common as any other method. This is thanks largely to the remarkable growth in online research tools over the last 20 years (e.g., Chandler et al., 2019; Krantz & Dalal, 2000; Litman & Robinson, 2020a). Here, we provide background and a tutorial for how to use an extremely powerful yet relatively underused tool for online sampling: market-research panels. Unlike the microtask platforms most academics are familiar with—MTurk, Prolific—market-research panels provide access to broad swaths of the population in many countries around the world. Furthermore, because panels are exponentially larger than microtask sites, they enable researchers to control sample composition and to reach specific segments of the population in ways that smaller platforms cannot. To effectively use market-research panels, however, researchers need to understand panel strengths and weaknesses and adjust some aspects of data collection. The goal of this tutorial is to provide the knowledge needed to understand panels and to show researchers how to sample effectively and efficiently.
Tutorial Overview
We begin with an overview of market-research panels and how they operate. Then, we introduce terms and concepts that are important in online panels but seldom apply to microtask sites. Afterward, we demonstrate how to set up a study on a panel website. Finally, we walk through the steps required to integrate a survey’s programming with an online panel. This integration may be the biggest difference between using market-research panels and microtask sites for participant recruitment. Because proper integration enables researchers to do things such as screen participants using novel demographics, set up quotas to control sample composition, and manage data quality, we provide a step-by-step guide for accomplishing each of these tasks.
This tutorial does not assume any prior knowledge beyond basic familiarity with or interest in online participant-recruitment platforms. Prior experience with survey-software platforms such as Qualtrics is helpful but not required. Readers who are interested in a guide for creating online studies using platforms such as Qualtrics can find a variety of resources online (e.g., Baker, 2021; Qualtrics, 2022; Snow, n.d.) in various media formats (e.g., user guide, YouTube tutorial, knowledge base). Readers searching for a more basic introduction to online participant recruitment can consult a variety of published articles (e.g., Buhrmester et al., 2011; Evans & Mathur, 2005; Litman & Robinson, 2020b; Paolacci & Chandler, 2014).
Brief Overview of Market-Research Panels
Perhaps the first thing to know about market-research panels is that they are big—really big. Whereas platforms like MTurk have about 100,000 U.S. participants per year (Robinson et al., 2019), market-research panels have tens of millions (Chandler et al., 2019; Coppock & McClellan, 2019). Given their size, panels enable studies that are difficult or impossible on smaller platforms. For instance, researchers can easily gather large samples with multiple quotas matched to the U.S. census; sample people in more than 100 countries; target participants within specific U.S. cities, zip codes, or designated market areas (e.g., Litman, Hartman, et al., 2020); recruit people from hard-to-reach demographic groups (e.g., Johnson et al., 2021; Potter et al., 2020); and even gather data from hundreds of thousands of people within days (e.g., Katz et al., 2020).
How do panels maintain such large and diverse groups of participants? The answer is aggregation. Most of the online panels gaining popularity among academics—Lucid, Dynata, Qualtrics Panels, Prime Panels—are not single panels but aggregators of panels. Aggregators offer access to a larger pool of more diverse participants than any one panel alone. Aggregation is also essential for reaching people in low-incidence demographic groups and for controlling study costs. In short, market-research panels could not offer the sampling scale and flexibility that is their strength without aggregation.
Finally, another thing to know about panels is that they provide extensive options for targeted recruitment of specific populations. These options include screening for demographic characteristics within the survey, using extensive quotas to control sample composition, and terminating the participation of people who provide poor-quality data. We demonstrate how to implement each of these strategies for sampling after introducing some basic market-research terms.
Basic Terminology
Study traffic
Once a study goes live, panels route participants to the survey. Panels refer to this flow of participants as “study traffic.” Although panels often route participants to hundreds, if not thousands, of studies at any given time, the panel’s goal is for each study to fill the requested sample quickly and efficiently. The survey integrations we demonstrate below help ensure a steady flow of traffic even when researchers are targeting a hard-to-reach sample.
Targeting participants: Level 1 and Level 2 screening
When participants sign up with a panel (i.e., “opt in”), they provide demographic information. Then, after validating their account (known as a double opt-in), panels begin inviting them to participate in studies (i.e., routing them to studies).
Researchers who launch a study can use the demographic data gathered by the panel to target participants in what we refer to as “Level 1” targeting. Level 1 targeting occurs when researchers recruit participants using demographic information participants have shared with the panel (e.g., being a parent). This sort of profiling and targeting is common across virtually all online platforms. However, because panels cannot possibly profile participants on all the characteristics researchers may want to target, they allow researchers to screen participants within a study—what we refer to as “Level 2” targeting (e.g., being the parent of an autistic child). Level 2 targeting occurs when participants are profiled within the survey. This type of targeting is essential to the flexibility that panels provide and leads to a concept important in market research but nearly nonexistent in microtask sites: incidence rate.
Incidence rate
Incidence rate refers to the percentage of study traffic that qualifies for a study. In other words, it is the percentage of people who pass within-survey screening questions (i.e., pass Level 2 targeting) and are qualified to take the full study.
For example, in a general-population survey—one in which everyone is eligible to participate—the incidence rate is 100%. If a researcher were recruiting people employed full-time and used Level 1 screening to restrict the study to full-time employees, the incidence would still be 100% because incidence rate is always calculated after Level 1 targeting. If, on the other hand, a researcher wanted to recruit full-time employees who work from home, the panel probably has not profiled people on the basis of their work arrangement. And even if the panel has asked people about their work arrangement, variables such as working from home or in an office can change faster than panels can update the data. Therefore, to accurately target participants, the researcher would need to screen people within the study (i.e., at Level 2). Given that statistics show about 35% of adults in the United States currently work from home (U.S. Bureau of Labor Statistics, 2020; Wong, 2020), the incidence rate would be near 35%.
Quotas
Quotas are common in online research. Setting quotas helps control sample composition and ensures that certain groups of participants are represented within the sample at prespecified proportions.
Researchers can set Level 1 quotas by telling the panel how many participants of different demographic groups are desired during survey setup (e.g., 50% male or census-matched across gender, age, race, and education). The limitation of Level 1 quotas, however, is that they must be based on variables the panel has measured. When researchers want quotas based on variables that are measured within the study (e.g., Do you work from home?), the quotas must be administered within the survey (i.e., at Level 2). Level 2 quotas require not only that researchers construct in-survey screening questions but also that the survey is programmed to prevent oversampling groups measured at Level 2 and instead redirect participants once a Level 2 “bin” is full.
Study terminations and redirects
Panels allow researchers to direct participants out of a study at various points and for various reasons. Participants may, for example, be directed out of a study because they do not meet the qualification criteria (e.g., do not work from home). This is an example of a “standard” redirect. Other reasons for redirecting participants out of a study are because a demographic quota within the study has been filled (e.g., 50% of the target sample already identifies as male, an “over quota” redirect) or because they have failed measures of data quality (a “quality” redirect). Although redirects are common across participant platforms and popular in survey-building software (e.g., Qualtrics), it is crucial that redirects are properly configured because panels use a set of standardized codes, embedded within redirect URLs, to track why participants have been routed out of a study. The information that panels glean from redirected participants is used to adjust study traffic. Thus, properly setting terminations and redirects makes data collection with online panels more efficient.
Length of interview
Two things drive costs in studies that use market-research panels: incidence rate and length of the interview, or how long the study lasts. The typical market-research study lasts 10 to 15 min. Studies longer than 20 min are not uncommon but may begin to experience higher dropout.
Disclosures
We (with the exception of D. Hauser) are academic psychologists who work at CloudResearch—a for-profit company that supplies online research tools and access to participants. Our experiences in this space allow us to see that academics are increasingly using online panels but encountering problems understanding how these panels operate and how best to use them. Thus, the goal of our tutorial is to document the often-undocumented knowledge that is required for using online panels effectively. We do not advocate for the use of any specific platform in this article, but we do use Qualtrics survey programming and CloudResearch’s Prime Panels to illustrate the concepts we discuss. In the supplemental online materials (see: https://osf.io/7uyj3/), researchers can find instructions for how to accomplish all the integrations demonstrated in this tutorial when using the alternative survey tools Alechmer (formerly SurveyGizmo) and QuestionPro. In addition, other participant platforms that offer similar recruitment services as Prime Panels include Dynata, Lucid, and Cint. Finally, a video version of the tutorial below is available online at https://youtu.be/GNZJk3JS6Ts.
An Example Panel Study on Prime Panels
An example study allows us to describe the capabilities of market-research panels while demonstrating how researchers need to adjust their data-collection methods when using online panels. Our example study seeks to recruit 500 parents in the United States, half of whom have children diagnosed with autism spectrum disorder and half of whom do not. We will employ quotas to ensure that half of the sample consists of mothers and the other half of fathers. The final sample will look like the display in Table 1.
Sample Plan for Example Study

Our study will be set up on CloudResearch’s Prime Panels platform. Prime Panels is one of a few “do-it-yourself” tools for sampling from market-research panels—Lucid, CINT, and Dynata offer others, but these tools all differ in their functionality and ease of use. Historically, studies run on market-research panels have required researchers to contract with a research service to manage data collection (see Litman, Robinson, & Rosenzweig, 2020a), and this is still true for more complex studies today. Regardless of whether a panel study is run via a do-it-yourself tool or when contracting with a research service, the within-survey setup we demonstrate is the same.
Platform Setup: Prime Panels
Basic information
The first step in setting up a Prime Panels study is to provide a project name and project title and to configure an end-of-study redirect. Figure 1 displays the Prime Panels interface.
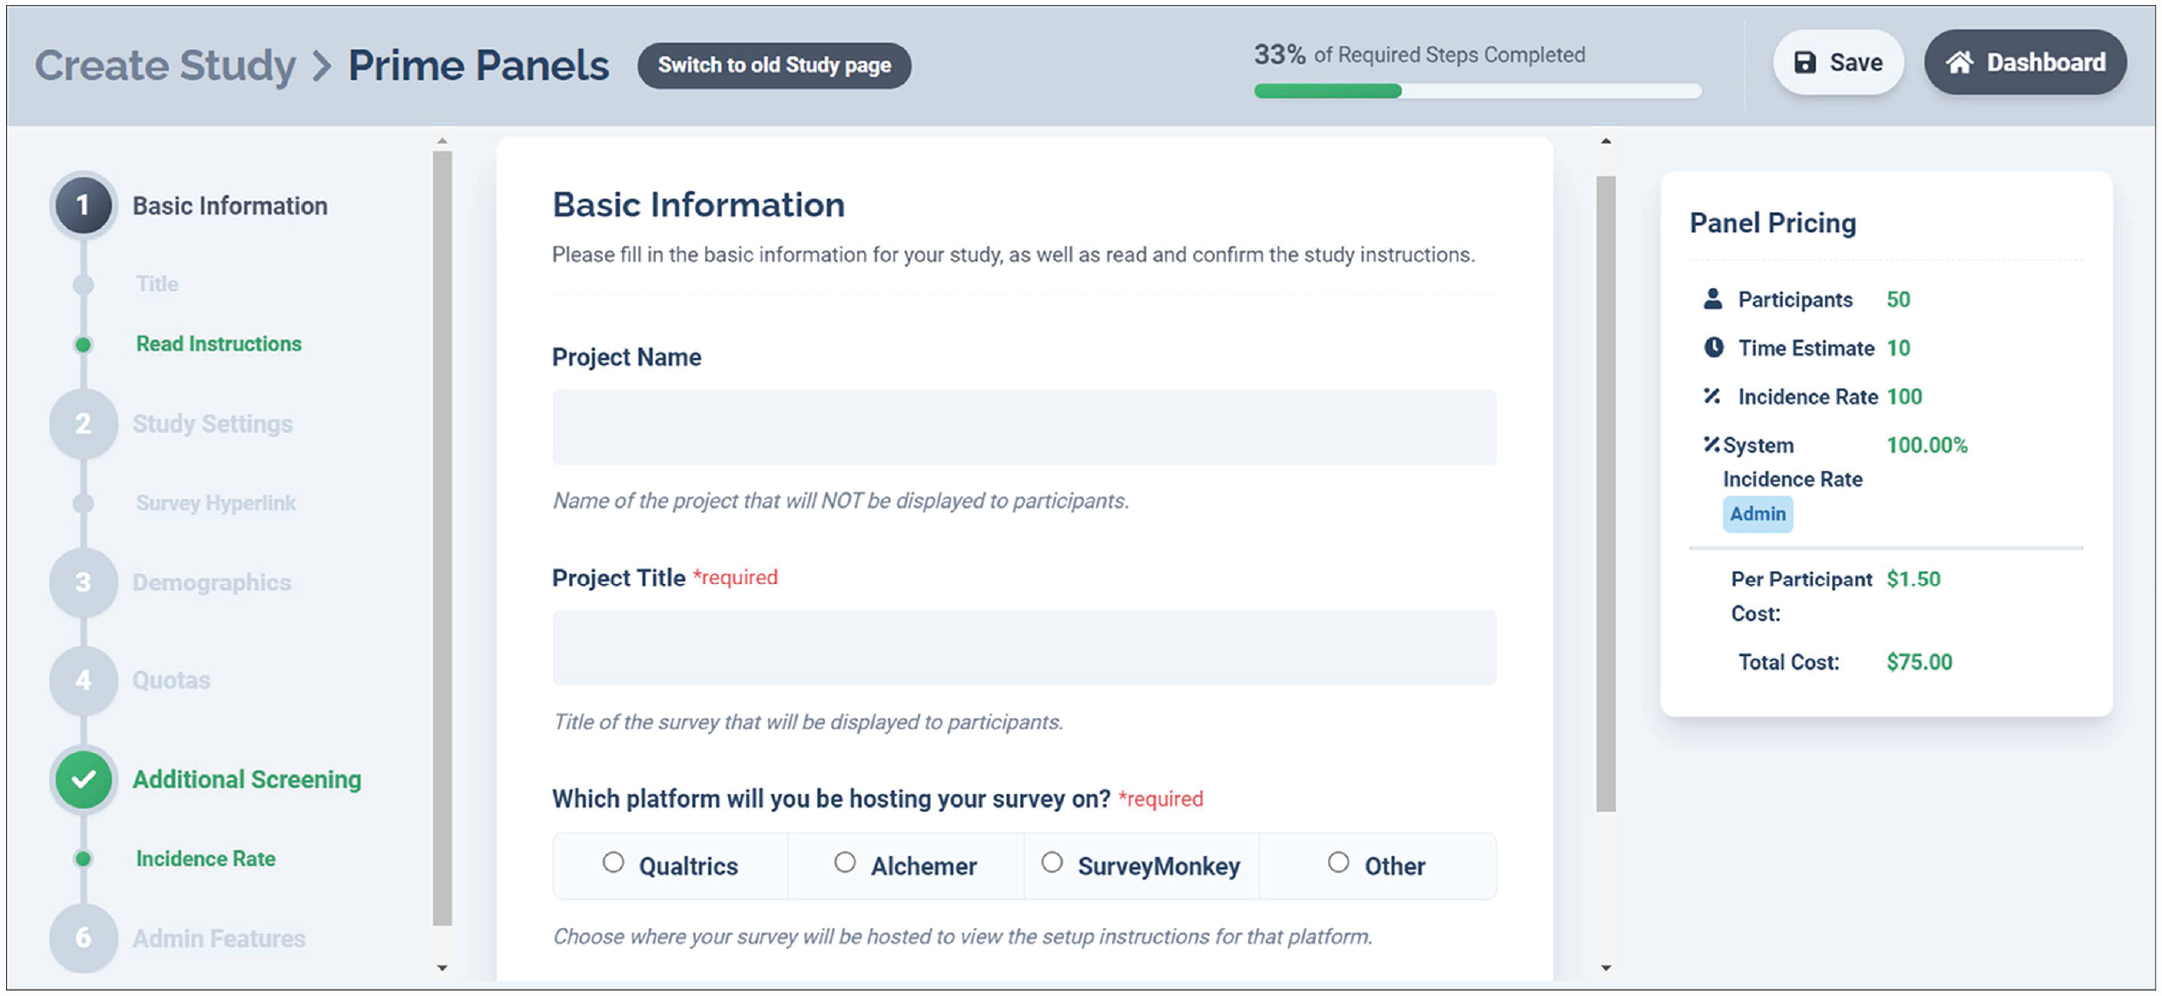
Basic information page on Prime Panels. This is the “Create a Study” page on Prime Panels. From this page, researchers can control several study settings, whereas others must be controlled within the survey platform.
End-of-study redirects are one way market-research panels differ from platforms like MTurk. On MTurk, participants show they have completed a study by finding the approval code at the end of the survey and submitting it with their task. On market-research panels, the final page within a survey is often a redirect URL that takes participants to a study-completion page administered by the panel. When participants are redirected, their unique assignment ID is recorded, and the panel receives evidence that the person has completed the study. Researchers can assess whether a participant completed the study by examining the study’s data file and examining the quality of participant responses. End-of-study redirects must be configured within the survey platform and require both capturing the participants’ assignment ID and configuring the redirect link.
To set an end-of-study redirect within Qualtrics,
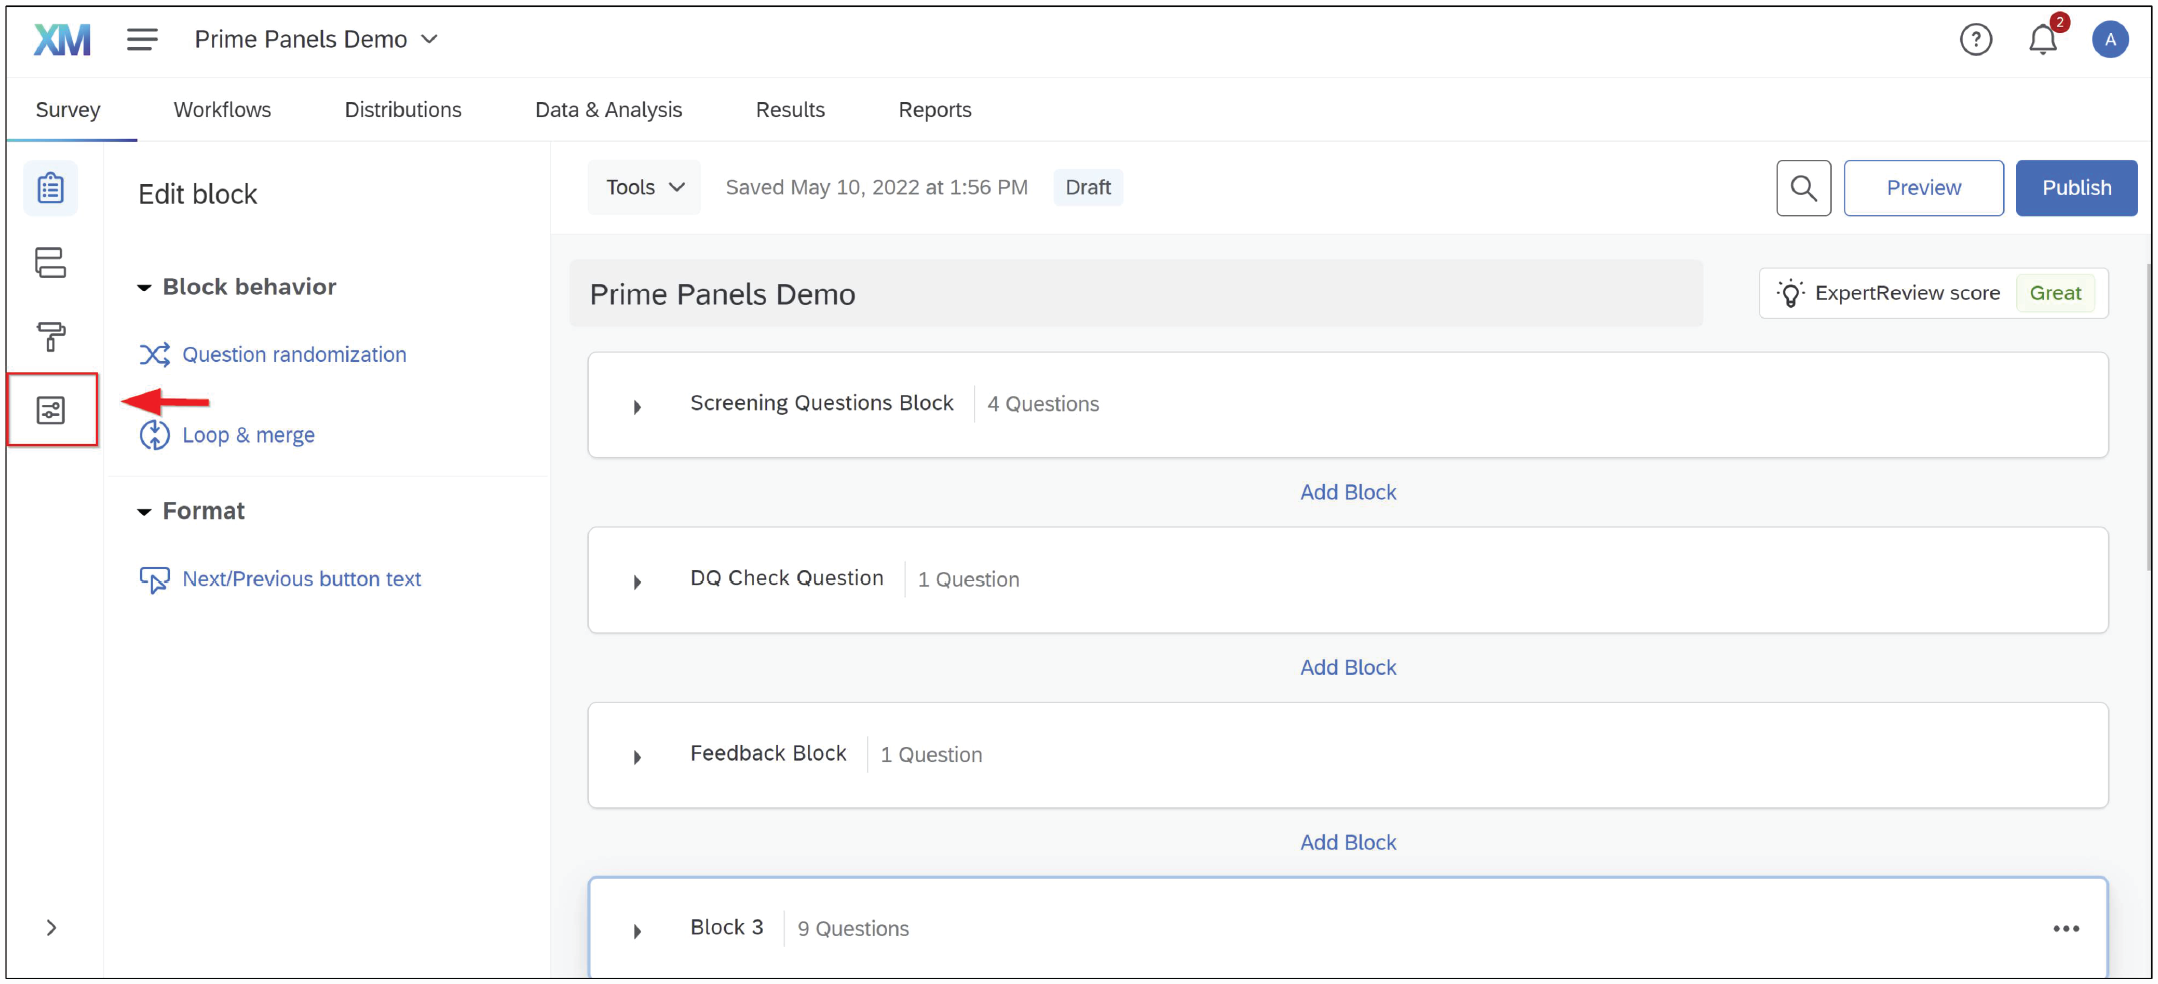
1. Enter the survey flow (see Fig. 2).
2. Add a new element and select “Embedded Data” (see Figs. 3 and 4).
3. Within the embedded data block, type “aid” as the value to be captured (see Figs. 5 and 6).
With the embedded data set up, CloudResearch will add a unique assignment ID for each participant to the survey URL they are given when routed to a survey. As the participant enters the survey, Qualtrics will automatically record the assignment ID and add it to the data file that is downloaded when the study completes. To finish programming the redirect,
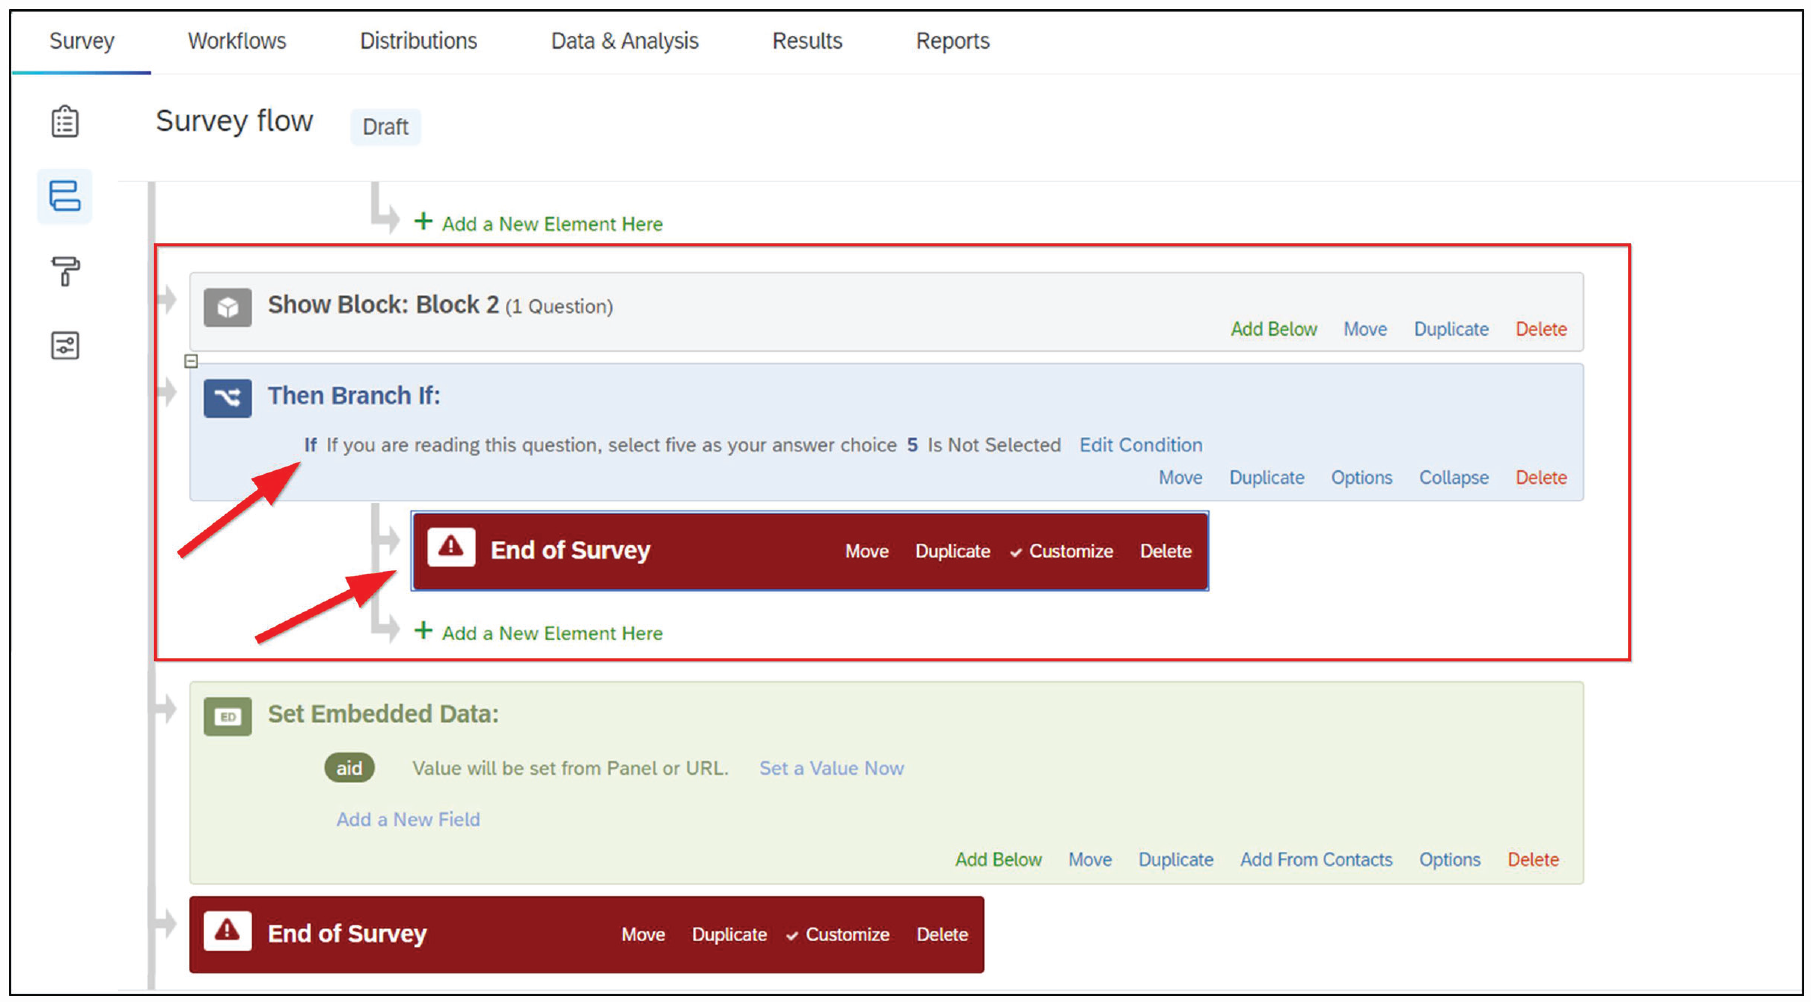
4. Navigate to the bottom of the survey flow. Click the button to create an “End of Survey” Element (see Fig. 7).
5. Select “Customize” (see Fig. 8).
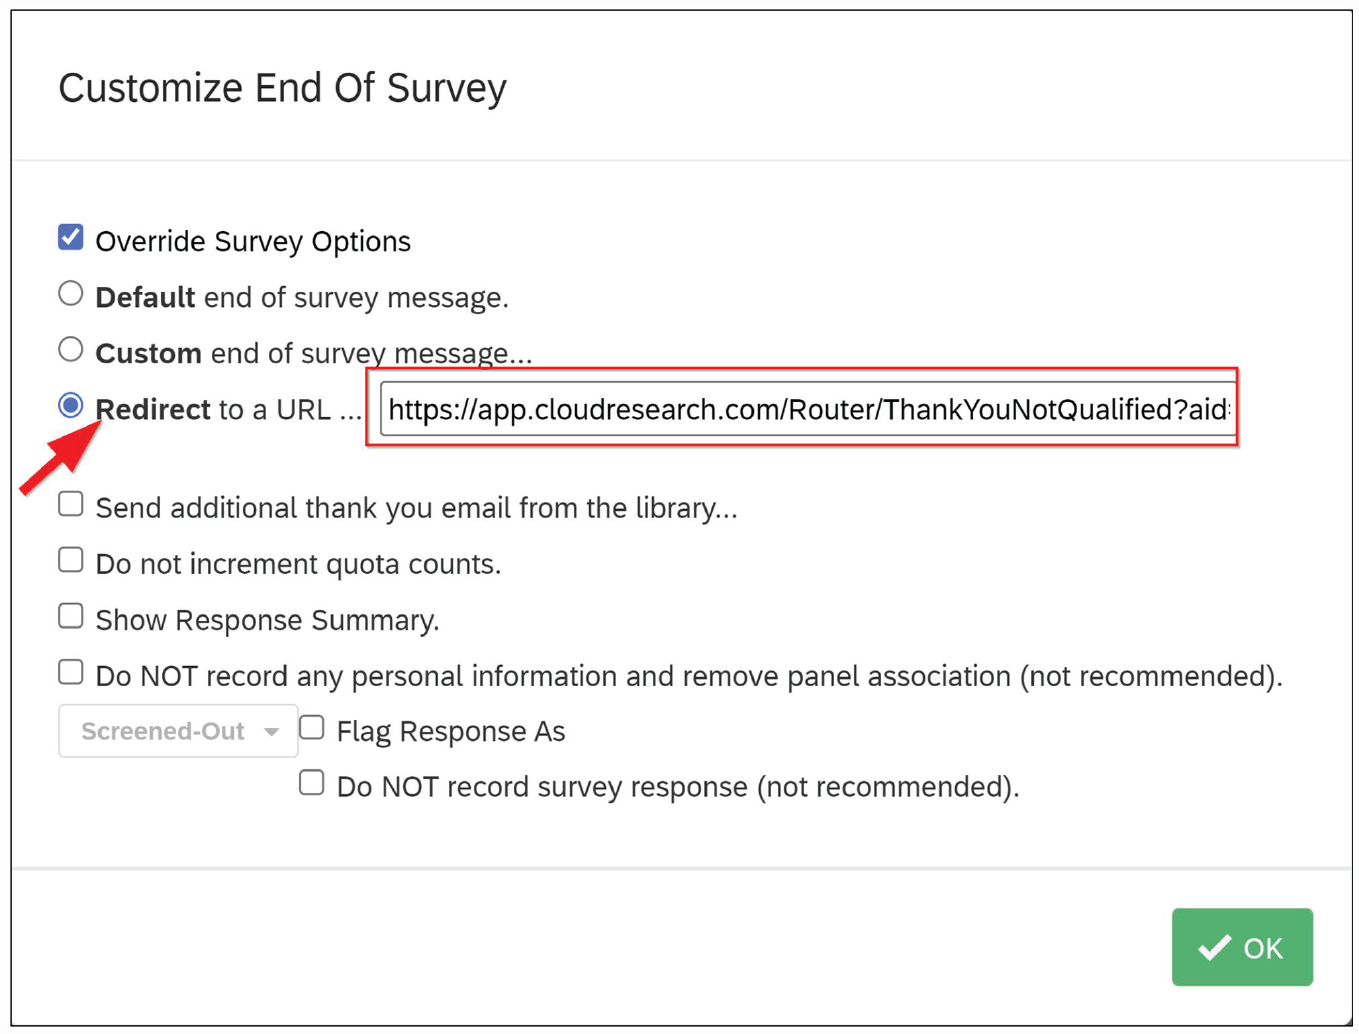
6. Choose “Override Survey Options” and then select “Redirect to a URL.” Paste the “Study completion” link from Table 2 into the redirect box (see Fig. 9).
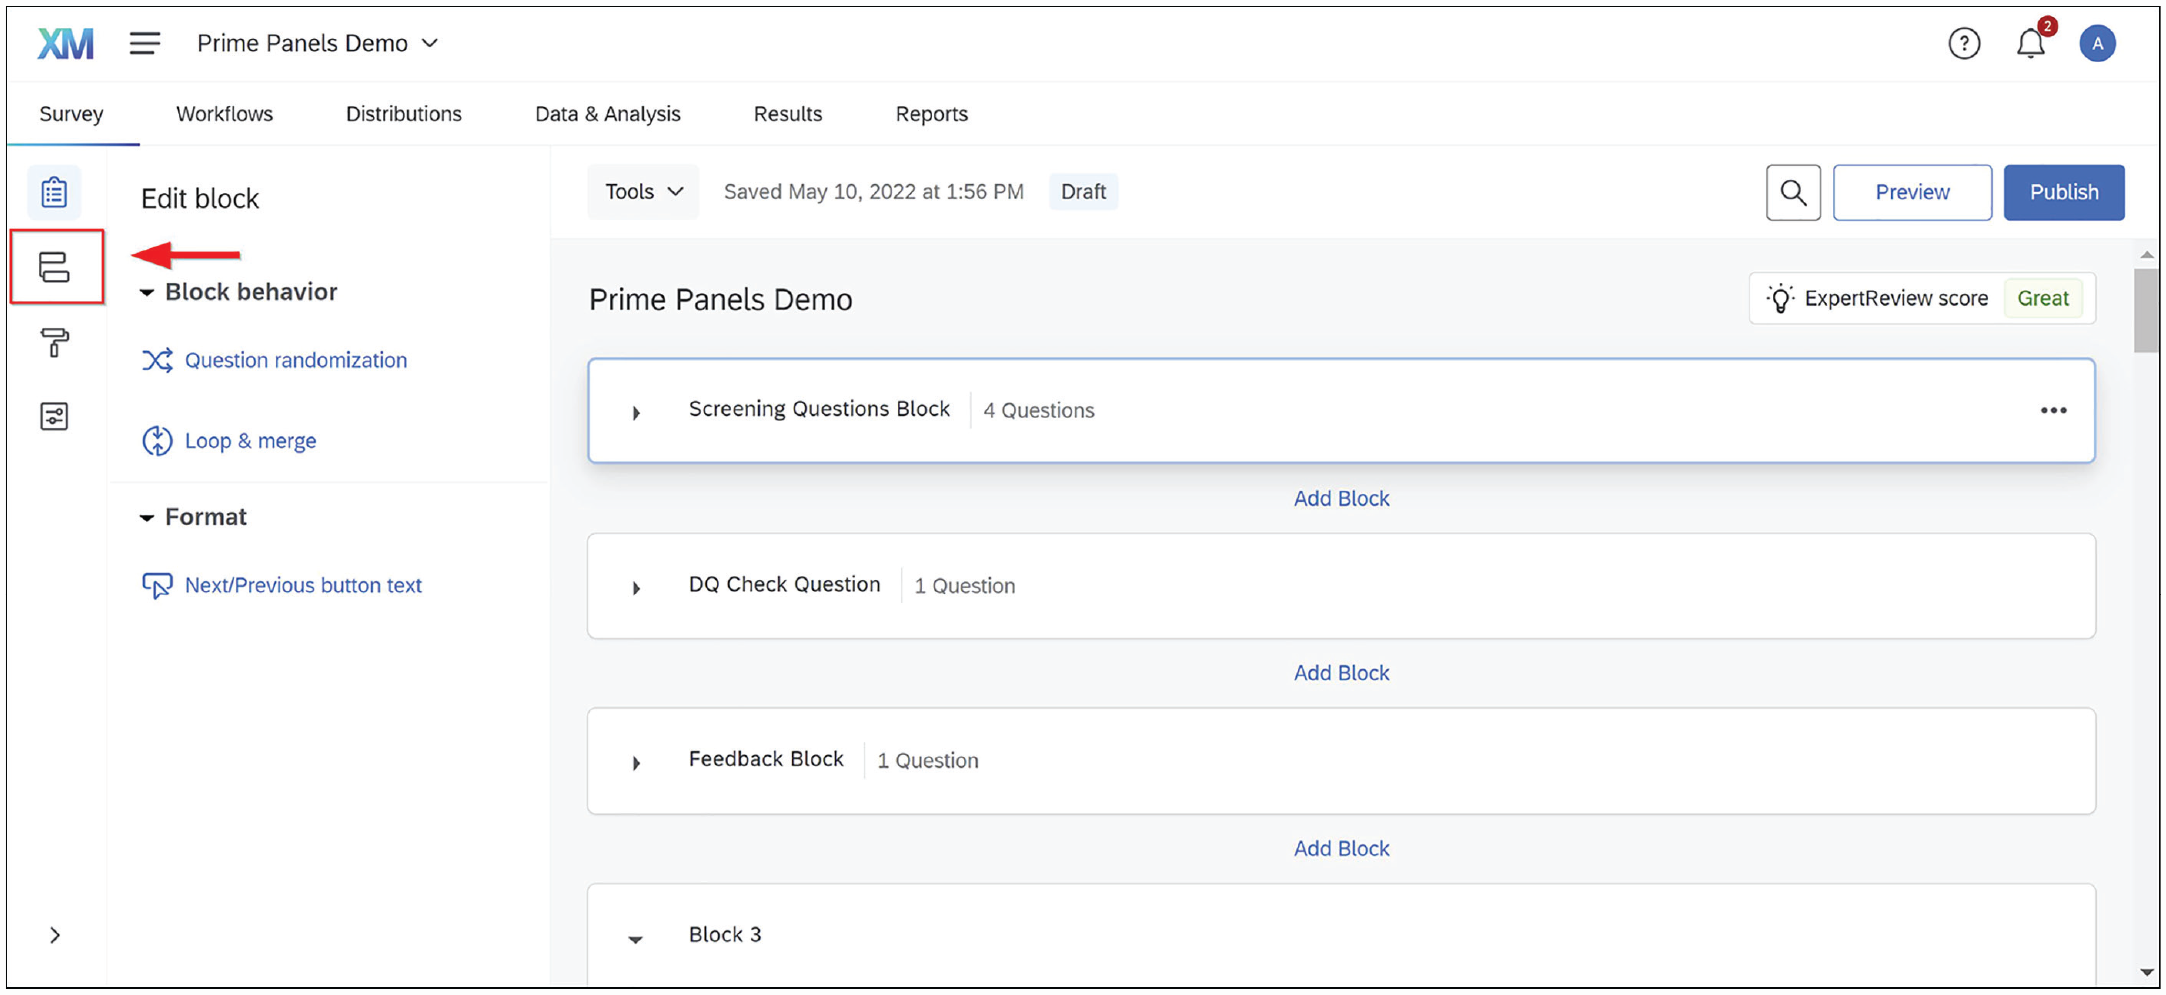
Entering the survey flow. Clicking the highlighted icon will pull up the survey flow.

Adding a survey element within Qualtrics. Adding a survey element is a common action within the Qualtrics survey flow. Here, the “Add Element” option is used to add Embedded Data.

Adding an embedded data element in Qualtrics. Embedded data allow a researcher to capture information from a participant’s URL or browser history.

Embedded data text field in Qualtrics. By typing “aid” in the embedded data box, the researcher can ensure that each person’s unique identifier is recorded from the URL.
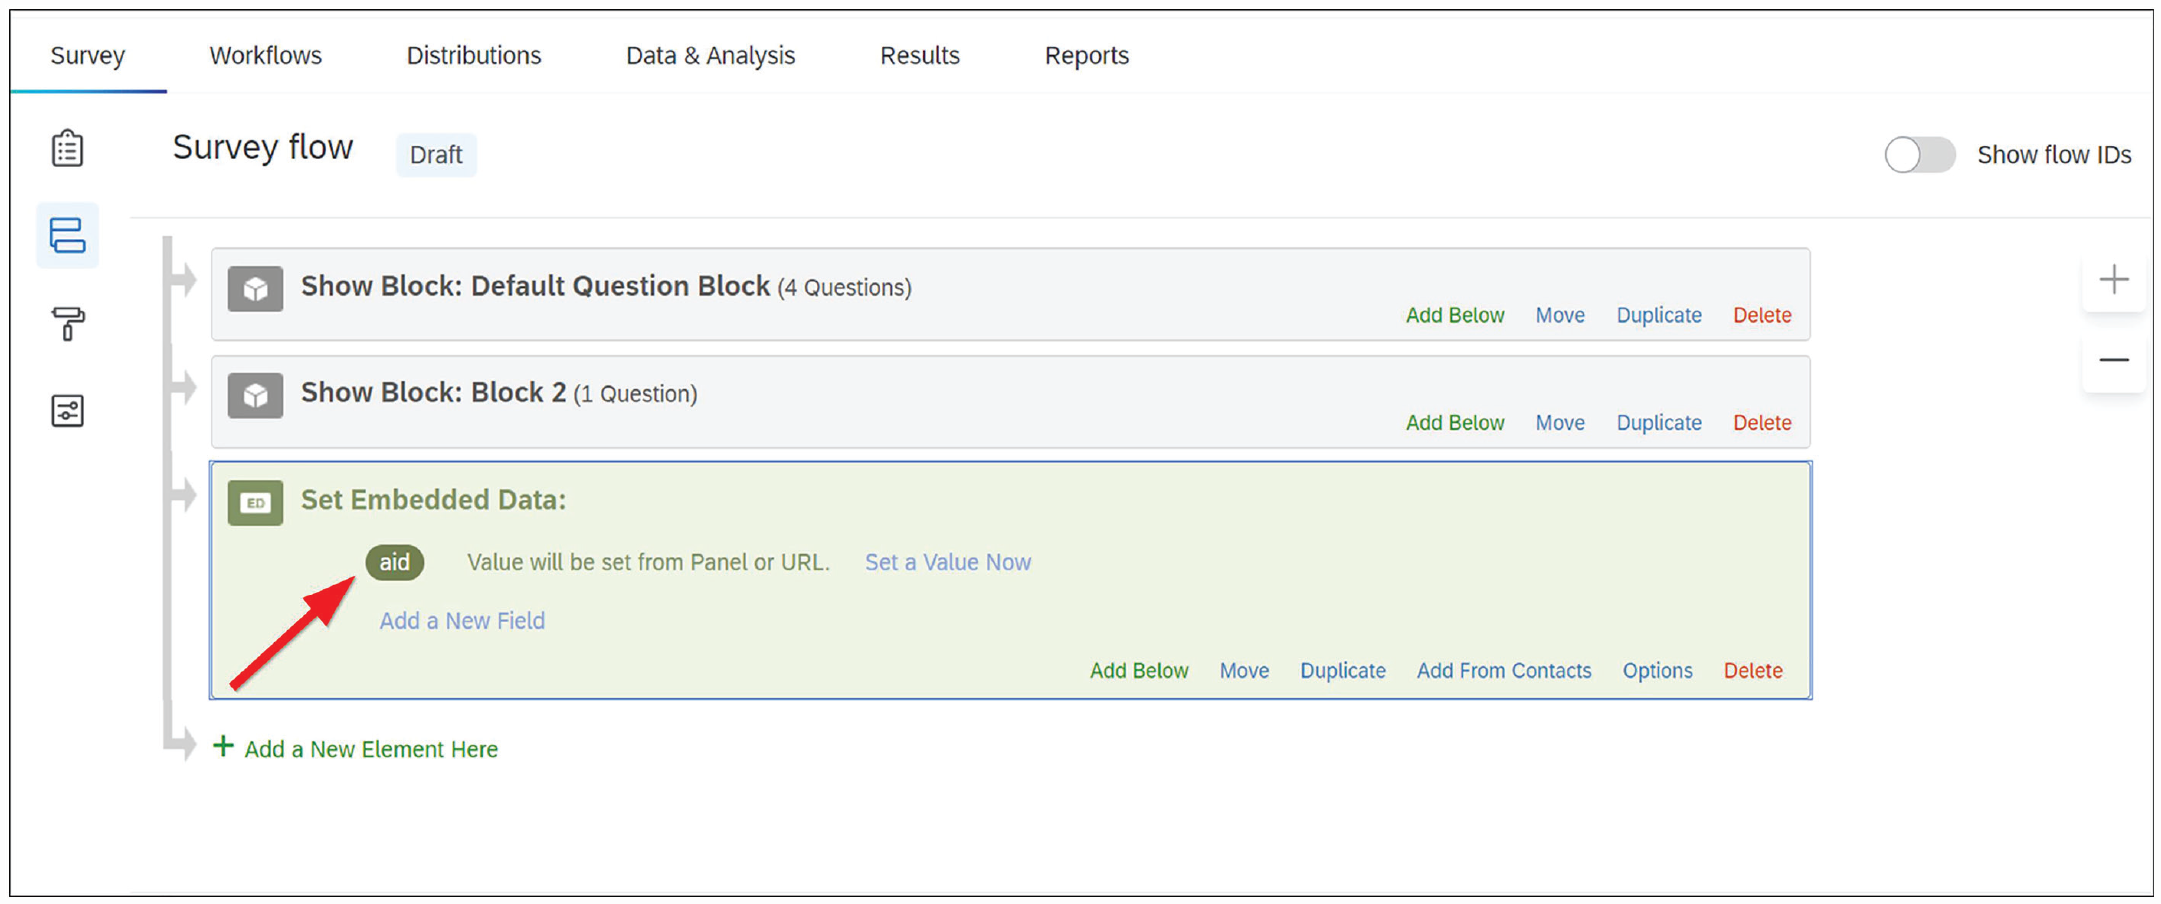
Embedded data set to capture “aid” in Qualtrics. The “aid” value is now set to be captured.

Adding an end of survey element within Qualtrics. With the embedded data set, the next step is to create an end-of-survey redirect that sends participants to a specific URL that records their participant ID.

Customize end-of-survey option in Qualtrics. To direct participants to a URL, researchers can create a “custom” end-of-survey option.
Redirect Links for Directing Participants out of a Survey


Survey redirect within Qualtrics. Redirecting participants within Qualtrics always follows the same process, but because panels use a unique URL for each type of redirect, the link to paste in this box will change. All links are in Table 2.
As shown in Figure 1, CloudResearch provides instructions for programming an end-of-study redirect in survey platforms other than Qualtrics. Regardless of the survey platform being used, the objective of an end-of-study redirect—and the other redirects we discuss below—is to route participants out of the survey and to a unique web page that relays information about the participant back to the panel. We will refer back to the process of directing participants to a unique URL several times (Steps 4–6 above).
Level 1 targeting
After configuring the study-completion redirect, researchers can provide other basic information about the study on Prime Panels, such as the desired sample size, study length, survey URL, and other self-explanatory details (see Fig. 10). The next major step involves Level 1 demographic targeting.

Study settings on Prime Panels. The study settings page on Prime Panels contains several basic study elements.
In our example, parental status is a characteristic that has been profiled by the panel. Therefore, we can use the Prime Panels “Demographics” section to target the study toward parents. By selecting all the options for parents with children under 18 years of age (see Fig. 11), we ensure that only parents will be sent to the study.

Demographic selections on Prime Panels. From the panel interface, researchers can select several demographic targeting options. Low-incidence demographics are often better targeted within the survey.
As mentioned earlier, panels cannot profile participants on all the characteristics researchers may want to use. Within Prime Panels, for instance, there is not an option to select parents of children with autism, and no panel we know of collects such information about its panelists. Therefore, we will need to use in-survey screening (i.e., Level 2 targeting) at a later step to target these participants.
Because parental status and participant gender have both been measured by the panel, we can control how many mothers and fathers end up in the final sample using quotas. To create quotas on Prime Panels,
Click the “+ Quotas” button and select the demographic characteristic(s) to be subdivided (see Fig. 12).
Select which attribute(s) participants must meet and the number of participants within each bin (see Fig. 13).

Adding quotas on Prime Panels. Several quotas can be set up on the Prime Panels interface. These quotas help control sample composition and can be based on demographic targeting or matched to the U.S. census.

Quota attributes and bin size in prime panels. Quotas for participant gender have been set to achieve a sample equally balanced between men and women. Quotas must add up to 100% of the study’s sample size.
By configuring the quota to be evenly split across men and women, we ensure a sample balanced between mothers and fathers. Researchers can set multiple quotas for different demographic characteristics or apply a template matched to the U.S. census when desirable. In general, however, adding quotas to a study slows the speed of data collection, and some bins may take longer to fill than others. In a study with a quota for participant race, for example, the African American bin would be expected to fill slower than the White bin because there are fewer African Americans in the population. The speed of data collection would be even slower if the African American sample was subdivided by a variable such as age or gender. Thus, researchers should know that the complexity of quotas can affect speed of data collection.
Level 2 targeting
Whereas Level 1 targeting allows researchers to sample specific participants, the real sampling flexibility of online panels occurs at Level 2. Level 2 targeting happens within the survey. By asking participants questions that the panel has not asked, researchers can find participants who meet highly specific criteria. Furthermore, building quotas around screening that occurs within the survey allows researchers to control sample composition with precision.
The first step in Level 2 targeting is often to determine the incidence rate. Within the Prime Panels interface, the section titled “Additional Screening” is devoted to the incidence rate and other survey screening options (see Fig. 14). As described previously, incidence rate is the percentage of participants who are expected to pass within-survey screening questions. In most cases, researchers can estimate an incidence rate by consulting base-rate statistics in the general population, conducting a pilot study to examine how many people meet specific criteria, or speaking with the panel company. Estimating the incidence rate is not an exact science, but it is important because the estimate affects feasibility and cost.

Incidence rate requirement on prime panels. Estimating the study’s incidence rate is a required field in the Prime Panels study setup.
In our example, we use in-survey screening to identify parents of children with and without autism. Because we are using Level 1 targeting to sample parents, everyone sent to the study will be a parent. The question we need to answer to determine the incidence rate is what percentage of parents who have children under 18 also have a child diagnosed with autism. Statistics suggest about 2% of U.S. parents have a child diagnosed with autism (Centers for Disease Control and Prevention, 2020). Thus, we can estimate the overall incidence rate to be near 4% because half of our sample (parents of children without autism) will be gathered at an incidence rate of 98% (250 / .98 = 255) and half (parents of children with autism) will be gathered at a rate of 2% (250 / .02 = 12,500). This means we will screen approximately 12,750 people to identify 500 who meet our study’s criteria.
Accurately estimating the incidence rate is important for multiple reasons. First, the incidence rate tells the panel what percentage of participants may complete the study. Panels use this information to assess how much traffic the study will require to reach its desired sample (in this case, around 13,000 parents). Another reason incidence rates are important is because they influence cost. Within virtually all online platforms, price is determined by the length of the study and the difficulty of reaching the desired sample. If a study is launched that dramatically misestimates either length or incidence rate, participant completion rates will be low, and the panel will eventually slow or stop traffic. If this happens, the study will be stalled until adjustments are made.
After entering an incidence rate, the next step in Level 2 targeting is to configure the in-survey screening questions and a URL to redirect unqualified participants. Screening questions should occur at the start of the study, remain brief, and send unqualified participants to a specific URL. Panels often direct excluded participants to a new study or provide them with partial compensation. By redirecting people who do not qualify back to the panel, researchers communicate to the panel why the participant was excluded. In addition, when combined with the estimated incidence rate, redirect data help panels adjust study traffic.
In our example, we want to sample parents who have children with autism spectrum disorder as well as parents who do not have children with autism spectrum disorder. This means that rather than redirect participants because of their answers to our focal screening criteria (as most studies do), we will use in-survey screening to confirm other characteristics and rely on quotas in a later step to control the number of parents who participate in the study. To screen participants, we created some short screening questions (see Fig. 15). These questions (a) confirm the Level 1 targeting information, (b) ask whether people have children diagnosed with autism, and (c) give participants little to no idea which characteristics may make them eligible for the study. Because dishonest participants sometimes seek to maximize their odds of qualifying for a study by selecting most or all answer options (e.g., Sharpe et al., 2017), anyone who selects several unrealistic answer choices should be redirected from the study. Blogs and other website content created by online participant providers often contain general advice for constructing survey screening questions (e.g., Gitlin, n.d.; Moss, 2021).

Example screening questions. Screening questions within the survey can be used to target specific study participants. Typically, people who do not possess critical characteristics are redirected from the study.
To redirect unqualified participants within Qualtrics,
Enter the survey flow (see Fig. 2).
Under the block with screening question(s), add a branch (see Figs. 16 and 17).
Within the branch, select the answer option(s) that make people ineligible for the study (see Fig. 18). In this case, it is anyone who does not identify as a parent.
Beneath the branch, click “+ Add a New Element Here” and choose “End of Survey” (see Figs. 19 and 20).
Select “Customize” and “Override Survey Options.” Paste the “Unqualified Participant” link from Table 2 into the redirect box (see Fig. 21).

Adding an element below the screening block in Qualtrics. To redirect people who are not eligible for the study, researchers can create an “End of survey” option beneath the block with screening question.

Adding a branch within Qualtrics. To configure the criteria that qualify or disqualify participants, researchers need to add a “Survey branch.”

Setting survey flow to redirect unqualified participants. Within the survey branch, select the answer options that make a participant ineligible for the survey.
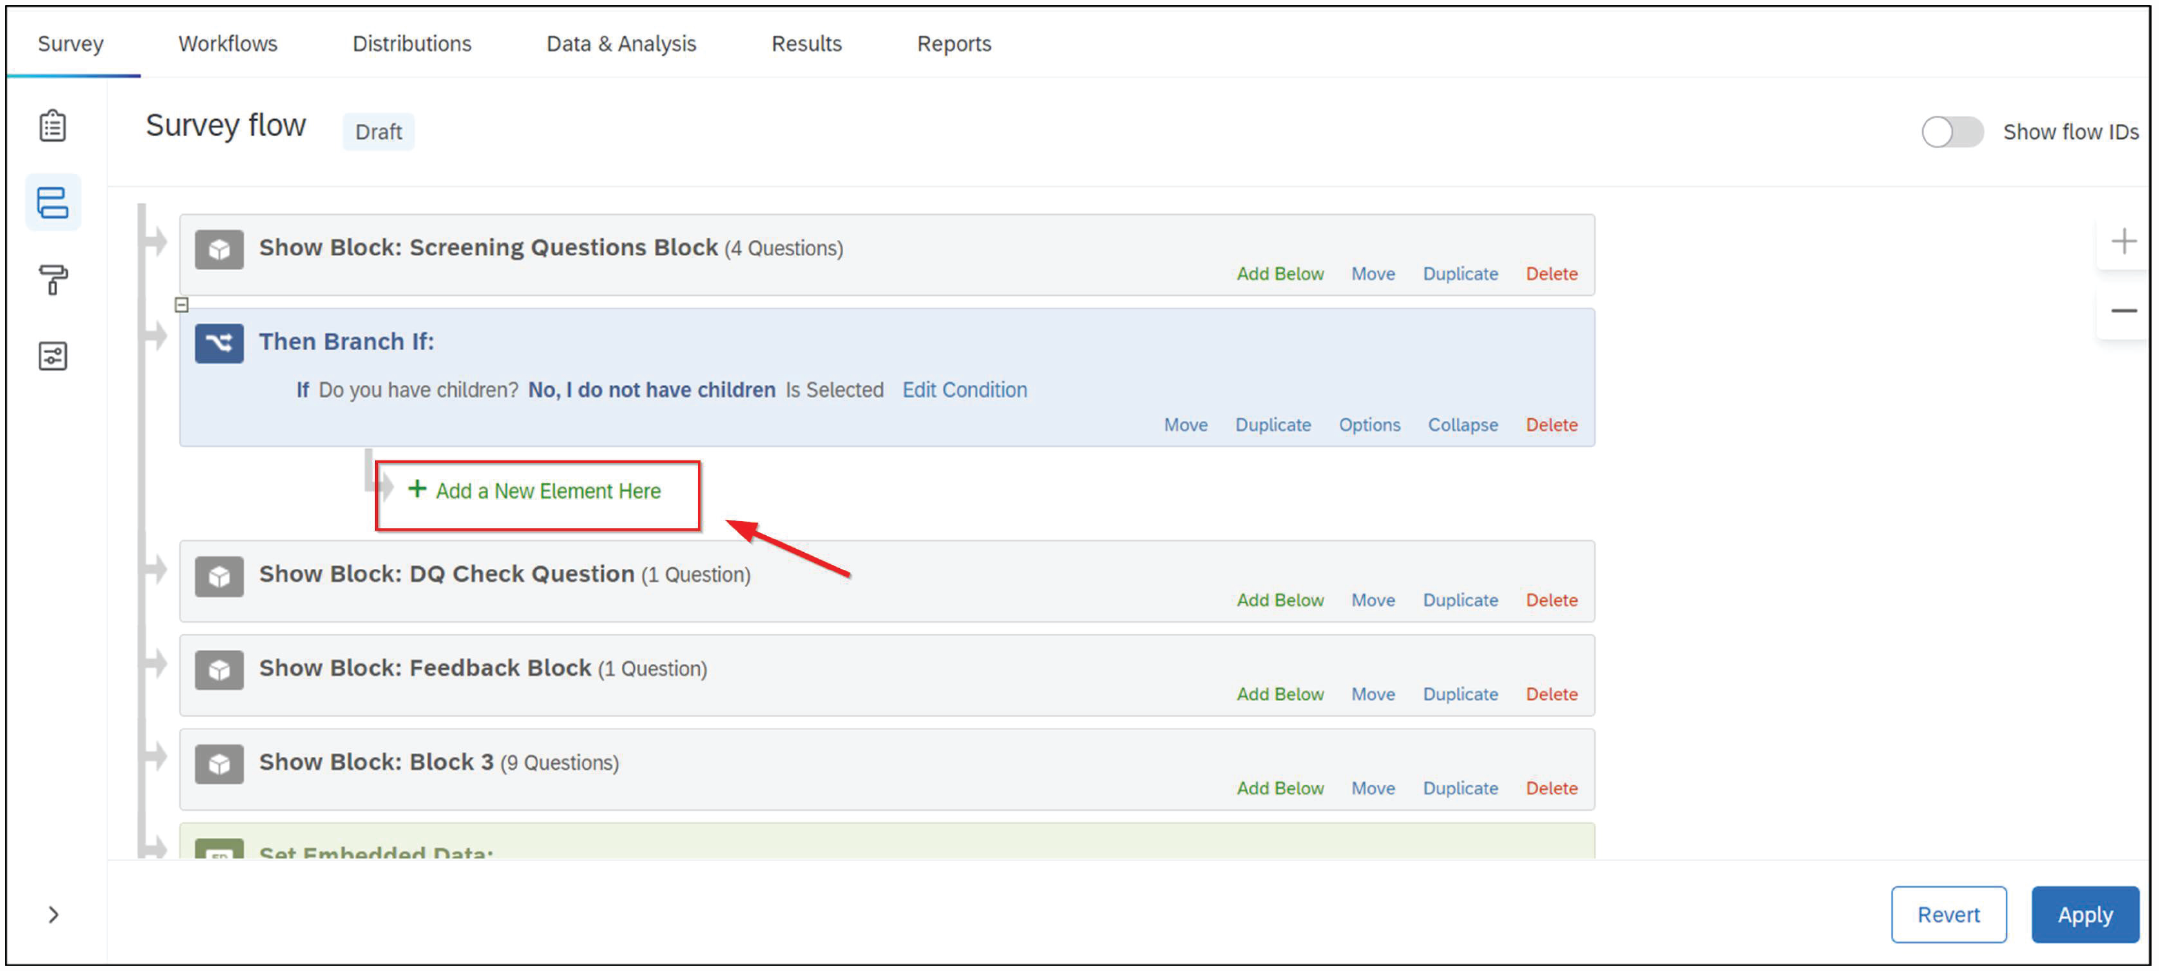
Adding a new element beneath the question block in Qualtrics. Under the survey branch, add a new element.

Adding an end of survey element in Qualtrics. To redirect unqualified participants to a specific URL, create a “custom” end of survey option. Paste the redirect Link from Table 2 into the URL box.
The standard survey redirect link within Qualtrics. A standard survey redirect sends people who do not meet the demographic targeting criteria out of the study.
Level 2 quotas (within the survey)
Earlier, we set quotas to ensure that half the sample would be mothers and half fathers. We set those quotas at Level 1 because the panel had previously asked people about their gender. When it comes to whether people have a child with autism, however, the panel has not asked this question. The only way to obtain a sample evenly split between people with and without a child who has been diagnosed with autism is to create Level 2 quotas based on questions asked within the survey. To ensure that mothers and fathers are evenly distributed across both groups of parents with and without an autistic child, we need to incorporate gender into the Level 2 quotas. With Level 2 quotas in place for both children with autism (yes/no) and participant gender (male/female), participants will be redirected from the survey once the demographic bin they qualify for is full (e.g., after 125 fathers of children without autism have participated). “Bins” correspond with the desired sample ns displayed in Table 1.
To set Level 2 quotas within Qualtrics,
Select “Survey Options” (see Fig. 22).
Choose “Quotas.” In the following window, select “+ Add Quota” (see Figs. 23 and 24).
Choose the question-and-answer options the quota will be based on. Afterward, enter a count and give the quota a name (see Fig. 25).
Under “Quota Options,” select “Customize” for how to end the survey once the quota has been met (see Fig. 26). Then select “Redirect to a URL.”
Paste the “Quota full” URL from Table 2 into the box and click “Save” (see Fig. 27).
Finally, check the selection box to ensure the quota is active when the study launches (see Fig. 28).
Entering the survey options. Clicking the highlighted icon will pull up the survey options.

The survey options and quotas options within Qualtrics. To set quotas within Qualtrics, enter the survey options and choose “Quotas.”

Adding a quota in Qualtrics. Clicking the “+ Add Quota” option starts the quota-building process.

Selecting a custom action for when a quota has been filled. Select the answer options that qualify someone for the quota. Name the quota and designate how many participants the quota will allow.

Quota custom-ending option within Qualtrics. Under “Quota options,” choose what should happen to participants after the quota is full. The best option is often to redirect participants to a specific URL.

An over-quota redirect link in Qualtrics. An over-quota redirect sends people out of the study once the bin for a particular quota has been filled.

Applying quotas within Qualtrics. After quotas have been created, they must be turned “on” to function within the Qualtrics survey.
Managing data quality
The large size of market-research panels has many advantages, including access to niche samples and increased representativeness. However, larger participant pools also mean that market-research panels can have a hard time maintaining data quality. Because panels are exponentially larger than microtask sites, it is not feasible to conduct the in-depth vetting of each participant that sometimes happens on microtask sites (e.g., Croissant, 2021; Hauser et al., 2021). In addition, panel aggregation can mean that data quality varies across panel suppliers. In fact, studies repeatedly demonstrate that between 20% and 30% of participants in market-research studies fail simple attention checks and provide otherwise low-quality data (Aronow et al., 2020; Chandler et al., 2019; Hays et al., 2015; Kees et al., 2017; Smith et al., 2016). Fortunately, multiple solutions can be used to improve data quality, allowing researchers to preserve the benefits panels provide while maintaining high levels of data quality (see Chandler et al., 2019).
First, researchers can insert attention-check questions within the study and redirect anyone who fails these items. Attention-check questions should remain brief, appear within the first few minutes of a survey (i.e., do not redirect a participant 10 min into a 15-min study), and be simple. For example, you may ask participants to “Please select five if you are reading this question.” Anyone who fails these questions can be directed to a quality-termination page, but researchers should be aware that these questions may affect the way participants who pass the screening answer subsequent questions (see Hauser & Schwarz, 2015). In general, attention checks should be based on previous research because attention-check questions can vary significantly in their efficacy for removing inattentive but not attentive participants (Curran & Hauser, 2019). Attention-check questions also vary in quality and difficulty levels, creating sample bias when used improperly (Vannette, 2016).
To use attention checks within a Prime Panels study, check the box that asks if the study includes data-quality checks on the “Additional Screening” page (see Fig. 29). Checking this box displays the redirect URL to be programmed in the survey. After creating the attention-check question(s), redirecting people who fail these items is similar to programming other types of redirects. Within Qualtrics,
Enter the survey flow (see Fig. 2).
Add a branch under the block with the attention-check question(s).
Within the branch, select the answer options that will make people ineligible for the study. Add an “end of survey” option under the branch (see Fig. 30).
Select “Customize” and “Override Survey Options.” Then paste the “Data quality” link from Table 2 into the redirect box.

Data-quality-redirect option in Prime Panels. The Prime Panels interface provides instructions for how to redirect participants who fail data-quality checks in the survey.
Survey branch and end-of-study option for data quality. To redirect participants who fail data-quality checks requires creating a survey branch, choosing the criteria that will disqualify a participant, and creating a custom end-of-survey option that sends participants to a specific URL in Table 2.
Redirecting people who fail attention checks allows panel providers to track why participants who were sent to the study did not complete it. In addition, redirecting inattentive people and replacing them with quality respondents while the study is live is a time-efficient way to manage data quality. At least some research suggests that even with aggressive screening, the demographic representativeness of samples from online panels is not compromised (e.g., Chandler et al., 2019).
A second way to manage data quality is to reject low-quality submissions after data collection closes. Rejecting participants, adjusting study costs, and gathering any replacement participants is a process known as “reconciliation.” Panels often allow researchers to reconcile a percentage of their sample—on Prime Panels, the number is 30%—at no charge. A reason researchers may choose reconciliation over redirecting participants while the study is live is if the study includes a manipulation check or other measure of data quality that need to come late in the survey.
Panels usually require reconciliation to occur within a few days or weeks of a study’s closing, which means researchers need to look at their data right away and determine which participants, if any, need to be replaced. When making these decisions, it is important to avoid the types of questionable research practices many behavioral scientists have sought to highlight and reform in recent years (e.g., John et al., 2012). Hence, it is best to preregister criteria for excluding participants and to inspect the data only for quality and completeness during the reconciliation stage. Although reconciliation works well and can improve data quality, it is time-consuming. If a study uses quotas, reconciliation often requires adjusting those quotas and collecting more data to even out bin sizes. To avoid such complications, there is another way to manage data quality, and it involves either flagging low-quality respondents as they take the survey or blocking them before they ever even enter a survey.
This last group of data-quality solutions often come from the companies that offer access to online panels. These solutions operate either by vetting participants just before they enter a survey or examining the responses participants provide within a survey. Research shows such vetting can be crucial to the outcomes of a study (e.g., Berry et al., 2022; Chandler et al., 2019). However, companies vary in their approach to vetting. Some vetting tools use device-focused technology, looking for signs of suspicious behavior via a scan for duplicate IP addresses, duplicate devices in the same survey, and tools that detect “bots” or automation. Examples of such technology are the ExpertReview offered by Qualtrics, the QualityScore offered by Imperium, and ResearchDefender. Other approaches to vetting are also based on the behavior of participants. These behavioral instruments are based on years of research into the sources of poor online data quality (see Chandler et al., 2019; Litman et al., 2021) and operate by checking participants for basic English comprehension, acquiescence bias, attention, and engagement in addition to signs of technical fraud such as survey language translation. To our knowledge, the only behavioral approach to vetting on the market is the Sentry tool offered by CloudResearch (2021), which is integrated into all Prime Panels studies but can also be used with any online sample supplier. Regardless of how vetting is done, we encourage researchers to speak with their sample supplier to understand what kinds of tools are being used and any evidence for their effectiveness, ideally in the peer-reviewed literature. In addition, these vetting tools are not a complete replacement for other methods of managing data quality, so researchers may choose to pair presurvey vetting with the previously described approaches.
Limitations of Market-Research Panels
Much of our tutorial is focused on how to use online panels, but there are several methodological issues researchers should consider as well. Table 3 presents some major strengths and weaknesses of panels and provides references with more details about each topic. We discuss three issues below: (a) how well suited different kinds of studies are to market-research panels, (b) how generalizable the results from panel studies are, and (c) what ethical concerns may surround issues such as compensation and deception.
The Strengths and Weaknesses of Online Panels

First, how well suited any one study is to market-research panels has at least two factors to consider: how likely the participants are to provide quality data on the task and how well the sampling approach aligns with the study’s aim. Both considerations generally fall under what is known as the fit-for-purpose framework (e.g., Litman et al., 2020b; Mitofsky, 1989), which advocates for matching a study’s objectives with its sampling approach and source of participants to maximize data quality (see discussion in Coppock & McClellan, 2019).
When considering the tasks that are fit for purpose within online panels, researchers should realize that market-research panels are different from microtask sites like MTurk. With market-research panels, researchers do not control participant compensation, participants are not enmeshed in a “gig” environment (see Callegaro et al., 2014; but also Hillygus et al., 2014), and participants have different expectations for the types of tasks they will be asked to complete. Because panels have traditionally been used for market research, participants are used to short studies (< 20 min). These studies commonly ask participants survey-like questions or present a simple between-subjects manipulation looking at how people evaluate a brand, product, or website. Therefore, the most successful academic studies will follow this mold: Remain short; present simple, intuitively designed materials; and be mindful of how participants may respond to the complexity of the task.
More research is needed to understand the variability of tasks that participants on market-research panels will complete. Nevertheless, the existing research—and our experiences—suggest that asking participants to download software, collaborate with others in interactive tasks, or work on studies that require time and creativity may be difficult. Studies that require this type of engagement are best done in coordination with the panel’s managed research team. One reason that participants may be less willing to complete certain types of tasks may be because a large percentage of respondents are on mobile devices. Recent data show that between half and two thirds of panel participants answer surveys from a mobile device, but this number varies widely by country and by provider. Researchers can limit the devices participants can answer from, and many sensitive experimental manipulations may be best confined to people using a desktop or laptop computer. However, despite what may seem like serious limitations on the types of studies researchers can conduct, we have successfully completed video interviews with difficult-to-reach participants, recruited people to show up for in-person studies, and found some success with longitudinal studies (e.g., pre-post election results in Sri Lanka). Recontact rates are near 50% in longitudinal studies, which is lower than the 80% observed on MTurk (Hall et al., 2020), but a lower response rate may be offset by the much wider geographic and demographic reach of market-research panels. Thus, although panel participants may be less willing to complete complicated tasks compared with microtask sites like MTurk, the size of online panels means that researchers can sometimes churn through enough study traffic to find a sample of people willing to complete difficult or time-consuming tasks.
Apart from the suitability of a research task to the panel environment, there are also issues surrounding the demographic representativeness of participants and the generalizability of results. The online panels we refer to in this article use nonprobability sampling methods (R. Baker et al., 2013). Although questions about representation and sampling bias are always present with nonprobability samples, these concerns are amplified when large portions of participants need to be screened and removed for inattention (e.g., Chandler et al., 2019). As it turns out, however, some screening methods can remove inattentive respondents without skewing a sample’s underlying demographic composition. For instance, Chandler et al., (2019) reported the demographic information of participants sampled from online panels who passed and failed data-quality checks. Although participants who passed approximated a nationally representative sample in many respects, participants who failed deviated because their data were noisy. Panel participants who passed data-quality checks were closer to the general population than participants from MTurk, who are more representative than the typical college participant pool (e.g., Kees et al., 2017; Robinson et al., 2020). Thus, online panels appear more representative than populations typically sampled by social scientists, but panel participants are not a probability sample, and the effect of screening depends on the type of screening employed. Researchers should attempt to use validated screening tools to avoid selection bias.
Related to the representativeness of participants is how well the results obtained in panel studies generalize to the broader population. The answer to this question depends on the research being conducted. Studies that seek to describe people’s attitudes or behaviors, such as an opinion poll, are less likely to generalize than experimental manipulations because descriptive studies have more room for error when comparing point estimates with the population (see Coppock & McClellan, 2019; Mitofsky, 1989). Despite this limitation, as much as 80% of the political polls included in the respected data website FiveThirtyEight’s election forecasts use nonprobability panels because such panels offer an approximation of the general population at a much lower cost than probability sampling (see Kennedy et al., 2020).
For studies that examine associations or effect sizes, on the other hand, there are reasons to believe generalizability may be quite good (Litman, Robinson, & Rosenzweig, 2020b; Peyton et al., 2022). In at least two published articles, researchers have found that most experimental effects obtained in nationally representative samples replicate with nonprobability sources like MTurk because most experimental effects produce the same psychological response in different subgroups of the population (Coppock et al., 2018; Mullinix et al., 2015). Therefore, we would expect similar rates of replication with market-research panels. However, generalizability is a complex issue that is influenced by multiple factors, and so researchers should remain cautious when making claims about the generalizability of findings from nonprobability panels. We recommend following the advice of Baker et al. (2013) to avoid describing any sample as “nationally representative” unless it uses a probability sample. For panel studies that match quotas to the U.S. census, we recommend describing them as “Census Matched.”
Finally, researchers and institutional review boards have an interest in understanding issues such as compensation, the appropriateness of deception, and other topics that are relevant to the ethics of online research (e.g., Buchanan & Hvizdak, 2009). Unlike on microtask sites for which researchers control compensation, with panel studies, researchers pay a vendor-specified cost per complete that includes panel fees and the compensation participants receive. The compensation that panels offer participants varies across sample providers in terms of both the type and amount. Participants may receive either cash, gift cards, reward points, or a donation to a charity of their choice. Because panel aggregators operate as an exchange in which several individual participant providers often contribute participants to a single study, participants within the same study may receive different compensation (see Baker et al., 2010). Further complicating matters, some panels allow researchers to set a budget during study setup. Once the project goes live, panel providers bid to determine which provider will supply participants and at what price. Setting different budgets can affect things such as speed of data collection and the quality of participant responses, but it would be a mistake to assume that setting a higher budget and paying more per participant necessarily means that participants are compensated with more. The overall lack of information about where participants come from and how much they are compensated sometimes leads to complaints that online panels are a black box.
Although the lack of transparency from online panels may seem like an ethical issue to some researchers, it is important to remember that participants freely choose whether to participate in studies. Regardless of how panels recruit participants and how people are compensated, participants are presented with a choice of whether to participate for every study. If other research protocols are followed (e.g., informed consent, risk-benefit analysis, participants’ right to quit at any time), then allowing people to choose which studies are worth their time and which ones are not respects people’s autonomy—one of the ethical principles within the Belmont Report (Department of Health, Education, and Welfare, 1979).
Beyond compensation, the ethics that apply to other online research sites also apply to panels. Researchers may use deception and conduct research on sensitive topics, but doing so should be done with care, ensuring that participants are debriefed and that the research team communicates respect for people’s desire to potentially withhold some information. As with all online research, participants’ data need to remain confidential and ideally anonymous. Participants should be informed at the start of a study what they will be asked to do, and researchers should design studies so that they are only as long and burdensome as necessary. These and many other topics have been well covered in a variety of publications (e.g., Buchanan & Hvizdak, 2009; Elgesem, 2002; Hauser et al., 2019; Litman & Robinson, 2020a).
Summary
In this tutorial, we described market-research panels and how researchers can efficiently gather data from such panels. Adapting one’s data collection to online panels is not overly technical or complicated, but it is sufficiently different from what most academic researchers are used to. At the beginning of a survey, researchers can screen participants for demographic characteristics that have not been previously profiled, what we refer to as Level 2 screening. Level 2 screening entails understanding incidence rates and how to redirect unqualified participants out of a survey. Market-research panels also allow researchers to control sample composition with extensive sample quotas. Setting quotas entails making demographic selections on the panel providers’ website (Level 1 screening) and setting up in-survey quotas that redirect participants once a demographic bin has been filled. These over-quota redirects are an important piece of information panels use to direct the right kinds of participants to studies. Finally, researchers need to know the options for managing data quality. Participants who fail simple attention checks can be directed out of a study, and participant submissions can be rejected, but often the best way to manage data quality entails preventing poor respondents from ever entering a study. Advanced vetting tools combine technological screening with behavioral measures. Only by being aware of market-research panels’ unique strengths and weaknesses will researchers be able to efficiently gather data in a way that maximizes access to the large and diverse pool of participants panels offer while managing concerns about data quality. We hope our tutorial helps in this regard.
Footnotes
Transparency
Action Editor: David A. Sbarra
Editor: David A. Sbarra
Author Contribution(s)