
Abstract
In this Tutorial, we introduce a tool that allows researchers to track subjects’ on- and off-task activity on Qualtrics’ online survey platform. Our TaskMaster tool uses JavaScript to create several arrayed variables representing the frequency with which subjects enter and leave an active survey window and how long they remain within a given window. We provide code and instructions that will allow researchers to both implement the TaskMaster and analyze its output. We detail several potential applications, such as in studies of persistence and cheating, and studies that require sustained attention to experimental outcomes. The TaskMaster is designed to be accessible to researchers who are comfortable designing studies in Qualtrics, but who may have limited experience using programming languages such as JavaScript.
Keywords
In this Tutorial, we introduce a novel tool, the TaskMaster, that allows experimenters to quantify research subjects’ thoughtful engagement and honest participation. The TaskMaster offers an alternative to existing quality checks for crowdsourced data, such as screening measures (Hauser, Paolacci, & Chandler, 2018) and reverse-worded items that can be analyzed for response patterns indicative of inattention (Curran, 2016; Thomas & Clifford, 2017). The rise of crowdsourcing platforms to recruit online research subjects has produced continued debate regarding the merits of Web-based samples as compared with more traditional research populations, such as university students. Although Web-based samples are more demographically diverse, some researchers have raised concerns about the relative attentiveness, honesty, and experience of online subject pools (Chandler, Mueller, & Paolacci, 2014).
Indeed, data from nondiligent subjects are noisy and can drastically reduce a study’s statistical power, as well as the interpretability of one’s results. Methodological innovations such as the instructional manipulation check (Oppenheimer, Meyvis, & Davidenko, 2009) are intended to address one such source of inattention: a form of satisficing in which subjects do not carefully read the instructions that are provided. Several studies have found that workers recruited using Amazon Mechanical Turk (MTurk) pass attention-check questions at rates that are similar and sometimes superior to those of student samples (Paolacci, Chandler, & Ipeirotis, 2010).
This Tutorial is designed to help researchers address a related concern regarding online research populations: off-task behavior. MTurk workers report high rates of multitasking, ranging from unrelated Internet browsing to use of mobile phones while working on a task (Clifford & Jerit, 2014). Some workers will work on multiple tasks concurrently (Chandler et al., 2014). Research on multitasking shows that divided attention that induces central cognitive bottlenecks can decrease performance quality and increase error rates (Borst, Taatgen, & van Rijn, 2010). Moreover, off-task behavior may be a source of noise within a study if subjects vary in the amounts of time they are on and off task. Whereas off-task or inattentive subjects are easily flagged in a laboratory setting, identifying off-task behavior is considerably more challenging in online environments. Indeed, a reviewer cited by Hauser et al. (2018) pointed to multitasking as a particularly pressing concern, stating, “There is nothing that can be learned from research on MTurk except that multitasking produces dumb answers” (p. 2).
Perhaps of greater concern is the fact that off-task behavior can jeopardize the descriptive validity of survey items assessing subjects’ knowledge (Luskin & Bullock, 2011; Peer, Brandimarte, Samat, & Acquisti, 2017) and may confer unfair advantages to subjects during competitive tasks. For example, subjects could use an online anagram solver to place in the top percentile of a scrambled-word task or could consult external resources to boost their score on a political-knowledge questionnaire (Jensen & Thomsen, 2014). Existing quality checks are poorly suited to detect such behaviors, as they are designed to measure inattentive responding and low MTurk approval ratings, but not out-of-task behavior specifically.
We present a novel method for tracking subjects’ activity using Qualtrics online survey software. Qualtrics is a widely utilized tool in psychology and behavioral-science research, and it is known for its straightforward user interface and extensive customizability. It is particularly well suited for questionnaire studies, as scalar, open-ended, and multiple-choice items are easily added and edited using the platform’s graphical interface. Researchers with experience programming in HTML, CSS, and JavaScript may implement study designs that are more elaborate than those possible under the graphical interface using Qualtrics’ JavaScript Question API. We have developed a tool that allows researchers to track how long subjects spend inside and outside a task window, thereby providing an unobtrusive and easily implemented measure of on- and off-task behavior.
Although existing tools such as Qualtrics’ page timer allow researchers to monitor the amount of time subjects spend on a given page, they typically measure only the interval between the loadings of two pages, rather than the amount of time spent on and off a page within this interval.
Using Qualtrics’ built-in programming infrastructure, we created a JavaScript-based tool that measures the amount of time users spend on and off each page. This tool can be added to any Qualtrics survey—even one that does not otherwise utilize JavaScript in its design. The TaskMaster uses standard JavaScript onfocus( ) and onblur( ) events, which occur when a specified element (in this case, the survey window) enters and leaves focus. Our tool is built using infrastructure similar to that of a previously validated tool implemented by Diedenhofen and Musch (2017) and of de Leeuw’s (2015) jsPsych browser-based experimental research platform. Diedenhofen and Musch used focus and blur events to capture on- and off-task browsing behavior and found that off-task browsing is responsive to incentives in a fact-based “knowledge test.” They observed an increase in off-page navigation when test items were easily searchable and when subjects faced large performance incentives.
We consider the TaskMaster an extension of Diedenhofen and Musch’s (2017) work that is adapted for general use within the existing Qualtrics interface. Loading of a page activates a timer that tracks the amount of time the survey window remains in focus. Time spent with the task window out of focus—that is, time spent in other tabs or applications—is measured and summed. The TaskMaster generates an index of how much time a subject spends on and off task for each page of the survey, as well as the number of times the subject leaves and returns to each page of the survey. Whereas Diedenhofen and Musch’s PageFocus tool only saves and displays the interval between the most recent defocusing and refocusing events, the TaskMaster produces an array of all on- and off-task activity for the duration of the survey. The timing application is unnoticeable to subjects as they complete the survey. Notably, although the TaskMaster enables the researcher to collect information about time spent on and off task, it does not offer insight as to how and where off-task time is spent. In situations in which the specifics of off-task activity are considered relevant, researchers may include additional questions that are presented to subjects whose off-task time exceeds a designated cutoff.
Furthermore, the TaskMaster is able to detect off-task browsing only on the device where the survey is taken. It cannot identify subjects who, for instance, consult their mobile devices while completing a task on a computer. Still, to the extent that task switching is a concern to researchers and reviewers and poses a threat to experimental validity (see Diedenhofen & Musch, 2017, who used focus and blur events to detect off-task browsing during an incentivized knowledge task), the TaskMaster may help to address some of these concerns about experimental validity.
Implementation
This tool is implemented by first adding to one’s survey the code available at https://github.com/steve-permut/TaskMaster (and in this article’s appendices). Researchers using Qualtrics’ survey builder should paste the header code (https://github.com/steve-permut/TaskMaster/blob/master/HeaderCode.html or Appendix A) into the survey’s header source html, which can be found in the General tab of the survey’s Look & Feel menu (Fig. 1).
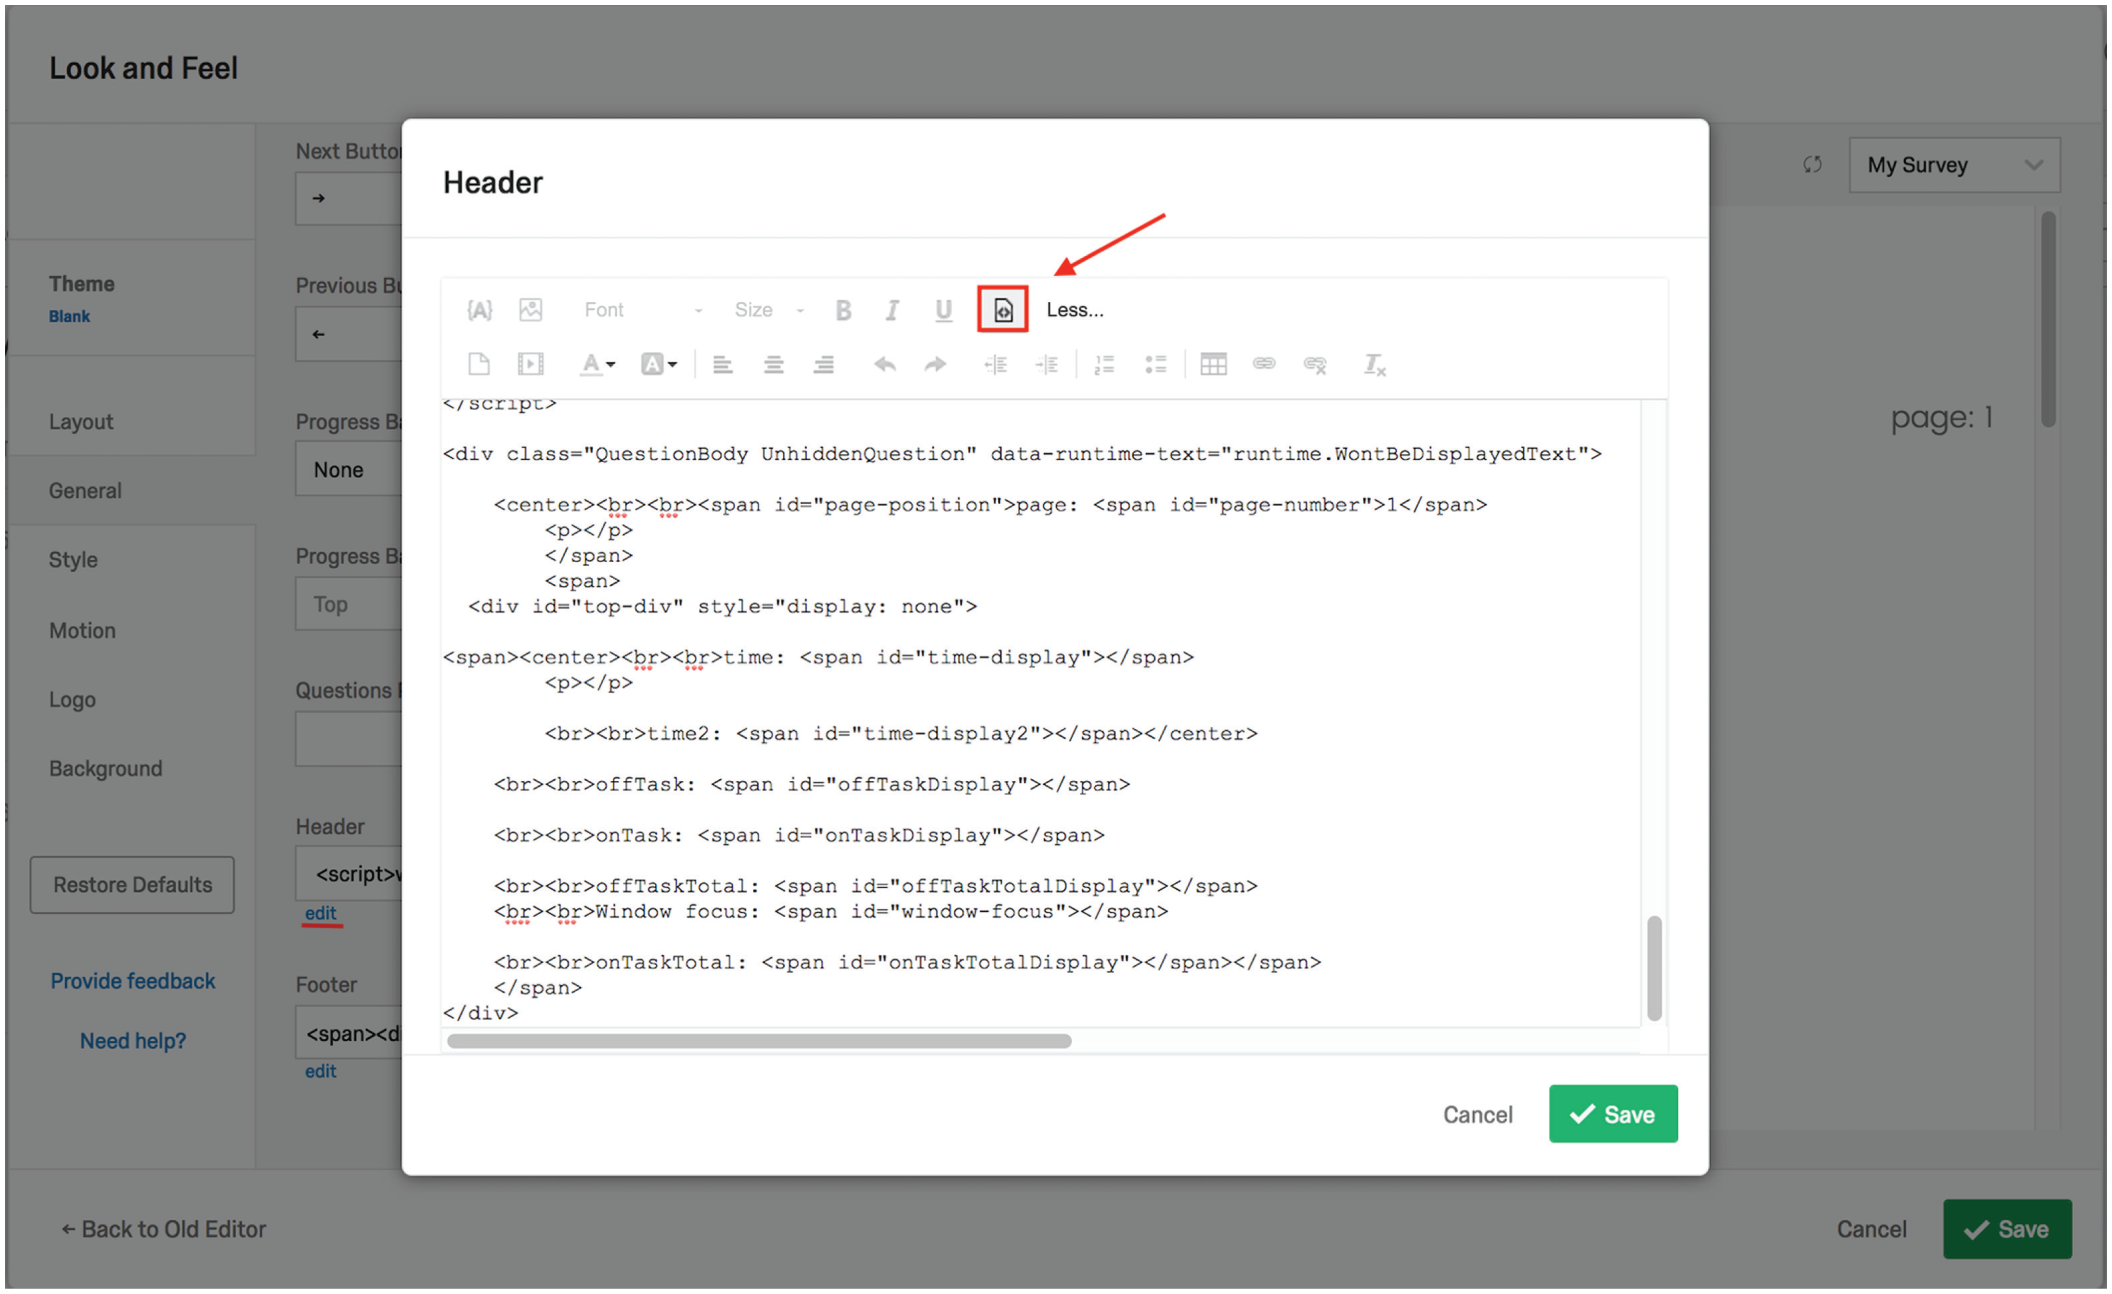
Screenshot of Qualtrics’ Look & Feel menu with the header source editor opened and the source code displayed. The TaskMaster code must be pasted in the header’s source code, as the default rich-text editor does not save custom JavaScript. To paste in this source code, users should first access the header source editor by clicking on the “edit” link (highlighted by the red underline) under the box labeled “Header.” Next, they should select the source icon (highlighted by the red box and arrow), and the source code will be displayed, as shown here. The TaskMaster’s header script can then be pasted in the editor.
This code tracks time spent on and off each page, from the time the page has loaded to the time the user has moved on to the next page. When the survey data are downloaded from Qualtrics, time spent on and off task is represented as an array of positive (on-task) and negative (off-task) values, which can be summed to measure the total amount of time a subject spent on task or on a particular page. Moving to the next page of the survey automatically appends a “PAGEBREAK” string to the end of the array. The number of positive values and the number of negative values before each instance of PAGEBREAK represent the number of times the subject exited and reentered the work space.
The TaskMaster’s footer code (https://github.com/steve-permut/TaskMaster/blob/master/FooterCode.html or Appendix B) allows researchers to track navigation data across an entire survey (rather than on a particular page). This code should be pasted in the source of the survey’s footer html, which is also found in the General tab of the Look & Feel menu (see Fig. 1 for the equivalent field in the survey header).
The timing tool outputs five variables per monitored page:
worktimeArray: an ordered array of the total time spent both on and off task
onTask: an ordered array of the time spent on task; each item in the array represents a separate time the subjects’ cursor entered the workspace and the amount of time the subject spent within the task window
totalOnTask: the total amount of time on task (without subtracting time spent off task)
offTask: an ordered array of the time spent off task; each item in the array represents a separate time the subjects’ cursor left the work space and the amount of time the subject spent off task
totalOffTask: the total amount of time spent off task
These variables are exported alongside other subject data in a Qualtrics-generated spreadsheet and must be manually added as empty embedded variables in Qualtrics’ Survey Flow (see Fig. 2 for a list of all the embedded variables that must be entered). To add empty embedded variables, click on “+Add New Element” and then “Embedded Data.” Next, click on “Create New Field or Choose from Dropdown” and input the first variable in the window under “Set Embedded Data” (see Fig. 2). Then click on “Add a New Field,” below the window, and repeat the process for each of the remaining variables.
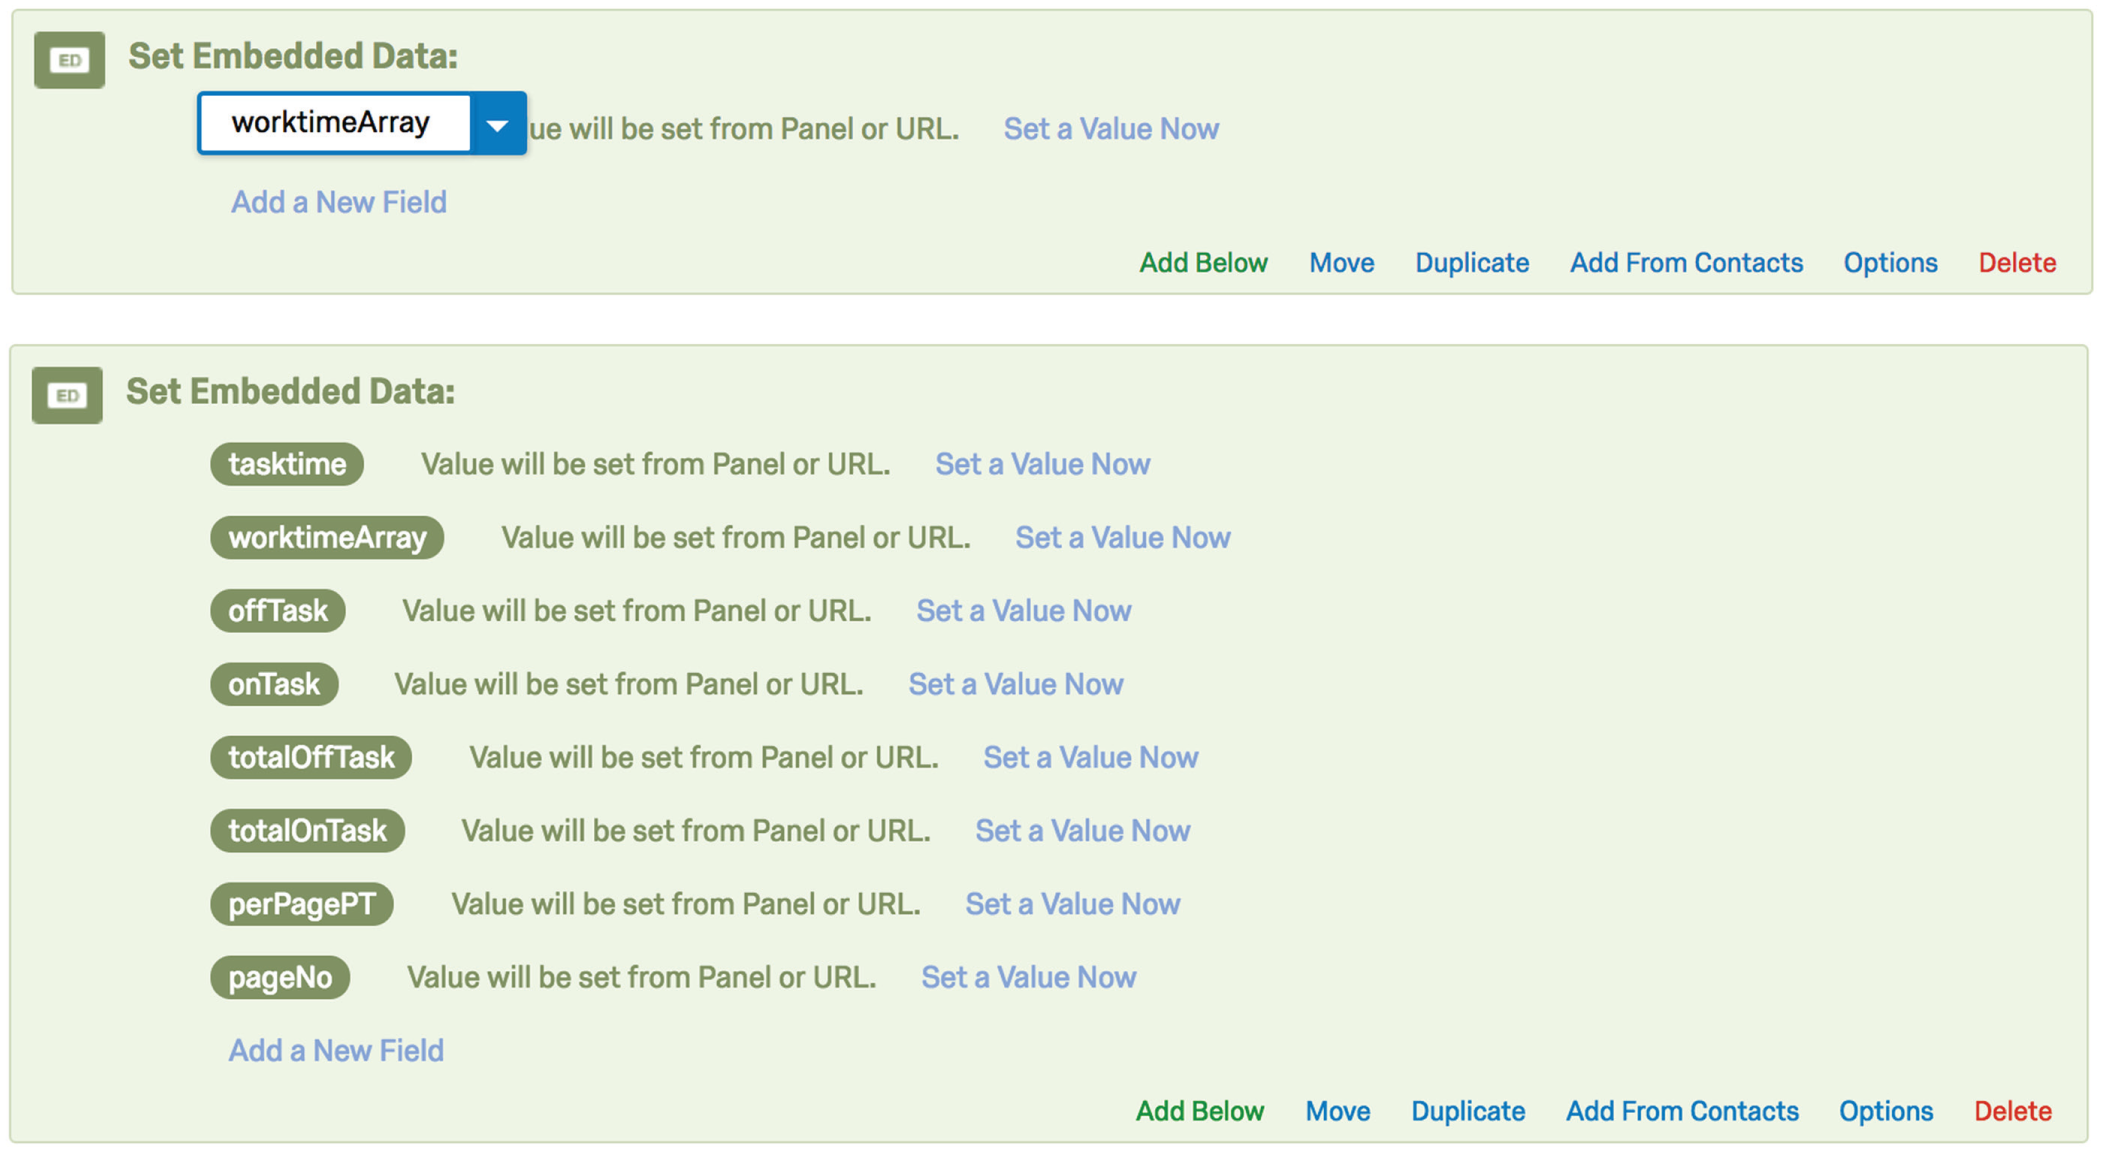
Screenshots of Qualtrics’ Survey Flow editor. The top image shows an embedded data field being set to the worktimeArray variable. The bottom image shows all of the embedded variables that must be input in order for the TaskMaster to run properly. Note that some of these fields are not discussed in the text because their output will not be of interest to the researcher.
The variables must be labeled as just shown. For the script to run properly, study transitions (also accessed in a survey’s Look & Feel section) must be disabled.
For ease of interpretation, we have developed an additional online tool (https://mfisher.shinyapps.io/expand_mouse_tracking_data) that researchers can use to upload their raw data from Qualtrics and have the timing data rendered in a more readable format. To use this Shiny app, begin in Qualtrics:
Click on “Data and Analysis”
Then click on “Export & Import”
Then click on “Export Data”
Select “as a CSV” and “using numeric values”
Next, go to the app (https://mfisher.shinyapps.io/expand_mouse_tracking_data):
5. Click on “Browse”
6. Upload the .csv file
7. When the file has been uploaded, click on “download”
This tool splits the single column of arrays outputted by Qualtrics into a set of per-page variables. Each row in the spreadsheet represents a single subject’s on-task activity, and for each page of the survey, four columns are created (note that “N” in the variable labels is a placeholder for the specific page number; see Fig. 3 for an example of the app’s output):
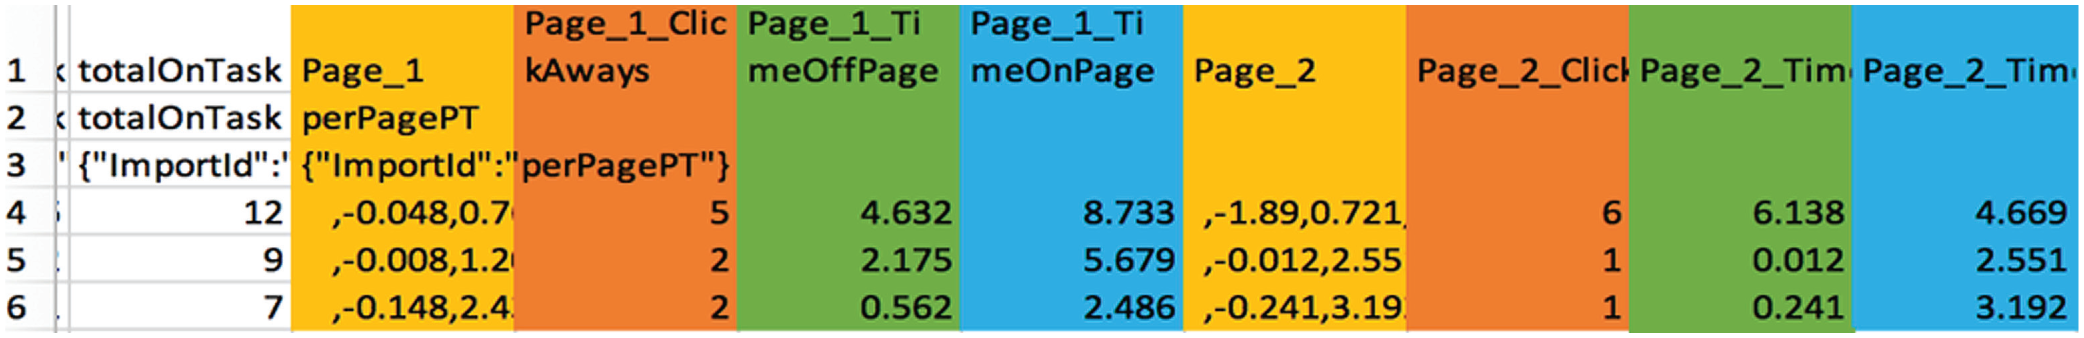
Screenshot of the Shiny app output. Note that the columns are color coded here for ease of interpretation but are not color coded in the actual survey output. The white column to the left contains the totalOnTask variable, described earlier in the text.
Page_N: an ordered array of on- and off-task behavior at the page level. Negative numbers indicate the duration of intervals with the cursor outside the task window, and positive numbers indicate the duration of intervals with the cursor inside the task window.
Page_N_ClickAways: the number of times the subject clicked away from the page. This variable corresponds to the count of negative values in the Page_N array.
Page_N_TimeOffPage: the total amount of time spent off a given page (the absolute value of the sum of the negative values in the Page_N array).
Page_N_TimeOnPage: the total amount of time spent on a given page (the sum of the positive values in the Page_N array).
To help researchers match the columns of app output with the correct pages of the survey, page numbers are displayed in the survey’s preview mode. Display of page numbers is optional; they can be removed from the survey before launch.
Applications
We envision several uses for this tool. There are many cases in which researchers might be interested in subjects’ on- and off-task behavior. The data provided by the TaskMaster could serve as a dependent measure or as an attention-check or quality-control mechanism.
The on-task and off-task time indices that are generated could be treated as supplementary measures of distraction that quantify interest in or attention to cognitively demanding tasks. If the data indicate that subjects reliably navigate away from a task during sections that require sustained attention, researchers could use this information to alter those sections in order to increase engagement. Diedenhofen and Musch (2017) were able to decrease off-task browsing through the inclusion of a pop-up, which was activated when the study window was not in focus.
Researchers might also treat off-task behavior as a stand-alone dependent measure—for example, to quantify the effectiveness of interventions designed to promote on-task behavior and cognitive control. Implementing our tool alongside a tedious exercise (e.g., a real-effort task) would allow researchers to establish baseline measures of behavior against which the effects of focused interventions might later be tested.
In addition, someone who is interested in studying task persistence without relying on self-report could do so unobtrusively using the time indices as dependent measures. The indices could also incentivize sustained on-task behavior if used to differentially warn or reward subjects who take many or few breaks over the course of a task.
We believe that the TaskMaster can help to shed light on an ongoing conversation within the behavioral sciences about ensuring the quality of online samples. It can be unclear whether low-quality open-ended responses are the work of automated bots or human subjects using virtual private servers (Dennis, Goodson, & Pearson, 2018). Human subjects may take generic text from online sources to use in place of self-generated responses. Because the TaskMaster monitors time spent on and off task, it could be used to diagnose the extent to which “suspicious” activity is human generated or fully automated.
Furthermore, researchers may use the TaskMaster to exclude subjects who appear to take excessive breaks over the course of a study. Although not every instance of off-task behavior should be considered excessive, it would be useful if experimenters could identify and flag cases in which more time has been spent off task than on.
A related use is to measure cheating behavior, as Diedenhofen and Musch (2017) did with their tool. Timing on- and off-task activity during a knowledge test can help to identify subjects who may have consulted outside resources to improve their scores. This application of the TaskMaster could improve the descriptive and construct validity of scales designed to measure prior knowledge or abilities.
Another, more direct cheating-detection application would be a “timesheet” study design wherein subjects self-report the amount of time spent on effortful tasks and receive a bonus payment based on the amount of time logged. Subjects’ self-reported completion times could be compared against the totalOnTask variable, and large deviations would suggest deliberate misrepresentation.
Finally, in certain studies, researchers may want to validate that subjects have left or remained inside the survey window. For example, if subjects are instructed to read information from an external Web site, the TaskMaster can be used to verify if they have actually navigated away from the survey. Alternatively, some studies may require subjects to view stimuli for a certain period of time as part of an intervention or dependent measure (e.g., in a learning study, the amount of time subjects are exposed to materials is a key independent variable). Although Qualtrics offers a handful of timing tools to prevent respondents from immediately advancing to the next page of the survey, there is no way to ensure that subjects remain on the intended page (as opposed to navigating to a different site).
Summary
We have described a simple tool that allows researchers to monitor time spent on and off task during Qualtrics surveys. The TaskMaster improves on existing task timers by generating an index of how much time subjects spend on and off each page of a survey. We have described several possible applications of this tool, including applications in studies of persistence and cheating, and studies in which sustained attention is relevant to experimental outcomes. By following the instructions provided here, researchers without programming experience can easily track subjects’ activity in Qualtrics-based projects.
Footnotes
Appendix A: The TaskMaster’s Header Code
Appendix B: The TaskMaster’s Footer Code
Action Editor
Mijke Rhemtulla served as action editor for this article.
Author Contributions
S. Permut came up with the idea for the TaskMaster and is responsible for the project’s written code. M. Fisher wrote the accompanying app. S. Permut wrote the first draft of the manuscript; M. Fisher and D. M. Oppenheimer provided edits. All the authors approved the final submitted version of the manuscript. M. Fisher and D. M. Oppenheimer jointly generated the idea for a publicly available version of the TaskMaster.
Declaration of Conflicting Interests
The author(s) declared that there were no conflicts of interest with respect to the authorship or the publication of this article.
Open Practices
Open Data: not applicable
Open Materials: not applicable
Preregistration: not applicable