
Abstract
Although the vignette method is widely used in psychology, it is often implemented without the key feature of iterative decision making that can affect the eventual outcome of the vignettes. This Tutorial provides an explanation of how to use Twine, an interactive narrative platform, to create vignettes with iterative decision making. Twine is an especially useful tool for experiments involving branching narratives, spatial navigation, and resource allocation. We provide code for creating exemplar experiments in social and cognitive psychology, as well as behavioral economics, and explain how to integrate Twine projects with survey-management platforms, such as Qualtrics. After following this Tutorial, researchers will be able to use Twine in their experiments to update the classic vignette method by incorporating iterative decision-making tasks.
This Tutorial provides an update to the classic vignette method by describing how to create iterative vignettes using Twine (https://twinery.org/), a freely available software platform. Vignettes, or hypothetical situations used to elicit research participants’ feelings or perceptions, are widely employed across the subfields of psychology to study a range of cognitions, emotions, attitudes, and behaviors. In fact, a recent PsychInfo search for “vignette” brought up 11,959 peer-reviewed journal articles, more than the number of hits for most other common methods, such as the Stroop task (6,175 articles) or the use of confederates (2,821 articles). Traditional vignette methods have key limitations that the use of Twine can help overcome. Specifically, vignettes typically involve a simple paragraph of text and thus rarely involve choices that are informed by participants’ reactions to the vignettes. Consequently, participants may not engage deeply with the text and may satisfice when deciding on their responses (Stolte, 1994).
One methodological improvement to the vignette method is the choose-your-own-adventure paradigm (Green & Jenkins, 2014; Turan & Vicary, 2010; Vicary & Fraley, 2007). However, most past work with this paradigm has only presented the illusion of choice, rather than involving true decisions that change the course of the story (Turan & Vicary, 2010; Vicary & Fraley, 2007). Using Twine, researchers are able to create decision-making vignettes with iteration, so that participants can both make decisions that affect later outcomes and return to previous decision points to select different alternatives. If participants make choices that have an impact on the outcome of the story, they may be more engaged and less likely to satisfice. Overall, by providing a way of observing participants as they make more fine-tuned decisions based more firmly in real-world situations (i.e., situations that change on the basis of decisions made), Twine allows researchers to gain a richer, more nuanced data set about social, cognitive, and behavioral economic processes. In this Tutorial, we introduce Twine basics and then discuss three experimental structures well suited to Twine (i.e., branching-narrative, spatial-navigation, and resource-allocation structures).
Twine is a story-building tool in the choose-your-own-adventure style. It was invented to enable nonexperts to quickly craft interactive texts, games, and stories (Hudson, 2014). Even though Twine was created as an interactive fiction platform, its functionality can be employed for research purposes. This Tutorial will familiarize you with how to create experiments in Twine; the information provided will enable you to incorporate this tool into your research immediately and integrate Twine projects with a survey-management platform to save participants’ data. 1
Twine has four main advantages over survey software for vignette experiments with iterative decision making. As Qualtrics is a commonly used survey software, we use it as a comparison case for Twine. First, Twine is easier to use than Qualtrics for creating experiments with complex branching logic. Although many researchers are less familiar with Twine (see Fig. 1a) than with Qualtrics (see Fig. 1b), the setup of Twine makes branching more intuitive. Second, the Twine editor is generally faster to use than the Qualtrics editor: Switching between passage editing and the project view in Twine tends to be faster than switching between the Survey Flow and the individual blocks in Qualtrics. Third, Twine allows for types of iterative logic that would not be possible in Qualtrics (and would be very cumbersome and difficult or impossible on other platforms). For example, in Twine, researchers can allow participants to revisit the same decision point multiple times (see the later examples of spatial-navigation and resource-allocation scenarios), whereas in Qualtrics, the Survey Flow cannot redirect participants back to the same decision point. Finally, Twine can create more engaging and intuitive iterative experiments. A key asset of Twine is its responsiveness—that is, its ability to adjust the display for different screen sizes, which is especially important in the case of mobile devices. For example, although Qualtrics surveys can be accessed on mobile devices, their formatting often changes drastically to accommodate the smaller screen size (e.g., radio buttons become drop-down lists). Twine changes the sizes of elements but not the actual style of the experiment when it is accessed on a mobile device.
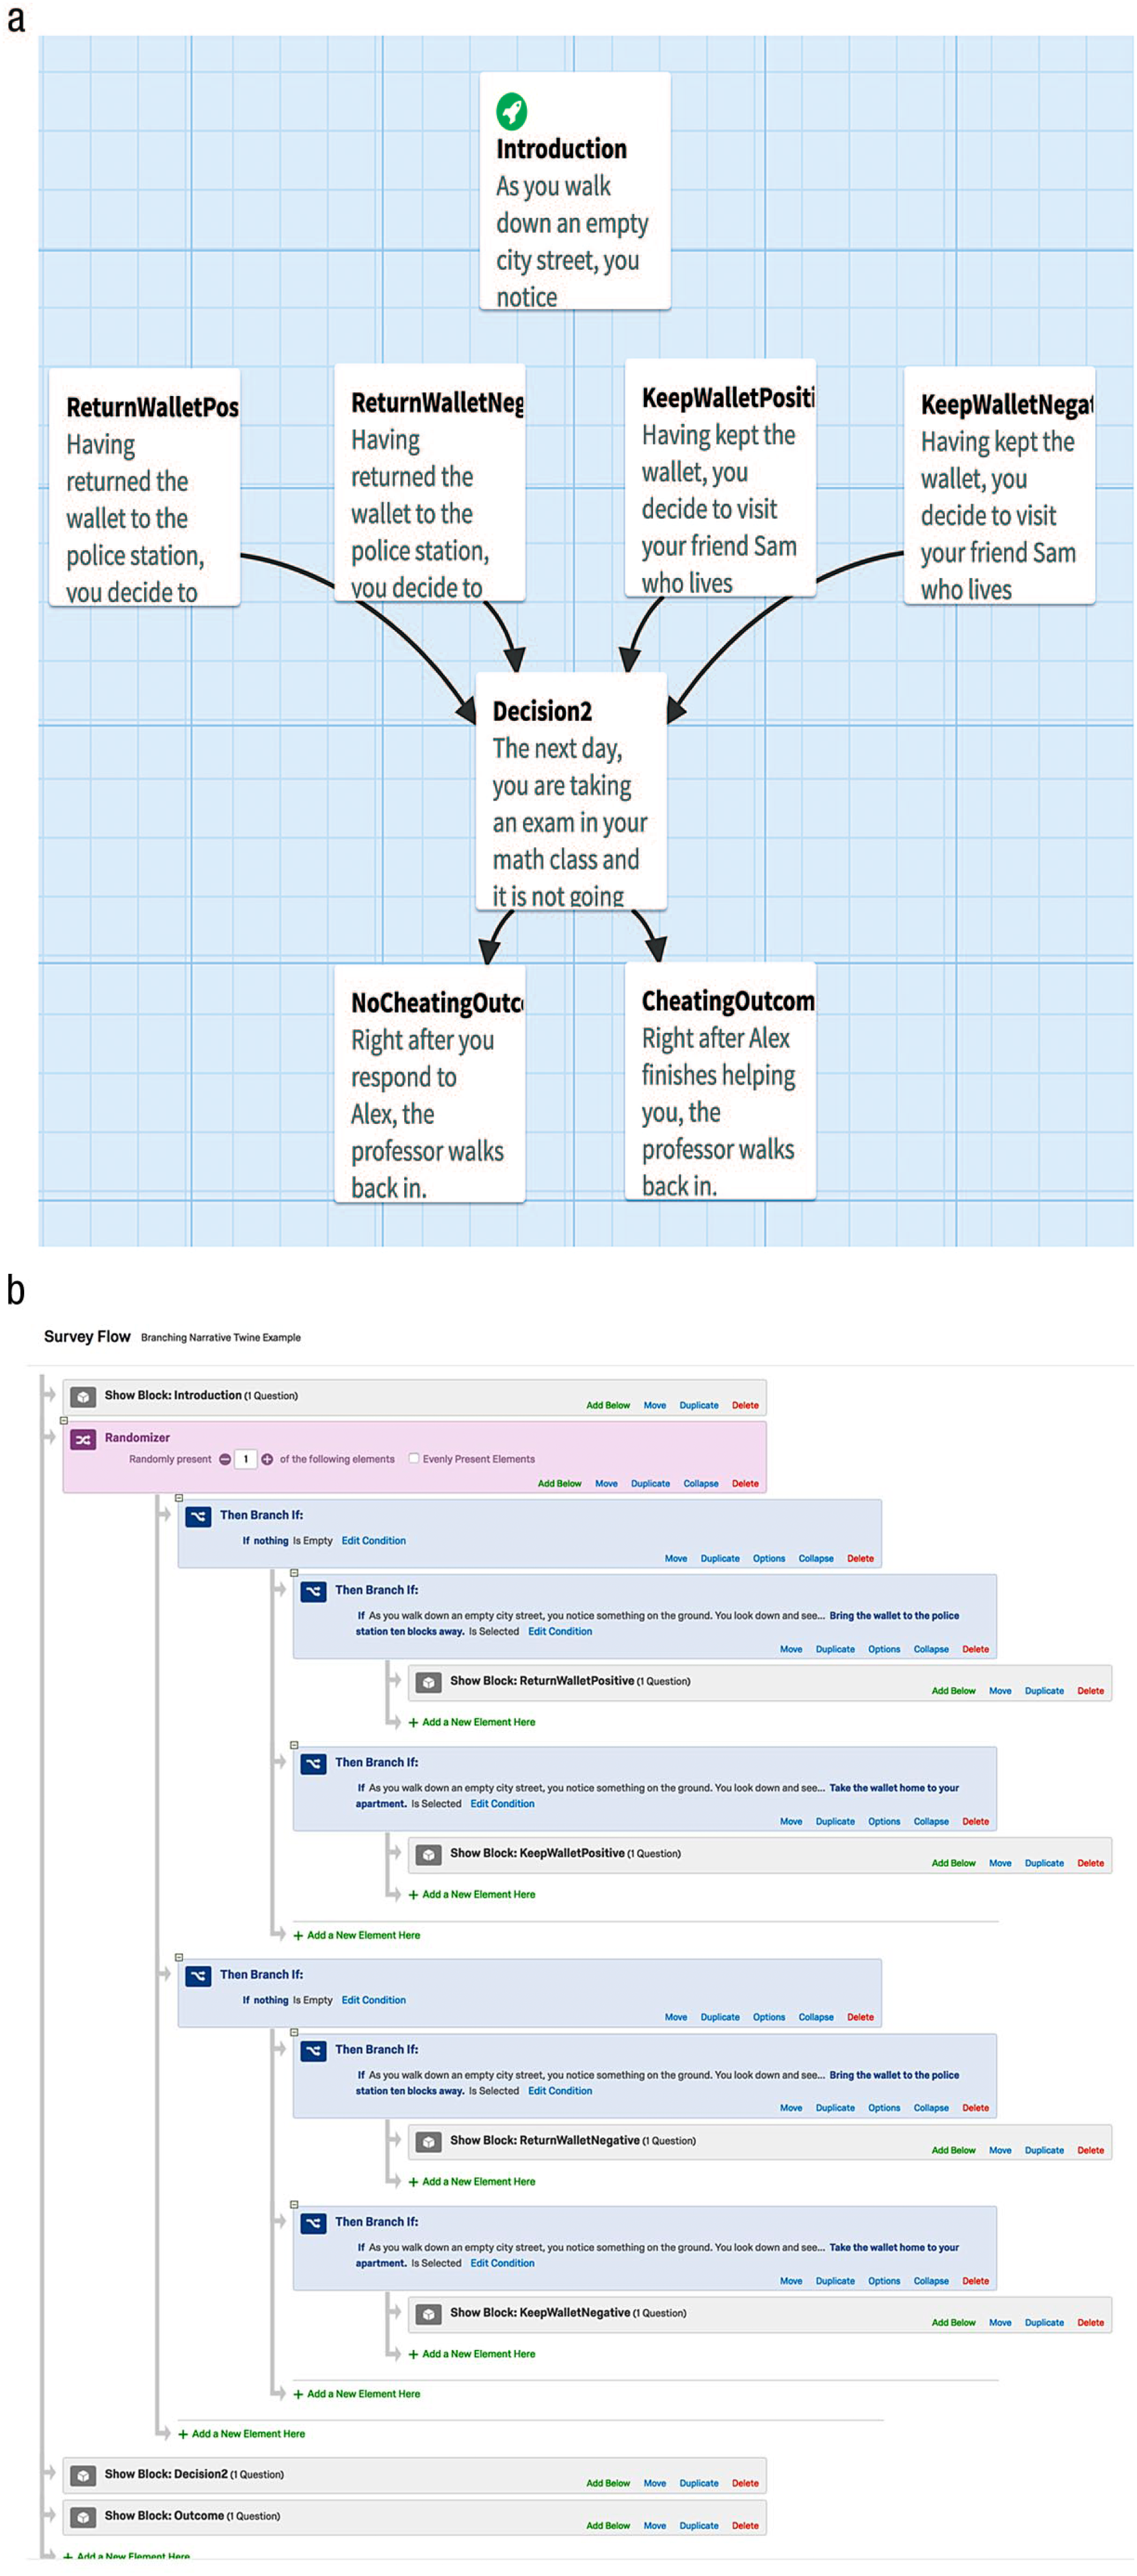
Depiction of the difference between constructing a branching-logic experiment in Twine and constructing the same experiment in Qualtrics. As illustrated in (a), the Twine editor clearly shows the participants’ progression from section to section. This progression is less clear in the Qualtrics Survey Flow interface, as shown in (b).
Twine Basics
Twine, created by Chris Klimas, is an open-source tool to make interactive fiction and has freely available documentation (Arnott, 2017). Twine’s main functionality facilitates creating hypertext branching narratives: Players make a choice, and then, on the basis of that choice, Twine takes them to another place in the story with another choice. To access Twine, visit https://twinery.org/ in your Web browser. 2 You can choose to work with Twine by using the online platform (click on “Use it online”) or by downloading it; this Tutorial’s instructions are based on the online version but are applicable to either option.
To start a new project, click on the “+Story” button and enter a project name. You will now see the story screen for your Twine project (see Fig. 2).
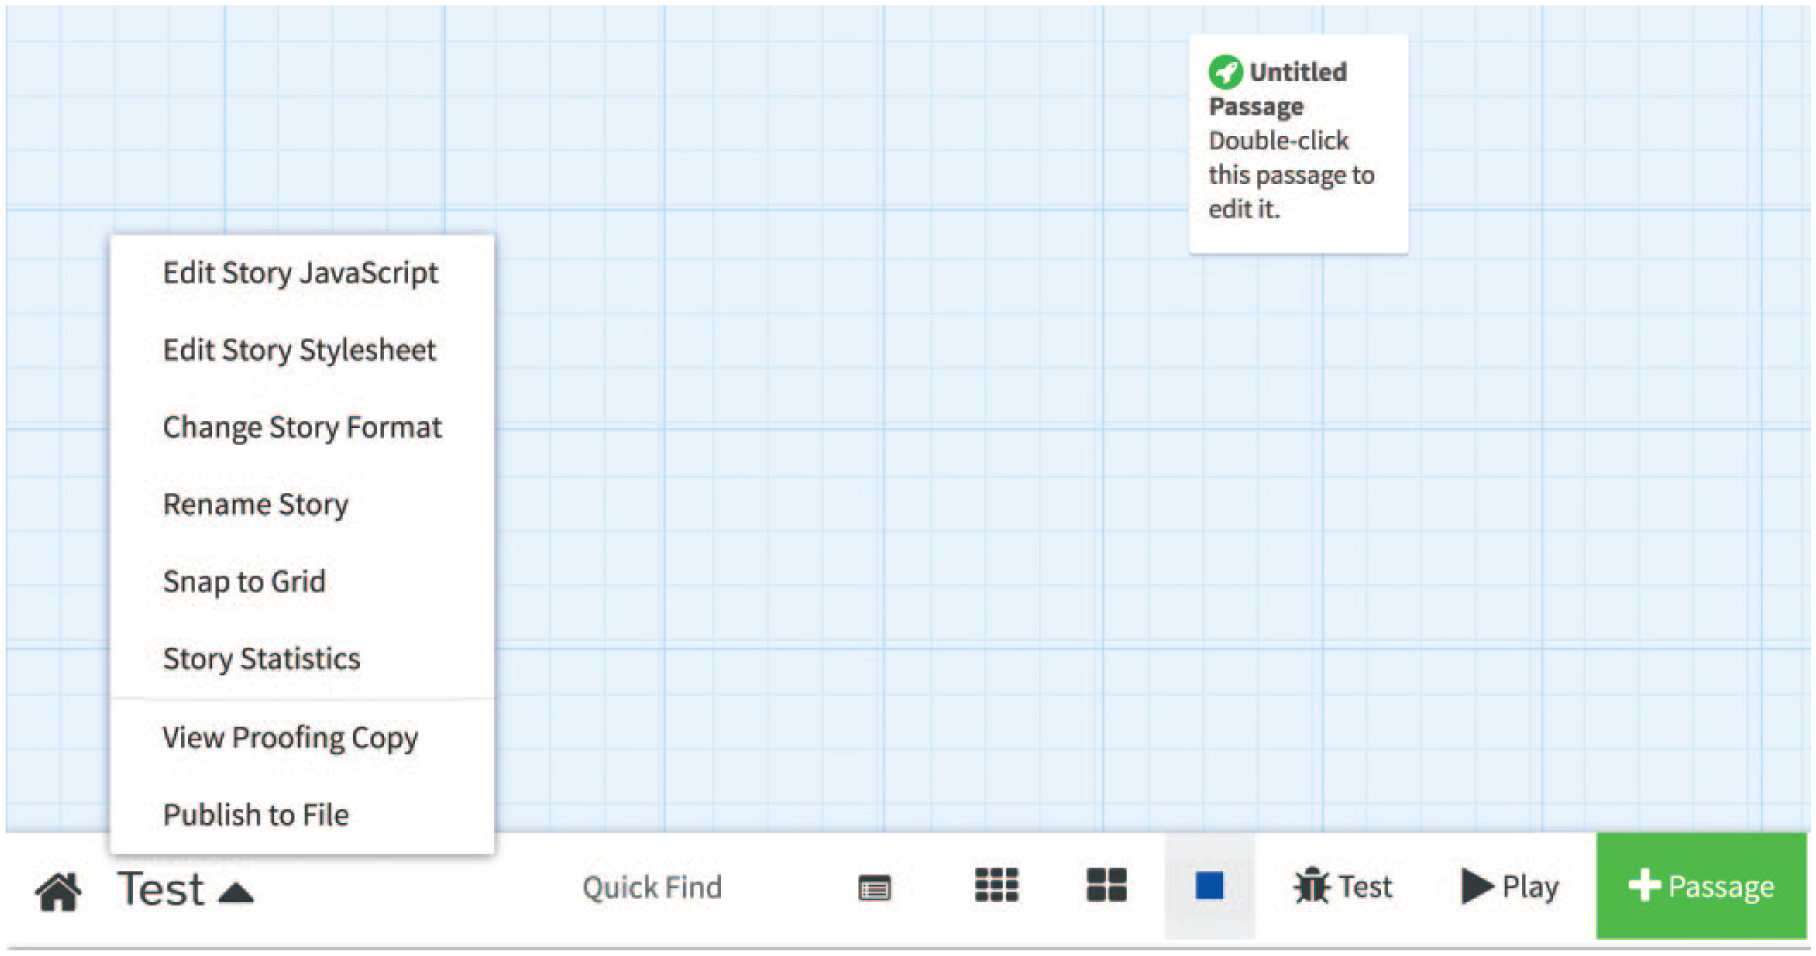
The home screen for a new Twine project in the Twine editor. In this example, the experimenter has clicked the menu triangle at the bottom left. The menu contains many useful options, including the ones used in this Tutorial: Edit Story Stylesheet, Snap to Grid, and Publish to File.
Making your first passage
Twine projects are organized into units called passages. Each of these passages is a page of text with choices formatted as links to other passages, as in a flowchart. Participants are presented the text from one passage, and when they click on one of the choices in that passage, they are shown another passage.
Your new project has opened with one passage, called Untitled Passage. Double-click on the Untitled Passage box, and you will see a pop-up. At the top of this pop-up, change the passage name to Passage1 (see Fig. 3). The passage name is never shown to the participant. We recommend that you avoid using spaces or underscores in passage names because they can make saving participants’ data more difficult in the future. In addition, passage titles are case sensitive.
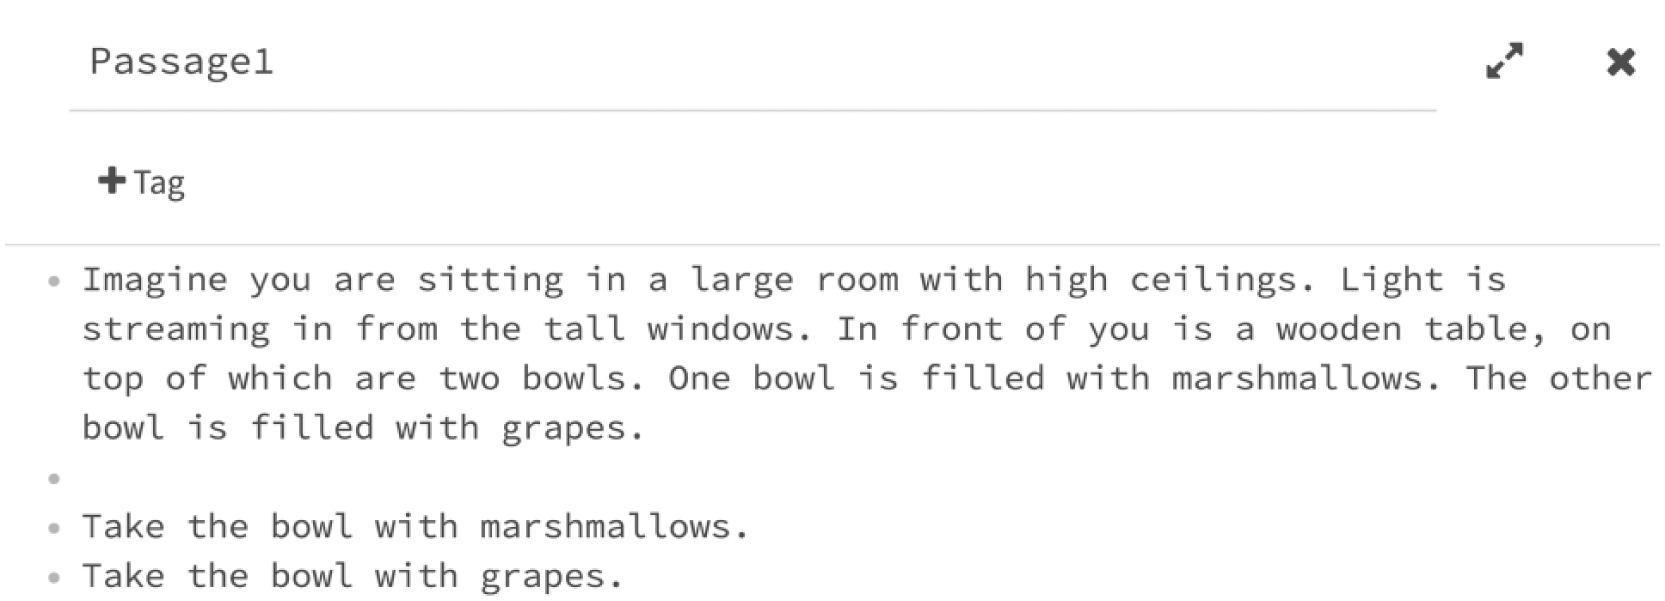
The introduction passage in the example discussed in the Twine Basics section, as seen in the passage editor. Selecting the text at the top (“Passage1”) will allow the experimenter to change the name of the passage (this name is for the experimenter’s reference and is not seen by participants). Clicking on the “x” in the upper right corner will close the passage editor and return the experimenter to the project home screen. Clicking on the main text area beneath the “+Tag” button will allow the experimenter to add text to be seen by participants when they enter the passage (i.e., the description of the scenario and the choice options).
The large box below the passage name is where you need to put the text of the vignette (see Fig. 3). Once you have typed (or pasted) this text, including the choice options, click the “x” button in the upper right corner of the passage pop-up, and then click the “Play” button in the bottom right of your window to preview the project. When you preview your project, you will see your passages as your participants would see them, and once you have created links between them, you will be able to click on those links and move between the passages. At this point, you have just made a static vignette that does not yet allow participants to make any choices. Close the tab with your project preview.
Creating links to other passages
The next step for adding choices is to create the linked passages that participants will encounter when they click on a link in the first passage (also known as the starting point). Suppose participants will choose from two possibilities. Click on “+Passage” in the bottom right corner and then double-click on the new passage. Name your new passage and write the result of the participant’s choice (see Fig. 4a). Close out of your new passage. There will now be two passages on the screen. It does not matter where they are sitting on the screen, so feel free to move them to a logical layout. Now make another result passage for the other option (see Fig. 4b).
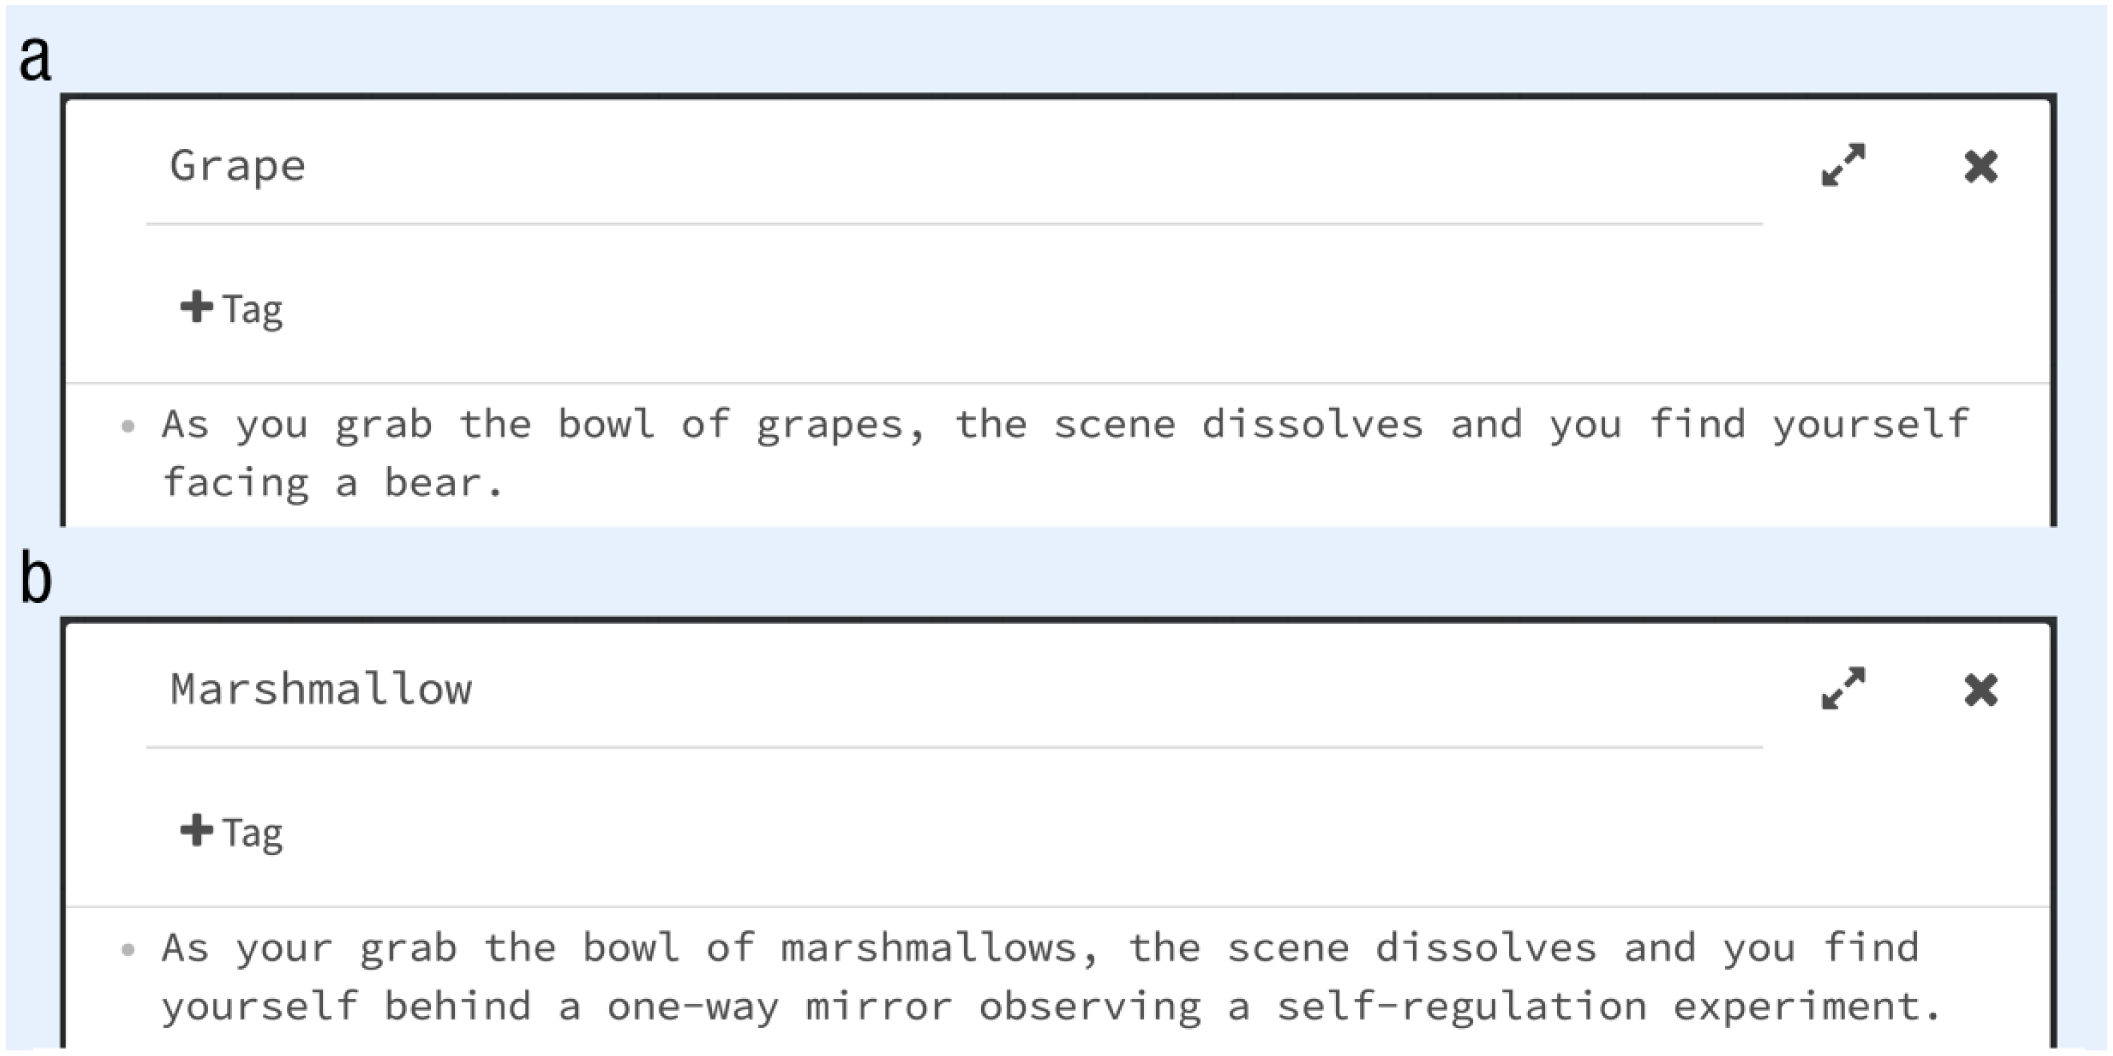
The two result passages for the example discussed in the Twine Basics section, as shown in the Twine project editor: (a) the passage that appears if the participant chooses grapes and (b) the passage that appears if the participant chooses marshmallows.
Now that you have a passage for each of the choices, you must connect the choices in the first passage to the result passages. To do this, double-click on your first passage and edit the choices to look like this:
This is the simplest way to create links in Twine. The text to the left of the “->” is what the participant will see and have the option to select. The text to the right is the exact name of the passage that will be displayed once the participant clicks on that option. Note that a passage name includes any spaces before or after the letters in that name (e.g., “Grape” and “ Grape” would refer to two different passages; see Fig. 5a for a complete breakdown of the syntax).
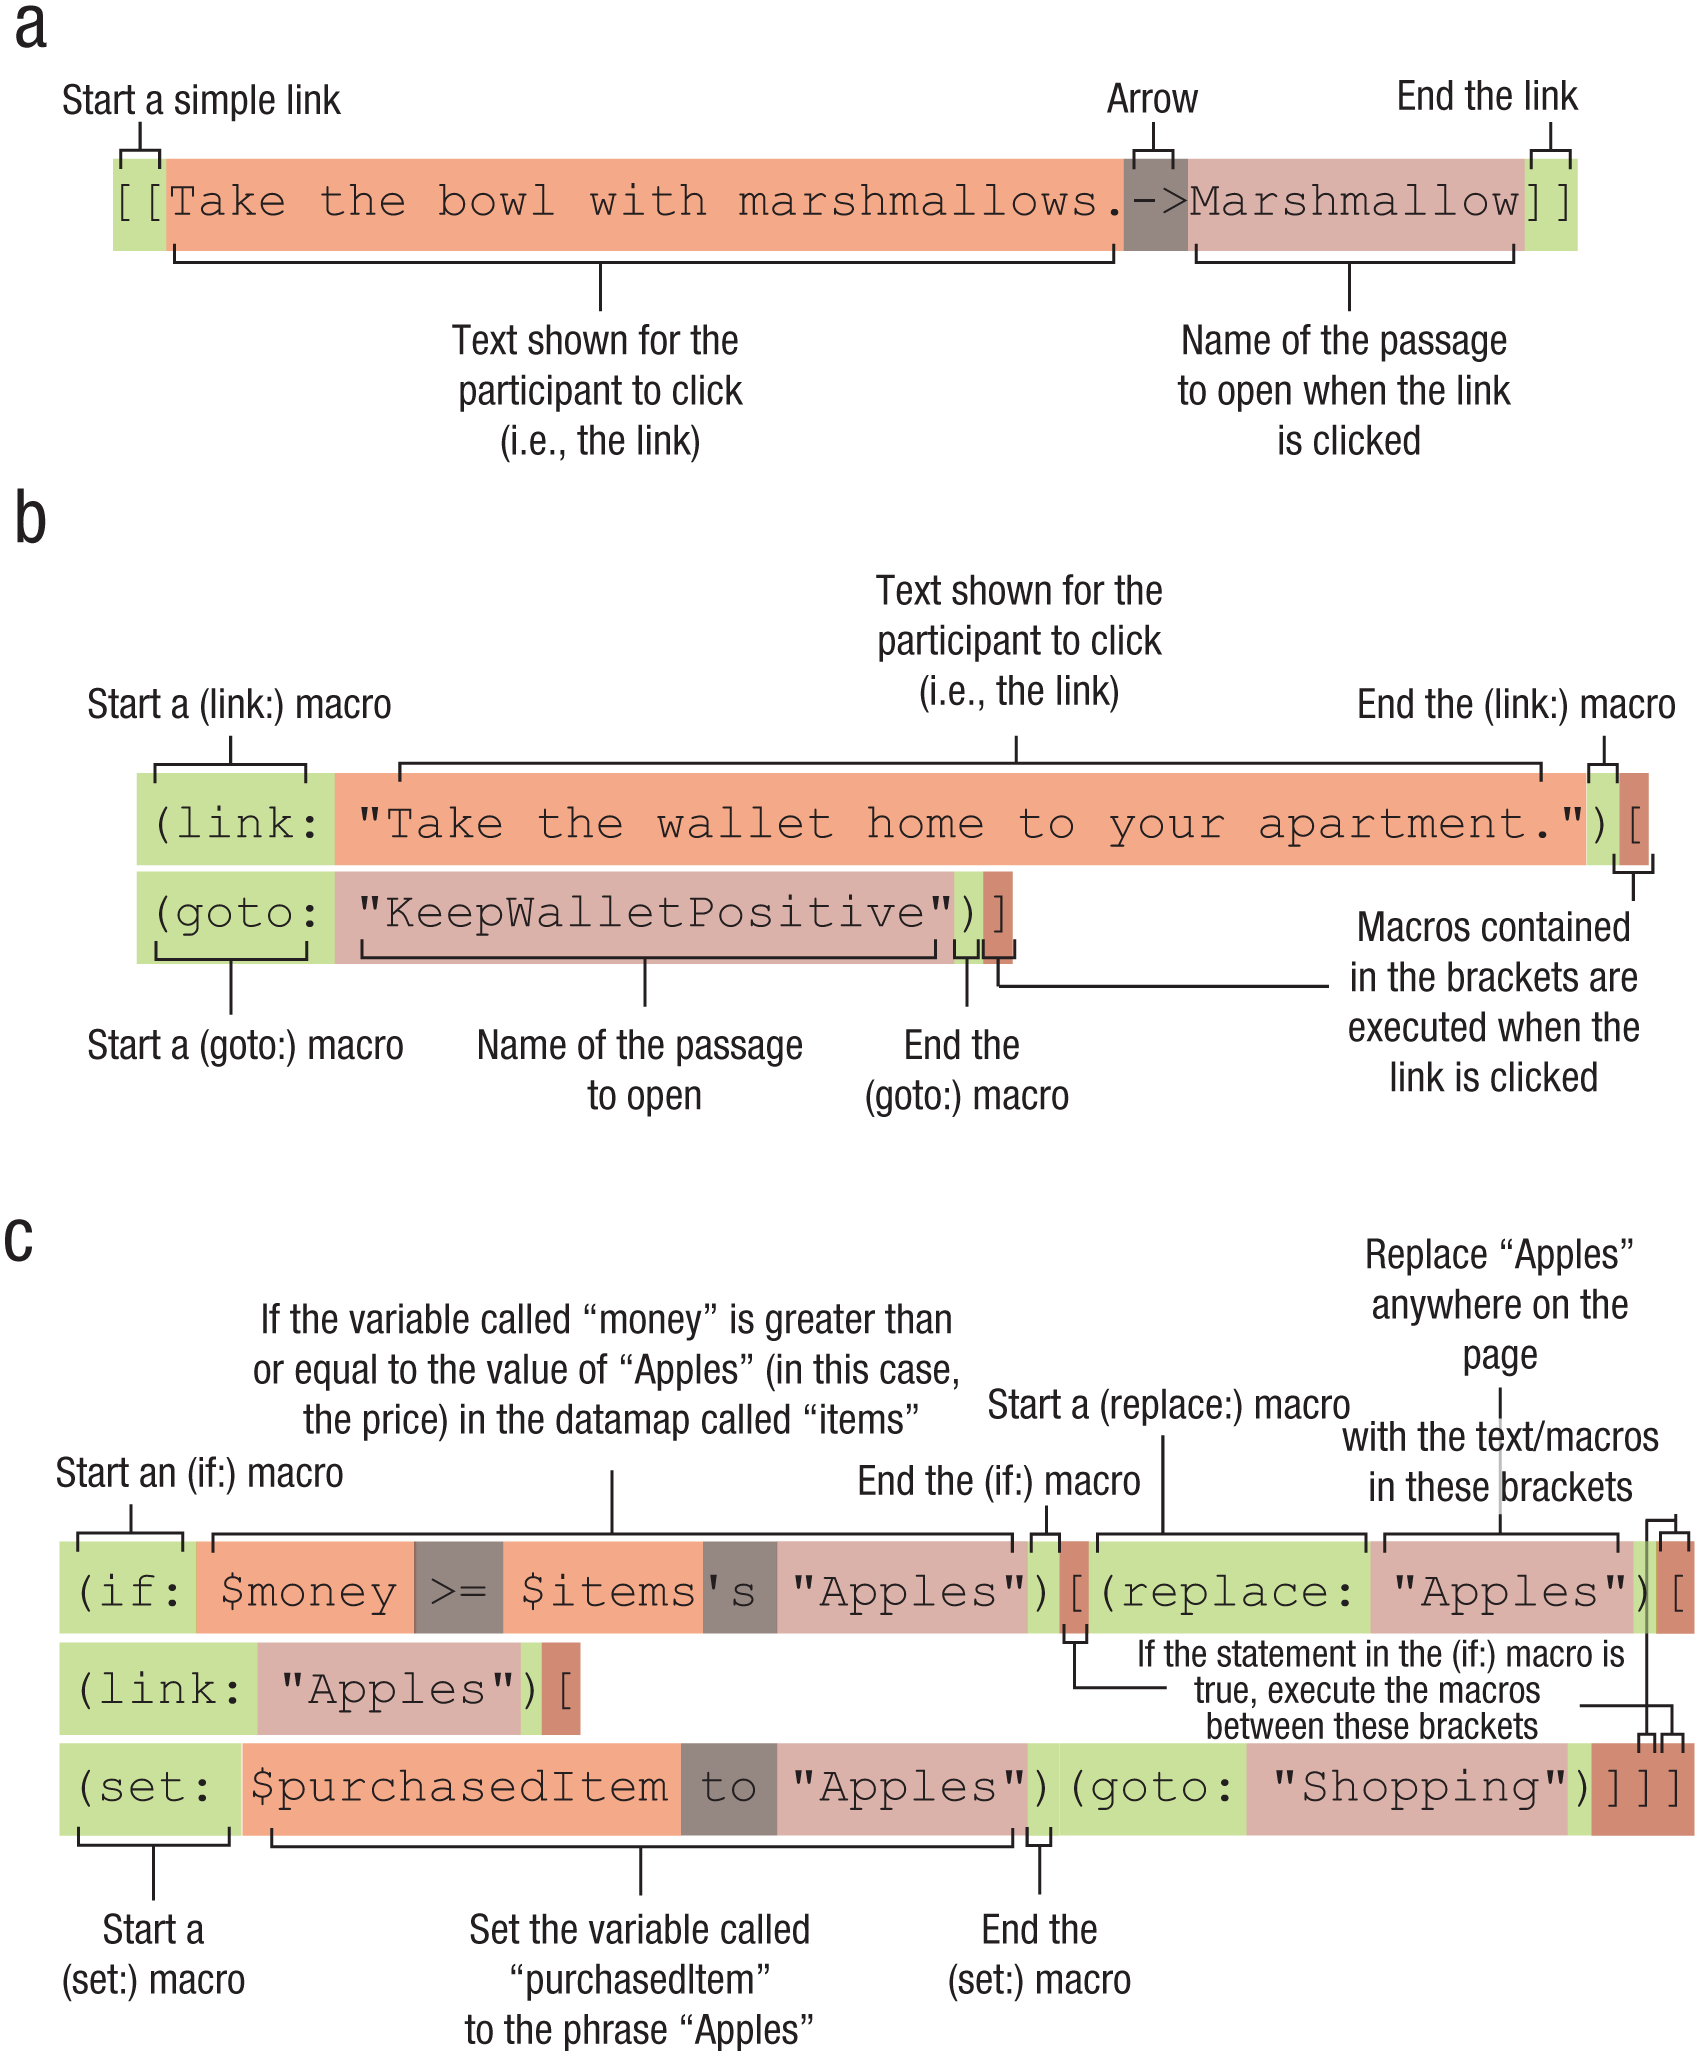
Descriptions of the syntax for code snippets used in this Tutorial. The code snippet from the example discussed in the Twine Basics section (a) shows how to write code that will create a simple link that, when clicked, will direct the participant to another passage. The code snippet from the branching-narrative example (b) shows how to create a link using a (link:) macro and a (goto:) macro. The code snippet from the resource-allocation example (c) breaks down a segment of code that will allow an experimenter to set up a system in which participants can buy only items that they can afford; this is accomplished by converting those items’ names to links using a (replace:) macro.
Your project should now look like the diagram in Figure 6. Click on the “Play” button again to preview the project from the participant’s perspective.
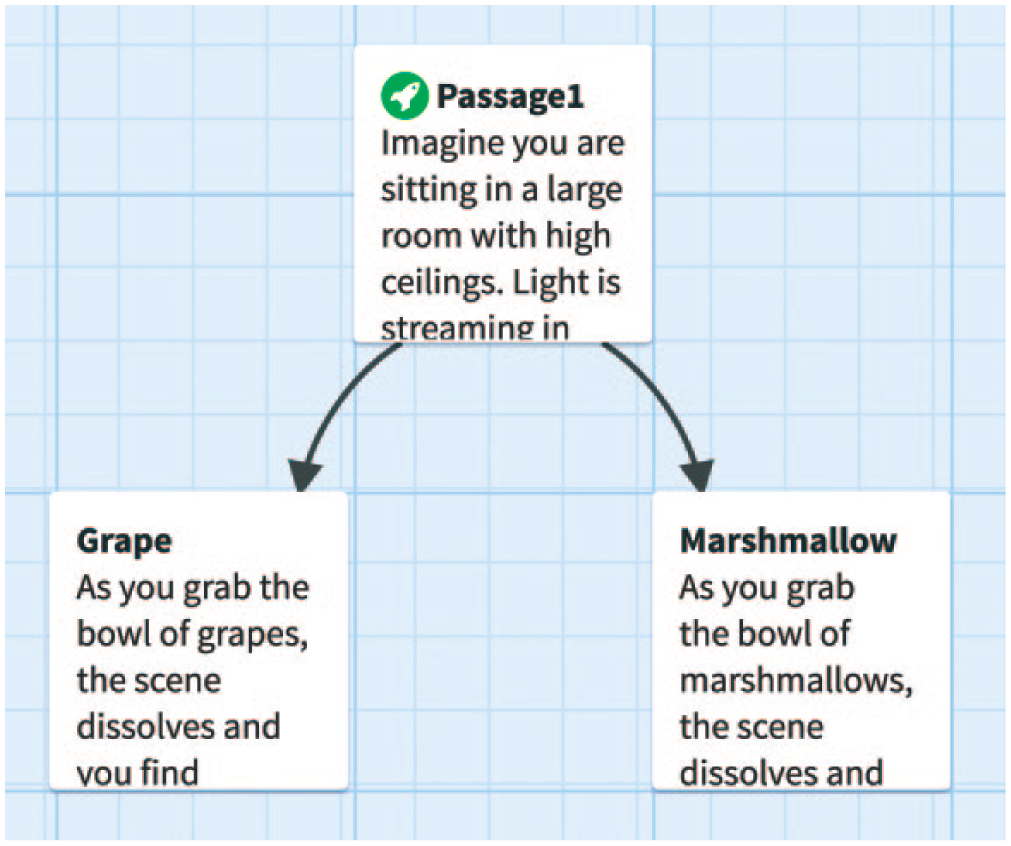
The structure for the example discussed in the Twine Basics section, as shown in the project home screen. The green-rocket-ship icon indicates that Passage1 is the first passage that a participant will see. In this example, the arrows from Passage1 to the Grape and Marshmallow passages indicate that Passage1 contains links that the participant can use to go to either of those passages.
Deleting the back arrow
Once you have clicked on a choice in your preview, you might notice that there is a curved-arrow graphic to the left of the text. This arrow allows participants to undo their choices. In many experiments, this is not an ideal feature to include. To remove this arrow, click the triangle next to the name of your project at the bottom left corner of the screen (see Fig. 2) and select “Edit Story Stylesheet.” This will bring up a pop-up box. In this box, type the following:
If you test your project again, the curved arrow should be gone. (The Twine Basics file in the Supplemental Material available online also shows the final display for this project.)
Saving your project
To avoid the possibility of losing your work or to edit from multiple machines, download a backup of your project. To do this, click on the triangle next to the name of your project at the bottom left corner and select “Publish to File” (in some browsers, you will need to click “save” in the resulting pop-up). The .html file that you just downloaded contains your project. To preview your project, simply double-click on the file, and the file will open in your default browser. To open the file in a different browser, right-click on the file and then click on “open with” and the browser’s name. Currently, Twine is supported on Chrome, Firefox, Opera, Internet Explorer 8+, Safari 5.1+, and iOS Safari 6+. If your file will not load in your chosen browser, check your browser extensions to see if one is interfering with the file. If you want to edit the project on a different computer, you can load it by going to the screen listing your stories, clicking “Import From File,” and browsing for the .html file you downloaded. For example, you could import the Twine Basics .html file from the Supplemental Material using this method.
Three Experimental Structures
Three experimental structures that can be used across most subfields of psychology are particularly well suited to Twine: branching decision making, spatial navigation, and resource allocation. For example, research examining moral judgments, relationship decisions, and impression formation can benefit from a branching-narrative experimental structure in which prior decisions affect future outcomes. Similarly, researchers investigating memory, spatial navigation, and cognitive maps could benefit from using a mazelike experimental structure. Finally, research on economic decision making, cooperation, and competition is likely to be furthered through use of an iterative resource-allocation experimental structure, in which participants make a series of allocation decisions.
Branching narratives
Branching narratives are likely to be particularly useful in studying social judgments, such as attributions, person perception, and impression formation, which are subject to revision and revisiting over time (e.g., with the acquisition of new information or with subsequent interactions). The project we described in the Twine Basics section is a rudimentary branching narrative. That simple branching narrative is one that many researchers would already be able to make using survey software; however, creating this type of experiment is much quicker and easier with Twine than with survey systems. As Figure 1 illustrates, Twine provides a much more intuitive branching scheme.
In this section, we cover a more advanced branching narrative with the addition of random assignment to condition. The goal of this experiment is to examine the impact of feedback on the process of moral licensing (i.e., feeling more comfortable behaving immorally after having just behaved morally; Monin & Miller, 2001): Are individuals less likely to engage in moral licensing if they are provided with negative feedback for their actions?
To begin, start a new project by clicking on the home button, creating a new project, and naming it “Branching Narrative.” In this project, create eight passages as arranged in Figure 1a. The top passage will be the start of your narrative (Introduction). It sets up the moral dilemma of finding a wallet while walking on a city street (Fig. 7).
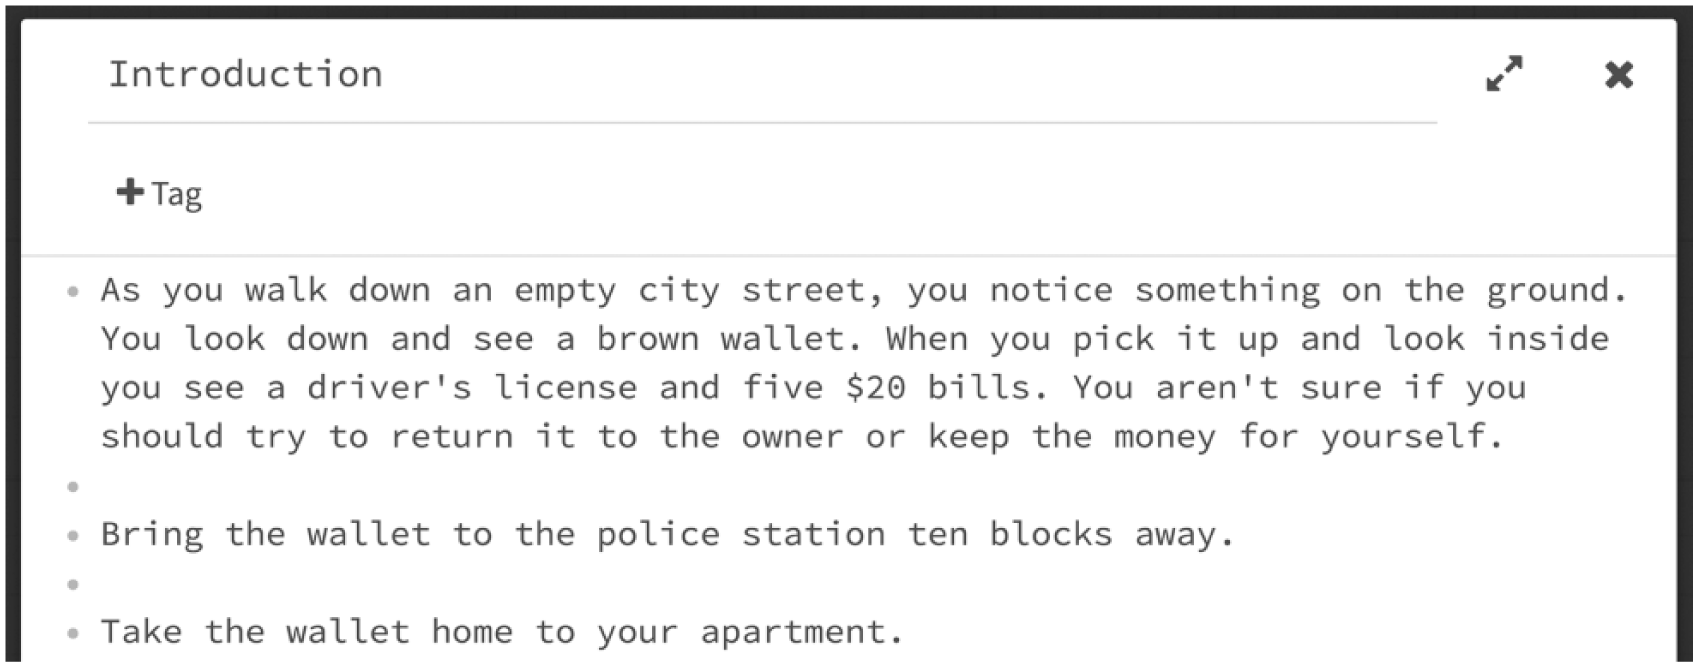
The Introduction passage for the moral dilemma in the branching-narrative example, as seen in the Twine editor screen.
As with the previous example, you will fill in the other passages with your chosen text. In this case, the four passages directly below the Introduction passage will be assigned to participants on the basis of their decisions plus a randomization factor. If, for example, participants choose to keep the wallet, they will be randomly assigned to one of the two KeepWallet passages. If they choose to return it, they will be randomly assigned to one of the two ReturnWallet passages.
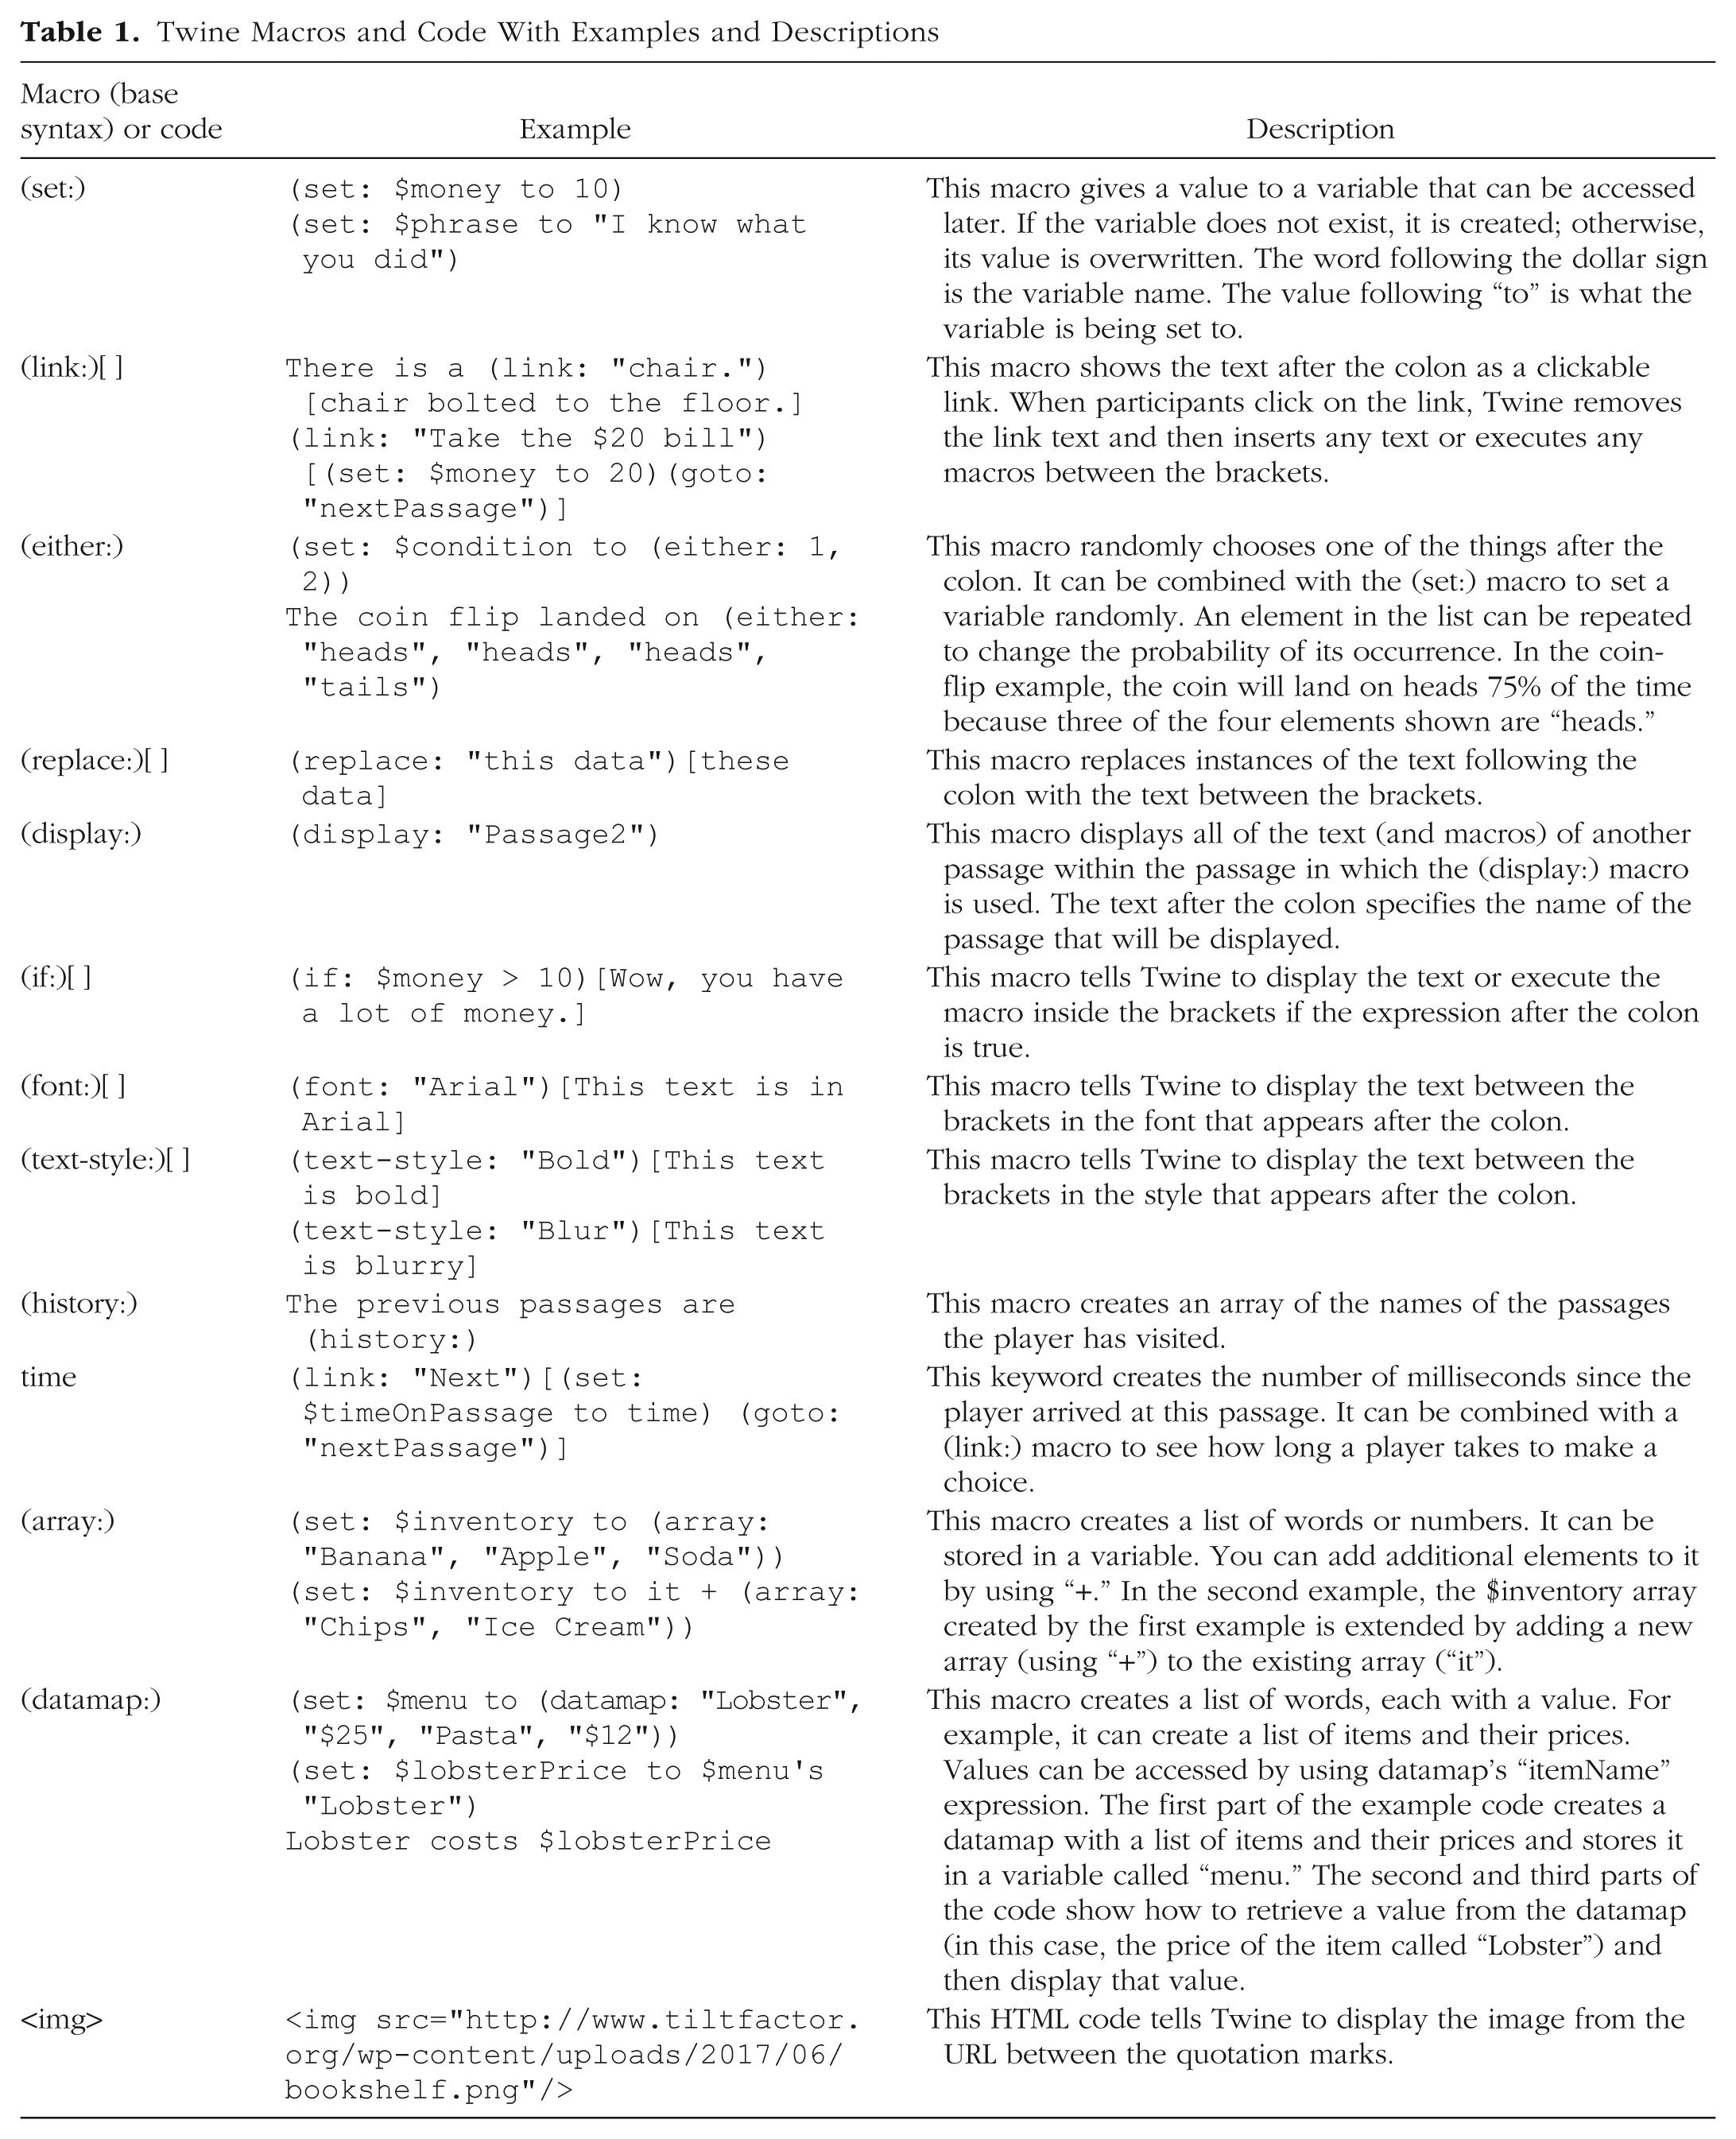
To randomly assign the outcome of clicking on a link, you will use one of the alternate forms of linking that Twine provides via macros that can alter a project’s overall state (see Table 1 for a list of useful Twine macros). Twine’s (link:) macro is a command that can work just like a regular link, as in the following example (see Fig. 5b for a breakdown of the syntax):
Twine Macros and Code With Examples and Descriptions
This code uses two Twine macros. The (link:) macro tells Twine that you want linked text to appear in your passage. The “
You are using the (link:) macro because you do not just want a particular passage to open when the participant clicks on the link; you want one of two passages to open randomly. To achieve this, you will use the (either:) macro. This macro randomly chooses one element out of a list. Replace the choices in the Introduction passage as follows:
In each of these cases, when the user clicks on the link, the (either:) macro will randomly choose one of the two passages to send the user to. This macro can choose one condition from any number of conditions that it is provided with (i.e., it can be used for more than two conditions). In the current example, participants who choose to keep the wallet will be randomly assigned to receive either positive or negative feedback associated with keeping it, and participants who choose to return the wallet will be randomly assigned to receive either positive or negative feedback associated with returning it. Next, you will need to insert a link to the second decision passage (Decision2) in each KeepWallet and ReturnWallet passage. The link,
Spatial navigation
In this section, we go beyond creating a branching narrative and describe an experiment that uses a spatial-navigation structure to create a maze in Twine. Researchers studying memory, perception, and attention processes related to spatial navigation may find Twine useful for creating these spatial experimental structures. To demonstrate how such a structure might be implemented in Twine, we discuss an example showing how to use Twine to measure memory, mental representations, and cognitive mapping by asking participants to reconstruct a maze from memory. In this experiment, participants will view a series of passages in which they make a choice about which direction to take. Much as if they were truly inside a maze, they will never see the top-down view.
Start by creating the structure for your maze. Create nine passages arranged in three rows of three passages each (see Fig. 8). The blocks can be aligned by clicking on the menu triangle at the bottom left of the screen (see Fig. 2) and clicking on “Snap to Grid.” Name each passage with a number and a letter (e.g., A1), as on a chessboard.
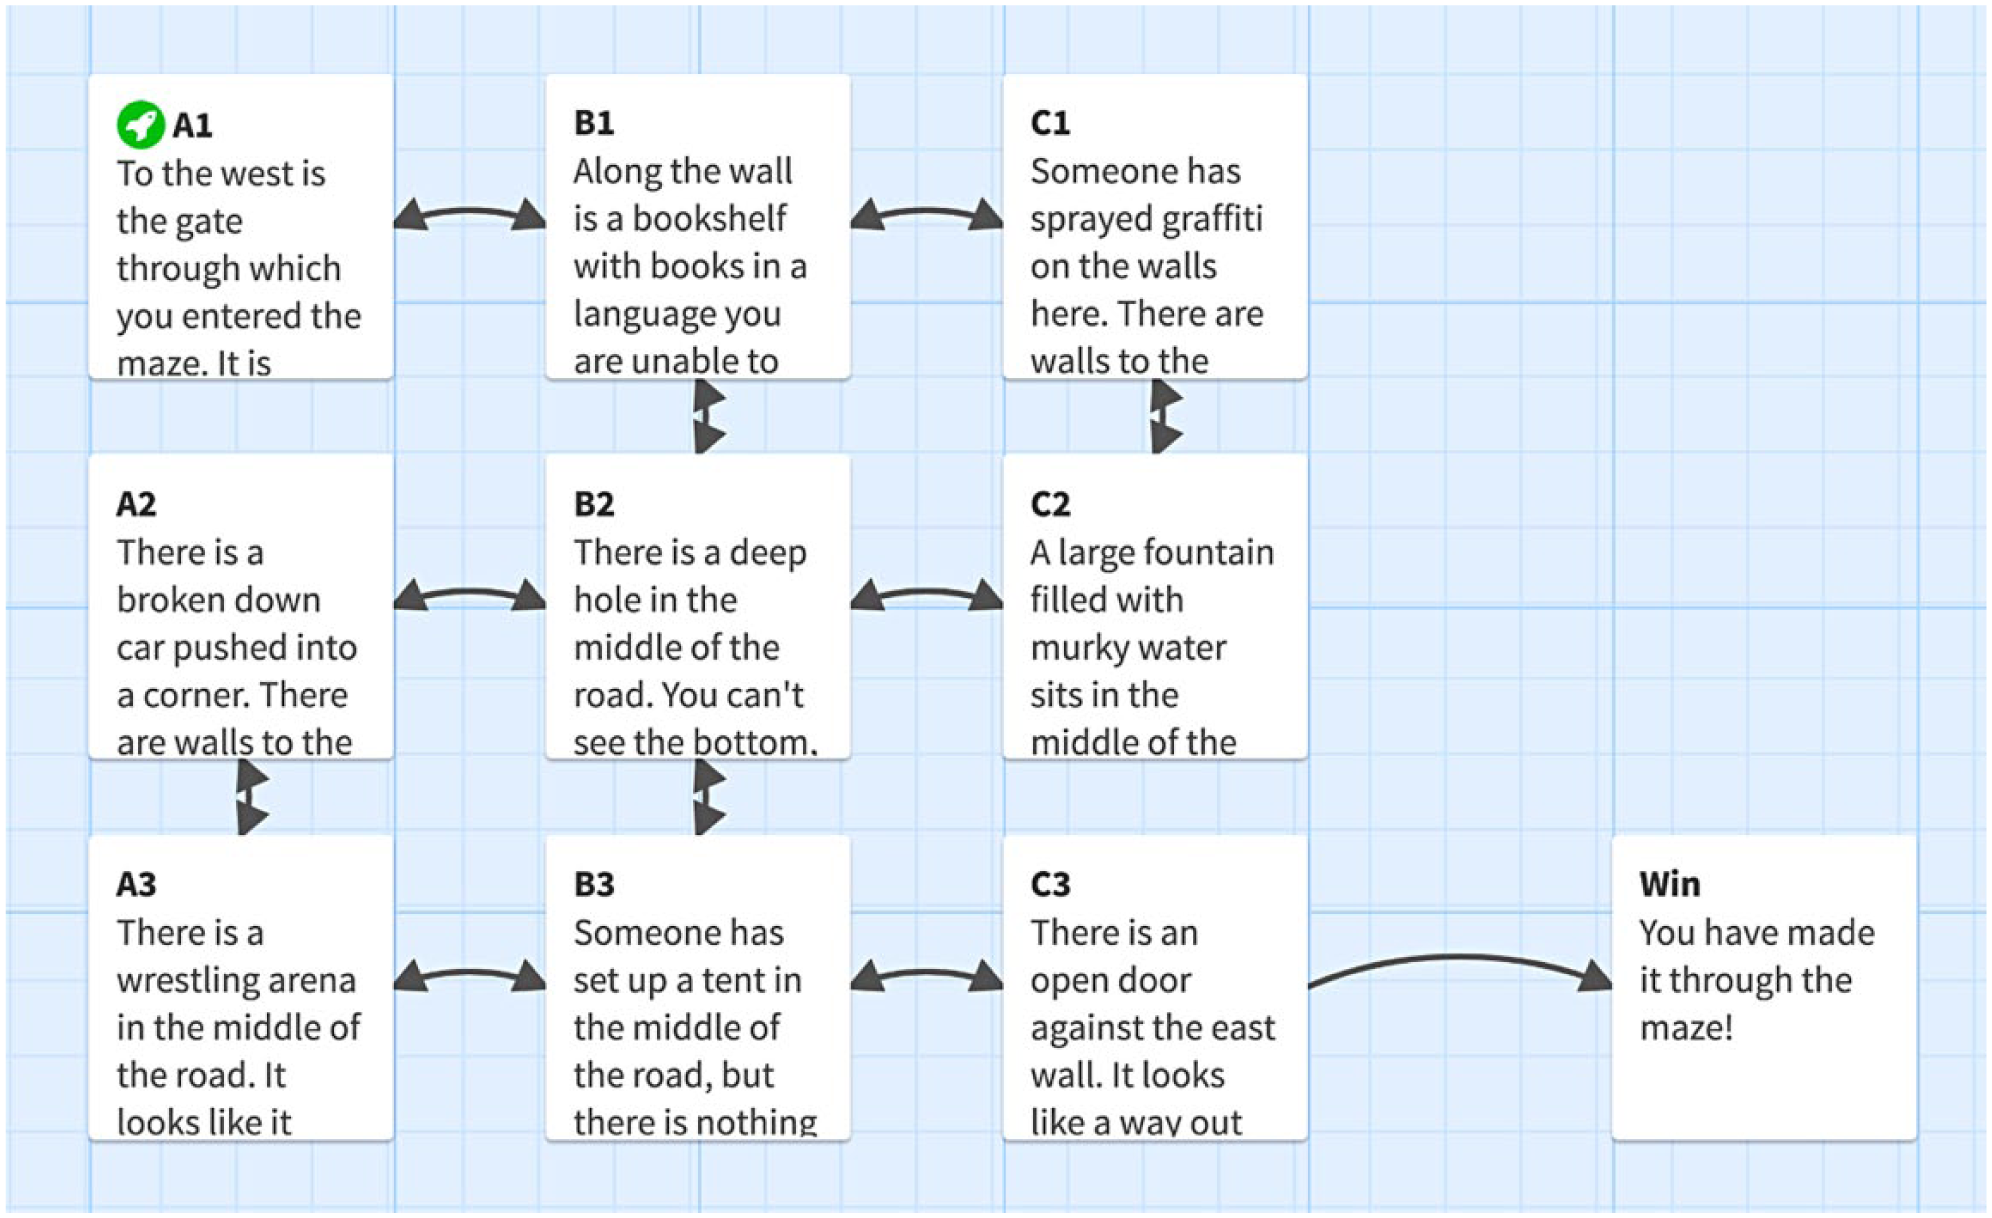
The experimental structure for the spatial-navigation example discussed in the text.
Begin by adding the possible directions to each passage:
After each “->,” put the name of the destination passage (see Fig. 9). Keep in mind that when building a maze, you do not want each destination option in every passage. For example, if a passage has walls to the north, west, and east, only a road to the south is possible. Therefore, only that option should be presented, or, alternatively, you can leave in the links to the other directions but not link them to any passages, which will result in participants seeing grayed-out choices in those directions. In other words, if the code includes “
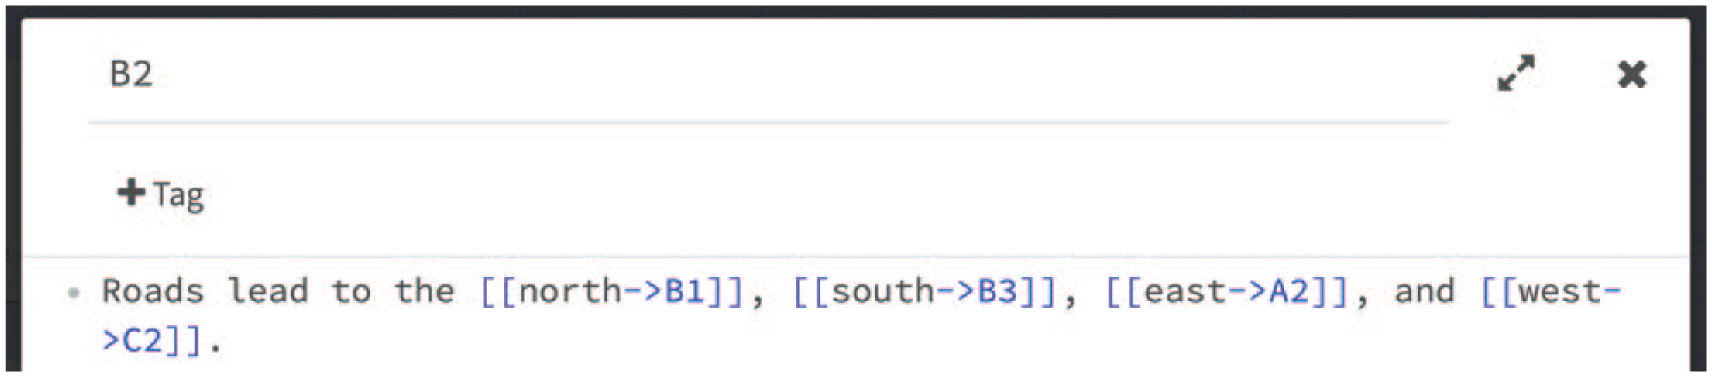
A passage from the spatial-navigation example, as seen in the Twine editor. This passage includes four links to other passages. In the participant’s view, this passage will read, “Roads lead to the north, south, east, and west,” and the words “north,” “south,” “east,” and “west” will be clickable (blue, underlined) HTML links. In the Twine editor, brackets, arrows, and names of linked passages are shown in blue to indicate that they are code and will not appear in the text presented to participants.
As mentioned earlier, a key advantage of Twine over Qualtrics is the more immersive nature of experiments presented in Twine. For instance, the spatial-navigation scenario when presented in Twine can feel more like a narrative participants are exploring than like a survey they are completing, as the scenario might be experienced with the Qualtrics interface (see Fig. 10).
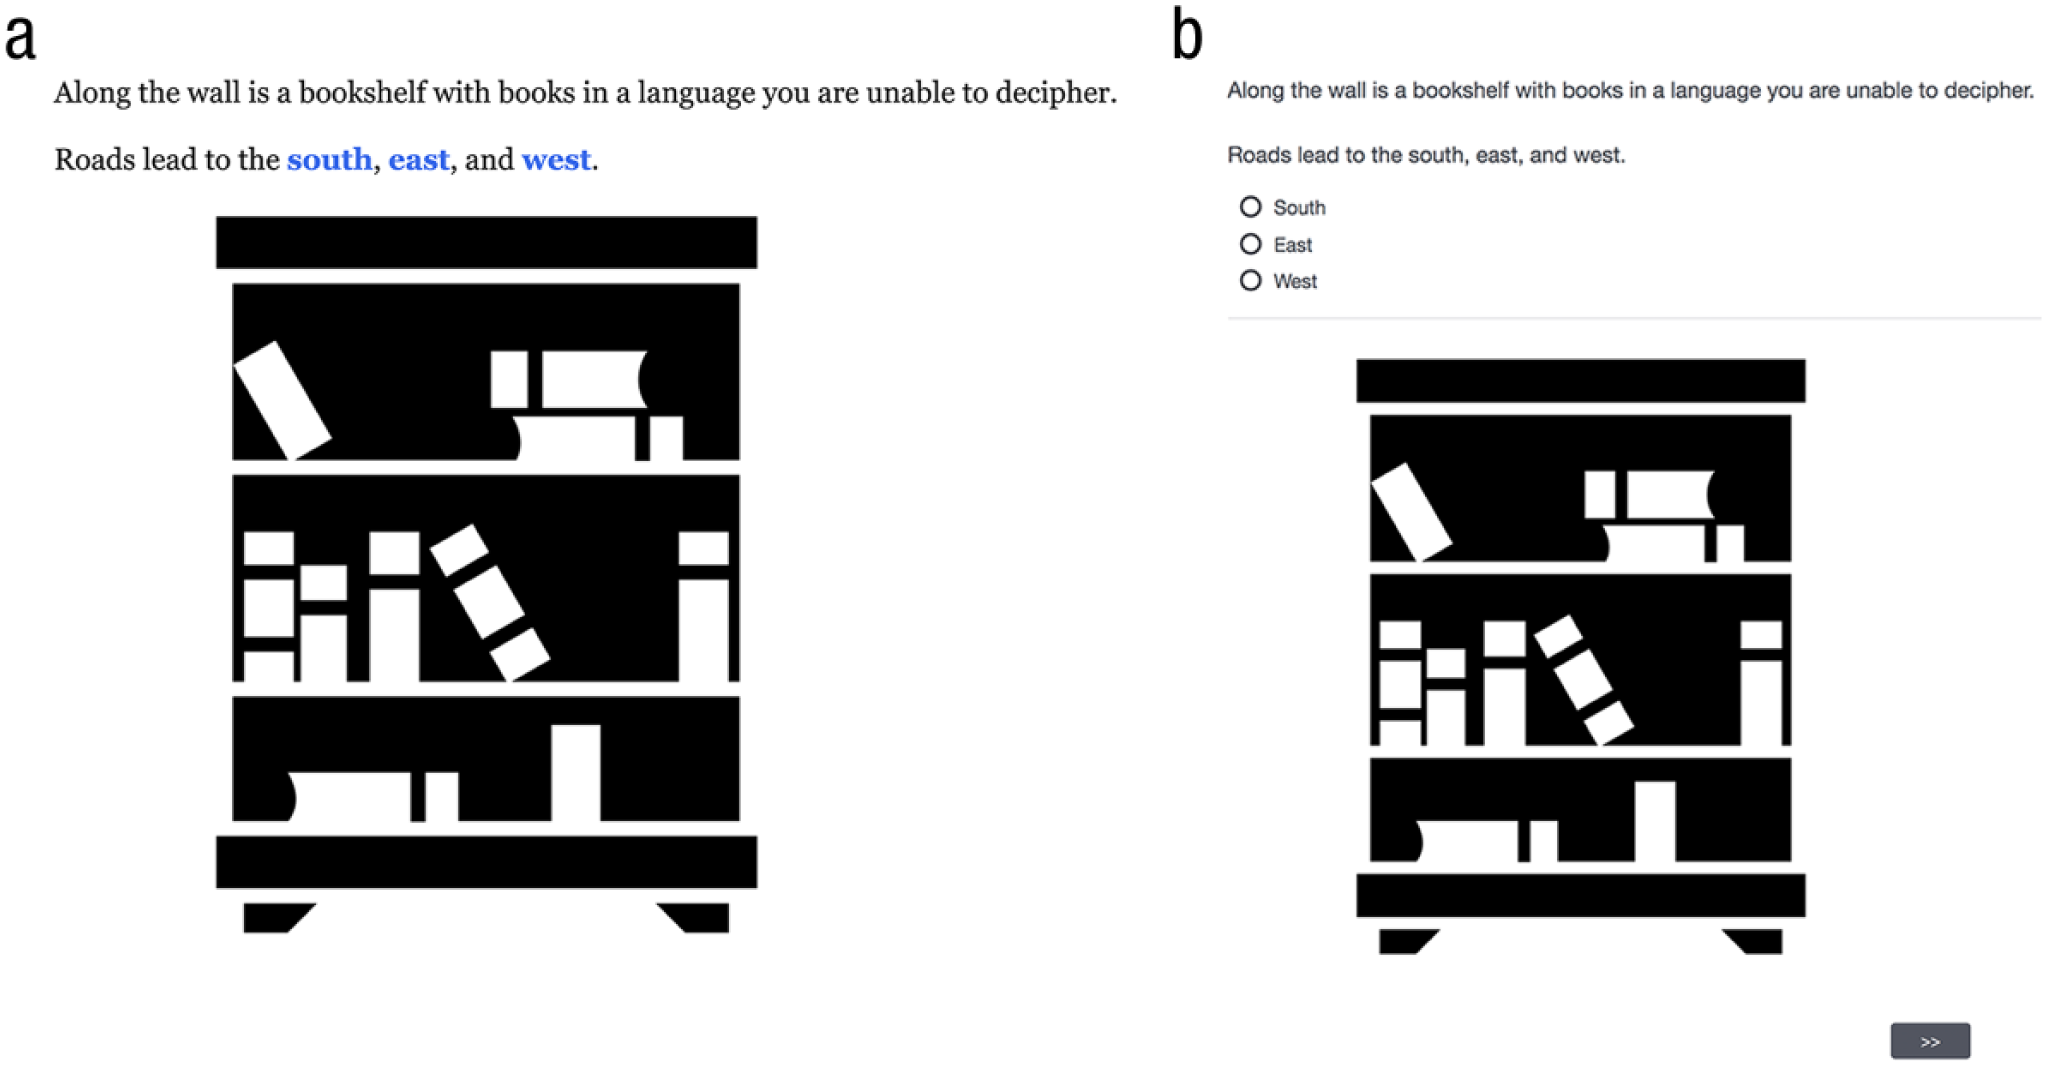
Comparison of displays in Twine and Qualtrics. The image in (a) shows participants’ view of a passage in the spatial-navigation example, and the image in (b) shows the equivalent view if the scenario were created in Qualtrics.
Background and text color
For this project, suppose you want a white background. To change the background color, 3 you will edit the Story Stylesheet (the same place where you took away the back arrow) by adding the following:
To make the text black, add the following text:
Images
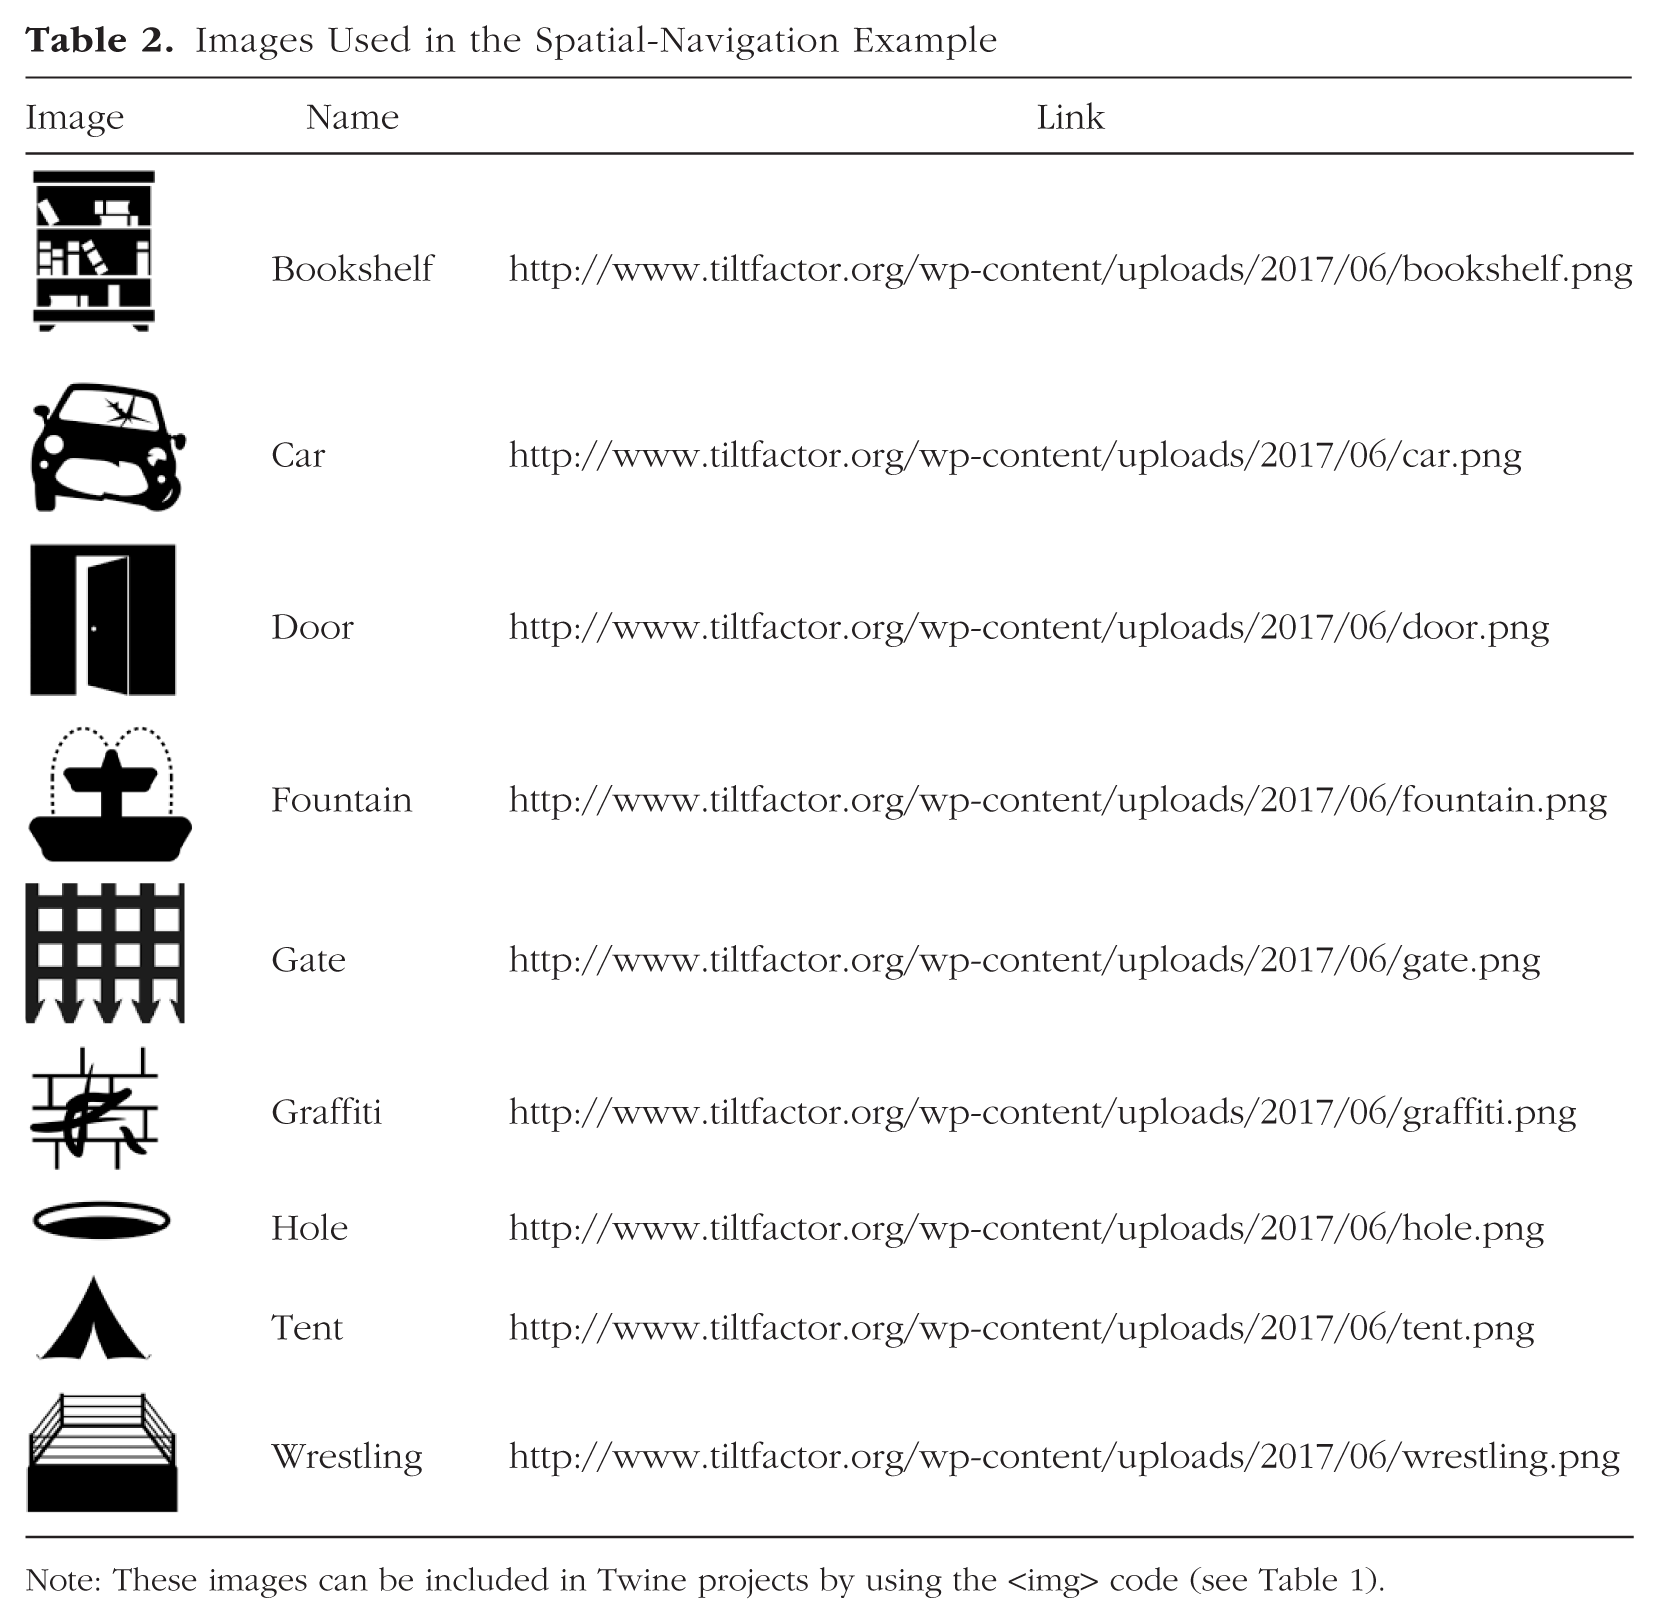
Each passage will contain one image and a line of text describing the image, in addition to the line of text that describes the pathways (“Roads lead. . . .”). An image must be hosted on the Internet if it is going to be put in a Twine story. Although one can incorporate almost any image on the Internet into a Twine project, we recommend that you have the proper permissions to use any images included in your project. We also recommend that you download each image and host it yourself, so that if the original host deletes the image, your study will still function. We have hosted the images for this spatial-navigation example on our lab’s Web site (see Table 2), but images can easily be uploaded to free image-hosting sites, such as Imgur.com.
Images Used in the Spatial-Navigation Example
Note: These images can be included in Twine projects by using the <img> code (see Table 1).
Twine uses HTML code to insert images into a passage. For example, the following code would be used to insert the picture of the gate in one of the passages in the spatial-navigation example:
To use a different image, simply replace the URL in quotes with your image’s URL. (See the Spatial Navigation file in the Supplemental Material to view the final project as it will appear to participants.)
Resource allocation
Resource-allocation experiments in Twine are likely to be valuable for research on behavioral economics topics, including experiments using framing, negotiations, and social-dilemma or game-theory tasks. 4 Imagine an experiment examining the psychological impact of scarcity on shopping behavior in adolescents. In this example experiment, participants are going shopping and have either the same amount of money as a friend or less money than the friend (i.e., a manipulation of relative scarcity). You will measure what items participants choose to buy and whether that is affected by relative scarcity. To begin, set up your structure: an introductory passage (Introduction, including the introductory text that sets up the scenario), a shopping passage (Shopping), and an end passage (End; see Fig. 11).
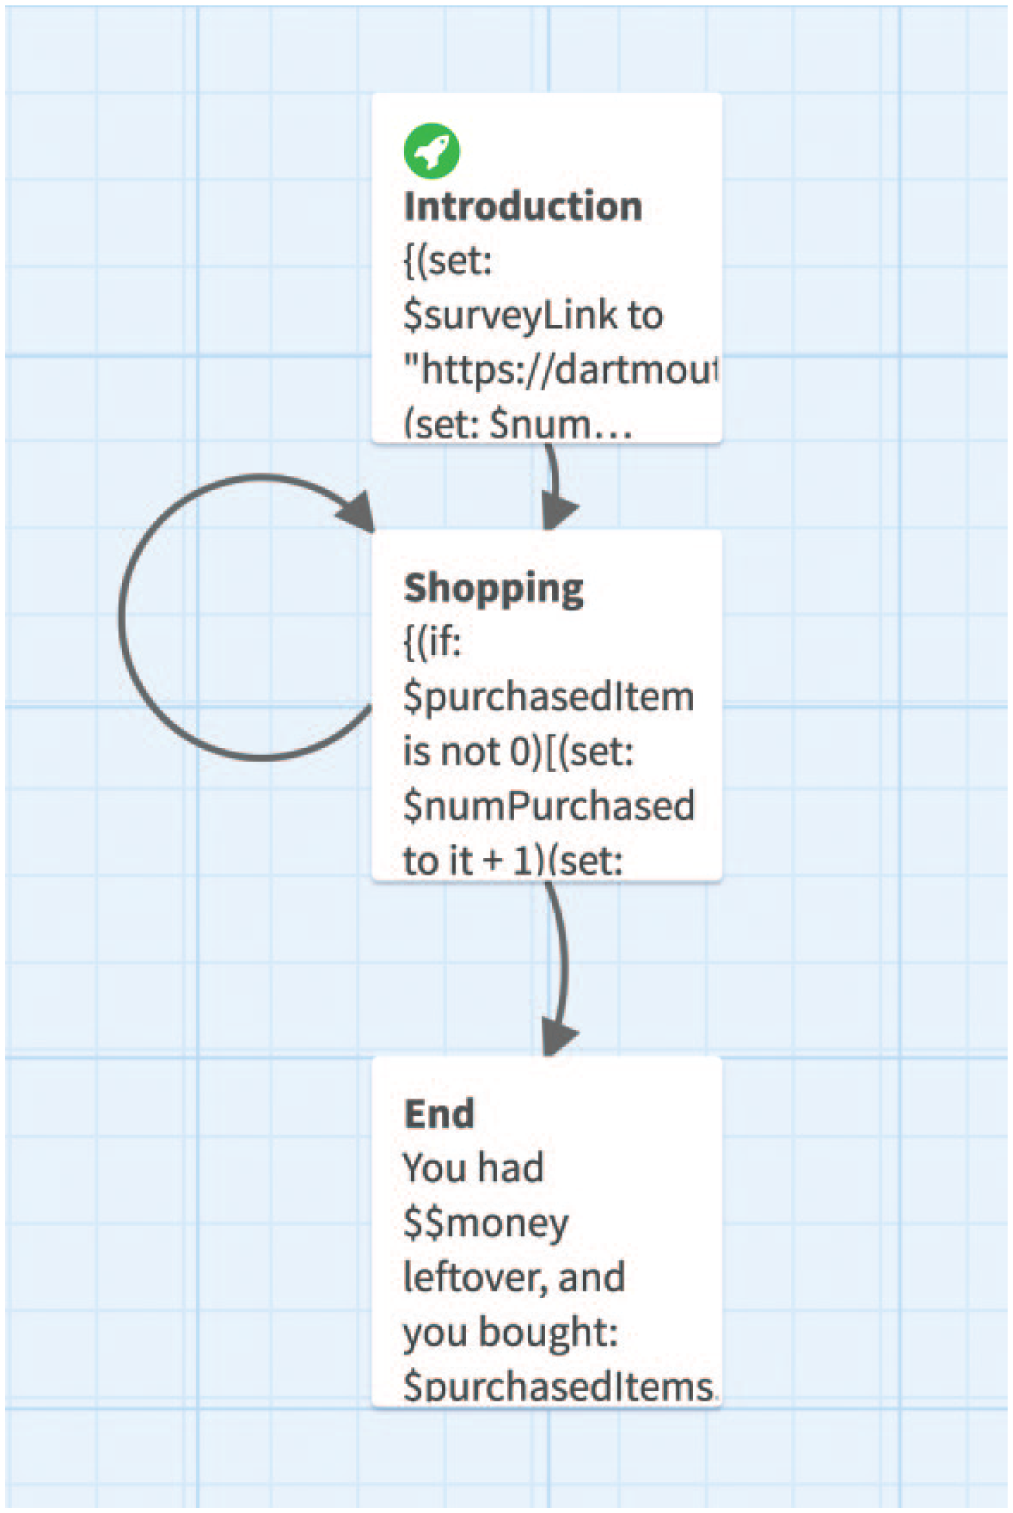
The experimental structure for the resource-allocation example discussed in the text.
Next, provide participants with an initial amount of money. Use the following code at the top of the Introduction passage:
This code creates a variable called “money” and sets it to 10. Then, you want to randomly assign how much money participants’ friends have to spend using the (either:) macro:
This code creates a variable called “friendmoney” and randomly sets it to either 10 or 20. You want to tell the participants how much money both they and their friends have, so in the Introduction, after these two lines of code, type “
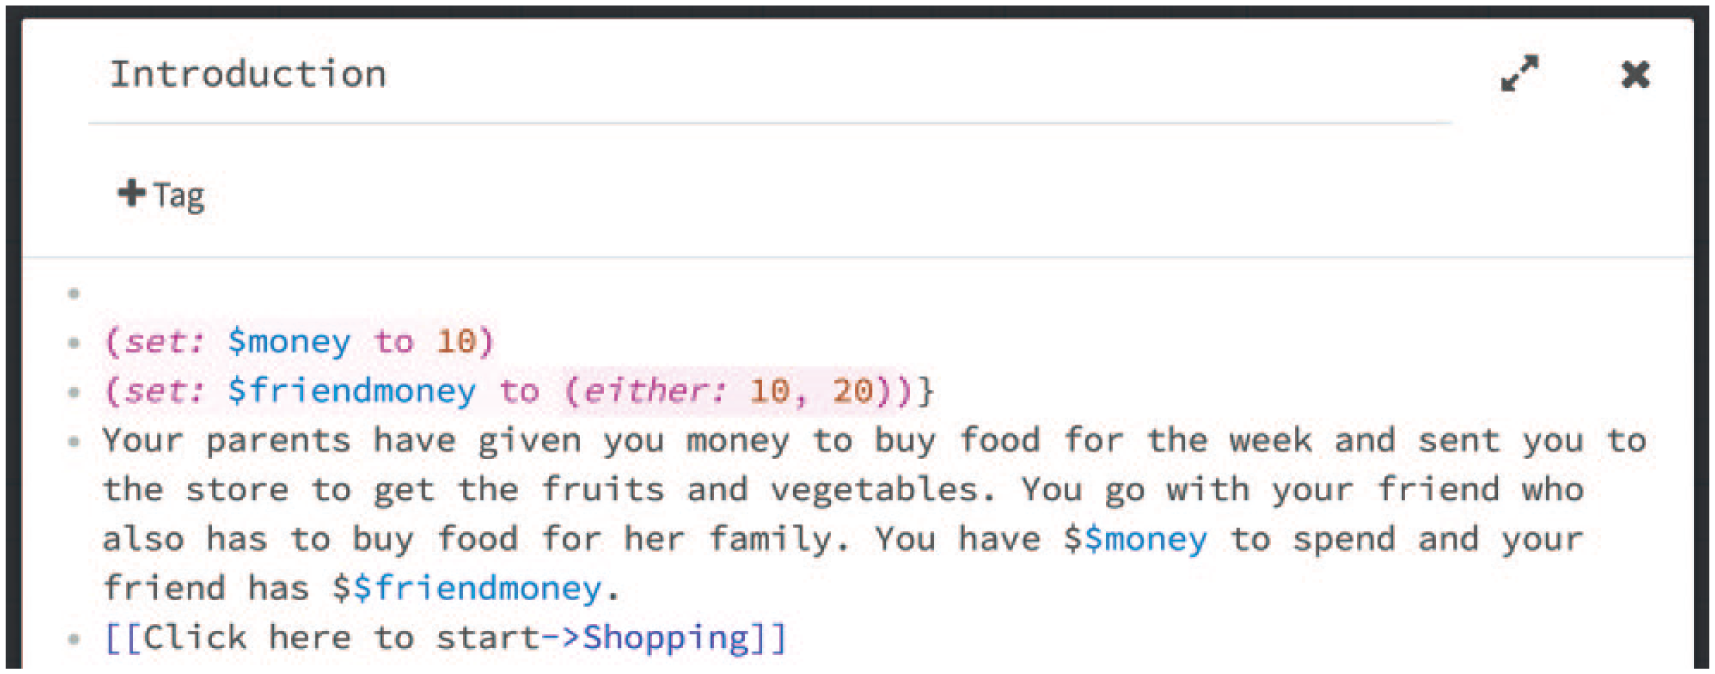
A passage from the resource-allocation example, as seen in the Twine editor. This passage shows how to set variables to fixed numbers using the (set:) macro, set variables to random numbers using the (either:) macro, and display those variables to participants.
Finally, add a link to the empty Shopping passage and preview the project; note that including the variables in the text for the passage results in their values being displayed to participants.
Using datamaps
Datamaps in Twine (known as associative arrays in computer science) are special kinds of variables that store a list of items and a piece of data about each one. You are going to use a datamap to store the list of items available for purchase and their prices (ranging from $1 to $4).
In the Introduction passage, create a new variable called “items,” and set it to a datamap that includes each object, followed by its price:
In the Shopping passage, you first want to tell participants how much money they have by typing “You have $$money left.” Next, you want to show participants a list of the items they can purchase by clicking links on the screen. To do this, type the following:
Now preview the project to see the display participants see when you use the (print:) macro on your datamap. You want participants to be able to click on the various items to buy them. To do this, use the (replace:) macro to replace the item names with links, as in the following example for apples (see Fig. 5c for a breakdown of the syntax):
The first portion of this code, “
At this point, a participant could click on each item, but nothing visible would happen yet. The next step is to reduce a participant’s overall amount of money according to what he or she buys, by typing this code at the top 5 of Shopping:
This code first checks to see if the participant purchased anything. If the participant did, the code using the “it” keyword, which represents the referenced variable’s current value, indicates that the value of the $money variable is calculated by subtracting the purchased item’s cost from the current value.
Next, you want to record what the participant bought. In Introduction, create an empty list to put the items purchased:
This code uses the (unless:) macro, which is the opposite of an (if:) macro, to check to see if the participant has purchased an item yet. If he or she has purchased an item before, the code adds a comma to the $purchasedItems list before adding the purchased item to the list. If the participant has not yet purchased an item, the (unless:) macro skips adding the comma. Note that the items purchased will be stored in chronological order.
Finally, you will need to add a link to the End passage so that the experiment stops when the participant runs out of money or chooses to stop. At the bottom of Shopping, type the following code:
Preview the project, and you will see that the End passage shows what the participant purchased.
Formatting passages
When you preview your project, you may notice that there is extra white space above and below your text. This is because each line of code creates a blank line in the passage. If you want to delete the blank lines, you can put curly braces (i.e., {}) around the code, and they will disappear.
Saving data
It will be important for you to be able to save the choices participants make for future analysis. Twine’s software is robust enough to be able to access many variables, including choices participants make, the time they spend per passage, and randomly generated variables (e.g., condition assignment). However, these data are not automatically saved because unlike experiments run with traditional survey software, Twine projects run on the computer of the user and are not directly connected to a database. Fortunately, Twine can easily send any variable it can access to survey software (e.g., Qualtrics) in order to be saved online. The Twine data thus saved can be exported as a .csv file, in the same way as any other survey data.
In order to send Twine variables to other software for saving, one appends them to a survey link using query strings that transmit the variables to the survey, which then saves them in the embedded data when the participant clicks on a link that uses the (goto-url:) macro, a macro that opens a link to an external Web site (in this case, the Qualtrics survey). Query strings are parameters that are added to the end of a URL; they do not change the Web page the URL directs to but provide certain data that the Web page can access. The basic format for a query string is “variable name = variable value.” In the case of a survey question in Qualtrics, “variable name” would be the question name (i.e., the column title in the .csv data file), and “variable value” would be the data in that column for that participant. You can send any number of query strings, using an ampersand to separate each additional one from the preceding one. Note that the first query string must be separated from the URL with a question mark. For example, if you had three variables (variable1, variable2, and variable3) and your survey URL was https://dartmouth.co1.qualtrics.com/jfe/form/SV_2tRPzlsowvh2bpX, the (goto-url:) code would be the following:
Here is an example of a possible survey link in the resource-allocation scenario:
We now explain how to write code that automatically generates such a URL. Suppose that you want to save the order in which items were purchased. You will need to create a survey in a survey-management system, which will be used to hold the data for the interactive vignette. Here, we provide instructions for using Qualtrics for this purpose; however, you can also use other survey-management software (e.g., SurveyMonkey). 6 Your Qualtrics survey does not need to contain questions. Click the “Survey Flow” button at the top and then click “Add a New Element Here,” followed by “Embedded Data.” In the new Embedded Data section, create 11 fields to store the friend’s money (“friendmoney”) and the maximum number of items the participant could buy (“action1,” “action2,” . . . “action10”). Leave the values blank (i.e., do not click on “Set Value Now”) and click on “Save Flow.” Then copy the anonymous link to your survey from the Qualtrics Distribution tab.
At the top of the Introduction passage of the Twine project, set a new variable by typing “
Next, you have to add the items purchased to the survey link, just as the condition was added. Do this by adding the following code to the top of Shopping:
This code will record the items purchased as well as the order in which they were purchased.
The last step is to send this information to Qualtrics. This is done by adding an external link to Qualtrics at the bottom of the End passage:
When you preview your project, you will find that the only change is that a link labeled “Please take a quick survey” has been added to the End passage (the Resource Allocation file in the Supplemental Material shows the final display for this project). When participants click on the survey link, your survey will record the items the participants purchased as if they were answers to survey questions (see Fig. 13). As with any study, we recommend that you test your project to make sure variables are being saved properly before beginning your data collection. Remember to put the final parts of your experiment in the survey. For example, demographic questions can be asked in the same survey that collects the Twine data.
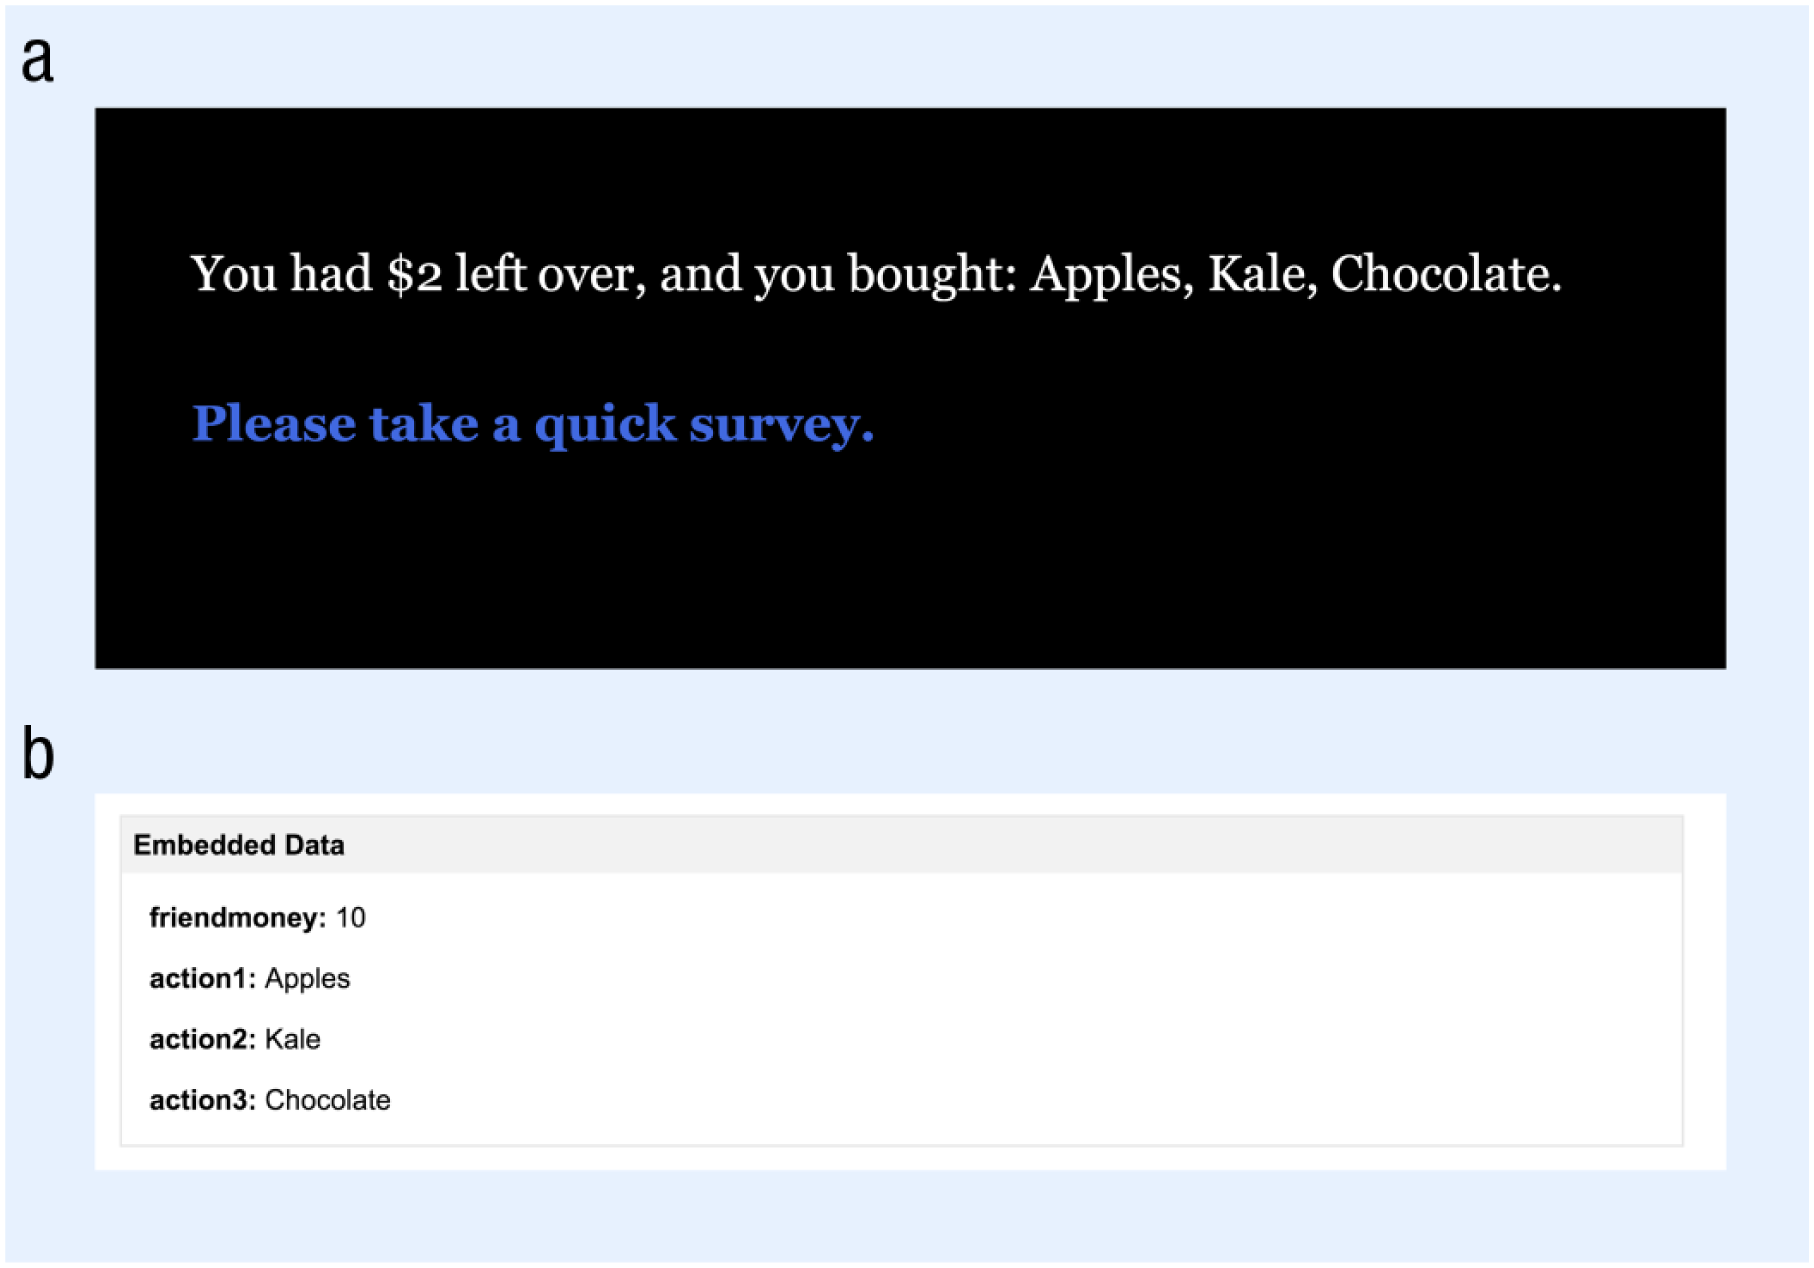
Example of a final display in the resource-allocation experiment and the corresponding data as displayed in the Data & Analysis tab in Qualtrics. At the end of the experiment (a), the participant sees the amount of money left over, the items he or she bought, and a link to the survey that will save the data and allow the participant to complete the experiment. In the Qualtrics display (b), “friendmoney” refers to the randomly assigned condition. In this example, the participant was assigned to the condition in which the friend had $10. The data for the actions (action1, action2, action3) show that the participant first bought apples, then bought kale, and finally bought chocolate.
Summary
In this Tutorial, we have described how to use Twine to set up a range of psychological experiments involving iterative decision making. In addition to outlining the basics of Twine, we have described how to implement three main structures that can be used for experiments in different areas of psychology and how to change display characteristics (e.g., background and text color), add images, incorporate random assignment into experiments, and save data. By using this Tutorial, researchers can begin to incorporate Twine into their vignette studies and update a classic method with new and extended capabilities and functionalities.
Footnotes
Action Editor
Michael Inzlicht served as action editor for this article.
Author Contributions
G. Freedman and M. Seidman jointly wrote the manuscript. M. Flanagan, G. Kaufman, and M. C. Green critically edited it. All the authors approved the final version of the manuscript for submission.
Declaration of Conflicting Interests
The author(s) declared that there were no conflicts of interest with respect to the authorship or the publication of this article.
Funding
This work was supported by the National Science Foundation (Grants DRL-1420036 and 1462063).
Notes
References
Supplementary Material
Please find the following supplemental material available below.
For Open Access articles published under a Creative Commons License, all supplemental material carries the same license as the article it is associated with.
For non-Open Access articles published, all supplemental material carries a non-exclusive license, and permission requests for re-use of supplemental material or any part of supplemental material shall be sent directly to the copyright owner as specified in the copyright notice associated with the article.