
Abstract
Keywords
Introduction
Intravitreal (IVT) antivascular endothelial growth factor (anti-VEGF) therapies are the mainstay of treatment for neovascular age-related macular degeneration (nAMD).1,2 Prevention of leakage from choroidal neovascularization (CNV), and consequently, restoration of anatomic integrity of the retina are 2 of the main objectives of anti-VEGF therapy, with the ultimate goal of improving and/or preserving vision. 2 In addition to vision outcomes, quantitative measures of retinal thickness such as central subfield thickness (CST) are often used to assess disease activity and treatment response to anti-VEGF agents in clinical trials and routine clinical practice. 2
Previous efforts to elucidate the relationship between CST and visual outcomes were not successful in establishing a correlation in patients with nAMD.3 –6 For instance, in a post hoc analysis of the EXCITE trial, best-corrected visual acuity (BCVA) and CST values were correlated only at baseline, with no significant correlation at follow-up visits. 3 Similarly, in a post hoc analysis of the VIEW trials, weak or no correlation was found between changes in CST and BCVA with either aflibercept or ranibizumab, or different dosing regimens of aflibercept. 6 In contrast, evidence from recent studies suggests that higher CST fluctuations during the course of IVT anti-VEGF therapy for nAMD may be associated with worse visual outcomes.7 –12 However, the impact of anti-VEGF agent type and regimen on the relationship between CST fluctuations and visual outcomes is not fully understood.
This post hoc analysis of the VIEW 1 and VIEW 2 trials aimed to evaluate the impact of CST fluctuations on visual outcomes in eyes with nAMD. Specifically, it compared different anti-VEGF agents (aflibercept vs ranibizumab) and treatment regimens (4-week vs 8-week intervals).
Methods
VIEW 1 and VIEW 2 Study Design
VIEW 1 and VIEW 2 (ClinicalTrials.gov: NCT00509795 and NCT00637377, respectively) were 2 similarly designed, multicenter, randomized, double-masked, active-controlled, phase 3 clinical trials. 13 The study protocols were approved at each participating clinical site by the respective institutional review board or ethics committee in accordance with the Declaration of Helsinki. Written informed consent was obtained from all subjects before the study.
Briefly, eligible patients were 50 years of age or older, with active, subfoveal CNV of any subtype secondary to nAMD (including juxtafoveal lesions with subfoveal leakage) that comprised 50% or more of the total lesion size. 13
Patients had BCVA between 73 and 25 Early Treatment Diabetic Retinopathy Study (ETDRS) chart letters (≈20/40–20/320 Snellen equivalent) in the study eye. 13 Patients were ineligible if they were previously treated for nAMD in the study eye. 13
Eyes were randomized to receive IVT ranibizumab 0.5 mg every 4 weeks (Rq4) or IVT aflibercept injection 0.5 mg every 4 weeks (0.5q4), aflibercept 2 mg every 4 weeks (2q4), or aflibercept 2 mg every 8 weeks (2q8), following 3 initial injections at weeks 0, 4, and 8. 13 Eyes were evaluated for BCVA at baseline and every 4 weeks through week 52. 13
CST was examined using time-domain optical coherence tomography (Carl Zeiss Meditec) at baseline and at weeks 4, 12, 24, 36, and 52 in VIEW 1 and at all study visits in VIEW 2, and was evaluated at an independent reading center (VIEW 1: OCT Reading Center at Duke University, Durham, NC, USA; VIEW 2: Vienna Reading Center, Vienna, Austria). 13 All other procedures were conducted as previously described. 13
Post Hoc Analysis
Study Population
This post hoc analysis was performed using integrated data from eyes that received Rq4, or 2q4 or 2q8 in the VIEW 1 and VIEW 2 trials. Data from eyes that received 0.5q4 were excluded from this analysis as, to date, this dose has not been approved by the US Food and Drug Administration. 14 All analyses included all randomized eyes that received a study drug and had a baseline and at least 1 follow-up BCVA assessment. 13 Observed cases were assessed for each outcome.
Outcome Measures
The impact of CST fluctuations on visual outcomes was evaluated using pooled data from all treatment groups across 2 periods. The first period, from baseline to week 52, represented the full study duration and included the initial monthly doses. This analysis did not account for baseline CST variability, which was unrelated to treatment. The second period, from week 12 to week 52, focused on the treatment phase following initial monthly injections and thus reflects more clinically relevant CST fluctuations (Figure 1). The SD of CST for each eye from baseline through week 52 or from week 12 to 52 was calculated and considered to be a measure of individual CST fluctuation. For each period, eyes were placed into quartiles according to the distribution of their CST fluctuations, ranging from the lowest CST fluctuation (quartile 1) to the highest CST fluctuation (quartile 4). Quartiles of CST fluctuation from baseline to week 52 were ≤27.6 µm (quartile 1), >27.6 to ≤42.5 µm (quartile 2), >42.5 to ≤65.3 µm (quartile 3), and >65.3 µm (quartile 4). From weeks 12 to 52, quartiles of CST fluctuation were ≤27.0 µm (quartile 1), >27.0 to ≤43.2 µm (quartile 2), >43.2 to ≤67.8 µm (quartile 3), and >67.8 µm (quartile 4). Eyes with 3 or more CST observations were included in the analysis.
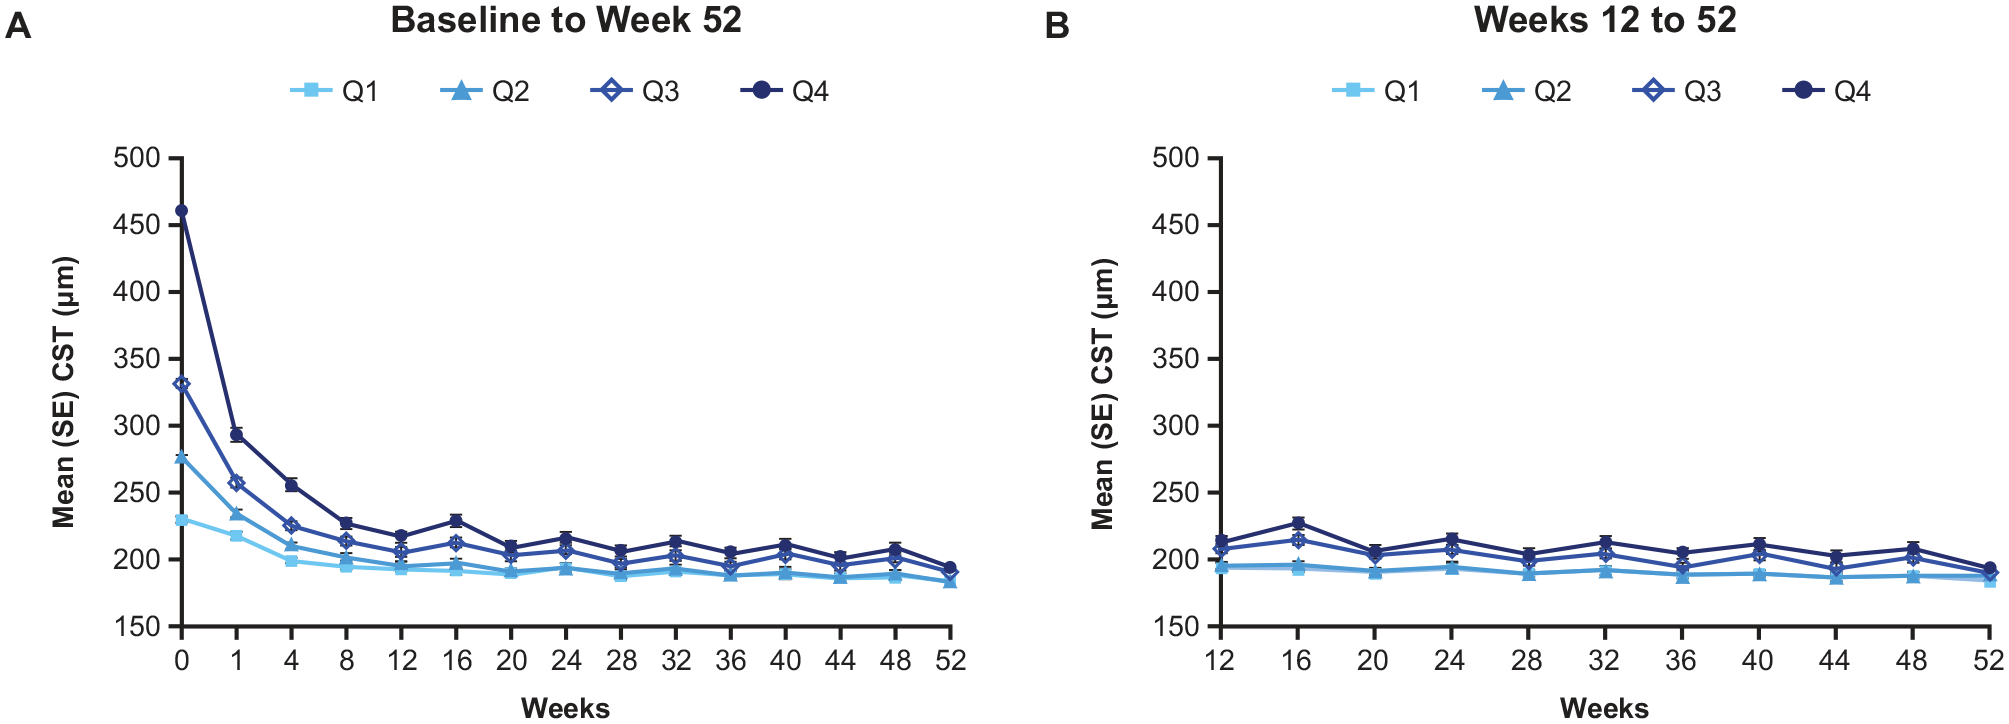
CST fluctuations from baseline to week 52 and weeks 12 to 52 in patients with neovascular age-related macular degeneration. (A) CST quartiles from baseline to week 52: quartile 1: ≤27.6 µm; quartile 2: >27.6 to ≤42.5 µm; quartile 3: >42.5 to ≤65.3 µm; quartile 4: >65.3 µm. (B) CST quartiles from weeks 12 to 52: quartile 1: ≤27.0 µm; quartile 2: >27.0 to ≤43.2 µm; quartile 3: >43.2 to ≤67.8 µm; quartile 4: >67.8 µm.
Statistical Analysis
Baseline patient demographic and disease characteristics were summarized descriptively by quartiles of CST fluctuation from baseline to week 52 and from weeks 12 to 52. The least squares mean change in BCVA from baseline to week 52 was evaluated by quartile of CST fluctuation and by treatment group (2q4, 2q8, and Rq4) using a mixed model for repeated measures that was adjusted for baseline BCVA and CNV lesion size. Least squares mean differences between each quartile (quartiles 2, 3, and 4) and the lowest (reference) quartile (quartile 1) were estimated and compared using the Mantel-Haenszel weighting scheme. For the proportion of eyes with BCVA gain or loss at week 52, differences between each quartile (quartiles 2, 3, and 4) and quartile 1 were evaluated using the Cochran-Mantel-Haenszel method.
Nominal P values were reported for all visual outcomes, with P < .05 indicating nominal significance. Statistical analyses were conducted using SAS (version 9.4, SAS Institute).
Results
Baseline Patient Characteristics
Analysis of fluctuation from baseline to week 52 included 1792 eyes, and from week 12 to week 52 included 1766 eyes. Patient demographics in both analyses were comparable across quartiles of CST fluctuation (Table 1). In both analyses, a trend of decreasing BCVA, increasing CST, and increasing CNV lesion size was observed at baseline across quartiles of increasing CST fluctuation (Table 1). The proportions of eyes with occult lesions decreased across quartiles, whereas the proportions of eyes with predominantly and minimally classic lesions tended to increase across quartiles (Table 1). Baseline demographic and disease characteristics were generally well-balanced across treatment groups within each quartile of CST fluctuation (Supplemental Tables S1 and S2). Distribution of treatment groups within each quartile of CST fluctuation is shown in Supplemental Table S3. In both analyses, trends of increasing proportions of eyes treated with 2q8 were observed across increasing quartiles of CST fluctuation (from quartile 1 to quartile 4; Supplemental Table S3).
Baseline Demographics and Disease Characteristics by Quartile of CST Fluctuation.
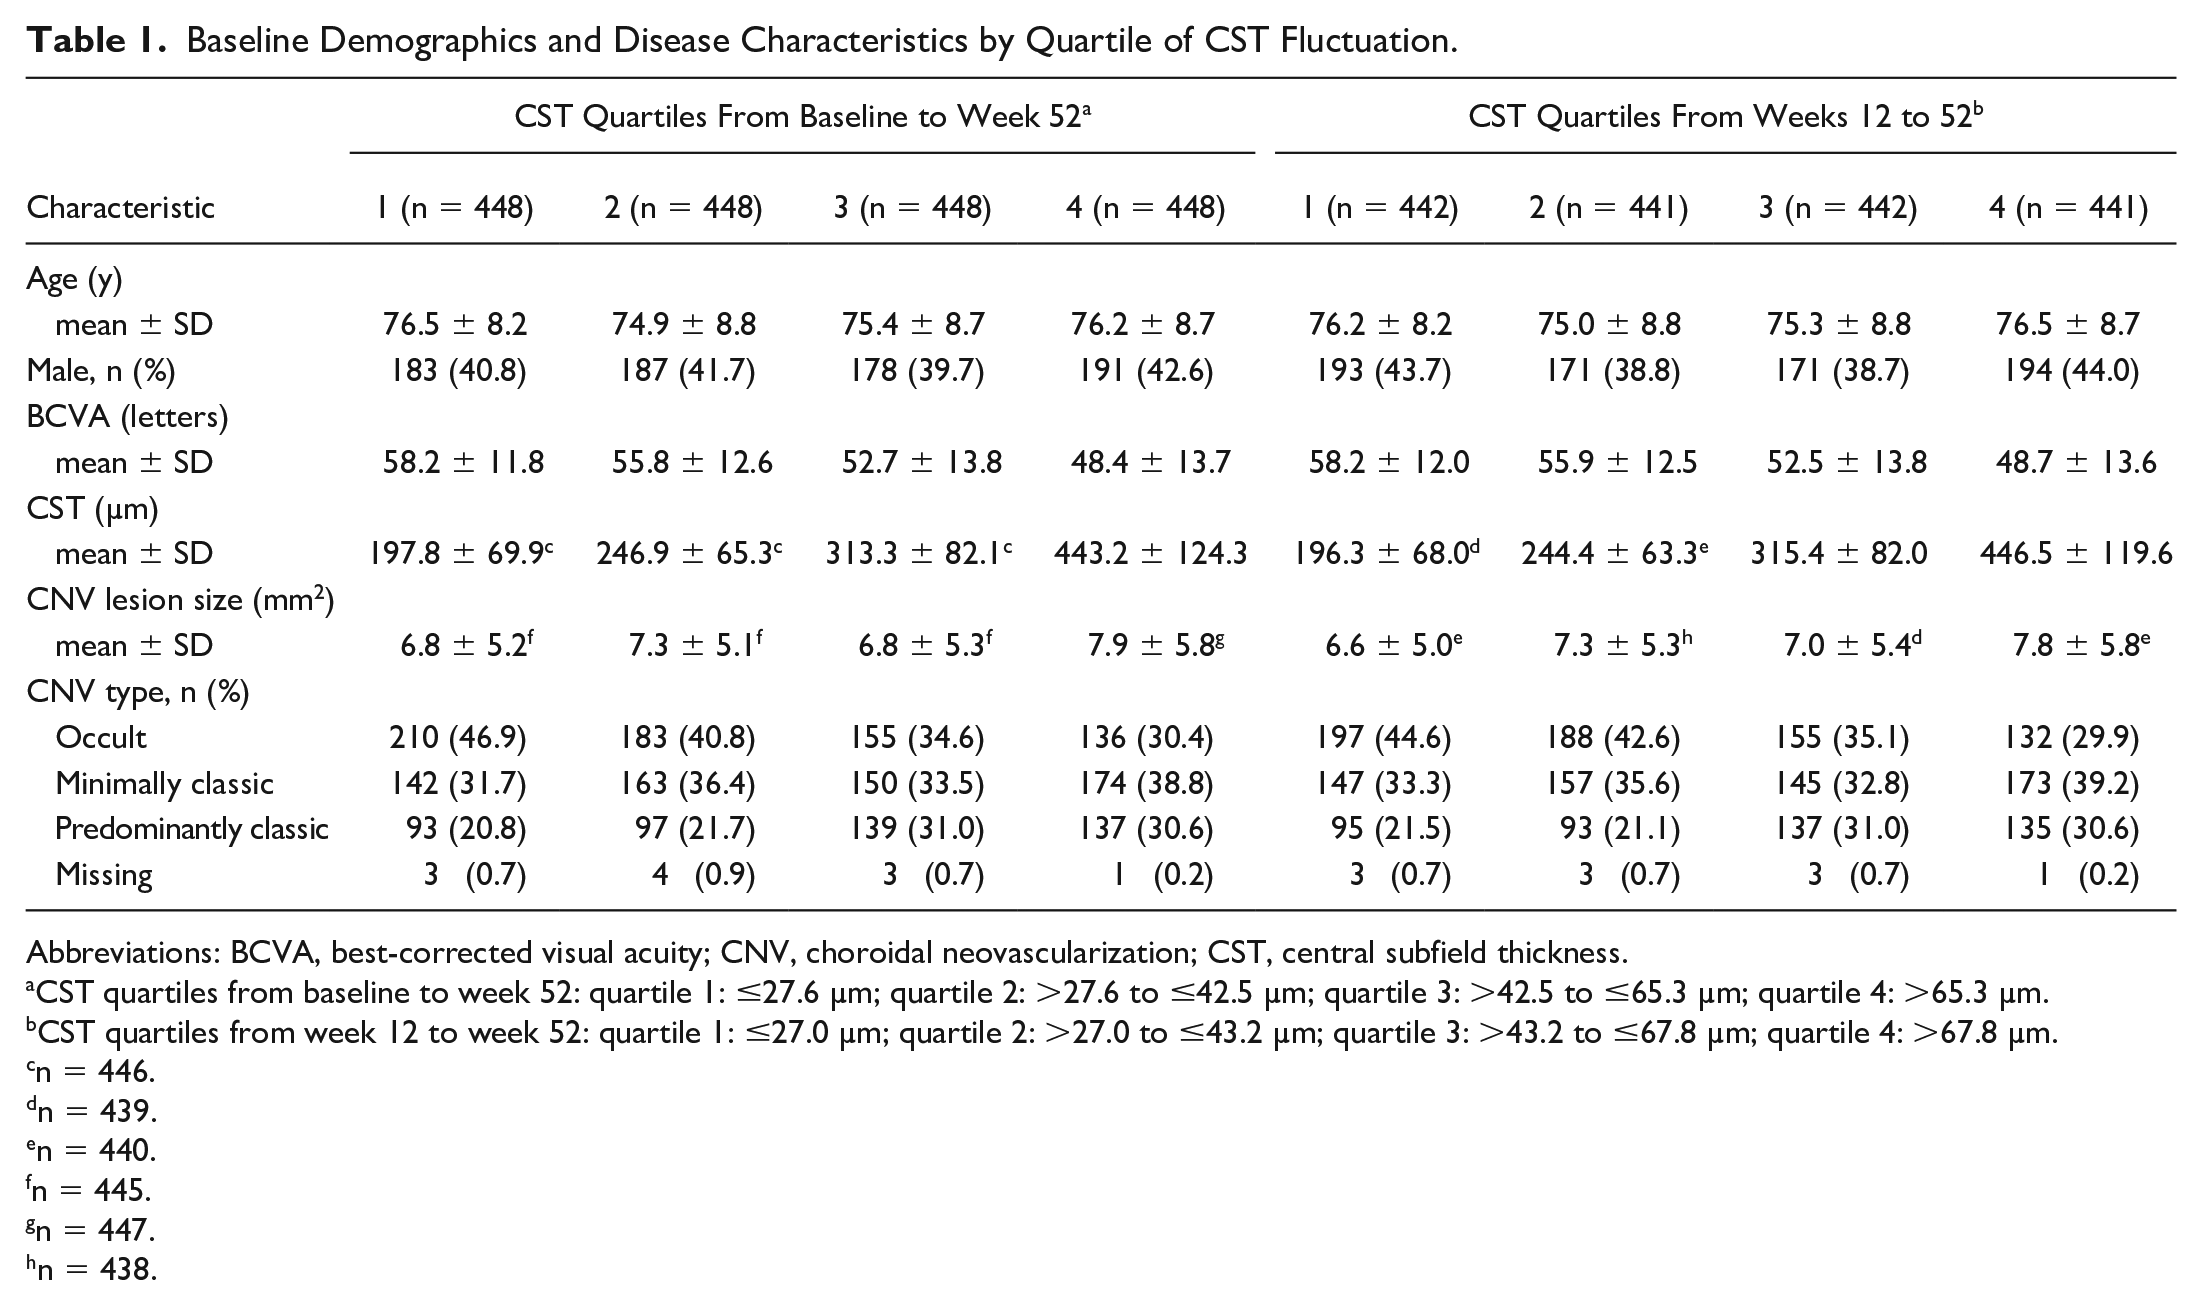
Abbreviations: BCVA, best-corrected visual acuity; CNV, choroidal neovascularization; CST, central subfield thickness.
CST quartiles from baseline to week 52: quartile 1: ≤27.6 µm; quartile 2: >27.6 to ≤42.5 µm; quartile 3: >42.5 to ≤65.3 µm; quartile 4: >65.3 µm.
CST quartiles from week 12 to week 52: quartile 1: ≤27.0 µm; quartile 2: >27.0 to ≤43.2 µm; quartile 3: >43.2 to ≤67.8 µm; quartile 4: >67.8 µm.
n = 446.
n = 439.
n = 440.
n = 445.
n = 447.
n = 438.
BCVA Gains at Week 52 by Quartile of CST Fluctuation
At week 52, least squares mean BCVA gains by quartile of CST fluctuation from baseline to week 52 were 9.6, 10.1, 9.6, and 6.7 letters in quartiles 1, 2, 3, and 4, respectively, with a least squares mean difference (95% CI) between quartile 4 and quartile 1 of −2.9 (−4.8 to −1.1) letters (Figure 2A). Similar visual gains were observed by quartiles of CST fluctuation from weeks 12 to 52, with substantially lower gains in quartile 4 vs quartile 1 (least squares mean difference, −3.1 letters; 95% CI, −5.0 to −1.3; Figure 2B).
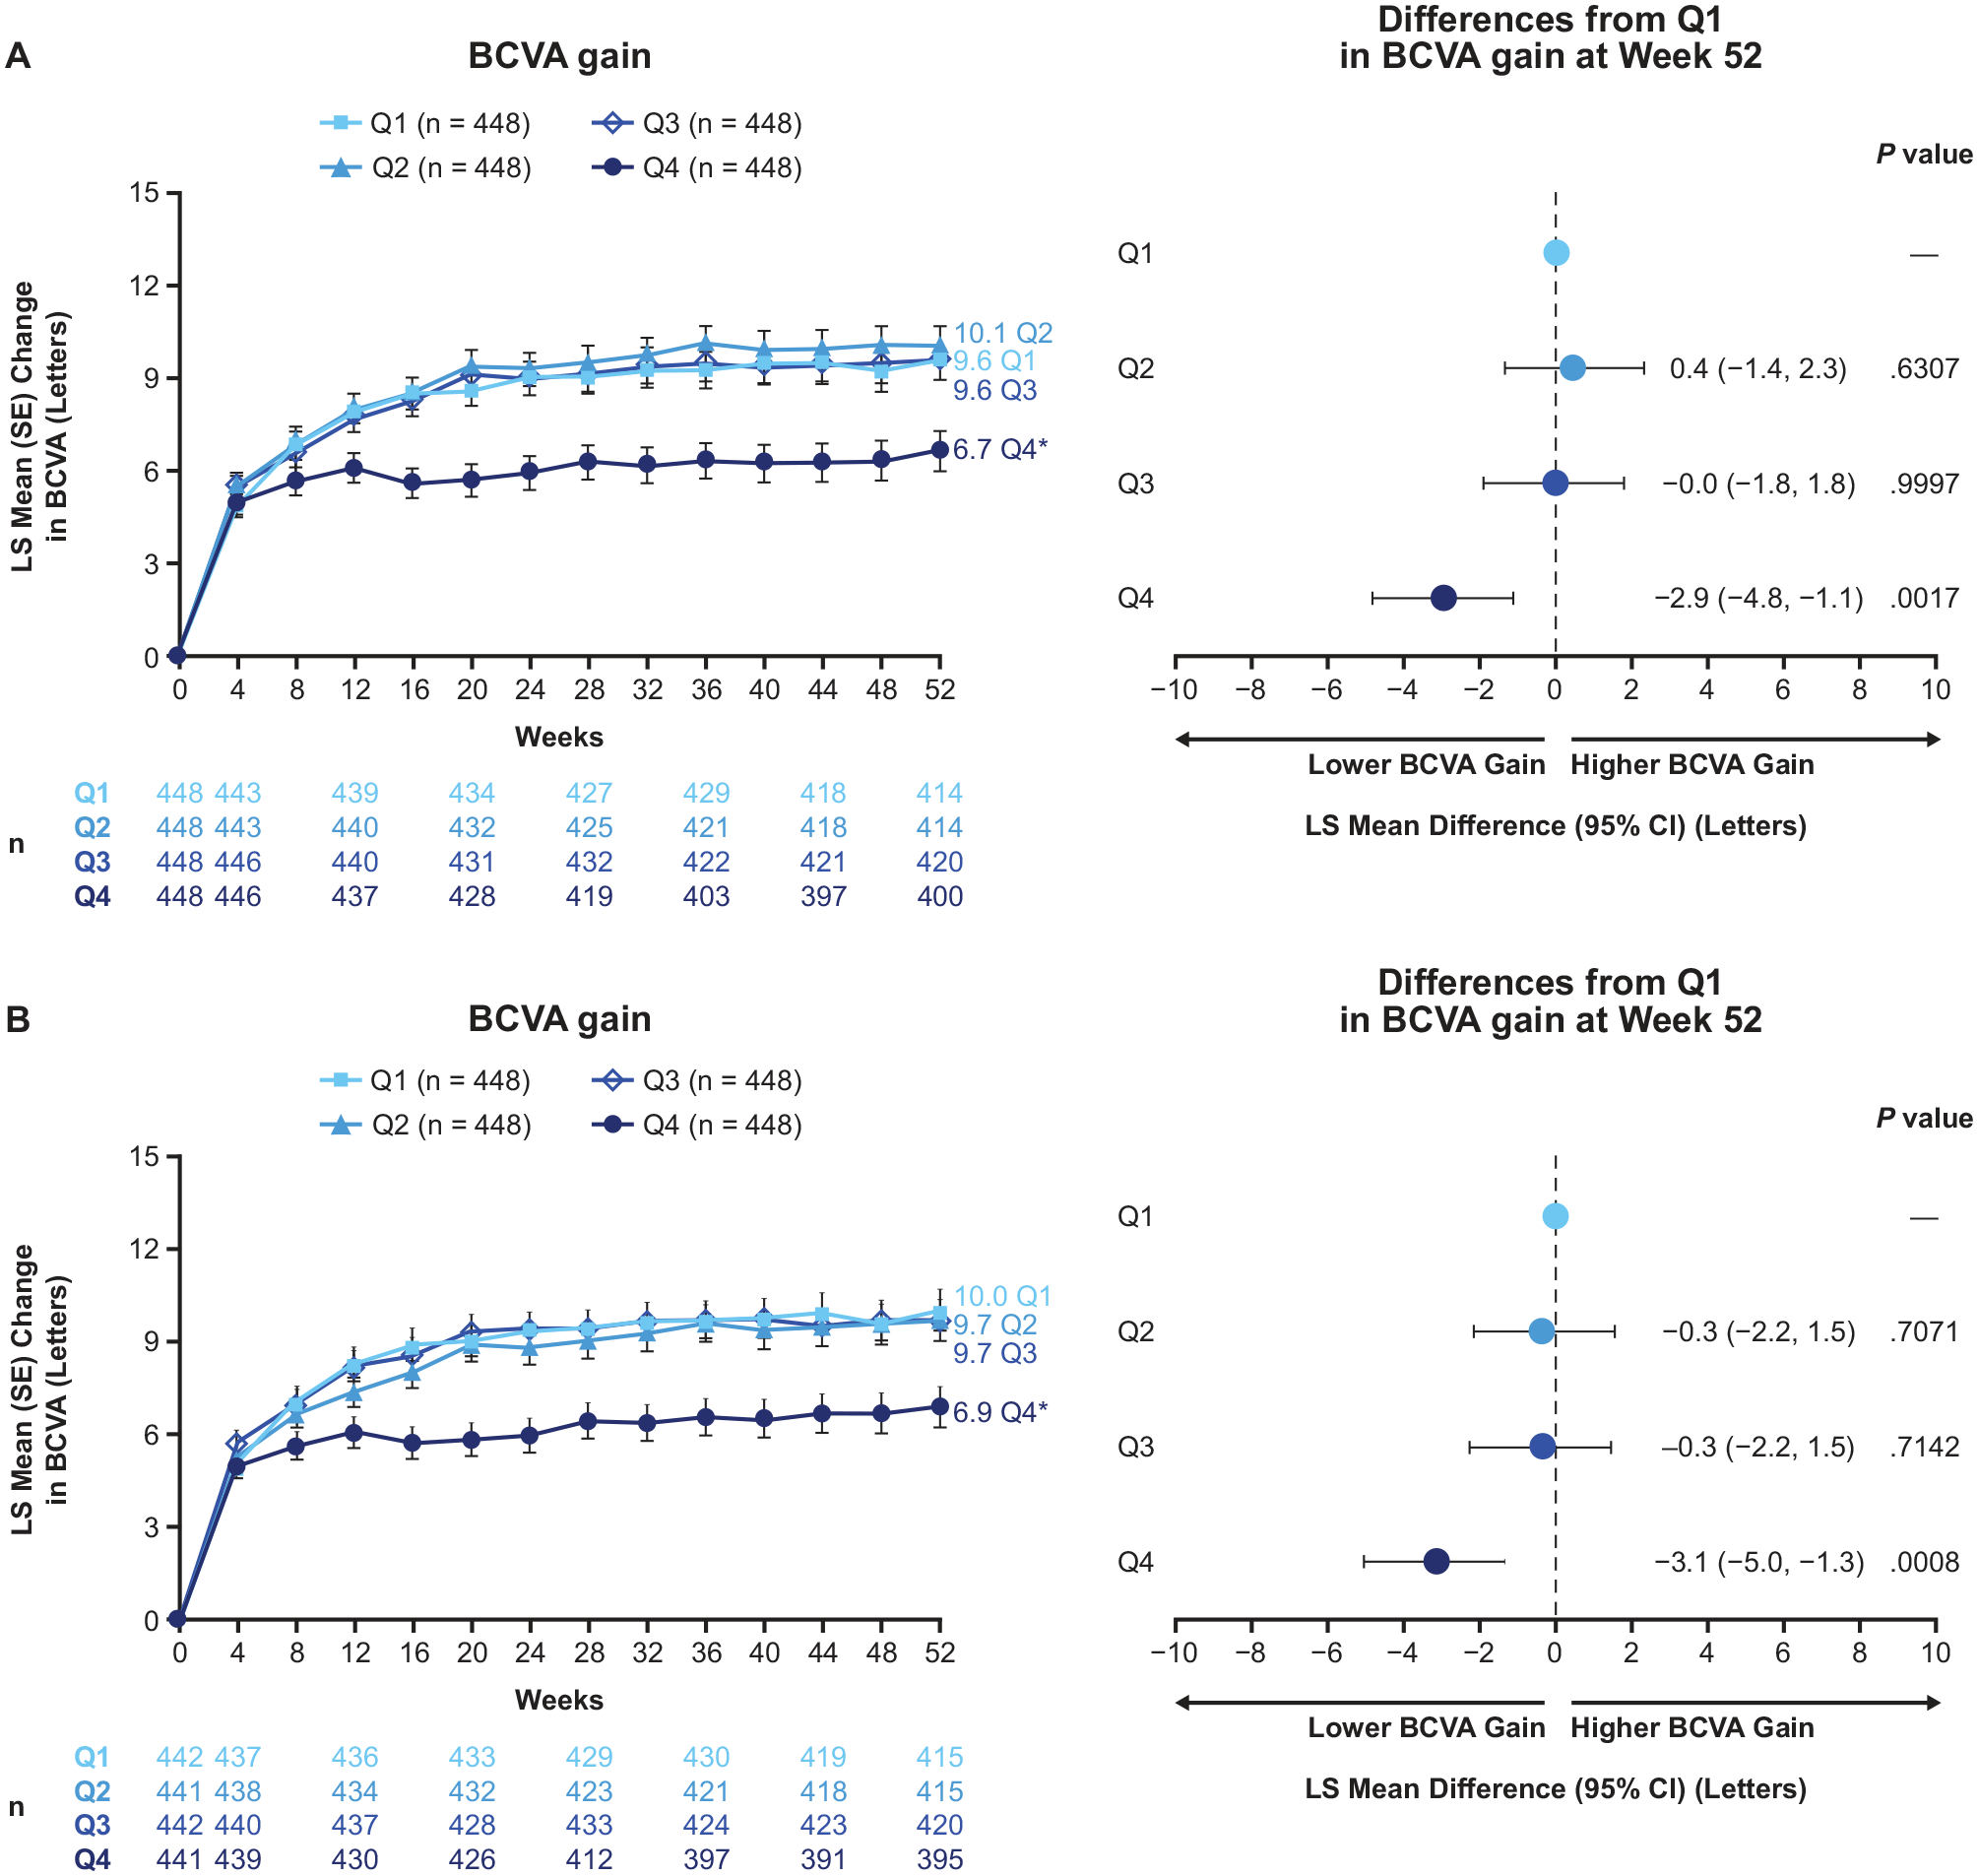
LS mean change from baseline BCVA by quartile of CST fluctuation from baseline to week 52 and weeks 12 to 52. *Nominal P < .05 vs quartile 1. (A) CST quartiles from baseline to week 52: quartile 1: ≤27.6 µm; quartile 2: >27.6 to ≤42.5 µm; quartile 3: >42.5 to ≤65.3 µm; quartile 4: >65.3 µm. (B) CST quartiles from week 12 to week 52: quartile 1: ≤27.0 µm; quartile 2: >27.0 to ≤43.2 µm; quartile 3: >43.2 to ≤67.8 µm; quartile 4: >67.8 µm.
Consistent with these findings, eyes in quartile 4 had markedly lower rates of 5 or more letters gained and markedly higher rates of 5 or more letters lost at week 52 compared with quartile 1 in both analysis periods (baseline to week 52 and week 12-52; both nominal P < .05) (Figure 3, A and B). Additionally, a substantially lower rate of 10 or more letters gained at week 52 was observed in quartile 4 vs quartile 1 when quartiles of CST fluctuation were evaluated from weeks 12 to 52 (nominal P < .05) (Figure 3B).
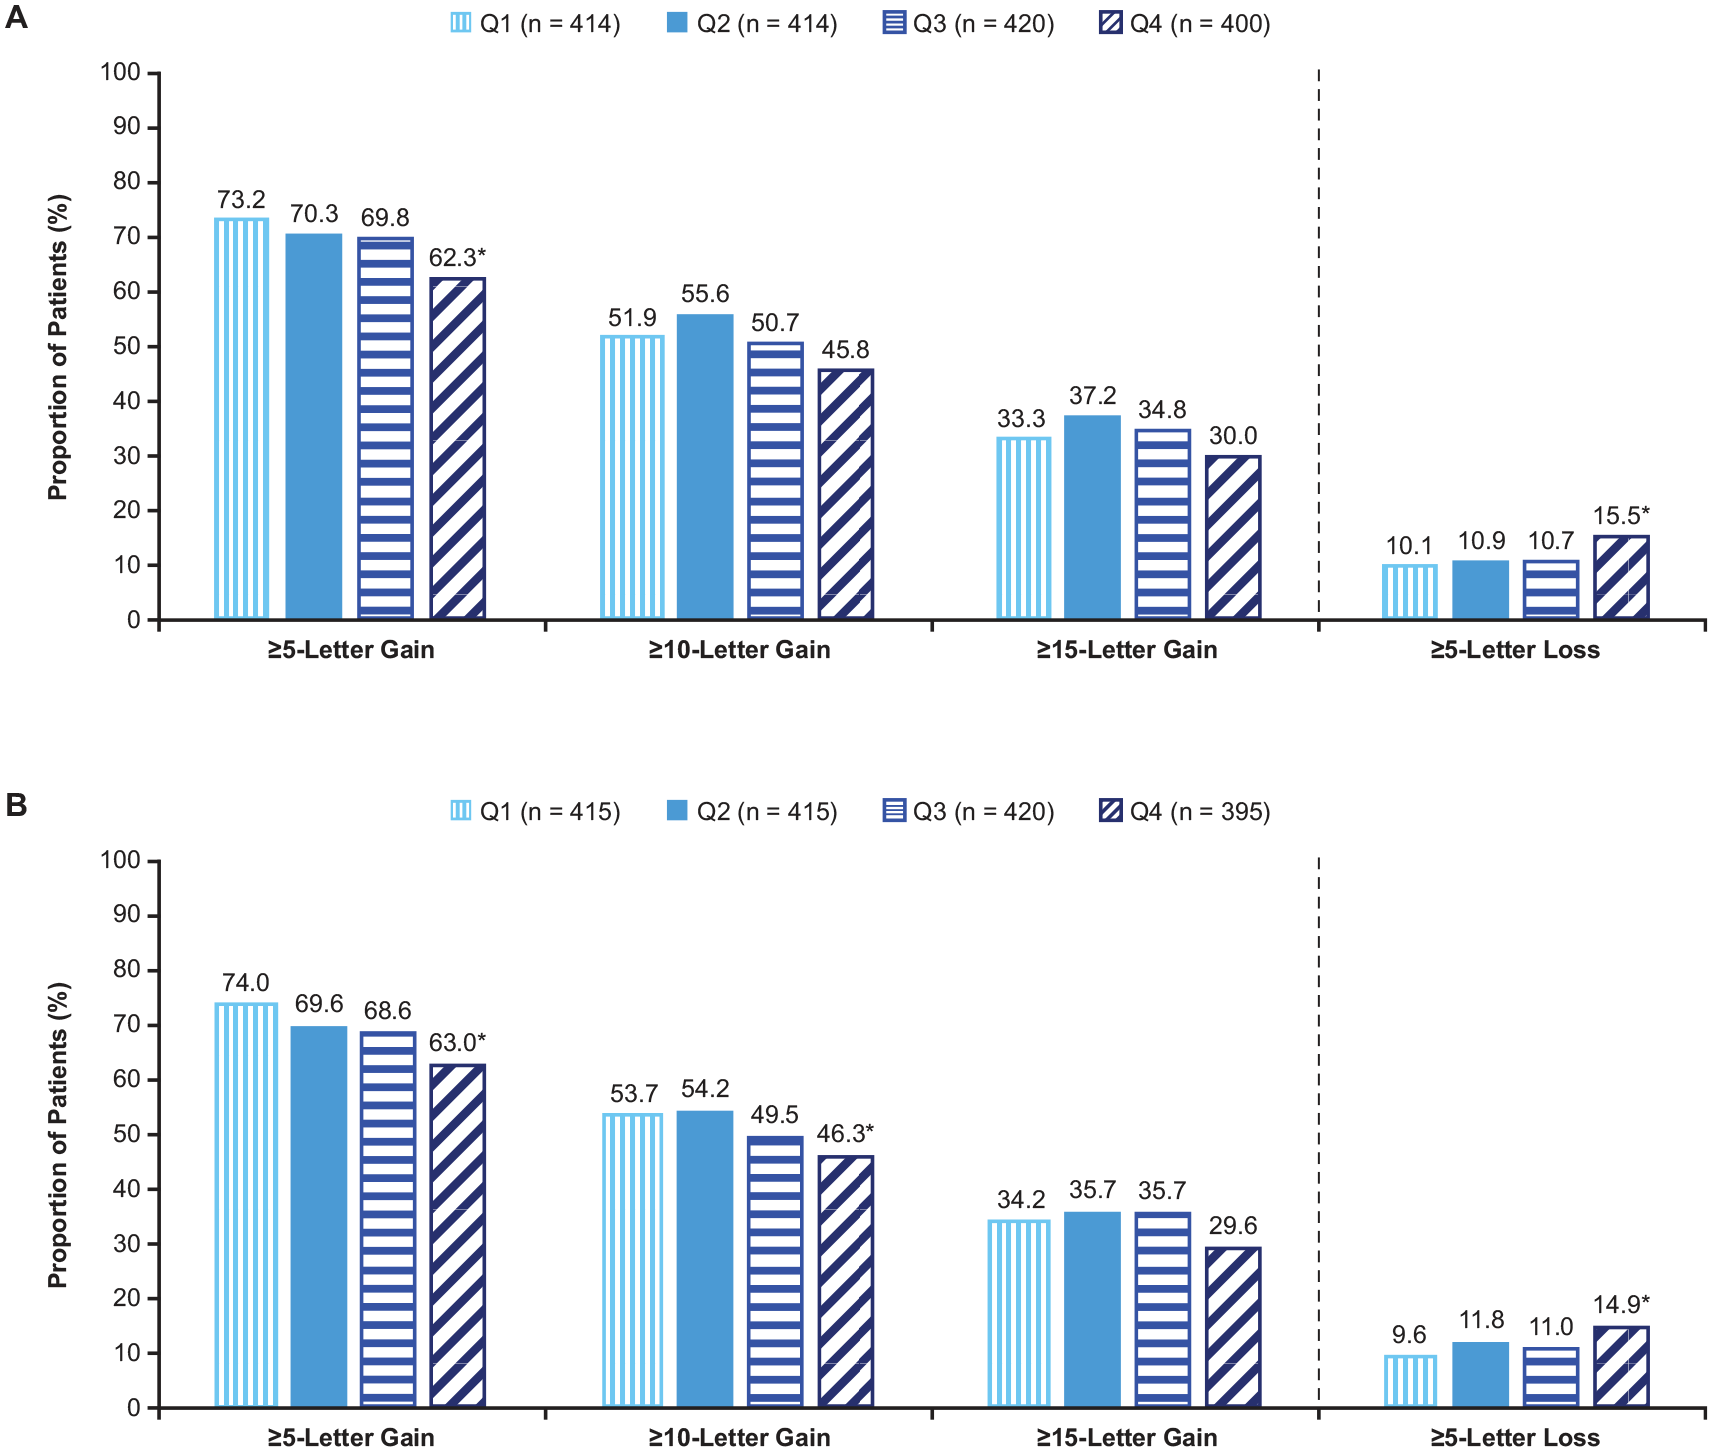
Proportion of eyes that gained or lost vision at week 52 by quartile of central subfield thickness (CST) fluctuation from baseline to week 52 and weeks 12 to 52. *Nominal P < .05 vs quartile 1. (A) CST quartiles from baseline to week 52: quartile 1: ≤27.6 µm; quartile 2: >27.6 to ≤42.5 µm; quartile 3: >42.5 to ≤65.3 µm; quartile 4: >65.3 µm. (B) CST quartiles from week 12 to week 52: quartile 1: ≤27.0 µm; quartile 2: >27.0 to ≤43.2 µm; quartile 3: >43.2 to ≤67.8 µm; quartile 4: >67.8 µm.
BCVA Gains at Week 52 by Treatment Group Within Each Quartile of CST Fluctuation
Least squares mean BCVA gains at week 52 were generally similar across the 2q4, 2q8, and Rq4 treatment groups in quartiles 1, 2, and 3 from baseline to week 52 and weeks 12 to 52 (Figure 4). In quartile 4, visual gains were relatively lower compared with quartile 1 regardless of treatment group. Within quartile 4, patients treated with 2q8 had marginally lower visual gains when compared with those treated with 2q4 or Rq4.
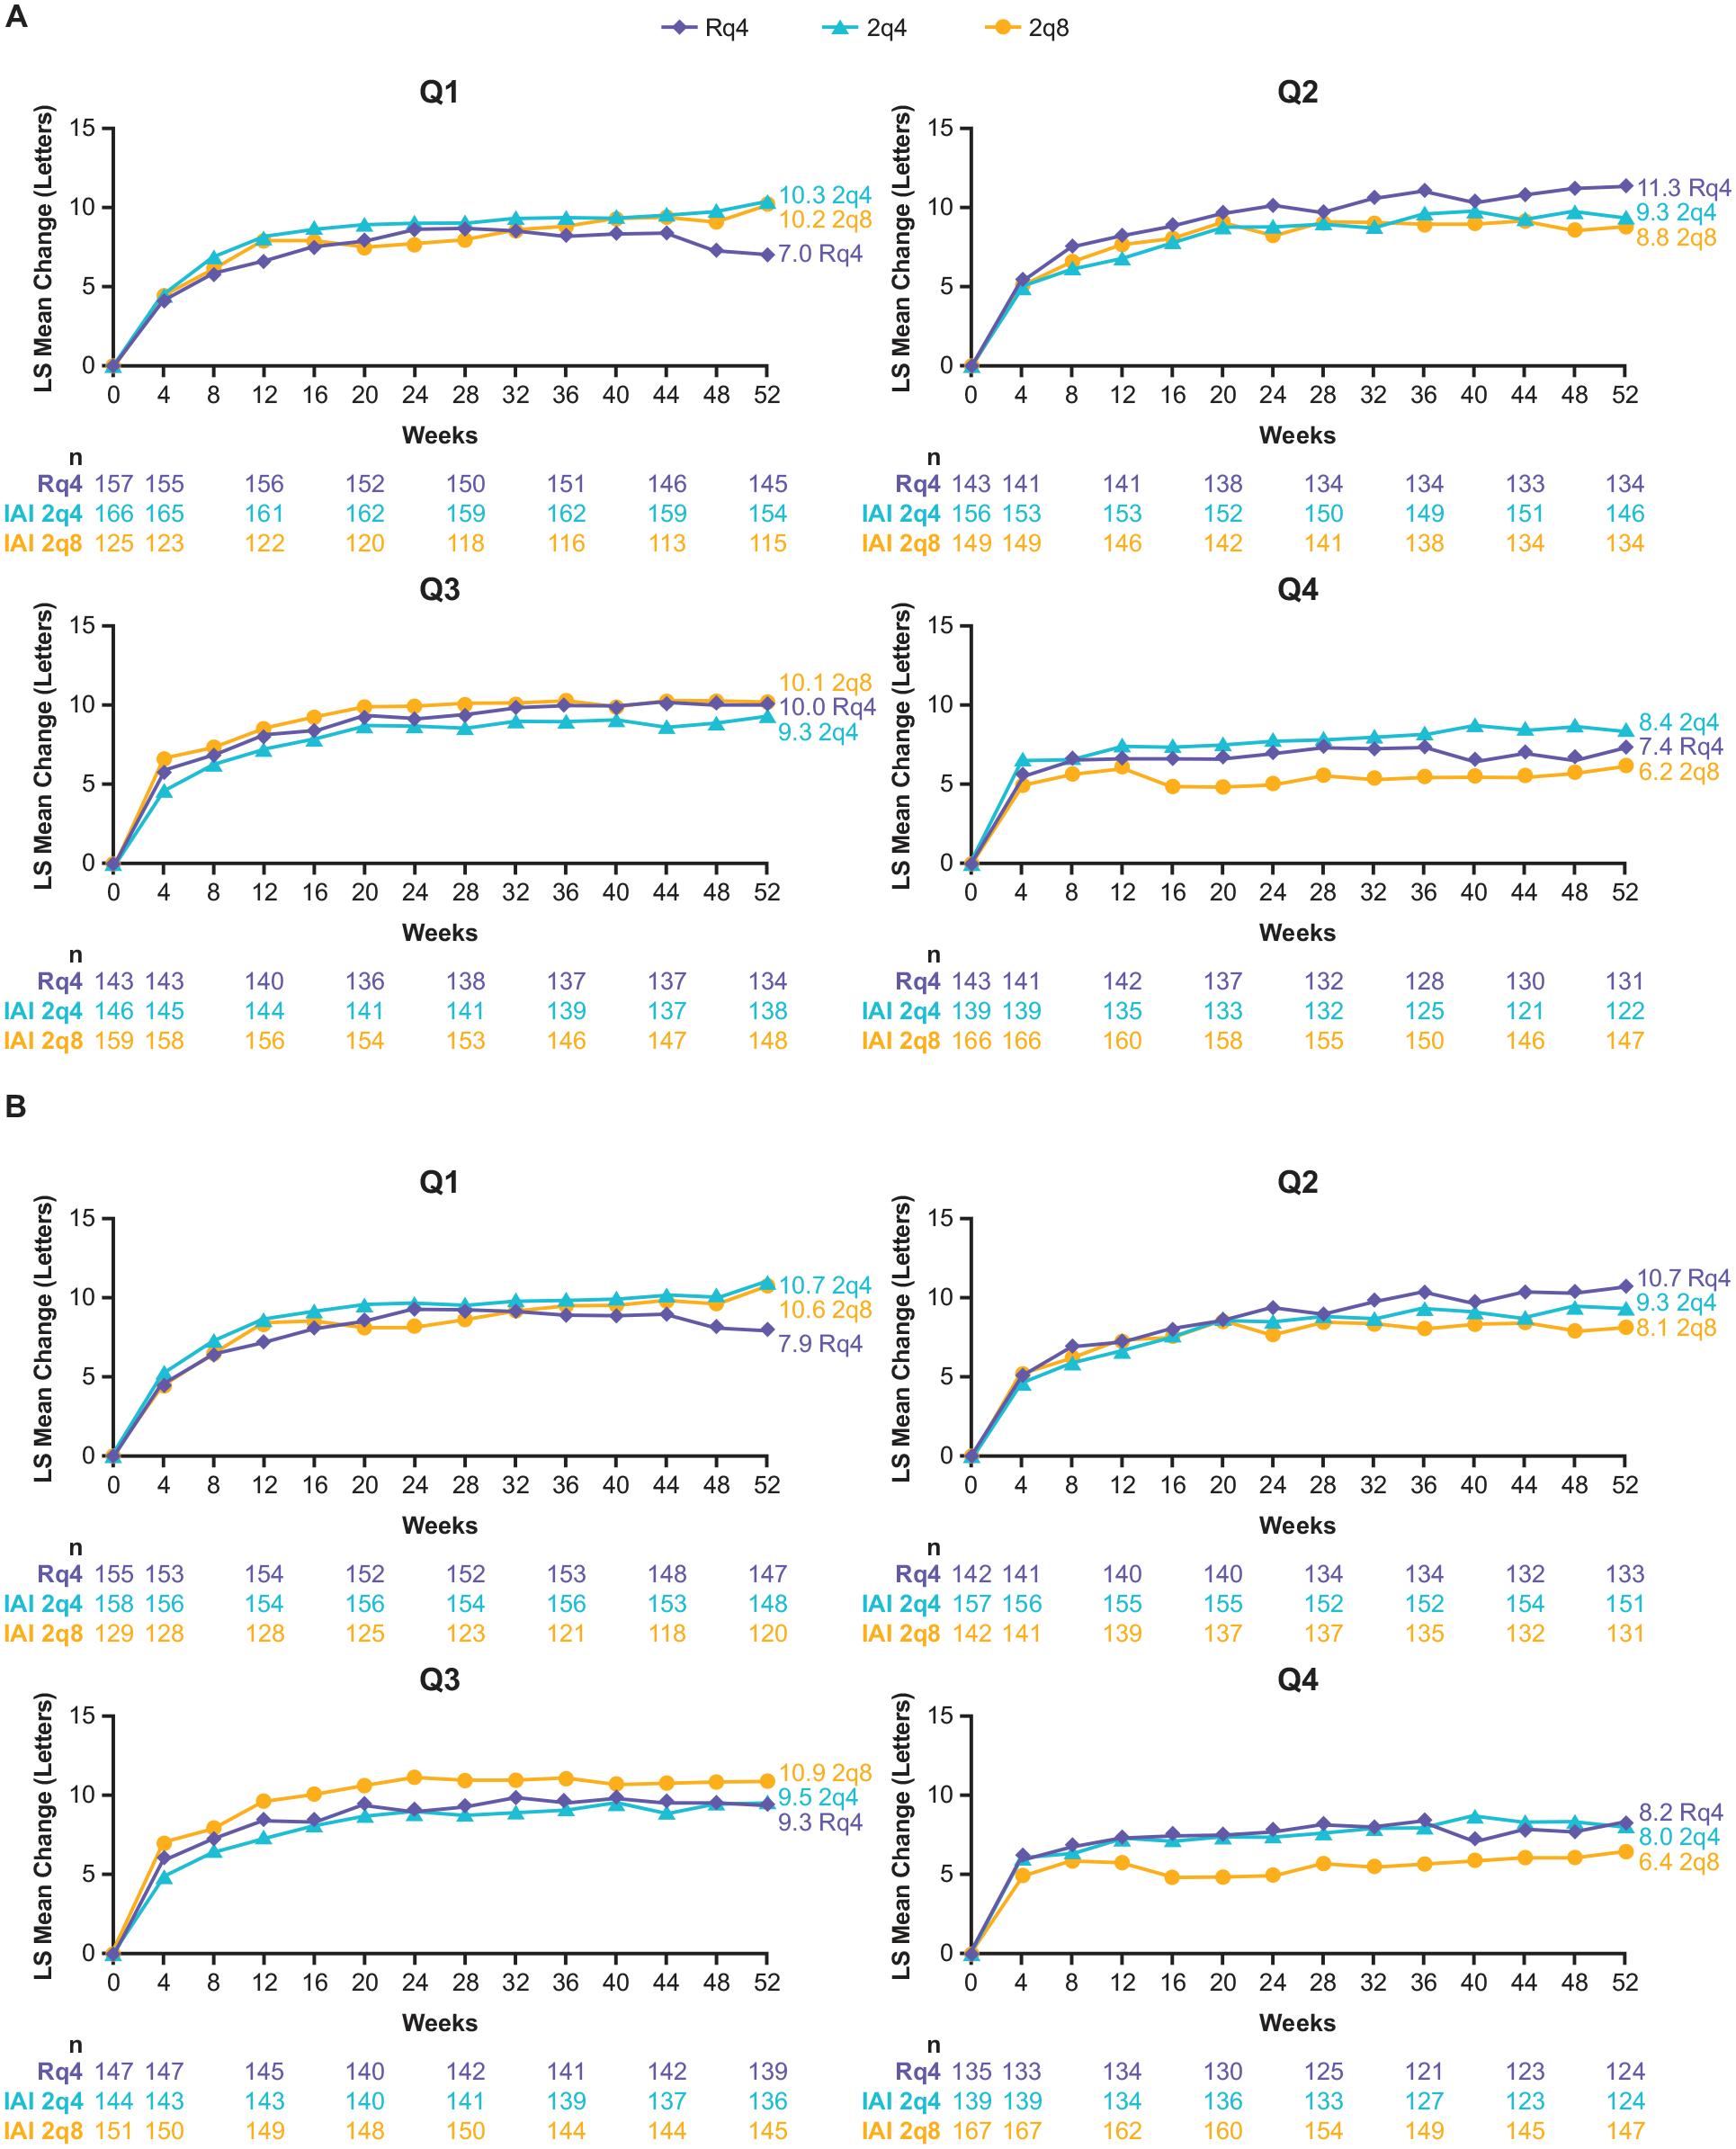
LS mean change from baseline in BCVA by treatment group within each quartile of CST fluctuation from baseline to week 52 and weeks 12 to 52. (A) CST quartiles from baseline to week 52: quartile 1: ≤27.6 µm; quartile 2: >27.6 to ≤42.5 µm; quartile 3: >42.5 to ≤65.3 µm; quartile 4: >65.3 µm. (B) CST quartiles from week 12 to week 52: quartile 1: ≤27.0 µm; quartile 2: >27.0 to ≤43.2 µm; quartile 3: >43.2 to ≤67.8 µm; quartile 4: >67.8 µm.
Conclusions
This post hoc analysis of eyes with nAMD in the VIEW 1 and VIEW 2 trials showed that eyes in the highest quartile of CST fluctuation (quartile 4) during both treatment periods experienced lower mean BCVA gains compared with those in the lowest quartile (quartile 1). Furthermore, the proportion of eyes achieving 5 or more, 10 or more, and 15 or more letters gained at week 52 was consistently lower in quartile 4 than in quartile 1.
Overall, findings from this analysis were consistent with those of previous studies based on clinical trial data and real-world evidence,10 –12 which have demonstrated an association of greater fluctuations in retinal thickness with worse visual outcomes during the course of IVT anti-VEGF treatment for nAMD.7 –9 A post hoc analysis of the HAWK and HARRIER trials also evaluated the relationship between CST variability and visual outcomes during the entire trial period, as well as the period after the initial monthly dosing phase, with a similar rationale for using the latter to ensure a more accurate assessment of inherent CST variability in each patient by reducing the effect of differences in CSTs at baseline. 9 In HAWK and HARRIER, the impact of CST variability was evident starting from quartile 2, with lower gains in BCVA of −1.6, −3.3, and −8.9 letters in quartiles 2, 3, and 4, respectively, compared with quartile 1. 9 The threshold of CST variability affecting gains in BCVA was lower, and the magnitude of impact leading to suboptimal BCVA was greater in HAWK and HARRIER compared with the current study, potentially due to differences in the trial populations (eg, higher baseline BCVA and baseline CST, and lower CNV size in HAWK and HARRIER) and study design (eg, adjustment of dosing intervals based on disease activity was allowed in HAWK and HARRIER).9,13,15
In contrast to previous post hoc analyses that were treatment agnostic,7,9 the present analysis also evaluated the relationship between CST fluctuations and visual outcomes by different anti-VEGF agents (ie, aflibercept and ranibizumab) and treatment frequency (ie, 2q4 and 2q8). In both analysis periods, there was a trend toward increasing proportions of eyes treated with 2q8 from quartile 1 to quartile 4. Patients treated with 2q8 had visual gains similar to 2q4 and Rq4 in all quartiles except quartile 4, where patients treated with 2q8 achieved marginally lower visual gains, suggesting that this subgroup of patients may benefit from more frequent treatment.
Across all quartiles of CST fluctuation evaluated, eyes with the highest CST fluctuations had thicker retinas at baseline, larger CNV lesion size, and a higher proportion of eyes with predominantly and minimally classic CNV lesions. These results suggest that these disease characteristics may be associated with greater disease severity7,16 and, consequently, worse visual outcomes than observed in this analysis. Similar trends were reported in post hoc analyses of the CATT, IVAN, HARBOR, HAWK, and HARRIER trials.7 –9 Large CNV lesions may promote more vascular leakage within the retina and consequently more rapid fluid reaccumulation, thereby increasing CST following anti-VEGF treatment. Additionally, predominantly and minimally classic CNV lesions may exacerbate fluid accumulation given that these CNV lesions may lead to exudation in both the subretinal pigment epithelial and subretinal spaces. 17 Therefore, thicker baseline CST, large CNV lesion size, the presence of minimally classic CNV lesions, and consequently, increased CST fluctuations may contribute to retinal damage that impairs visual function and, potentially, the ability to recover visual function with treatment. Indeed, increasing CNV lesion size has been associated with lower visual improvements in several trials, including CATT, VIEW 1, and VIEW 2.18 –20
Limitations of this analysis include its exploratory post hoc nature. The VIEW 1 and VIEW 2 trials were not designed to prospectively assess the impact of CST fluctuations on visual outcomes in eyes with nAMD treated with IVT aflibercept or ranibizumab injections. Therefore, the results presented here should be interpreted with caution. Although this analysis controlled for baseline BCVA and CNV lesion size, other underlying morphologic and clinical factors, including CNV type, were not controlled for and therefore may have contributed to final visual outcomes. This study also did not evaluate retinal fluid compartments; their impact on outcomes could therefore not be assessed. Features associated with permanent retinal tissue loss and irreversible vision impairment, such as fibrosis or atrophy, were not assessed in this analysis. 6 Despite these limitations, this analysis was conducted using data from 2 randomized, controlled trials with a large patient population that was followed prospectively with standardized BCVA assessments and standardized image collection and interpretation by masked readers, 6 supporting a robust assessment of the relationship between CST fluctuations and visual outcomes.
In summary, this post hoc analysis of the VIEW 1 and VIEW 2 trials in eyes with nAMD treated with IVT aflibercept and ranibizumab showed that visual outcomes were comparable among all treatment groups in the majority of eyes. However, eyes with the highest CST fluctuations were associated with worse visual outcomes, with more frequent treatments (every 4 weeks) resulting in marginally better BCVA outcomes than treatment every 8 weeks in this subgroup of patients. Eyes with larger CNV lesions or predominantly or minimally classic CNV with increased CST at baseline may require close monitoring, given that they may be more likely to experience higher CST fluctuations than eyes without these disease characteristics. They may also require more frequent treatment. Further studies are warranted to better understand the relationship between key disease characteristics, CST fluctuations, and visual outcomes.
Supplemental Material
sj-docx-1-vrd-10.1177_24741264251359902 – Supplemental material for Impact of Central Subfield Thickness Fluctuations on Visual Outcomes in Neovascular Age-Related Macular Degeneration in the VIEW Trials
Supplemental material, sj-docx-1-vrd-10.1177_24741264251359902 for Impact of Central Subfield Thickness Fluctuations on Visual Outcomes in Neovascular Age-Related Macular Degeneration in the VIEW Trials by Dilsher S. Dhoot, Chirag P. Shah, Fabiana Q. Silva, April J. McCullough, Weiming Du, Hadi Moini and Peter K. Kaiser in Journal of VitreoRetinal Diseases
Footnotes
Acknowledgements
Medical writing assistance was provided by Kaitlyn Scacalossi, PhD, Anil Sindhurakar, PhD, and Stephanie Agbu, PhD, of Regeneron Pharmaceuticals, Inc. Editorial support was provided by Isobel Markham, MSc, of Core (a division of Prime, London, UK) and was funded by Regeneron Pharmaceuticals, Inc., according to Good Publication Practice guidelines.
Ethical Approval
Patients in VIEW 1 were randomized at 154 sites in the United States, and in VIEW 2, at 172 sites in Europe, the Middle East, Asia-Pacific, and Latin America. The study protocols were approved at each participating clinical site by the institutional review board or ethics committee in accordance with the Declaration of Helsinki.
Statement of Informed Consent
All patients provided written informed consent.
Data Availability Statement
Qualified researchers may request access to study documents (including the clinical study report, study protocol with any amendments, blank case report form, statistical analysis plan) that support the methods and findings reported in this manuscript. Individual anonymized participant data will be considered for sharing (1) once the product and indication has been approved by major health authorities (eg, the US Food and Drug Administration, European Medicines Agency, Pharmaceuticals and Medical Devices Agency, etc) or development of the product has been discontinued globally for all indications on or after April 2020, and there are no plans for future development; (2) if there is legal authority to share the data; and (3) if there is no reasonable likelihood of participant reidentification. Submit requests at ![]() .
.
Declaration of Conflicting Interests
The author(s) declared the following potential conflicts of interest with respect to the research, authorship, and/or publication of this article: Dr. Dhoot is a consultant for Alimera, Allergan, Apellis, Bayer, Coherus, EyePoint Pharmaceuticals, Genentech, Novartis, Ocular Therapeutix, Oxular, Regeneron Pharmaceuticals, Inc., and Regenxbio. Drs. Silva, McCullough, Du, and Moini are employees and stockholders of Regeneron Pharmaceuticals, Inc. Dr. Shah is a consultant and subinvestigator on clinical trials sponsored by Genentech and Regeneron Pharmaceuticals, Inc. Dr. Kaiser is a consultant for Alcon, Allergan, Bausch + Lomb, Bayer, Biogen Idec, Boehringer Ingelheim, Carl Zeiss Meditec, Coherus, Genentech/Roche, Kanghong, Kodiak, Novartis, Ocular Therapeutix, Regeneron Pharmaceuticals, Inc., Regenxbio, Samsung Bioepis, and 4D Molecular Therapeutics.
Funding
The author(s) disclosed receipt of the following financial support for the research, authorship, and/or publication of this article: This study was supported by Regeneron Pharmaceuticals, Inc. The sponsor participated in the design and conduct of the study, analysis of the data, and preparation of this manuscript.
Supplemental Material
Supplemental material is available online with this article.
References
Supplementary Material
Please find the following supplemental material available below.
For Open Access articles published under a Creative Commons License, all supplemental material carries the same license as the article it is associated with.
For non-Open Access articles published, all supplemental material carries a non-exclusive license, and permission requests for re-use of supplemental material or any part of supplemental material shall be sent directly to the copyright owner as specified in the copyright notice associated with the article.